Abstract
High-pressure processing (HPP) can be used as a nonthermal pasteurization technique to overcome microbial safety issues of the raw ewes’ milk Serra da Estrela cheese without negatively influencing its quality, in particular, the lipid composition partly responsible for Serra da Estrela cheese’s sensorial and textural attributes. The aim of this work was to assess HPP’s effect (600 MPa/6 min and 450 MPa/6 and 9 min) on the qualitative and quantitative lipid profiles of Serra da Estrela cheese during 15 months of refrigerated storage. Total triglycerides content (65–66 g TG/100 g) was similarly determined for HPP-treated (450 MPa/6 min) and control cheeses. Similar total contents of saturated, monounsaturated, and polyunsaturated fatty acids were reported for all cheeses during storage. A high total conjugated linoleic acid content (1.29–1.65 g FA/100 g fat) was quantified in all cheeses during storage; all cheeses revealed similar atherogenic and thrombogenic indices (~2.3 and ~2.6, respectively). HPP can be used to process Serra da Estrela cheese at conditions that assure microbial safety without influencing cheese lipid profiles.
1. Introduction
One of the most famous traditional raw milk Portuguese cheeses is Serra da Estrela cheese, which has Protected Designation of Origin (PDO) certification in the European Union. This cheese is manufactured using only raw ewes’ milk, Cynara cardunculus L. (as coagulant), and salt. The milk used must be from specific ewe breeds (Bordaleira and/or Churra Mondegueira da Serra da Estrela), which live in specific geoclimatic conditions of the PDO region rich in natural pastures. The raw milk is processed daily according to strict PDO indications for cheese production, followed by ripening, resulting in a cheese with unique organoleptic characteristics [1]. During ripening, several complex biochemical events occur due to milk microbiota and enzymes’ action on lactose, lipids, and proteins, with these having a great impact on cheese characteristics [2,3].
Lipolysis is an important biochemical process in cheese, with the lipid fraction and the primary products of its degradation, i.e., free volatile fatty acids, playing a crucial role in the development of the distinctive aroma characteristics of Serra da Estrela cheese [4]. There are several studies on lipolysis in Serra da Estrela cheese during ripening [4,5,6,7], yet the lipolysis phenomenon may continue over the storage period (i.e., during transportation and commercialization), particularly in the case of extended storage. More recently, the 33 d ripened Serra da Estrela cheese fatty acids profile and health-related lipid indices from 5 different geographical locations of the PDO region were described by Lima et al. (2019) [8].
High-pressure processing (HPP) is being increasingly applied and studied as a nonthermal alternative process to the conventional heat-based pasteurization processes used for dairy foods, including cheese, registering minimal deleterious effects on quality and a shelf-life extension up to 2–3-fold higher than the non-pasteurized counterparts [9]. However, the effects of HPP on cheese are dependent on the pressure intensity applied, the holding time used, and the ripening stage [10,11]. Only three studies were found that focused on the effect of HPP on lipolytic features during storage of raw cows’ and ewes’ milk cheeses [12,13,14]. Two studies were performed with Casar cheese (raw ewes’ milk), and the authors reported results for the total amount of short- (SC-FFAs), medium- (MC-FFAs), and long-chain fatty acids (LC-FFAs) [12,13]. When cheeses were HPP treated (200 MPa and 600 MPa for 5 min and 20 min) at 60 days of ripening, the FFAs levels tended to increase during 240 days of refrigerated storage, but without significant differences among HPP and control cheeses [13]. On the other hand, HPP treatment (400 MPa and 600 MPa for 5 min and 20 min) at 14 and 21 days of ripening in cows’ milk cheeses had significantly lower influence on SC-FFAs, MC-FFAs, and LC-FFAs levels [14].
In general, the effects of HPP on cheese characteristics are dependent on the pressure level applied, the length of treatment, and particularly the stage of ripening at which HPP was applied. For example, to enable the safe storage of Serra da Estrela cheese under refrigeration over a prolonged period of 15 months without modification of its sensory attributes, HPP (450 MPa or 600 MPa for 6 min or 9 min) was applied and its impacts on the cheese properties were assessed [11]. HPP also deaccelerated proteolysis and had little effect on texture parameters and sensorial attributes [10,11]. However, since some of these changes (especially sensorial attributes) may be related to the lipids state and associated lipolysis extension in cheese, it is important and pertinent to study the effect of HPP on the qualitative and quantitative lipid profiles of cheese immediately after processing and throughout subsequent storage. To the best of the authors’ knowledge, this effect has only been evaluated based on the measurement of free fatty acids (FFAs) and primarily only during the ripening of HPP-processed cheeses and not during subsequent storage [15,16,17,18,19]. Furthermore, to the best of our knowledge, no previous studies have performed such in-depth scientific work on lipid fractions, and also no data are available on the impact of HPP on the free/non-esterified fatty acids profile (NEFAs) of raw ewes’ milk cheeses.
The aim of the present work was, therefore, to study the possible effects of HPP on triglycerides, fatty acids (esterified and non-esterified), and conjugated linoleic acid (CLA) composition of raw ewes’ milk PDO Serra da Estrela cheese, immediately after processing and during subsequent storage under refrigeration for 15 months.
2. Materials and Methods
2.1. Cheese Manufacture and High-Pressure Processing
Serra da Estrela cheeses were manufactured from 150 L of raw ewes’ milk distributed between 2 batches of cheese (given the limited production capacity of the Dairy Farm located in Serra da Estrela PDO region, Portugal) that were produced, one in the morning and the other in the afternoon, according to the PDO practices [1]. A total of 56 cheeses (of about 500 g each) were ripened at the dairy for 45 days, followed by HPP treatment of either 6 min at 600 MPa (P1), 6 min at 450 MPa (P2), or 9 min at 450 MPa (P3), in a 55 L capacity industrial scale high-pressure equipment (model 55, Hiperbaric, Burgos, Spain). Cheeses not submitted to HPP (ChC) were used as controls, and all cheeses were stored under refrigeration (4 °C). The lipid profile of the different cheese samples was analyzed just after HPP (0 months of storage) and after 6 and 15 months of storage. At each of these sampling dates, homogenized cheese samples (without rind) of about 50 g each were taken and frozen at −80 °C until chemical analysis.
2.2. Chemicals
All solvents used in the present work (hexane, methanol, dichloromethane (DCM), dimethylformamide (DMF), and methyl tert-butyl ether (MTBE)) were HPLC grade and purchased at LABSCAN (Dublin, Ireland). Sulphuric acid was analytical grade (VWR Scientific, Carnaxide, Portugal). Supelco 37 fatty acids methyl esters (FAMEs) mix, methyl tricosanoate (99%; FAME-C23), undecanoic acid (99.9%; FFA C11), tritridecanoin (99%; C13), trinonanoin (99%; TG C27), and sodium methoxide (MetNa; 95%) were obtained from Sigma (Sigma-Aldrich, St. Louis, MO, USA); GLC-Nestle′36 FAME mix and tritridecanoin (99%), and CLA standards from Nu-Chek Prep were from Nu-Chek Prep, Inc. (Elysian, MN, USA). Undecanoic acid (99%; C11; ALFA AESAR, Karlsruhe, Germany) was obtained from VWR (Carnaxide, Portugal). All analyses were performed using 14 mL borosilicate glass tubes (16 mm × 125 mm) with acid/heat resistant caps (VWR international, Carnaxide, Portugal).
2.3. Lipid Extraction
The lipid fraction extraction was performed with MTBE, according to Matyash et al. [20], with some modifications. Methanol (1.5 mL) and MTBE (5.0 mL) were added to 200 mg of lyophilized cheese into a glass tube with Teflon-lined cap and the tube was vortexed (1 min). Then, the mixture was incubated for 1 h at room temperature (18–22 °C) in a roller stirrer. Ultra-pure water (1.25 mL) was added, and the mixture was left for 10 min at room temperature for phase separation to occur, followed by centrifugation at 1000× g for 10 min. The upper phase was then collected, and the lower phase was re-extracted alike with 2 mL of the solvent mixture (obtained by mixing MTBE/methanol/water 10:3:2.5, v/v/v). The combined organic phases were dried in a multi-channel nitrogen system and the dried extracted lipids were weighted and dissolved in 1 mL of dichloromethane for storage. The lipid fraction extractions were conducted in duplicate.
2.4. Triglycerides Determination
The cheese sample (25 mg) was weighted into a vial with 200 μL TG-C9 (1.52 mg/mL) and 800 μL DCM. Upon preparation, the samples were analyzed using a CLARUS 500 gas chromatograph (PerkinElmer, Waltham, MA, USA) equipped with FID detector and a Rtx-65TG column (30 m × 0.25 mm × 0.10 μm; Restek Corporation, Bellefonte, PA, USA). Analysis conditions were as described by Castro-Gómez et al. [21]. The oven program was 120 °C held for 30 s, 10 °C/min to 220 °C held for 30 s, and 6 °C/min to 350 °C held for 30 min. Injector and FID temperatures were 355 °C and 370 °C, respectively. Helium was used as the carrier gas at 25 psi, and the injection volume was 0.5 μL.
2.5. Methyl Esters Fatty Acids Preparation
The preparation of methyl esters was performed according to Pimentel et al. [22], obtaining two fractions: the esterified fatty acids (EFAs) and the non-esterified fatty acids (NEFAs) fractions. For quantitative purposes, 3 internal standards were used: a triacylglycerol (tritridecanoin–C13; 1.36 mg/mL to calculate the concentration of EFAs), a free fatty acid (undecanoic acid–C11; 0.68 mg/mL to calculate NEFAs), and a FAME (methyl tricosanoate–FAME-C23; 0.66 mg/mL to control isolation of FAMEs and cross-contamination). Briefly, 20 mg of the sample was weighted into a glass tube and standards were added −400 μL TG C13 and 200 μL FFA C11. Then, 100 μL of MetAc 3.4 mL of hexane and 2.46 mL of methanol were added and mixed. Subsequently, 240 μL of MetNa was added. The tubes were shaken for 10 s using a vortex and placed in a heating block at 40 °C for 10 min. After this, 500 μL of H2O were added to each of the tubes and they were once again vortexed for 10 s. The samples were centrifuged at 1250× g for 5 min. The upper layer was collected and transferred into a new tube where 400 μL of FAME C23 had been previously added. Two mL of hexane were added to what remained in the glass tube and the procedure was repeated akin. The collected phases contained the esterified fatty acids. To obtain the non-esterified fatty acids, a second reaction was carried out by adding 100 μL of FAME C23, 1.25 mL of DMF, and then 1.25 mL of H2SO4/MetOH (3M). This reaction mixture was then placed in a heating block at 60 °C for 30 min. After cooling down, 700 µL of hexane was added. The sample was vortexed for 1 min and centrifuged at 1250× g for 5 min and the upper phase was collected into a vial.
2.6. Fatty Acids Identification and Quantification
For the analysis of esterified fatty acids methyl esters (EFAMEs) and non-esterified fatty acids methyl esters (NEFAMEs) fractions of cheese samples, a 120 m × 0.25 mm × 0.25 mm BPX70 column (SGE Europe Ltd., Courtaboeuf, France) was installed in an HP6890 gas chromatograph. Conditions were split 10:1, injection volume 1 µL, injector temperature 250 °C, detector (FID) temperature 290 °C, carrier pressure (Hydrogen) 30 psi, while the oven program was as follows: 70 °C hold 1 min, 7 °C/min to 170 °C (hold 41 min), and 5 °C/min to 23 °C (hold 17 min). Fatty acids were identified by comparing their retention times with the fatty acid methyl standards Supelco 37. GLC-Nestlé36 was assayed for the calculation of response factors. All the preparations and analyses were performed in triplicate.
2.7. Nutritional Quality Indices of Lipids
The atherogenicity and thrombogenicity indices were calculated according to Ulbricht et al. [23]. Concerning the atherogenicity index, which indicates the relationship between the sum of the main saturated fatty acids and that of the main classes of unsaturated fatty acids—the former being considered pro-atherogenic (favor the adhesion of lipids to the immunological and circulatory systems cells) and the latter anti-atherogenic (inhibit the aggregation of plaque and diminish the levels of esterified fatty acids, cholesterol, and phospholipids, thus preventing the appearance of micro- and macrocoronary diseases)—C14:0 is considered to be 4 times more atherogenic than other FAs (hence, it is assigned the coefficient ‘4’). In this regard, the following equation was applied:
The ratio of C14, C16, and C18 (pro-thrombogenic) to USFAs (anti-thrombogenic) is described as the index of thrombogenicity (IT); n − 6 and remaining monounsaturated FAs are assigned coefficients of 0.5 because they are less anti-atherogenic than the n − 3 FA, which is assigned a coefficient of 3. This index refers to the tendency for clot formation in the blood vessels. The IT value was measured by the following equation:
2.8. Conjugated Linoleic Acid Determination
Separation of CLA as a FAME was performed as previously described by Rodríguez-Alcalá et al. [24]. HPLC (Waters Alliance, Series 600, Mildford, MA, USA) equipped with a UV detector (Waters 996 PDA) at 233 nm and a Chrom-Spher 5 Lipid analytical column (4.6 mm i.d. × 250 mm stainless steel, 5 μm particle size; Varian) was used. The mobile phase was 0.1% acetonitrile in hexane, operated isocratically at a flow rate of 1.0 mL/min. The injection volume was 10 μL. For identification, a standard mixture of pure CLA FAMEs isomers was used.
2.9. Statistical Analysis
Data obtained from each chromatographic method were statistically processed according to the Kruskal–Wallis test to establish the effect of different processing conditions (3 HPP treatments and control-ChC) on the lipid profiles, with the significance assigned at p < 0.05. SPSS software version 24.0 was used for the statistical analysis.
3. Results and Discussion
Triglycerides Composition of Serra da Estrela Cheese
The mean values of the triglycerides (TG) present in Serra da Estrela cheeses subject to different HPP treatments and control (ChC) are shown in Figure 1 and Figure 2 and Table S1. The Serra da Estrela cheeses (Chc cheese at 0 months of storage) harbored a very rich TG profile reaching a total of 66.8 TG/100 g fat (Figure 1). Among the most abundant TG, in descending order of magnitude, were the C42 (8.35 g/100 g fat), C40 (7.91 g/100 g fat), C36 (7.14 g/100 g fat), C44 (6.38 g/100 g fat), and C34 (5.98 g/100 g fat) (Figure 2A). These results are in agreement with the TG composition of Serra da Estrela cheeses reported by Partidário et al. [4], with the exception that C38 was the highest quantified TG in the latter study. The amount of each TG remained relatively stable in the ChC cheeses during refrigerated storage varying between 66.8 TG/100 g of fat at 0 months to 57.4 TG/100 g and 67.5 TG/100 g of fat at 6 and 15 months of storage, respectively (Figure 1).
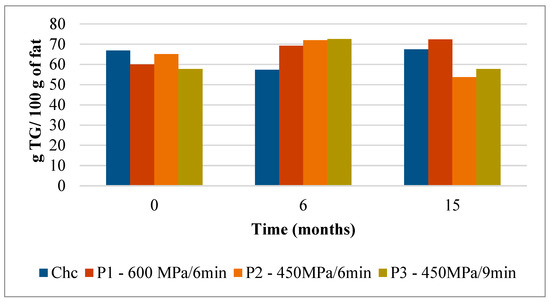
Figure 1.
Evolution of total TG content (g TG/ 100 g of fat) in control and HPP-treated cheeses over refrigerated storage. Data are expressed as mean (n = 2).
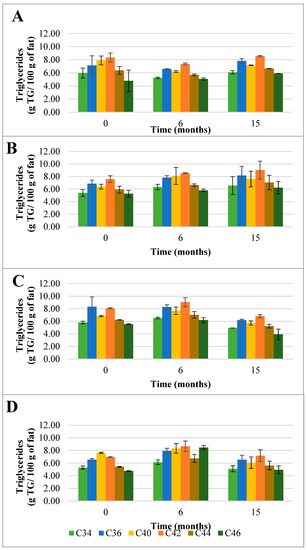
Figure 2.
Evolution of the mean composition of the main triglycerides (TG) (g TG/ 100 g of fat) found in control (A) and HPP cheeses (B) 600 MPa/6 min—1, (C) 450 MPa/6 min—P2, and (D) 450 MPa/9 min—P3 Serra da Estrela cheeses, during refrigerated storage. Data are expressed as mean (n = 2).
Interestingly, when Serra da Estrela cheeses underwent HPP upon ripening (0 months of storage), the total TG content was influenced by treatment conditions. In particular, in comparison with the ChC cheeses (66.8 g TG/100 g fat), P1 and P3 cheeses revealed a lower total TG content after HPP (60.0 g TG/100 g and 57.8 g TG/100 g fat, respectively), while a similar total TG content was determined for P2 cheeses (65.1 g TG/100 g fat) (Figure 1). Concerning the effect of storage, no defined trend was observed between HPP cheeses and between these and ChC cheeses in terms of total TG content, with values ranging between 69.2 (P1) TG/100 g and 72.5 (P3) TG/100 g fat at 6 months storage and 53.7 (P2) TG/100 g and 72.3 (P1) TG/100 g fat at 15 months storage. Interestingly, total TG content in P1 cheeses rose mildly but steadily throughout storage (+20% from 0 to 15 months storage), whereas in P2 and P3 cheeses, increases were observed between 0 and 6 months of storage (+10 and +25%, respectively), but then original values were recovered by 15 months of storage for P3 and less for P2 (Figure 1). Such oscillations were mainly due to changes, over storage, in the contents of the six most abundant TG, these being generally similar to those of ChC cheeses (i.e., C42, C40, C36, C44, C34, and C46 in descending order) (Figure 2). In terms of HPP, pressure intensity (P1 vs. P2 and P3) (Figure 2B vs. Figure 2C,D) seems to influence TG quantitative profile over storage more than holding time at the same pressure (P2 vs. P3) (Figure 2C vs. Figure 2D). To the best of the authors’ knowledge, there are no works that have reported on the effect of HPP on the TG profile of cheese; therefore, a comparative discussion is not possible. Nevertheless, a study performed with raw cows’ milk did not reveal variations in TG composition among raw and HPP-treated (900 MPa/5 min) milk [25].
The evolution of the fatty acids (FAs) profiles for EFAMEs and NEFAMEs in both control and HPP-processed Serra da Estrela cheeses, during the 15 months of storage, are presented in Figure 3 and Figure 4 (Tables S2 and S3), respectively. A total of 60 FAs were identified in all cheeses (Table S2), which is a number higher than the 39 and 26 FAs previously identified in Serra da Estrela cheese by Partidário et al. [4] and Carrocho et al. [26], respectively. The higher number of FAs reported in this study may be due to the use of a specific high polarity column for FAMEs analysis with extensive length, which increases the column efficiency required for the separation of complex samples and is able to provide the isomeric FAME-separations.
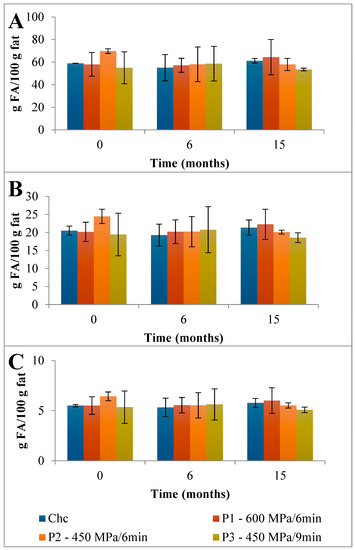
Figure 3.
Evolution of total content of (A) saturated fatty acids (SFAs), (B) monounsaturated fatty acids (MUFAs), and (C) polyunsaturated fatty acids (PUFAs) found in the EFAMEs fraction in control and HPP-treated cheeses over refrigerated storage. Data are expressed as mean (n = 2).
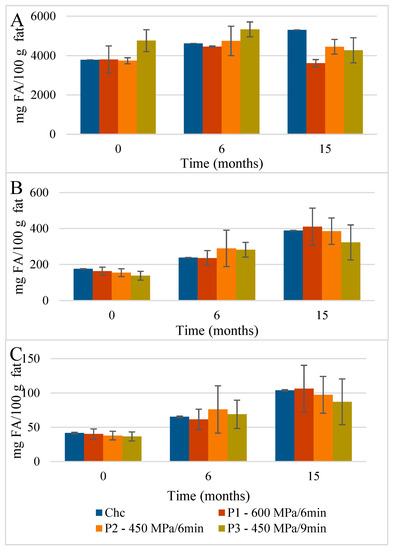
Figure 4.
Evolution of total content of (A) saturated fatty acids (SFAs), (B) monounsaturated fatty acids (MUFAs), and (C) polyunsaturated fatty acids (PUFAs) found in the NEFAME fraction in control and HPP-treated cheeses during refrigerated storage. Data are expressed as mean (n = 2).
First, a detailed discussion of the FAs mean composition found in the control Serra da Estrela cheese is provided followed by the impact of HPP on its evolution over refrigerated storage. The total content of saturated fatty acids (SFAs), monounsaturated fatty acids (MUFAs), and polyunsaturated fatty acids (PUFAs) found in the EFAMEs fraction of Chc cheeses was 84.9 g FA/100 g fat (Figure 3). Partidário et al. [4] reported a lower total FFAs content of 0.374 g/100 g fat for Serra da Estrela cheese. Over 6 months of storage, the total FAs content of the EFAMEs fraction remained fairly constant for ChC cheeses, which was a different trend to that observed for Casar raw ewes’ milk cheese where an increase in FAs of almost 2-fold was reported (from 5.60 to 11.6 g/kg cheese) from 0 to 6 months of storage [13]. In terms of the EFAMEs fraction profile, SFAs were the main FAs present (58.9 g FA/100 g fat) corresponding to 69.4 percent of EFAME FAs composition (Figure 3), with palmitic (C16; 18.4 g FA/100 g fat), myristic (C14; 9.65 g FA/100 g fat), stearic (C18; 8.40 g FA/100 g fat), capric (C10; 7.15 g FA/100 g fat), lauric (C12; 4.02 g FA/100 g fat), and butyric acids (C4; 3.28 g FA/100 g fat) being those present in higher amounts (Figure 5A and Table S2). A similar composition of FAs for the EFAMEs fraction was reported before for Serra da Estrela cheese [4,8,26]. Among the SFAs, palmitic, myristic, and lauric acids have been associated with hypercholesterolemia and with the increase in low-density lipoproteins (LDL) serum levels [27]. On the other hand, those risks can be reduced by increasing high-density lipoproteins (HDL) through dietary MUFAs and PUFAs intake [27]. In the EFAMEs fractions, ChC Serra da Estrela cheeses at 0 months revealed 20.5 g MUFA/100 g fat (24.1 %) and 5.49 g PUFA/100 g fat (6.5 %) (Figure 3). In the MUFAs fraction, oleic (C18:1 9c; 13.45 g FA/100 g fat) and trans vaccenic acids (C18:1 11t; 2.09 g FA/100 g fat) were the most abundant (Figure 5A and Table S2). Lima et al. [8] also reported oleic acid as the FA that contributed most to the unsaturated FAs profile. High MUFA-rich diets were reported to lower cholesterol and triacylglycerol concentration, with favorable effects on the cardiovascular disease (CVC) risk [28]. Among the PUFAs fraction, linoleic (C18:2 9c,12c; 1.30 g FA/100 g fat) and rumenic acids (C18:2 9c,11t; CLA 1.09 g FA/100 g fat) were the most abundant found (Figure 5A and Table S2). It is worthwhile mentioning that the total CLA content quantified in the ChC cheeses was 1.38 g FA/100 g fat (Figure 5A and Table S2), which was higher than those previously reported for other ewes’ milk cheeses (0.986 g/100 g of fat) [29] and CLA-fortified dairy products (0.48 g/100 g of fat) [30]. Such a high content of CLA compounds (rumenic acid and the other CLA isomers) may reflect a high amount of CLA precursors in the milk and its presence can arise from dietary PUFAs biohydrogenation in the ewes’ rumen and the ∆9-desaturase action on trans vaccenic acid in the mammary gland [24], an FA present at high amounts in these ChC cheeses. During storage, the CLA content remained stable (1.47 g FA/100 g fat at 15 months) (Figure 5). Clinical studies have associated CLA consumption with positive human health effects, such as anti-obesity (reduced body fat mass), reduced incidence of cardiovascular diseases (improvement of the blood lipid profile and a reduction in total cholesterol), and reduced immune disorders (enhanced levels of protective antibodies) [31].
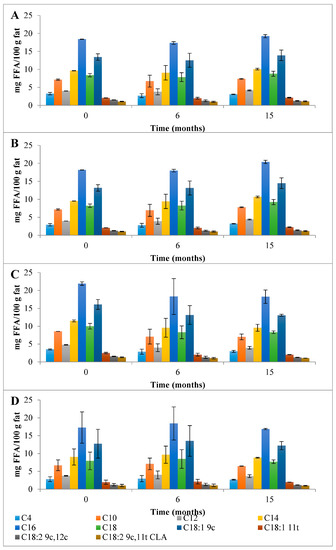
Figure 5.
Evolution of the mean composition of the main SFAs, MUFAs, and PUFAs (g FA/100 g of fat) found in the EFAMEs fraction in control (A) and HPP cheeses (B) 600 MPa/6 min—P1, (C) 450 MPa/6 min—P2, and (D) 450 MPa/9 min—P3 Serra da Estrela cheeses, during refrigerated storage. Data are expressed as mean (n = 2).
Due to the high content of CLA verified in the cheeses, an Ag+-HPLC separation of CLA isomers of ChC and HPP P1 (the most intense pressure treatment studied) cheeses at 0 months of storage was performed (Figure 6). As observed from Figure 6, similar qualitative and quantitative CLA isomers profiles were registered, demonstrating that HPP had no direct effect on the CLA isomers profile. Studies performed on Pecorino ewes’ milk cheese (made with pasteurized milk) showed a similar relative FAs profile with higher percentages of saturated (SFAs = 68.0 % of total FAs) and monounsaturated fatty acids (MUFAs = 22.5 % of total FAs), and consequently, lower percentages of polyunsaturated fatty acids (PUFAs = 4.43 % of total FAs) [29]. Notably, in the present work, a higher relative amount of PUFAs in the EFAMEs fat fraction of Serra da Estrela cheese was quantified relatively to other ewes’ milk cheeses reported in the literature, such as the previously mentioned Pecorino, Roquefort [29], and Serra da Estrela cheeses with incorporation of dried plants [26]. As previously discussed, the ingestion of PUFAs from animal sources such as cheese can reduce blood cholesterol and reduce the risk of cardiovascular diseases [31]. It is well known that the animals’ diet plays a major role in modulating the fatty acids composition of ruminant milk [32]. The Serra da Estrela ewe diet is mainly from pasture and fresh forages in extensive or semi-extensive grazing, but also based on preserved forage according to land availability and climatic conditions.
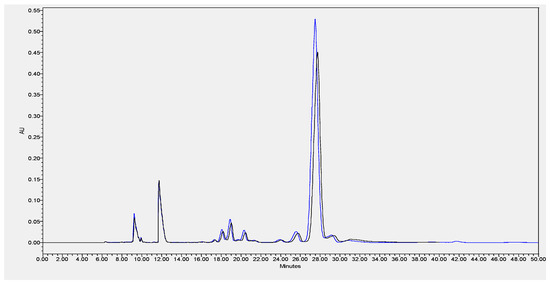
Figure 6.
Example of HPLC separation of CLA isomers of ChC (blue line) and HPP P1–600 MPa/6 min (black line) of Serra da Estrela cheese at month 0 of storage.
Concerning the ChC cheese NEFAMEs fractions (Figure 4 and Table S3), the total content of FAs was 4001 mg FA/100 g fat, which increased to 5793 mg FA/100 g fat over 15 months of storage. The main FA corresponded, once again, to SFAs (3783 mg FA/100 g fat) with pelargonic (C9; 3007 mg FA/100 g fat), butyric (C4; 153.9 mg FA/100 g fat), capric (C10; 148.5 mg FA/100 g fat), and palmitic acids (C16; 118.6 mg FA/100 g fat) as the main NEFAMEs present (Figure 7). In terms of the MU NEFAs, the NEFAME fractions revealed a composition similar to that of EFAMEs fractions, with oleic (C18:1 9c, 108.7 mg FA/100 g fat) and trans vaccenic acids (C18:1 11t; 14.7 mg FA/100 g fat) quantified as the main MU NEFAs present. Among the PU NEFA fraction, linoleic (C18:2 9c,12c, 16.25 mg FA/100 g fat) and α-linolenic acids (α-C18:3 9c,12c,15c, 14.5 mg FA/100 g fat) were the main PU NEFAs present; these FAs are known as essential FAs since their biosynthesis is not possible in humans or animals. In general, this qualitative profile was maintained throughout storage.
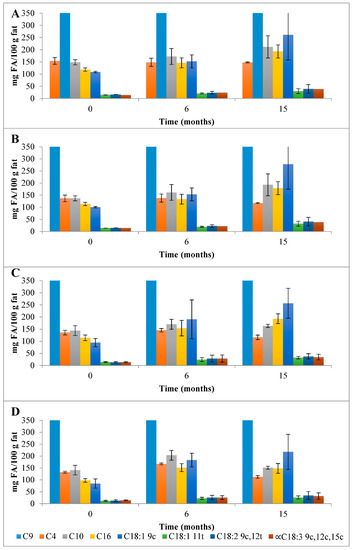
Figure 7.
Evolution of the mean composition of the main SFAs, MUFAs, and PUFAs (mg FA/100 g of fat) found in the NEFAME fraction in control (A) and HPP cheeses (B) 600 MPa/6 min—P1, (C) 450 MPa/6 min—P2, and (D) 450 MPa/9 min—P3 Serra da Estrela cheeses, during refrigerated storage. C9 with values outside the scale; data in Table S3. Data are expressed as mean (n = 2).
The HPP of Serra da Estrela cheese (0 months storage), independently of the treatment conditions, did not affect the total content of SFAs, MUFAs, and PUFAs in the EFAMEs fractions (values similar to those of ChC cheeses), except for HPP P2 cheeses, which revealed an increment of about 18% in relation to both ChC and other HPP (P1 and P3) cheeses (Figure 3 and Table S2). Upon 15 months of storage, the SFA content was numerically, although not significantly, slightly lower in HPP P2 and P3 cheeses (57.9 g FA/100 g and 53.5 g FA/100 g fat) than in ChC cheese (61.2 g FA/100 g fat), while HPP P1 cheeses revealed a higher content (64.5 g FA/100 g fat) (Figure 3). Analyzing the main SFAs at 15 months of storage, somewhat lower values were observed for HPP P3 cheeses in comparison with ChC cheeses (Figure 5A vs. Figure 5D) concerning palmitic (C16:0, 16.87 g FA/100 g fat vs. 19.26 g FA/100 g fat, respectively), myristic (C14:0, 8.84 g FA/100 g fat vs. 10.10 g FA/100 g fat), lauric (C12:0, 3.66 g FA/100 g fat vs. 4.18 g FA/100 g fat) and butyric acids (C4:0 2.68 g FA/100 g fat vs. 3.09 g FA/100 g fat). A further observation to be highlighted was the lower content of butyric acid in the HPP NEFAME P3 fraction (Figure 7 and Table S3) since butyric acid has been associated with a rancid-like cheese odor [33]. Similarly, lower amounts of butyric acid were reported in HPP (400 MPa and 600 MPa for 5 min and 20 min) processed Torta del Casar cheeses [13]. Nevertheless, sensory evaluation of those Serra da Estrela cheeses did not reveal significant odor differences between ChC and HPP cheeses, and the characteristic lactic, acid, animal/stable, and short-chain fatty acids (vomit-like odor) attributes were detected [10].
Nutritional indices are presented in Table 1. The PUFAs/SFAs ratio is measured to indicate the risk of incidence of CVD. It has also been discussed, although with some uncertainties, that single fatty acids might play negative roles in human health, in particular on the probability of increasing atheroma (C12:0, C14:0, and C16:0) and thrombus formation (C14:0, C16:0, and C18:0) [23]; hence, in many studies, the index of atherogenicity (IA) and the index of thrombogenicity (IT) are calculated (based on experimental values) to assess diet nutritional quality and the associated propensity to influence the incidence of CVD [23]. According to the results presented in Table 1, the EFAMEs fractions of all cheeses revealed similar atherogenic (between 2.32 and 2.40) and thrombogenic (between 2.55 and 2.64) indices, although the HPP P3 cheese revealed slightly lower (less 2%) values compared with the ChC cheeses. Dairy products with lower atherogenic and thrombogenic indices are potentially healthier for humans [27]. The results reported herein are in fact lower than those reported in Reis Lima et al.’s study, where mean AI and TI values reported for Serra da Estrela cheeses from different cheese producers were 2.92 ± 0.73 and 2.73 ± 0.52, respectively [8]. On the other hand, ripened buffalo cheeses revealed an IA index of 2.16 and an IT index of 1.20 [27], corroborating the importance of the product’s origin and processing on lipid composition and consequent AI and TI.

Table 1.
Lipid quality indices of EFAMEs fractions of control (ChC) and HPP-treated (600 MPa/6 min—P1, 450 MPa/6 min—P2, and 450 MPa/9 min—P3) Serra da Estrela cheeses.
The balance of PUFAs omega n − 6/omega n − 3 is relevant, since PUFAs may suppress HDL, which has a protective action against CVD [23]. The EFAMEs extracts of HPP and ChC cheeses revealed similar omega n − 6/omega n − 3 ratios, whereas the EFAMEs fat fractions of HPP P3 cheeses were also those that revealed lower values.
4. Conclusions
HPP did not affect Serra da Estrela cheese characteristics in terms of lipid composition: triglycerides, esterified, and non-esterified fatty acids methyl esters and conjugated fatty acids, and, consequently, nutritional features: atherogenicity and thrombogenicity indices, were similar among all cheeses. Furthermore, this research work presents for the first time the effect of HPP on the average triglycerides’ composition of a raw ewes’ milk cheese (no major effects were observed) as well as an in-depth comprehensive identification of esterified and non-esterified fatty acids methyl esters fractions of Serra da Estrela cheese. In terms of free fatty acids identification, the chromatographic procedure used in this study was able to identify 60 FFAs (including SFAs, MUFAs, and PUFAs and associated conjugated isomers) in comparison with the 39 FFAs previously identified in research studies on Serra da Estrela cheese. The high CLA content found in all cheeses, a positive feature from a health perspective, could be ascribed to the presence of many precursors in milk and an effective enzyme activity, which were not affected by HPP. Overall, having no major impact on Serra da Estrela cheese’s qualitative and quantitative lipid profiles, HPP may be considered a potential cold pasteurization process to assure the microbial safety and quality of Serra da Estrela cheese.
Supplementary Materials
The following supporting information can be downloaded at: https://www.mdpi.com/article/10.3390/app13105927/s1; Table S1: Mean composition of triglycerides (TG) (g TG/100 g of fat) in control (ChC) and HPP treated (600 MPa/6 min—P1, 450 MPa/6 min—P2 and 450 MPa/9 min) Serra da Estrela cheeses; Table S2: Mean fatty acid (FA) composition (g FA/100 g fat) of EFAME fractions of control (ChC) and HPP treated (600 MPa/6 min—P1, 450 MPa/6 min—P2 and 450 MPa/9 min) Serra da Estrela cheeses. Table S3: Mean fatty acid (FA) composition (mg FA/100 g fat) of NEFAME fractions of non-processed (ChC) and HPP treated (600 MPa/6 min—P1, 450 MPa/6 min—P2 and 450 MPa/9 min) Serra da Estrela cheeses.
Author Contributions
Conceptualization, R.S.I., J.A.S. and A.M.P.G.; methodology, R.S.I., L.M.R.-A. and L.L.P.; investigation, R.S.I., L.M.R.-A. and L.L.P.; data curation, R.S.I., L.M.R.-A. and L.L.P.; writing—original draft preparation, R.S.I.; writing—review and editing, A.M.P.G. and J.A.S.; supervision, A.M.P.G. and J.A.S.; funding acquisition, A.M.P.G. and J.A.S. All authors have read and agreed to the published version of the manuscript.
Funding
This research was funded by Fundação para a Ciência e a Tecnologia (FCT) through support for the LAQV-REQUIMTE (FCT UIDB/50006/2020 and UIDP/5006/2020) and CBQF (UIDB/50016/2020) research units, national funds and, where applicable, co-financed by the FEDER, within the PT2020 Partnership Agreement. Rita S. Inácio is also grateful for financial support from FCT through the fellowship Grant SFRH/BD/96576/2013.
Data Availability Statement
Data from the present manuscript is available upon request to the corresponding authors.
Conflicts of Interest
The authors declare no conflict of interest.
References
- Macedo, A.C.; Malcata, F.X.; Oliveira, J.C. The technology, chemistry, and microbiology of Serra cheese: A review. J. Dairy Sci. 1993, 76, 1725–1739. [Google Scholar] [CrossRef]
- Khattab, A.R.; Guirguis, H.A.; Tawfik, S.M.; Farag, M.A. Cheese ripening: A review on modern technologies towards flavor enhancement, process acceleration and improved quality assessment. Trends Food Sci. Technol. 2019, 88, 343–360. [Google Scholar] [CrossRef]
- McSweeney, P.L.H. Biochemistry of Cheese Ripening: Introduction and Overview; Elsevier: London, UK, 2004; pp. 347–360. [Google Scholar]
- Partidário, A.M.; Barbosa, M.; Vilas Boas, L. Free fatty acids, triglycerides and volatile compounds in Serra da Estrela cheese—Changes throughout ripening. Int. Dairy J. 1998, 8, 873–881. [Google Scholar] [CrossRef]
- Macedo, A.C.; Tavares, G.; Malcata, F.X. Esterase activities of intracellular extracts of wild strains of lactic acid bacteria isolated from Serra da Estrela cheese. Food Chem. 2003, 81, 379–381. [Google Scholar] [CrossRef]
- Macedo, A.C.; Malcata, F.X. Role of adventitious microflora in proteolysis and lipolysis of Serra cheese: Preliminary screening. Eur. Food Res. Technol. 1997, 205, 25–30. [Google Scholar] [CrossRef]
- Macedo, A.C.; Costa, M.L.; Malcata, F.X. Assessment of proteolysis and lipolysis in Serra cheese: Effects of axial cheese location, ripening time and lactation season. Lait 1996, 76, 363–370. [Google Scholar] [CrossRef]
- Reis Lima, M.J.; Fontes, L.; Bahri, H.; Veloso, A.C.A.; Teixeira-Lemos, E.; Peres, A.M. Fatty acids profile of Serra da Estrela PDO cheeses and respective atherogenic and thrombogenic indices. Nutr. Food Sci. 2019, 50, 417–432. [Google Scholar] [CrossRef]
- Dhineshkumar, V.; Ramasamy, D.; Siddharth, M. High pressure processing technology in dairy processing: A review. Asian J. Dairy Food Res. 2016, 35, 87–95. [Google Scholar] [CrossRef]
- Inácio, R.S. Effect of High-Pressure as a Non-Thermal Pasteurisation Technology for Raw Ewes’ Milk and Cheese Safety and Quality: Case Study on Serra da Estrela Cheese. Ph.D. Thesis, Universidade Católica Portuguesa, Porto, Portugal, 2020. [Google Scholar]
- Inácio, R.S.; Monteiro, M.J.P.; Lopes-da-silva, J.A.; Gomes, A.M.P.; Saraiva, J.A. Comparing different packaging conditions on quality stability of high-pressure treated Serra da Estrela cheeses during cold storage. Foods 2023, 12, 1095. [Google Scholar] [CrossRef]
- Juan, B.; Ferragut, V.; Guamis, B.; Trujillo, A.J. The effect of high-pressure treatment at 300 MPa on ripening of ewes’ milk cheese. Int. Dairy J. 2008, 18, 129–138. [Google Scholar] [CrossRef]
- Juan, B.; Ferragut, V.; Buffa, M.; Guamis, B.; Trujillo, A.J. Effects of high-pressure treatment on free fatty acids release during ripening of ewes’ milk cheese. J. Dairy Res. 2007, 74, 438. [Google Scholar] [CrossRef] [PubMed]
- Rynne, N.M.; Beresford, T.P.; Guinee, T.P.; Sheehan, E.; Delahunty, C.M.; Kelly, A.L. Effect of high-pressure treatment of 1 day-old full-fat Cheddar cheese on subsequent quality and ripening. Innov. Food Sci. Emerg. Technol. 2008, 9, 429–440. [Google Scholar] [CrossRef]
- Ávila, M.; Calzada, J.; Garde, S.; Nuñez, M. Effect of a bacteriocin-producing Lactococcus lactis strain and high-pressure treatment on the esterase activity and free fatty acids in Hispánico cheese. Int. Dairy J. 2007, 17, 1415–1423. [Google Scholar] [CrossRef]
- Saldo, J.; Fernández, A.; Sendra, E.; Butz, P.; Tauscher, B.; Guamis, B. High pressure treatment decelerates the lipolysis in a caprine cheese. Food Res. Int. 2003, 36, 1061–1068. [Google Scholar] [CrossRef]
- Calzada, J.; Del Olmo, A.; Picon, A.; Gaya, P.; Nuñez, M. High-Pressure Processing for the Control of Lipolysis, Volatile Compounds and Off-odours in Raw Milk Cheese. Food Bioprocess Technol. 2014, 7, 2207–2217. [Google Scholar] [CrossRef]
- Rodríguez-Pinilla, J.; Márquez, G.; Tabla, R.; Ramírez, R.; Delgado, F.J. Microbiological and lipolytic changes in high-pressure-treated raw milk cheeses during refrigerated storage. Dairy Sci. Technol. 2015, 95, 425–436. [Google Scholar] [CrossRef]
- Calzada, J.; Del Olmo, A.; Picon, A.; Nuñez, M. Effect of High Pressure Processing on the Lipolysis, Volatile Compounds, Odour and Colour of Cheese Made from Unpasteurized Milk. Food Bioprocess Technol. 2015, 8, 1076–1088. [Google Scholar] [CrossRef]
- Matyash, V.; Liebisch, G.; Kurzchalia, T.V.; Shevchenko, A.; Schwudke, D. Lipid extraction by methyl-tert-butyl ether for high-throughput lipidomics. J. Lipid Res. 2008, 49, 1137–1146. [Google Scholar] [CrossRef]
- Castro-Gómez, M.P.; Holgado, F.; Rodríguez-Alcalá, L.M.; Montero, O.; Fontecha, J. Comprehensive Study of the Lipid Classes of Krill Oil by Fractionation and Identification of Triacylglycerols, Diacylglycerols, and Phospholipid Molecular Species by Using UPLC/QToF-MS. Food Anal. Methods 2015, 8, 2568–2580. [Google Scholar] [CrossRef]
- Pimentel, L.L.; Fontes, A.L.; Gomes, A.M.P.; Rodríguez-Alcalá, L.M. Considerations about the in situ derivatization and fractionation of EFA and NEFA in biological and food samples. MethodsX 2015, 2, 475–484. [Google Scholar] [CrossRef]
- Ulbricht, T.L.V.; Southgate, D.A.T. Coronary heart disease: Seven dietary factors. Lancet 1991, 338, 985–992. [Google Scholar] [CrossRef] [PubMed]
- Rodríguez-Alcalá, L.M.; Alonso, L.; Fontecha, J. Stability of fatty acid composition after thermal, high pressure, and microwave processing of cow milk as affected by polyunsaturated fatty acid concentration. J. Dairy Sci. 2014, 97, 7307–7315. [Google Scholar] [CrossRef]
- Rodríguez-Alcalá, L.M.; Castro-Gómez, P.; Felipe, X.; Noriega, L.; Fontecha, J. Effect of processing of cow milk by high pressures under conditions up to 900 MPa on the composition of neutral, polar lipids and fatty acids. LWT-Food Sci. Technol. 2015, 62, 265–270. [Google Scholar] [CrossRef]
- Carocho, M.; Barreira, J.C.M.; Antonio, A.L.; Bento, A.; Morales, P.; Ferreira, I.C.F.R. The incorporation of plant materials in “Serra da Estrela” cheese improves antioxidant activity without changing the fatty acid profile and visual appearance. Eur. J. Lipid Sci. Technol. 2015, 117, 1607–1614. [Google Scholar] [CrossRef]
- Naydenova, N.; Kaishev, I.; Iliev, T.; Mihaylova, G. Fatty acids profile, atherogenic and thrombogenic health indices of white brined cheese made from buffalo milk. Agric. Sci. Technol. 2014, 6, 352–355. [Google Scholar]
- Kris-Etherton, P.M.; Pearson, T.A.; Wan, Y.; Hargrove, R.L.; Moriarty, K.; Fishell, V.; Etherton, T.D. High–monounsaturated fatty acid diets lower both plasma cholesterol and triacylglycerol concentrations. Am. J. Clin. Nutr. 1999, 70, 1009–1015. [Google Scholar] [CrossRef]
- Prandini, A.; Sigolo, S.; Piva, G. A comparative study of fatty acid composition and CLA concentration in commercial cheeses. J. Food Compos. Anal. 2011, 24, 55–61. [Google Scholar] [CrossRef]
- Rodríguez-Alcalá, L.M.; Fontecha, J. Hot Topic: Fatty Acid and Conjugated Linoleic Acid (CLA) Isomer Composition of Commercial CLA-Fortified Dairy Products: Evaluation after Processing and Storage. J. Dairy Sci. 2007, 90, 2083–2090. [Google Scholar] [CrossRef]
- Abdelhamid, A.S.; Martin, N.; Bridges, C.; Brainard, J.S.; Wang, X.; Brown, T.J.; Hanson, S.; Jimoh, O.F.; Ajabnoor, S.M.; Deane, K.H.; et al. Polyunsaturated fatty acids for the primary and secondary prevention of cardiovascular disease. Cochrane Database Syst. Rev. 2018, 2018, CD012345. [Google Scholar] [CrossRef]
- Addis, M.; Cabiddu, A.; Pinna, G.; Decandia, M.; Piredda, G.; Pirisi, A.; Molle, G. Milk and Cheese Fatty Acid Composition in Sheep Fed Mediterranean Forages with Reference to Conjugated Linoleic Acid cis-9,trans-11. J. Dairy Sci. 2005, 88, 3443–3454. [Google Scholar] [CrossRef]
- Delgado, F.J.; González-Crespo, J.; Ladero, L.; Cava, R.; Ramírez, R. Free fatty acids and oxidative changes of a Spanish soft cheese (PDO ‘Torta del Casar’) during ripening. Int. J. Food Sci. Technol. 2009, 44, 1721–1728. [Google Scholar] [CrossRef]


Disclaimer/Publisher’s Note: The statements, opinions and data contained in all publications are solely those of the individual author(s) and contributor(s) and not of MDPI and/or the editor(s). MDPI and/or the editor(s) disclaim responsibility for any injury to people or property resulting from any ideas, methods, instructions or products referred to in the content. |
© 2023 by the authors. Licensee MDPI, Basel, Switzerland. This article is an open access article distributed under the terms and conditions of the Creative Commons Attribution (CC BY) license (https://creativecommons.org/licenses/by/4.0/).