Article

Study of Regression Algorithms and Influent Factors between Intelligent Compaction Measurement Values and In-Situ Measurement Values

1
Key Laboratory of Road and Traffic Engineering of the Ministry of Education, Tongji University, 4800 Cao’an Road, Shanghai 201804, China
2
Zhong Dian Jian Ji Jiao Expressway Investment Development Co., Ltd., Shijiazhuang 050051, China
*
Author to whom correspondence should be addressed.
Appl. Sci. 2023, 13(10), 5953; https://doi.org/10.3390/app13105953
Submission received: 12 April 2023 / Revised: 28 April 2023 / Accepted: 4 May 2023 / Published: 12 May 2023
(This article belongs to the Section Civil Engineering)

Abstract

:
Intelligent compaction (IC) technology have been used for quality control and quality assurance (QC/QA) in subgrade construction. The effective regression correlations between Intelligent Compaction Measurement Values (ICMV) and In-situ Measurement Values (ISMV, including compaction degree and subgrade modulus ELWD) are the essential prerequisite of using IC technology for QC/QA. This paper presents the results from an experimental research study that was conducted from a practical subgrade project of China to explore the regression relationships between ICMV and ISMV. Three types of ICMV, including CMV, CCV and Evib, were collected along with the corresponding positions of the rollers. Two types of ISMV, containing compaction degree and ELWD, were measured by ring sampler method and light weight deflectometer (LWD) at specified test points, respectively. Based on these data, the influences of roller parameters and subgrade properties on the regression relationships of ICMV and ISMV were investigated. In addition, linear regression and 5 nonlinear regression algorithms were compared. The results suggest that ICMV reflect the stiffness of subgrade more than reflecting the density. In the regression of ICMV and ISMV, subgrade properties are more important than roller parameters while both of them should not be neglected. The influences of underlying stiffness and roller amplitude are linear while that of roller speed and moisture content are nonlinear. Nonlinear algorithms, especially the random forest, have the better performance compared to linear algorithm. Moreover, the combination of random forest and linear algorithm can further improve the accuracy of ISMV prediction.

1. Introduction

Compaction is one of the important steps in subgrade construction which can guarantee the bearing capacity of roads. In order to determine compaction quality of subgrade, most road projects headquarters deploy field inspectors to conduct in-situ measurements of subgrade compaction state, such as ring sampler method and light weight deflectometer (LWD). However, there are five limitations by using in-situ measurements for compaction quality assessment [1,2]: (a) sampling of in-situ measurement points is random and unrepresentative; (b) in-situ measurement points can only cover less than 1% of the subgrade and is inable to provide the quality information of whole compaction area; (c) the uniformity of the subgrade compaction state cannot be judged; (d) in-situ measurements can be implemented only after compaction has ended which lead to the lack of real-time feedback on compaction quality; (e) the time cost of detection is high and it is easy to be disturbed by human factors.
The above defects of in-situ measurements lead to the emergence of intelligent compaction (IC) technology. IC technology, also known as Continuous Compaction Control (CCC) technology, can continuously assess the subgrade compaction quality through Intelligent Compaction Measurement Values (ICMV) integrated with positioning system to provide a complete compaction and geographic information of subgrade [3]. Through the utilization of IC technology, road projects headquarters can achieve more efficient performance of related QC/QA tasks during the construction of soil embankments. This technology effectively eliminates the limitations associated with traditional roller compaction inspection through in situ measurements.
The ICMV, which are calculated based on the roller vibration signal, are consist of 3 types [4]: empirical method index (including compaction measurement value, CMV and continuous compaction value, CCV), energetic method index (mainly machine drive power, MDP) and mechanical method index (including vibration modulus Evib and soil stiffness ks).
By means of the Fast Fourier Transform (FFT), time domain vibration signal of drum is transmitted into frequency domain, then the empirical method ICMV can be computed by the amplitude of harmonic. In field applications, the empirical method ICMV typically employs the average of the calculated results from two cycles in the domain curve. For example, when the roller’s vibration frequency is 30 Hz, 5 empirical method ICMV can be calculated within a second [5]. For the mechanics perspective, the vibration drum and the compacted subgrade can be viewed as an interaction system during the vibration compaction process. By applying the kinematic equilibrium equation at every moment during the compaction, the vibration signal of the drum can be used to solve the material properties of the subgrade. This is the fundamental calculation principle of the mechanical method ICMV. In general, mechanical method ICMV is calculated on the basis of a two-degree-of-freedom model of vibratory compaction [6]. Energetic method ICMV is calculated by energy conservation principles. As the roller’s drum penetrates into the soil, the subgrade impedes roller’s movement, leading to an increase in the energy required for forward motion. This additional energy consumption is directly correlated with the strength of the subgrade, such that greater subgrade strength results in less penetration and additional energy consumption [7]. Essentially, energetic method ICMV is a promotion of the net power required for a compactor to pass through a compacted subgrade, without the need to obtain vertical vibration information from the roller [8]. This also makes energetic method ICMV suitable for various types of compactors [9].
Due to the ICMV are calculated by drum vibration response, it is incapable of directly measuring the density and stiffness of subgrade that have been used as standardized QC/QA indicator for decades in road construction industry [10], namely in-situ measurement values (ISMV). Therefore, to implement IC technology as a primary QC/QA measure of compaction, it is essential to establish the effective regression correlations between ICMV and ISMV (including compaction degree and subgrade modulus ELWD) [11]. By using established regression correlations, the conventional ISMV can be replaced with the ICMV in construction, thereby reducing laborious efforts and enabling real-time control of subgrade quality. Furthermore, these correlations can assist road project headquarters in evaluating the potential reliance on IC technology for subgrade QC/QA and in developing equivalent-criteria specifications for the utilization of IC as a QC/QA tool [12,13,14,15,16]. For instance, the determination coefficient R2 should be above 0.49 in Chinese/German specification or should be above 0.36 in Swedish specification [14,17].
However, the regression correlations between ICMV and ISMV are complicated because the correlations are not only affected by roller parameters but also by subgrade properties [18,19,20,21]. It primarily includes roller speed and roller vibration amplitude in terms of roller parameters. In terms of soil properties, it mainly involves moisture content and underlying soil stiffness [22]. Therefore, investigating the influence of above factors on the correlation between ICMV and ISMV will contribute to the further development of IC technology. The studies of IC technology have mainly focused on the monadic or multiple linear relationship between ICMV and ISMV so far [23,24]. Nevertheless, when multiple parameters are considered, the effect of linear fitting is limited. In fact, the essence of all regression algorithms is to assign corresponding weights to each feature, and to iteratively adjust the weights through a loss function, so that the predicted result approaches the real value (Figure 1). In this circumstance, nonlinear regression algorithms can be introduced in IC technology application to solve the above issues [13,25,26,27]. Nonlinear algorithms based on artificial neural networks (ANN) were widely used in the field of IC technology in the existing literature [13,25,28]. Since the model construction can be completed by adjusting the number of network layers and node parameters, the advantage of ANN is that it does not require manual feature engineering and can achieve satisfactory regression results. In fact, for intelligent compaction data, which is a kind of tabular data sets, the use of gradient boosting tree algorithms such as Light Gradient Boosting Model (LGBM) or extreme gradient boosting (XGBT) for processing often leads to superior results [29,30]. Compared to linear regression algorithms, the advantage of nonlinear algorithms lies in their ability to fully consider the nonlinear impact mechanisms of the influence factors, resulting in predictions that are closer to the true values.
The objectives of this study were to (a) investigate the influence of roller parameters and subgrade properties on the regression relationship of ICMV and ISMV; (b) compare the regression effects of linear regression and 5 nonlinear regression algorithms, then find the most suitable one for IC technology. To achieve this goal, 3 types of ICMV (CMV, CCV and Evib) and 2 types of ISMV (compaction degree and subgrade modulus ELWD) were collected on a highway subgrade project of China. Then, the influences of roller parameters (including roller speed v and roller amplitude Am) and soil properties (including moisture content w and underlying soil stiffness ku) on correlations between ICMV and ISMV were discussed. Based on these data, multiple linear regression and 5 nonlinear regression algorithms were employed to predict ISMV with ICMV, roller parameters and soil properties as inputs. Furthermore, by comparing the prediction effects of these algorithms, the most suitable regression algorithm for IC technology was identified.

2. Methods

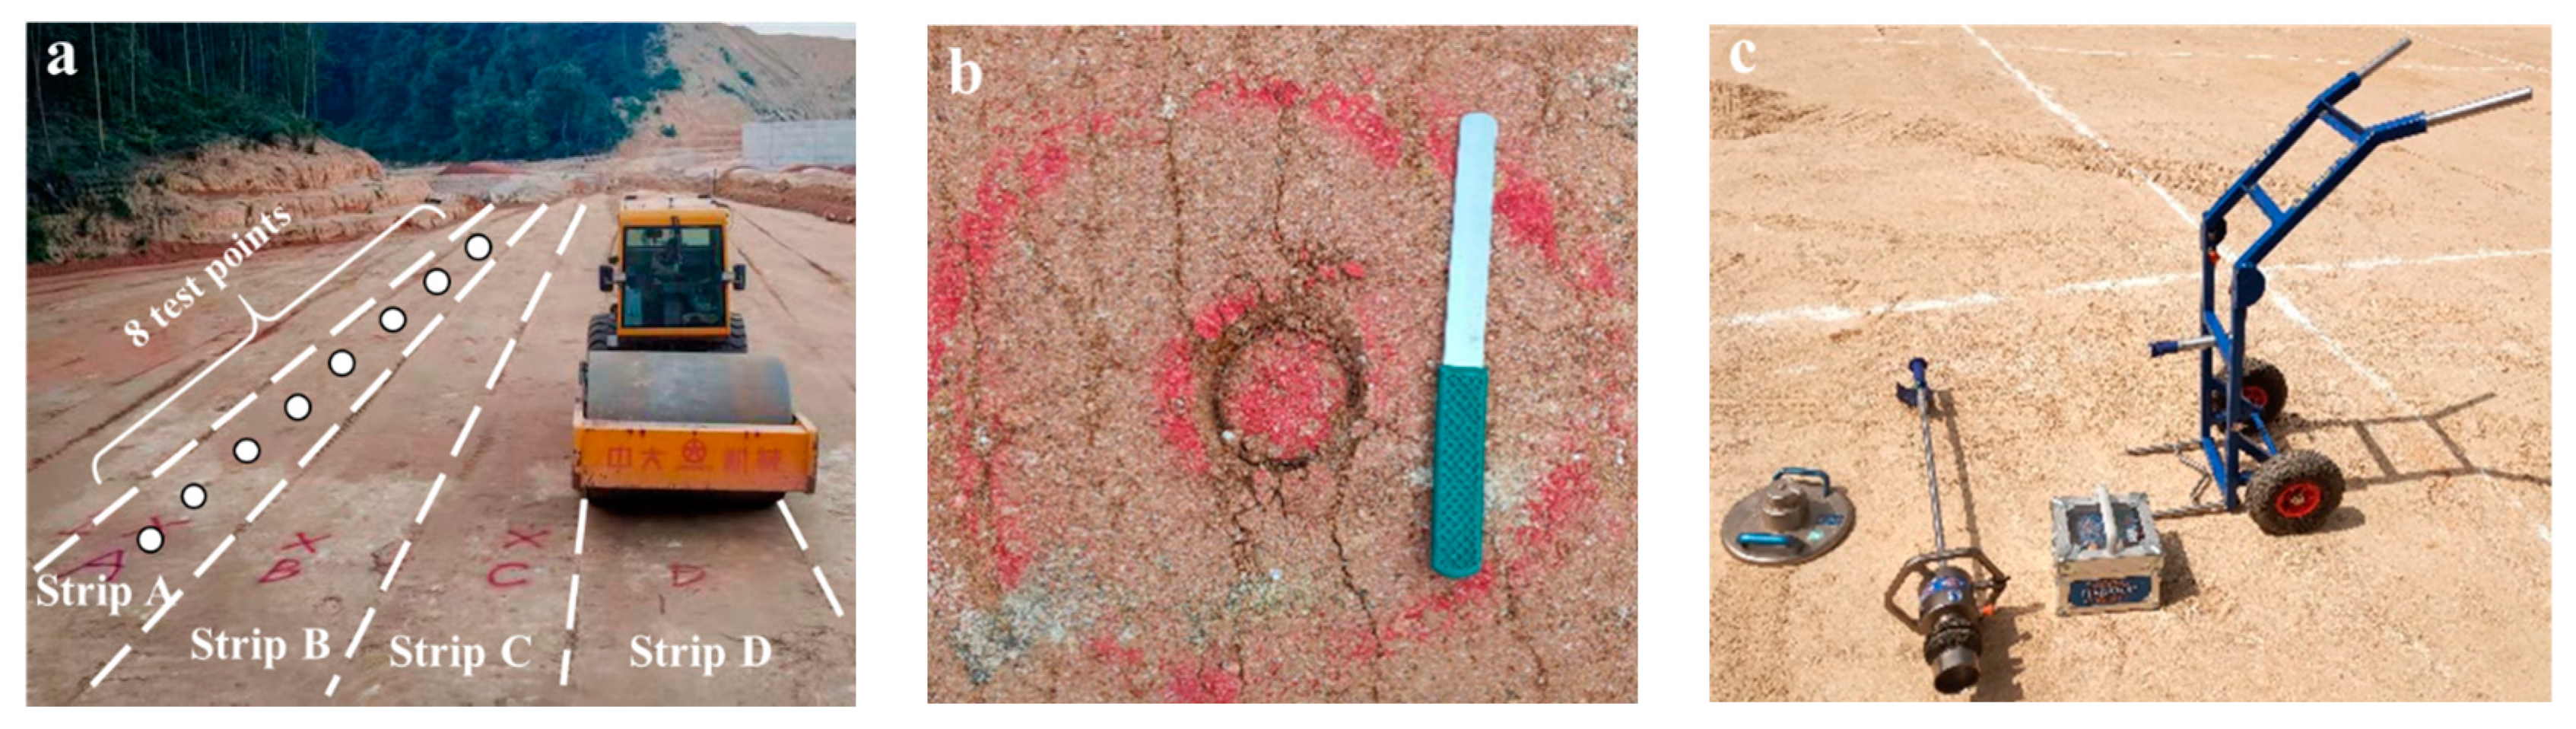
2.1. Construction Information

The work is located in a highway in China. For this project, a 70 m long × 8 m wide test subgrade was constructed. The subgrade was constructed to an approximate total final height of 3.2 m, by compacting eight layers with a target loose lift thickness of 50 cm. Each soil lift was compacted using a vibratory smooth drum roller (specific parameters can be seen in Table 1) after soil placement and moisture conditioning. High amplitude compaction was performed on the loose subgrade in the first pass for each layer to speed up the compaction process. To measure the ICMV, 4 side-by-side strips were separated at each lift with approximately 20 cm of overlap at the edges. Besides, 8 test spots are uniformly distributed (10 m apart) on each strip to detect the ISMV and other influence factors (such as moisture content), as showed in Figure 2a. Hence, the ISMV and influence factors of 256 test points were measured.
To monitor roller position and ICMV in real time, the single-drum vibratory roller was equipped with an IC device (Figure 3). Spatial coordinates and 3 types of ICMV (CMV, CCV and Evib) were outputted at a frequency of 2 Hz.
A series of in-situ tests were performed at the test points to monitor the process of soil compaction at the end of compaction for each lift. The tests that were conducted include light weight deflectometer (LWD) tests to obtained subgrade modulus (ELWD) and ring sampler method to acquire moisture content and compaction degree (Figure 2b,c). The step-by-step details of in-situ test procedure were omitted here for simplicity.

2.2. Soil Properties

The results of liquid-plastic limit test, standard Proctor test and grain size analysis for field samples taken at the in-situ test locations are shown in Figure 4. From this data (Table 2), The gravel fraction has a lower mass than the sand fraction, while the fine particle fraction has a mass greater than 15% but less than 50% of the total sample mass. The materials that were used for subgrade construction classify as silty sand (SM).

2.3. Calculation Method of ICMV

CMV is defined as the amplitude of first harmonic divided by the amplitude of the measured response acceleration at the fundamental frequency [31]:
C M V = C A 1 A 0
where C is a constant (C = 300), A0 is the vertical acceleration amplitude of the drum at the fundamental frequency, and A1 is the drum acceleration amplitude of first harmonic.
CCV takes the first subharmonic (i.e., 0.5 Ω) and higher-order harmonics into account [32]:
C C V = A 0.5 Ω + A 1.5 Ω + A 2.5 Ω + A 3 Ω A 2.5 Ω + A 3 Ω × 100
where A(iΩ) is the vertical acceleration amplitude of the drum at i-order harmonics.
By applying Lundberg’s theoretical solution to a rigid cylinder on subgrades, the relationship among the contact force, drum displacement and vibration modulus (Evib) can be determined as [7,33,34]:
E v i b = 1 μ 2 z d F s L 2 π 1.8864 + ln L b
b = 16 π R 1 v 2 E v i b F s L
F s = m d g + m 0 e 0 Ω 2 cos Ω t m d a
where Fs is the contact force between the drum and soil, L is the drum length, b is the contact width, zd is the drum displacement, μ is the Poisson ratio, R is the radius of the drum, md is the weight of drum, m0e0 is the eccentric moment of unbalanced mass, g is gravity acceleration, a is the acceleration of the drum, Ω is the circular vibration frequency.

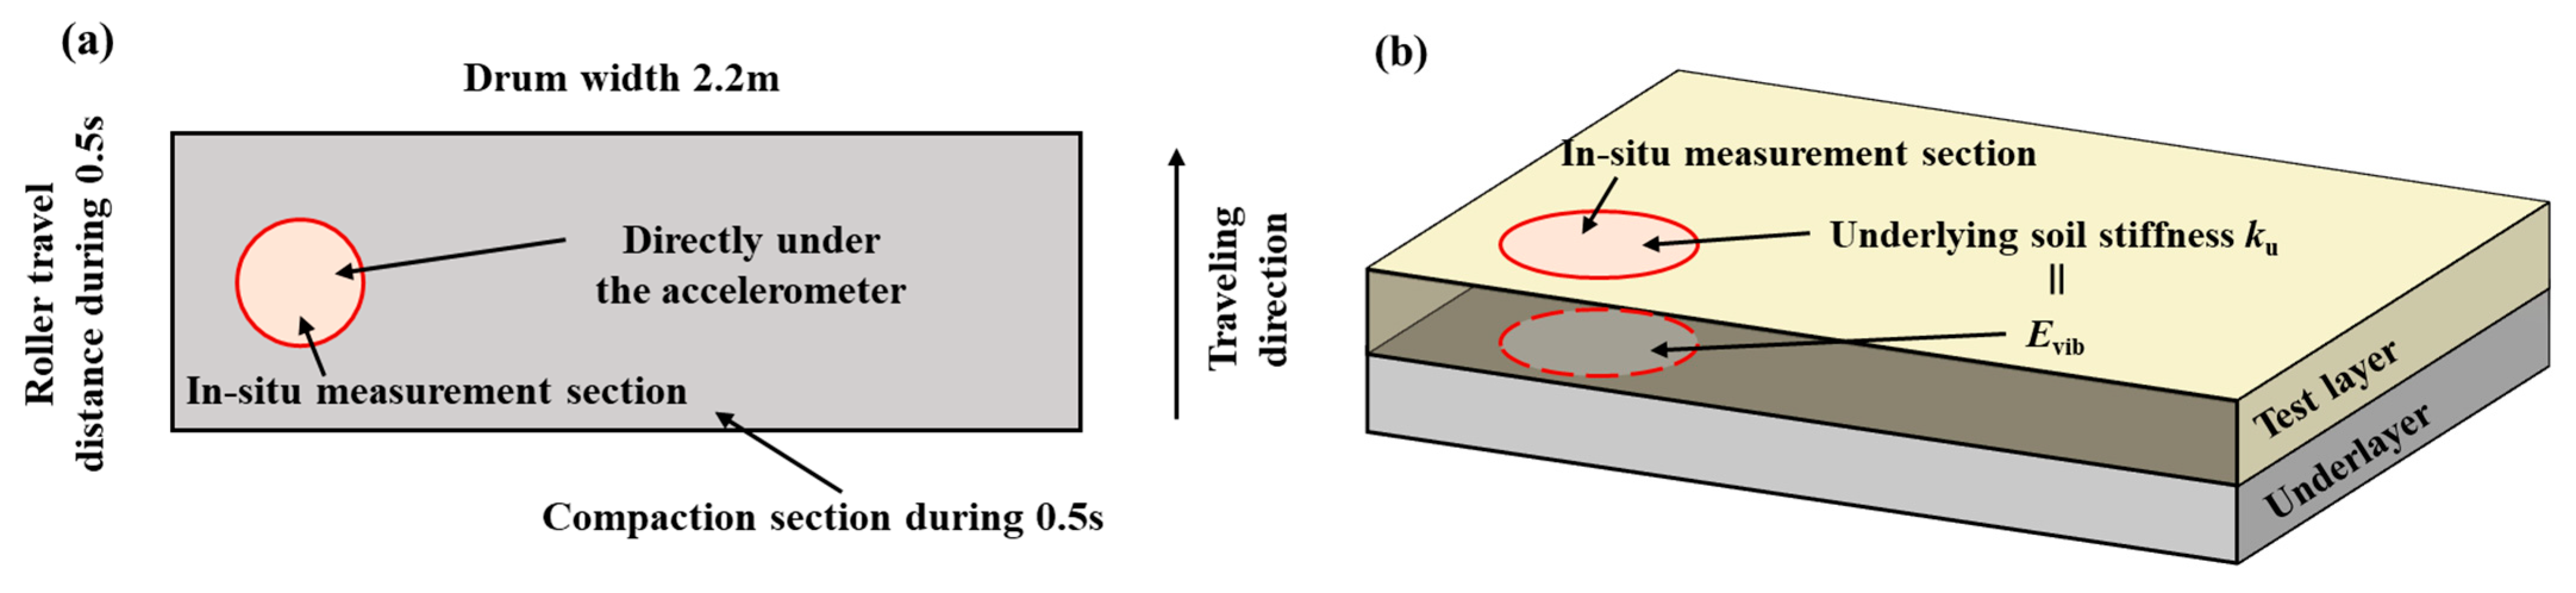
2.4. Considering of Roller Rocking Motion and Underlying Soil Stiffness

In addition, considering the x-axis of the drum would rotate when the soil stiffness was distributed non-uniformly, namely the roller rocking motion [35], only the ISMV directly under roller accelerometer were used to analyze (Figure 5a). At each test layer, the Evib of its underlayer represented the underlying soil stiffness ku (Figure 5b). Hence, there were no data of the underlying soil stiffness on the first layer and only the data of remaining 224 points were subsequently analyzed.

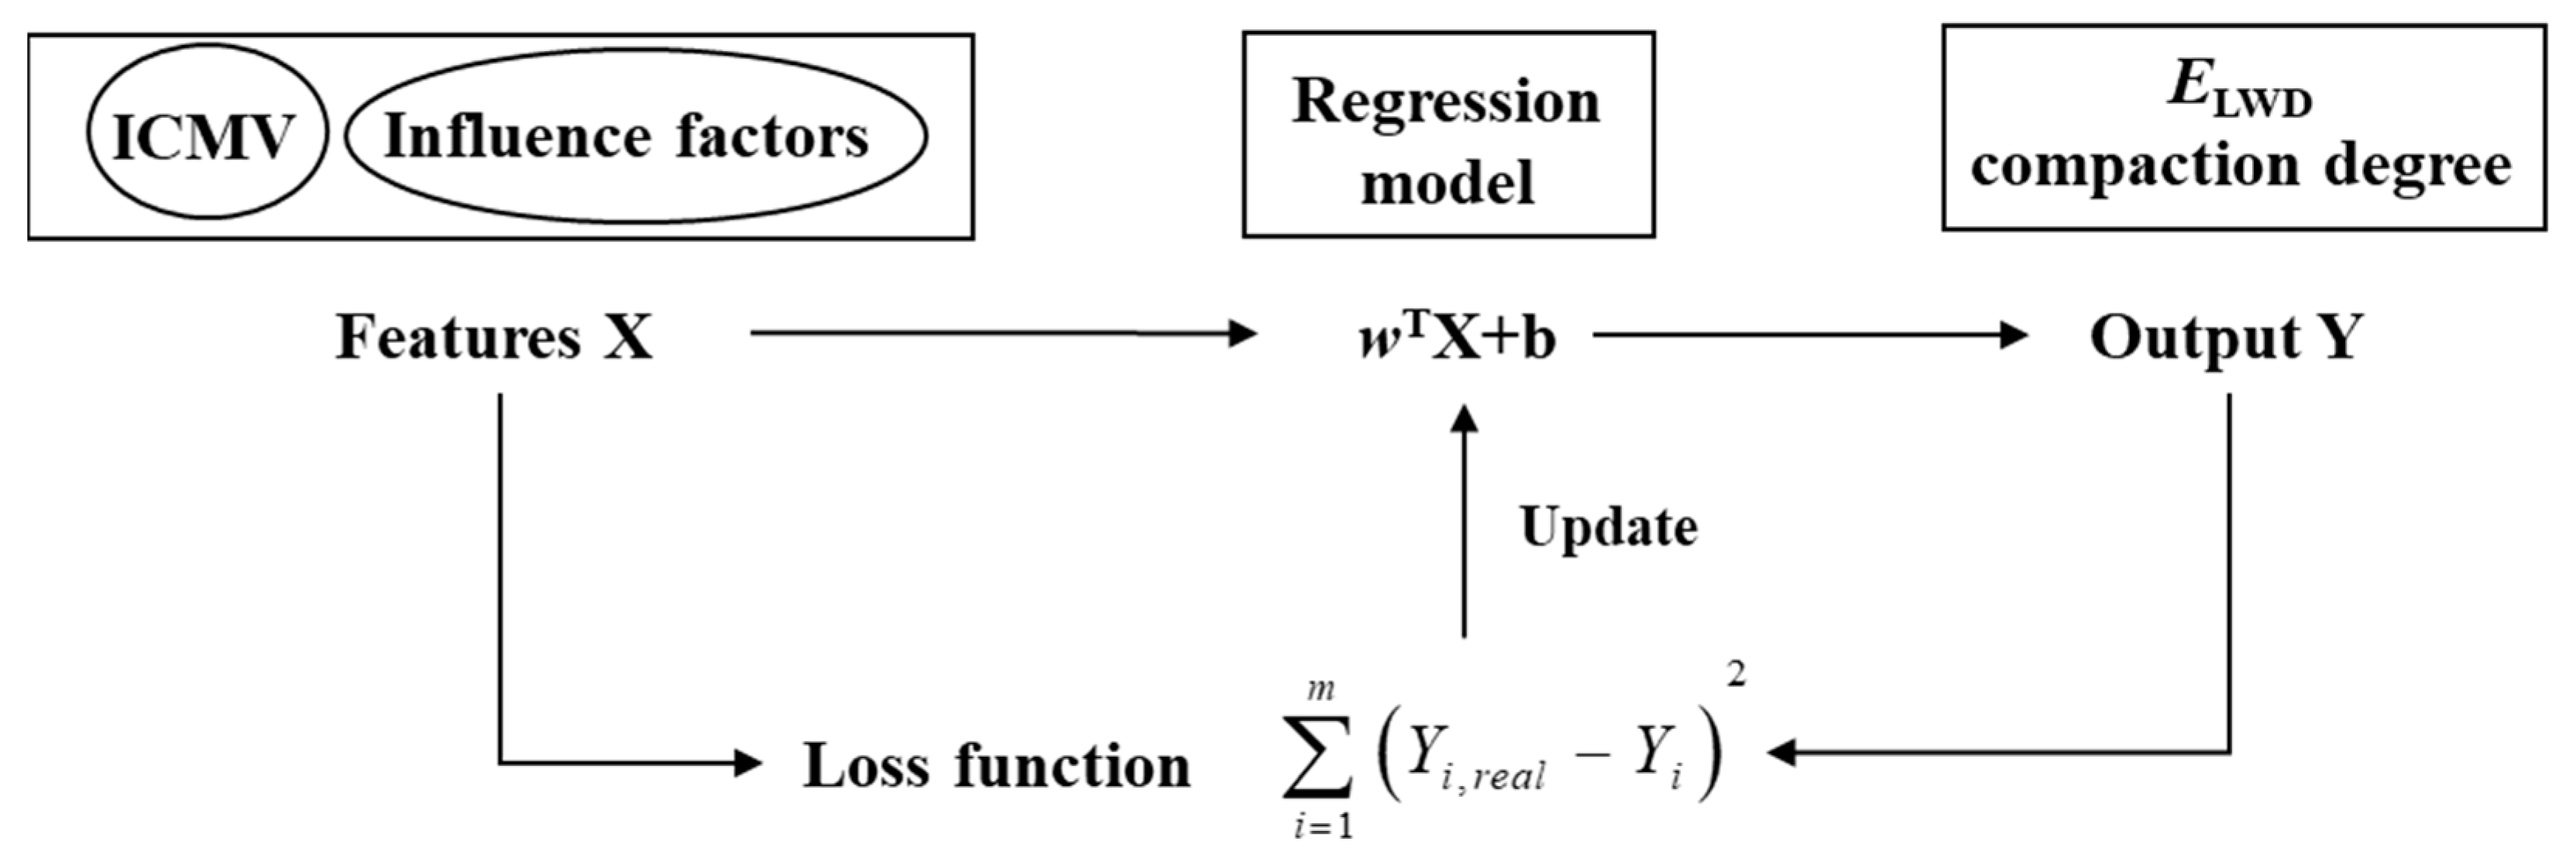
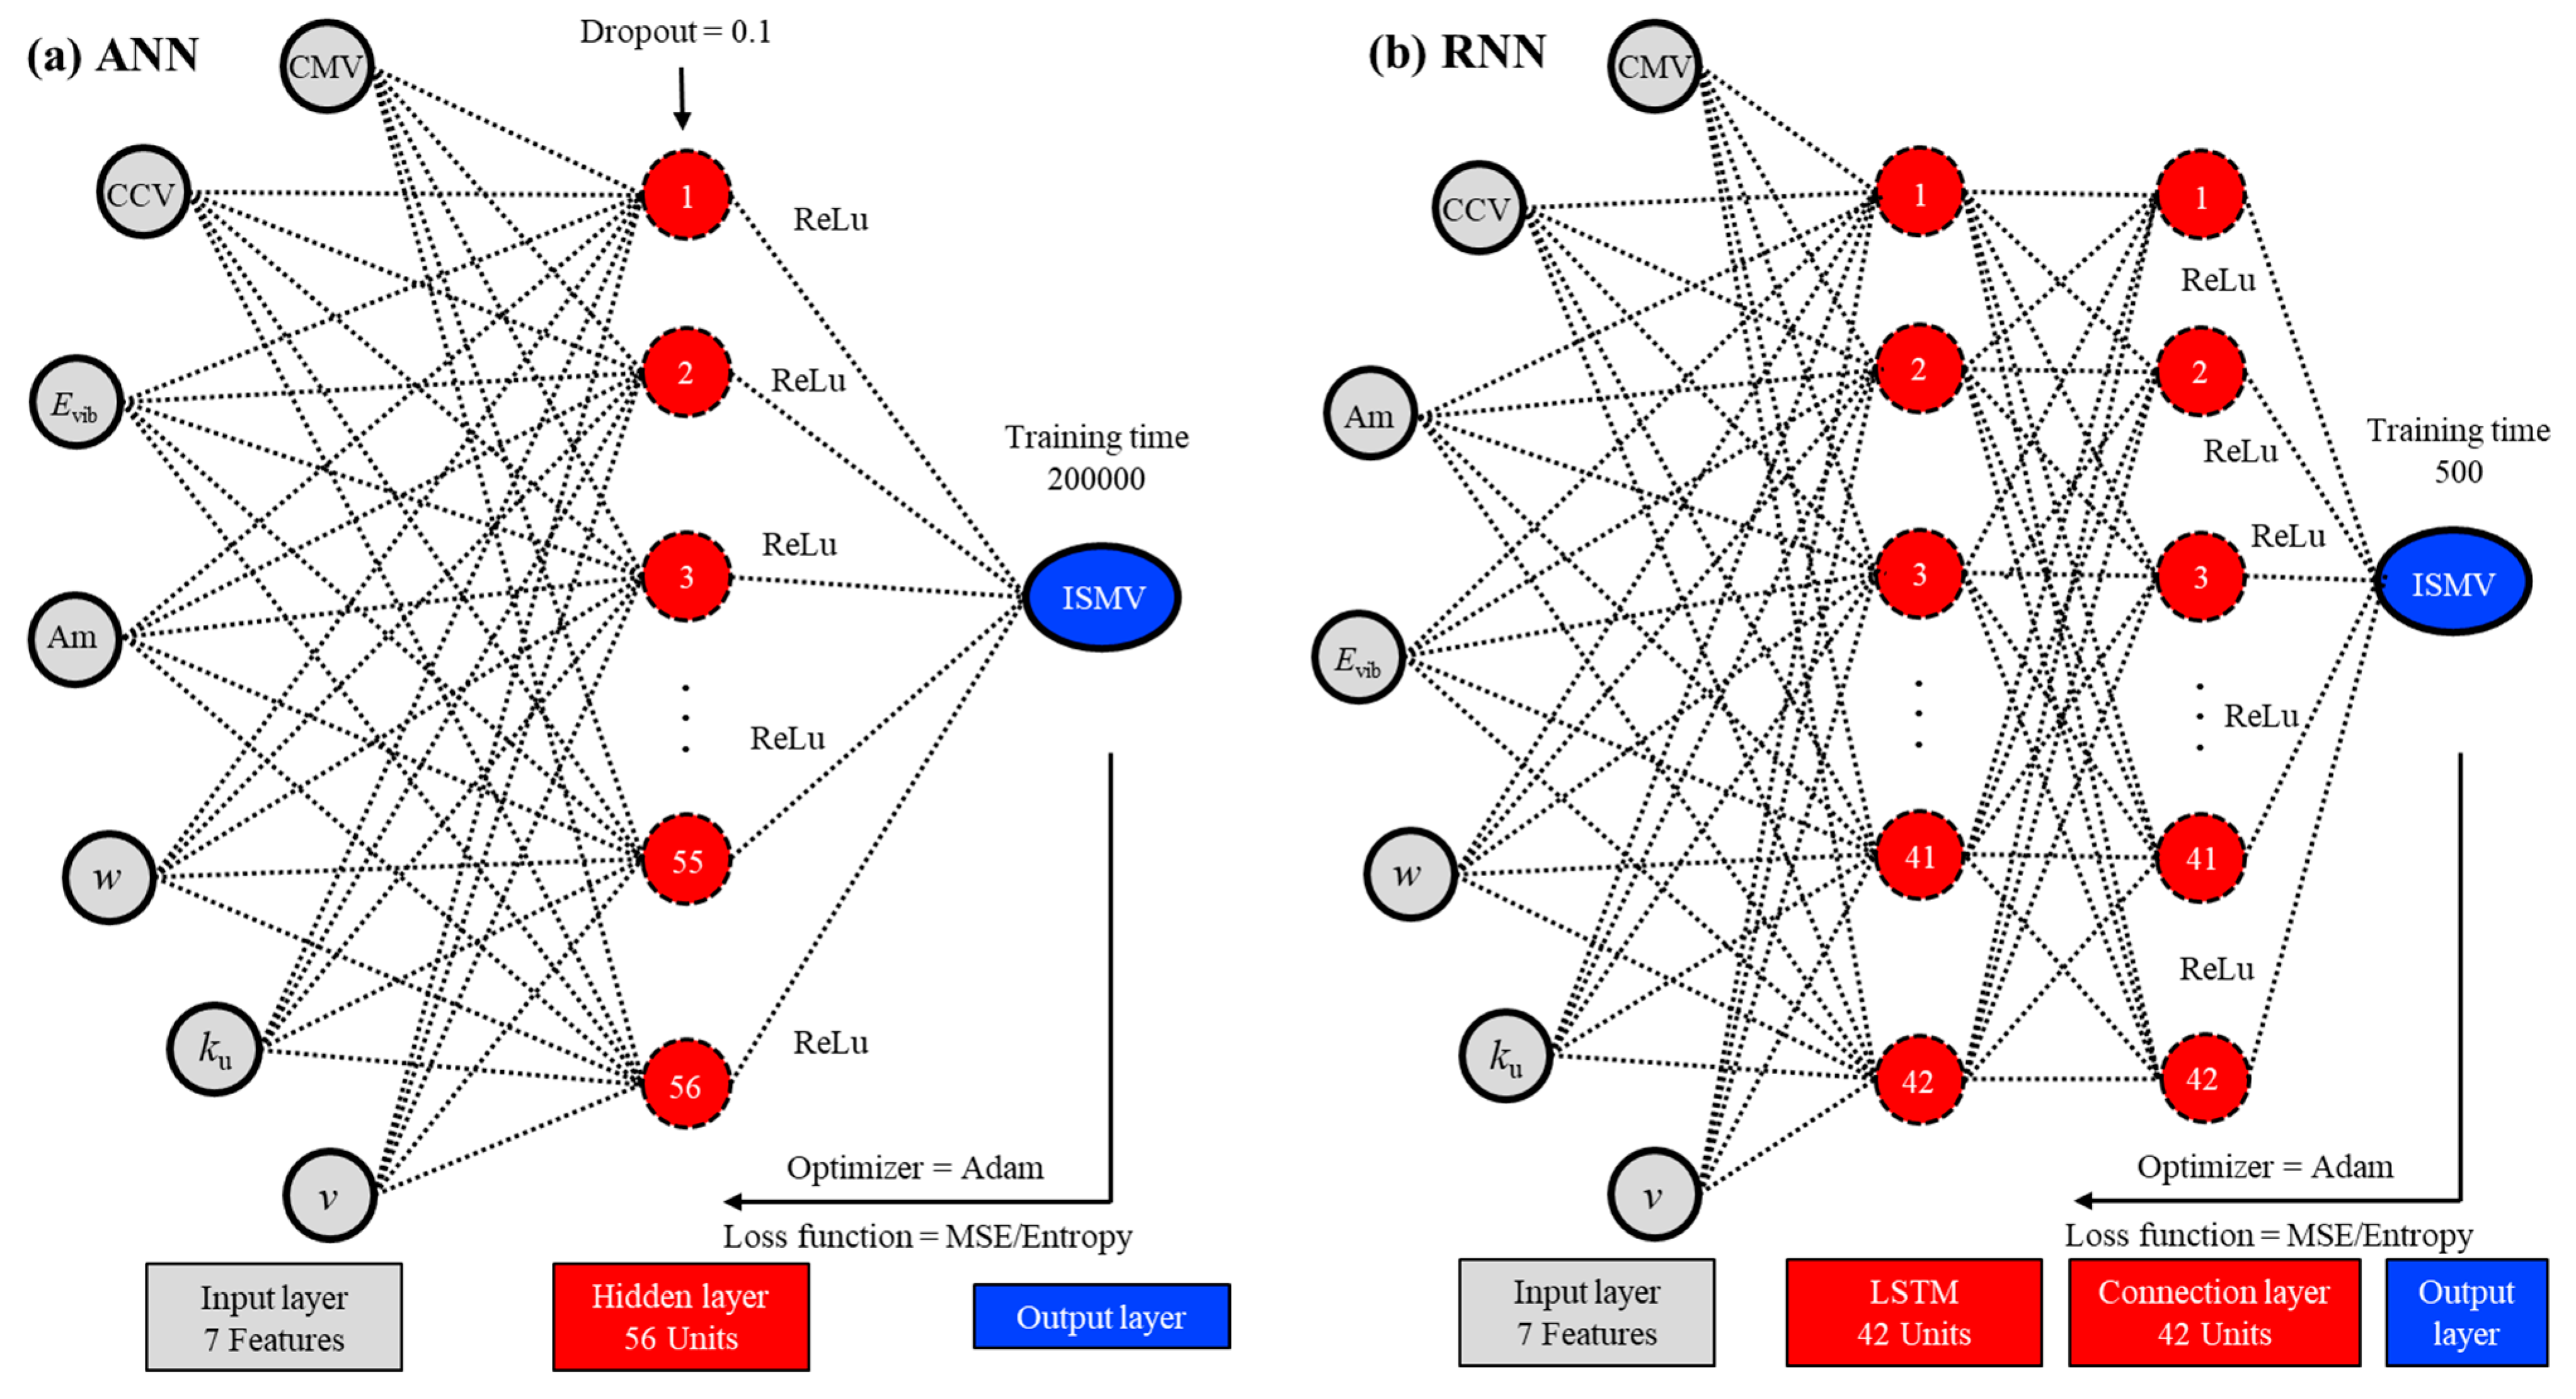
2.5. Regression Algorithms

To explore the correlation relationships between ICMV and ISMV, linear and 5 nonlinear algorithms were employed. The details and principles of the algorithm are exhibited in Table 3. All algorithms were cross-validated with 5-folds. Two indicators, root mean square error (RMSE), and R2 between real and predicted ISMV, were used to estimate the algorithm performances. RMSE and R2 could be calculated as:
R M S E = 1 n i = 1 n y i y i , p r e 2
R 2 = 1 i = 1 n y i y i , p r e 2 i = 1 n y i y i , e x p 2
where n is the amount of data in the data, yi is a single true value of the data, yi,pre is a single predicted value of the data, and yi,exp is the expectation of the true value.
DL models were built with Pytorch version 1.10.2. ANN and RNN structures are shown in Figure 6a,b. ReLu is a nonlinear transformation function that establishes the nonlinear relations between inputs and outputs. To alleviate the overfitting of neural network, the Dropout parameter was set as 0.1, which meant that only 90% of hidden layer units were activated in each training step. The training time was determined by repeated debugging.

3. Results and Discussion

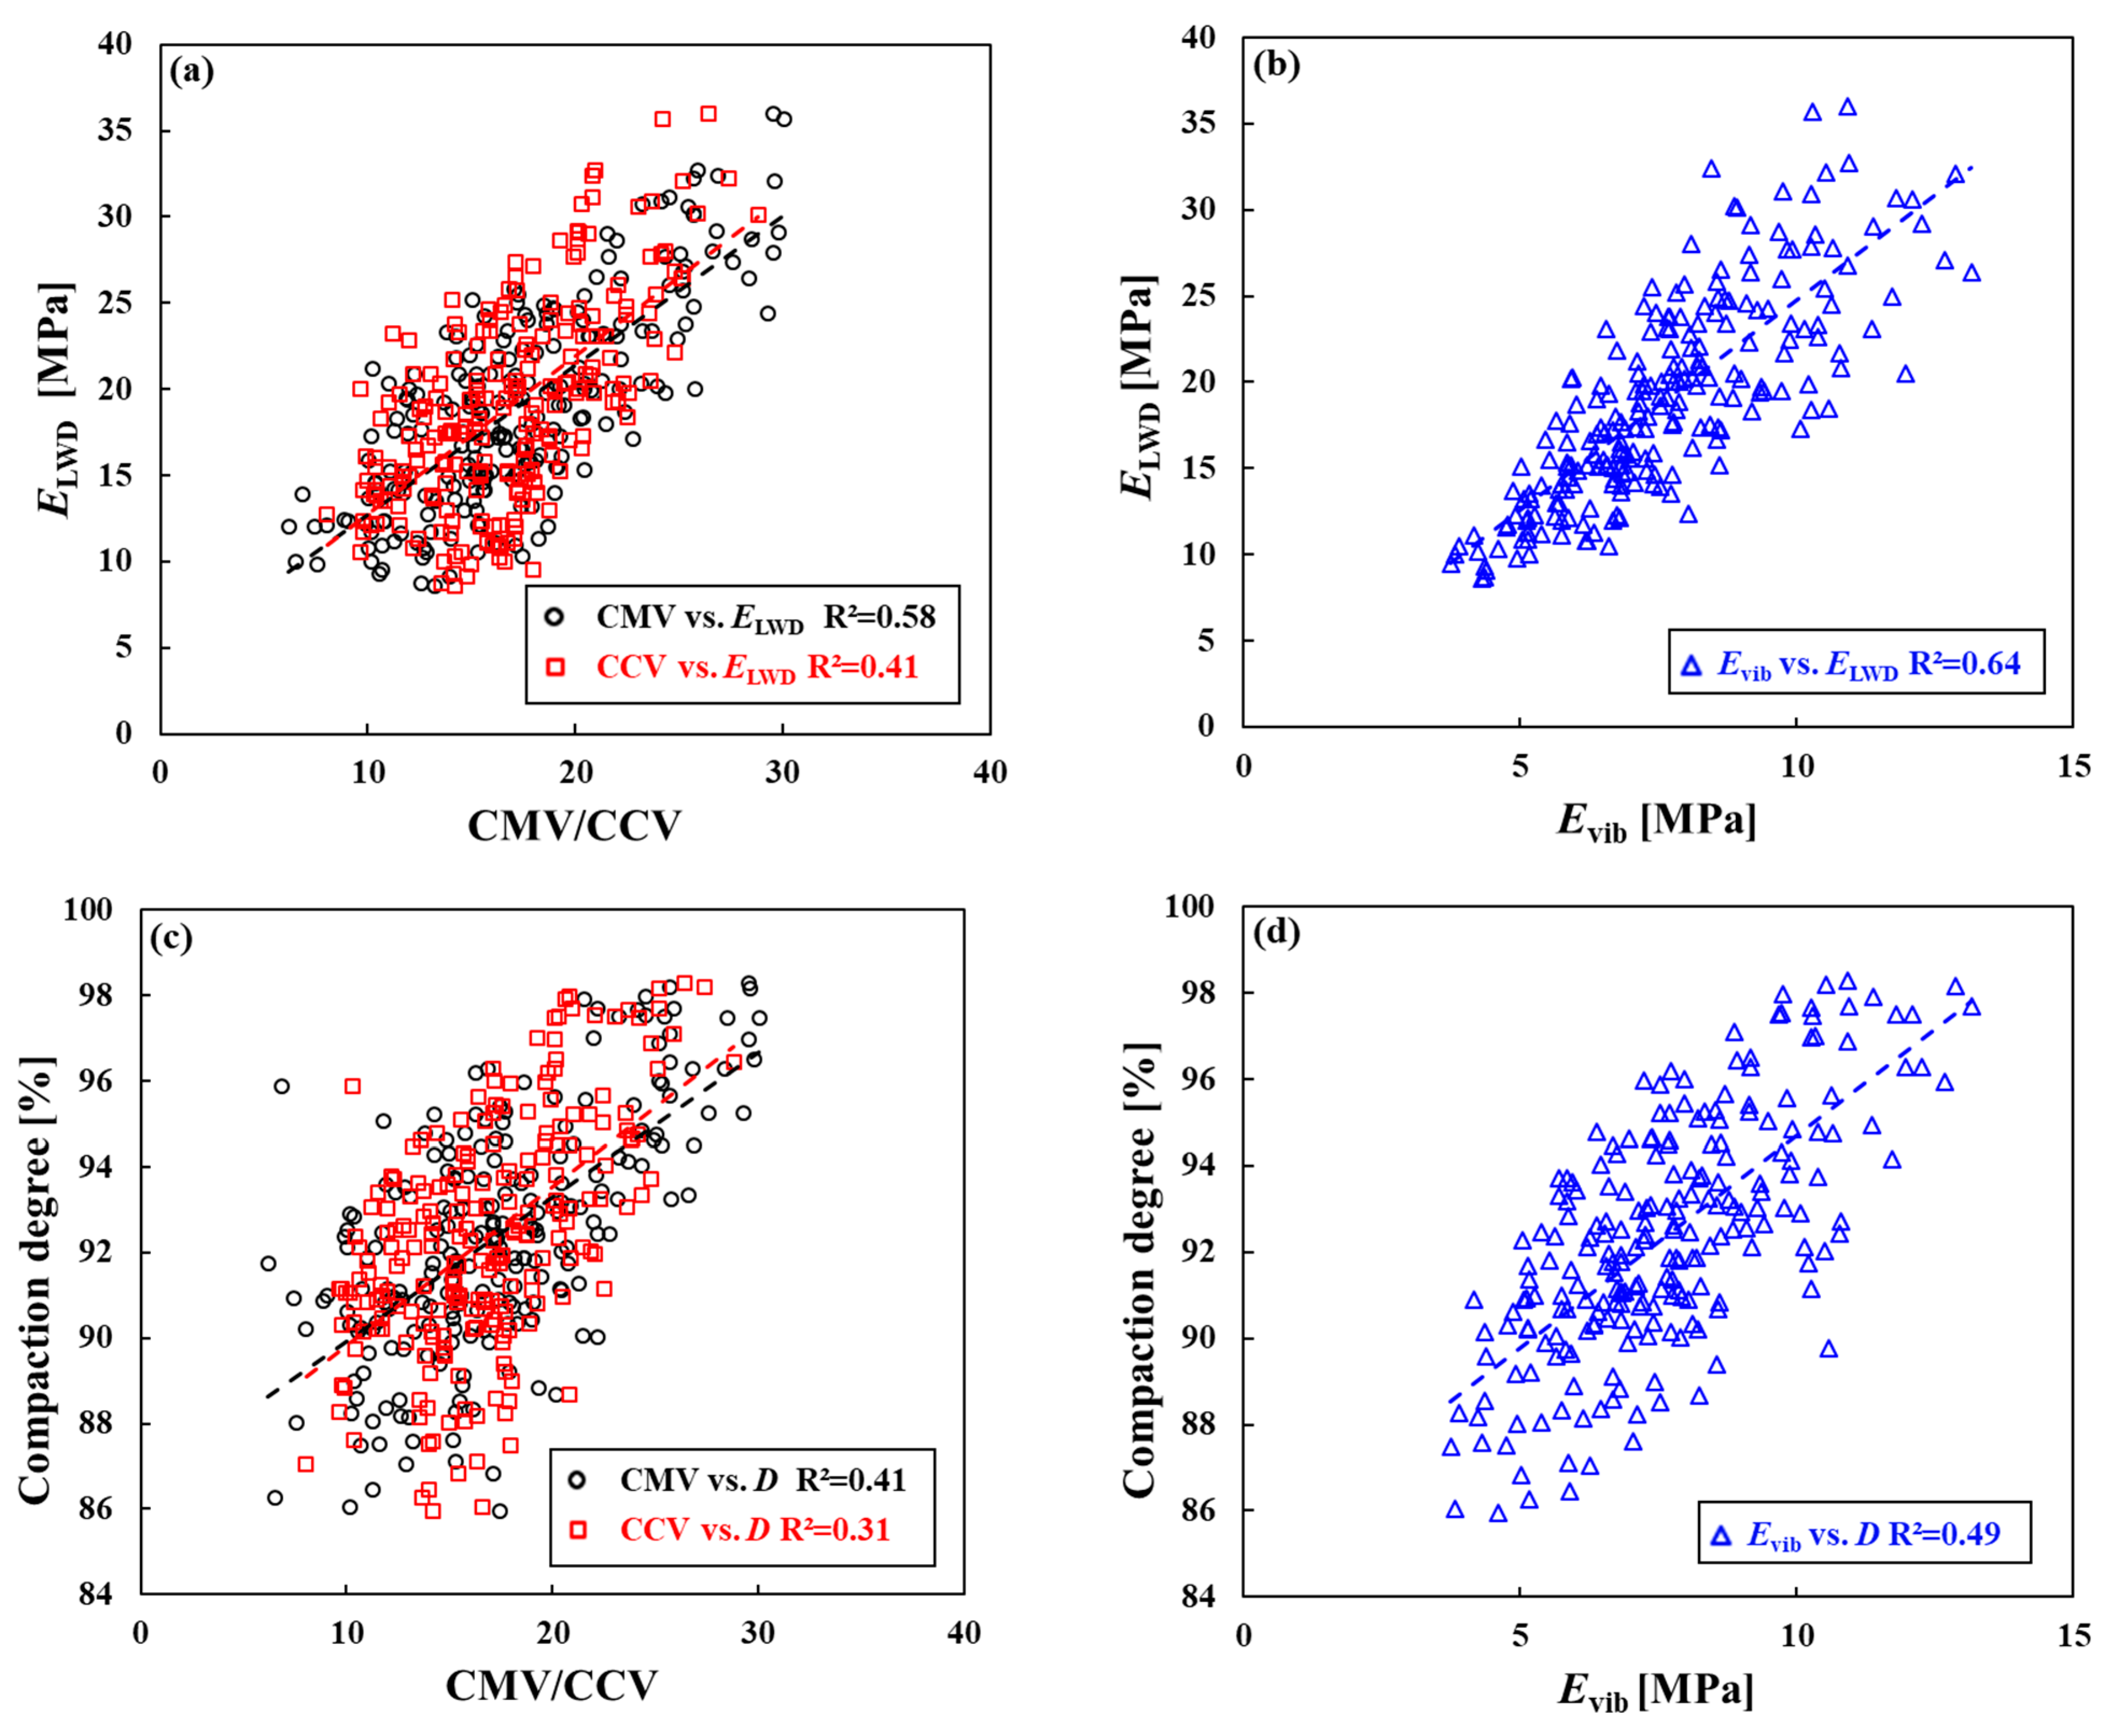
3.1. Regressions of Different ICMV

Different ICMV versus ELWD and compaction degree are plotted in Figure 7. As expected, R2 values of empirical method ICMV (CMV and CCV) were lower than the mechanical method ICMV (Evib). It means that using mechanical method ICMV to predict ISMV is more accurate than using empirical method ICMV. Besides, R2 values between ICMV and compaction degree were lower than the R2 values between ICMV and ELWD, indicating that ICMV reflected the stiffness of subgrade better than the density of subgrade.
Interestingly, the CCV, which considered the jumping situation by adding first subharmonic and higher-order harmonics, had the worse regression performance than CMV. The reason is that the stiffness of sand subgrade is relatively low, roller jumping phenomenon barely appears during compaction while higher-order harmonics and subharmonics contain little information about subgrade compaction state. In this case, introducing higher-order harmonics and subharmonics cannot improve the prediction accuracy of ICMV, but will probably import other unpredictable interference factors.

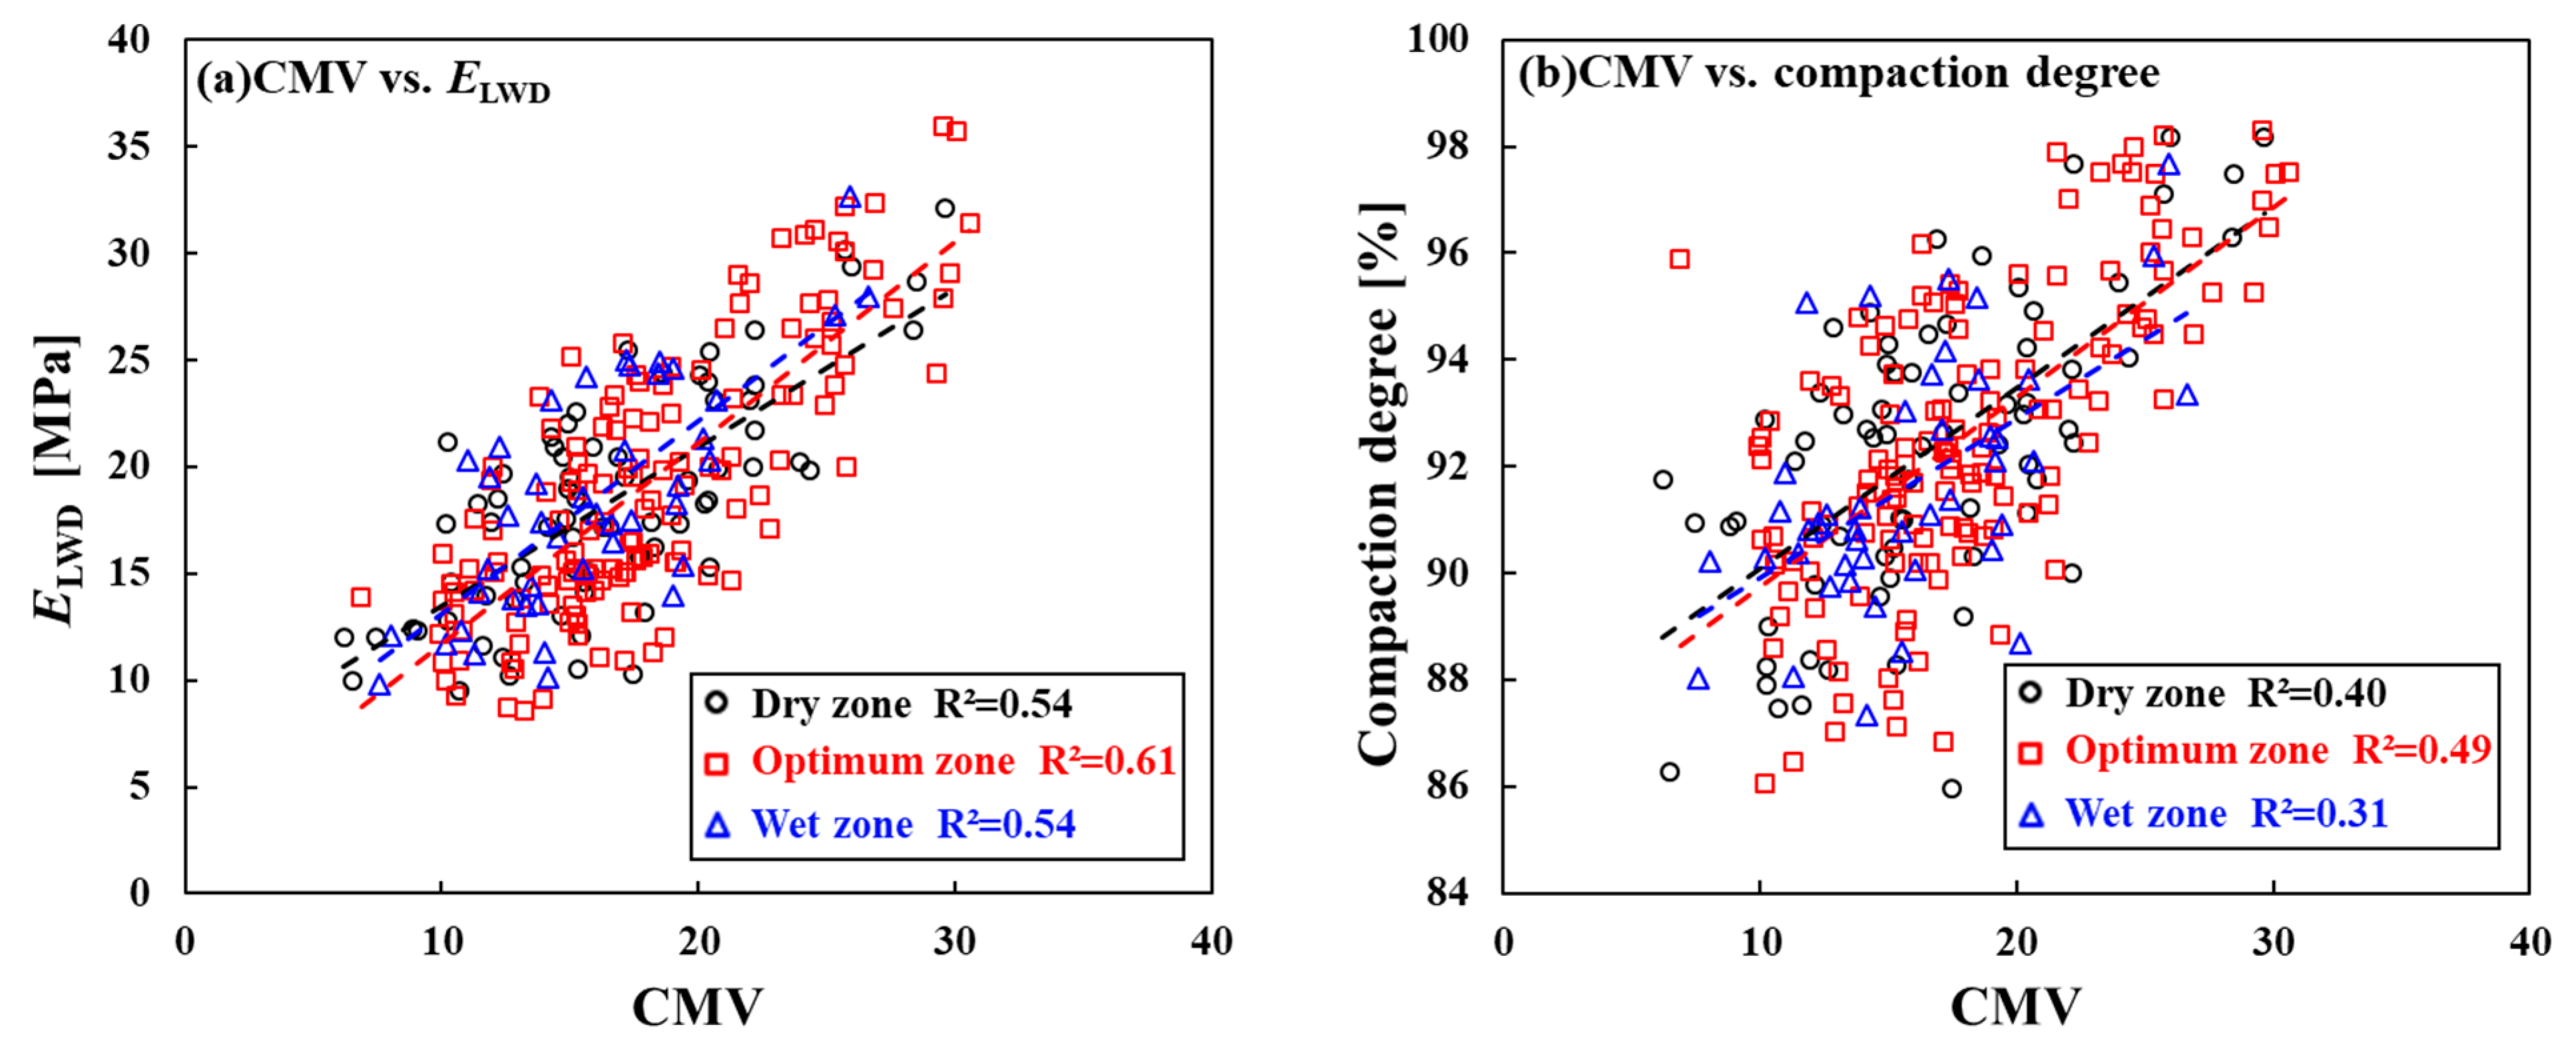
3.2. Influence of Roller Parameters and Subgrade Properties

Figure 8 shows the regression importance of roller parameters and subgrade properties (collectively called influence factors) obtained by RF algorithms. It could be seen that, in the regression of ICMV and ISMV, the importance of subgrade property was more significant than that of roller parameter while all of them should not be neglected. Particularly, when the regression target was compaction degree, the importance of w became apparent, even exceeded the importance of CMV and CCV.
In order to further explore the impacts of influence factors on the correlations between ICMV and ISMV, bivariate multiple-power regressions among ICMV, ISMV and influence factors were established (the independent variables are ICMV and influence factors while the dependent variable is ISMV). It should be noted that (a) only one influence factor was introduced in each regression analysis, as the influence regularity of factor could be revealed more adequately; (b) the power number of ICMV was set to 1 constantly because the nonlinear influence analysis of ICMV was not the focus of this section; (c) the power number of influence factors was set to be less than 4 because the fitting of higher power was lack of practical significance; (d) though the nonlinear influence could be revealed by other methods such as exponential and logarithmic regressions, he results of them were not exhibited here for simplicity. Determination coefficient R2 was used to characterize the effects of bivariate multiple-power regression. The results are shown in Table 4.
In Table 4, the fitting equation is a linear function when the power number of influence factor equal to 1 whereas the fitting equation is a nonlinear function of higher order when the power number is higher than 1. It can be observed that R2 values increased as the power number of w and v increased whereas the power number of Am and ku had almost no effect on R2 values. Therefore, it can be considered that the influence of w and v on correlations between ICMV and ISMV are nonlinear whereas that of Am and ku are linear.
Especially, considering the existence of optimal moisture content (OMC), the analysis data were divided into three zones with w to further study the influence of w: optimum zone (OMC ± 2%, i.e., w = 8.5~12.5%), dry zone (w < 8.5%) and wet zone (w > 12.5%). The monadic linear regressions between ICMV and ISMV in different zones were established and the results are shown in Figure 9. It can be seen that R2 values are relatively high at optimum zone compared to dry and wet zones. It also explains why the effect of w on the regression of ICMV and ISMV is nonlinear. Accordingly, if only relying on a monadic linear algorithm to establish the correlation between ICMV and ISMV, this paper suggests that the w of subgrade must be controlled within the optimum zone. However, such an approach constrains the convenience of IC technology application, therefore requiring the introduction of multiple regression algorithms. In the following, the multiple linear and nonlinear regression algorithms will be compared in order to determine the most appropriate one for IC technology.

3.3. Comparison of Regression Algorithms

Since the impacts of influence factors were complicated, nonlinear algorithms (including ML and DL algorithms) were adopted to establish the correlation between ICMV and ISMV when the influence factors were introduced. Figure 10 illustrates the correlation relationships between actual ISMV and the ISMV predicted by different nonlinear algorithms in the test sets (i.e., 20% of the total analysis data, the other 80% were used for training). For comparison, the regression results of multiple linear (MPL) algorithm are also plotted in Figure 10.
From Figure 10, nonlinear algorithms had more satisfactory R2 values and RMSE and showed better generalization performance compared to MPL algorithm. ANN showed the best performance among the nonlinear algorithms whereas the performance of RNN was the worst owing to the significant overfitting problem. In practice, the training time of RNN model was set as little as possible (only 500 times here) to avoid overfitting, but the effect was still far poorer than expected. Further, the performance of the RNN in the training set worsened as the training time was lessened, demonstrating that the RNN was inapplicable in the regression between ICMV and ISMV. Though the R2 values of LGBM was better than that of RF, its predicted values were smaller than real values led to the RMSE of LGBM was relatively high compared to RMSE of RF.
In order to predict the ISMV by ICMV more precisely, monadic linear regression was employed based on the predicted results of different algorithms. It means that the nonlinear algorithms or MPL are the primary learner whereas the monadic linear algorithm is the secondary learner. The predicted results are shown in Figure 11. From Figure 11, the predicted results were very close to actual values in terms of both numbers and trends after monadic linear regression. It demonstrates that ensemble learning is a simple and effective method to improve the accuracy of the regression between ICMV and ISMV [39]. Although the ensemble method was used, the predicted results of MLP were relatively disappointing compared to another algorithms. It indicates that, when the influence factors are introduced, the correlation relationships between ICMV and ISMV have not been characterized adequately if only the linear algorithms are used. In view of prediction accuracy, the combination of RF and linear algorithm is the most recommended regression method in IC application.

3.4. Limitations and Future Goals

The accuracy of the regression model between ICMV and ISMV is a crucial issue in the application of IC technology. Currently, in terms of input of regression model, previous studies had considered soil parameters and drum vibration signal separately, rather than comprehensively [40,41]. Regarding output, only compaction degree had been targeted for regression or classification, while the study of subgrade modulus was lacking [40,41,42]. For the perspectives of regression algorithm and regression features, this paper explores methods to improve the reliability of using ICMV to estimate compaction degree and subgrade modulus. Some conclusions that are beneficial to practical engineering are obtained. However, there are still some issues that need to be addressed:
  • This paper used moisture content as an input in the regression, but the continuous detection method of subgrade moisture content in practical engineering still needs further research. Therefore, when using the regression method proposed in this paper, moisture content can be removed from the regression input as appropriate, however, it will reduce the accuracy of ISMV estimation.
  • In the analysis of the drum vibration signal, this paper adopted the conventional indicators in the field of IC technology, namely CMV, CCV and Evib. Other parameters of vibration signal are not considered, such as shape factor, kurtosis, skewness etc. It may lead to the inadequacy of the analysis of vibration signals. Thus, further discussion and research are necessary to address this issue in future studies.

4. Conclusions

In this paper, the influence of roller parameters and subgrade properties (namely influence factors) on the correlation relationships between ICMV and ISMV were investigated combined with a construction applying IC technology in a highway subgrade project of China. Linear and 5 nonlinear regression algorithms were employed to predict ISMV based on ICMV, subgrade properties and roller parameters. Based on the analysis and discussion on results, the main conclusions can be drawn as follow:
  • From the monadic regression results of ICMV and ISMV, using mechanical method ICMV to predict ISMV was more accurate than using empirical method ICMV. R2 values between ICMV and compaction degree were lower than the R2 values between ICMV and ELWD. It meant that ICMV reflected the stiffness of subgrade better than the density of subgrade.
  • According to the feature importance, subgrade properties were more significant than roller parameters in the regression of ICMV and ISMV. Particularly, when the regression target was compaction degree, the importance of w even became higher than the importance of CMV and CCV.
  • The influence on correlations between ICMV and ISMV of ku and w were nonlinear whereas v and Am were linear. Therefore, multiple regression algorithms should be introduced into IC technology implementation to establish the correlation between ICMV and ISMV.
  • From the comparison among linear and 5 nonlinear algorithms, the results of RF had the best performance while the results of linear algorithms had the worst performance. Moreover, the combination of RF and linear algorithm could further improve the predicted accuracy.

Author Contributions

Conceptualization, J.Q.; Data curation, J.Y.; Formal analysis, B.Z.; Methodology, J.P.; Writing—original draft, J.P.; Writing—review & editing, J.Q. All authors have read and agreed to the published version of the manuscript.

Funding

This research was funded by: The Transportation Science and Technology Project of Jiangxi Province, China: Intelligent Compaction Technology for Integrated Subgrade and Pavement Design (No. 2020C0002), Department of Transportation of Jiangxi Province. The Transportation Science and Technology Project of Hebei Province, China: Research on Disaster Prevention and Control Technology for High Fill and Deep Excavation Subgrade of Taihang Mountain Highway (No. TH-201901), Department of Transportation of Hubei Province.

Data Availability Statement

Data is unavailable due to project privacy.

Conflicts of Interest

The authors declare no conflict of interest.

References

  1. Federal Highway Administration. FHWA/TPF Research Project Accelerated Implementation of Intelligent Compaction Technology for Embankment Subgrade Soils, Aggregate Base, and Asphalt Pavement Materials; Earthworks Engineering Research Center (EERC): Ames, IA, USA, 2011. [Google Scholar]
  2. Xie, Y.M. Control Principle and Technology of Subgrade Compaction and Variability Based on Vibration Response. Master’s Thesis, Tongji University, Shanghai, China, 2019. [Google Scholar]
  3. Mooney, M.A. Intelligent Soil Compaction Systems; NCHRP21-09 Final Report; Transportation Research Board: Washington, DC, USA, 2010. [Google Scholar]
  4. Zhang, D.; Jiang, H.; Gao, M.; Zhang, J.; Xiang, W.; Yan, X.; Guo, D.; Zhao, C.; Wu, L. Quality Acceptance Methods and Standards for Continuous Compaction Control Technology. Int. J. Transp. Eng. Technol. 2019, 5, 82–87. [Google Scholar]
  5. Upreti, K.; Leong, E. Dynamic Properties of Residual Soil over a Wide Range of Strain; Second Pan-American Conference on Unsaturated Soils: Dallas, TX, USA, 2018; pp. 388–397. [Google Scholar]
  6. Yoo, T.S.; Selig, E.T. Dynamics of Vibratory-Roller Compaction. J. Geotech. Eng. Div. 1979, 105, 1211–1231. [Google Scholar] [CrossRef]
  7. Tehrani, F.S. An Investigation of Continuous Compaction Control Systems. Ph.D. Thesis, The University of Delaware, Newark, NJ, USA, 2009. [Google Scholar]
  8. Vennapusa, P.K.R.; White, D.J.; Gieselman, H. Influence of Support Conditions on Roller-Integrated Machine Drive Power Measurements for Granular Base. In Contemporary Topics in Ground Modification, Problem Soils, and Geo-Support; ASCE Library: Orlando, FL, USA, 2009; pp. 425–432. [Google Scholar]
  9. Cacciola, D.V.; Meehan, C.L.; Baker, W.J.; Tehrani, F. A Comparison of Continuous Compaction Control Measurements with Localized In Situ Test Results; American Society of Civil Engineers IFCEE: Orlando, FL, USA, 2018; Volume 5, pp. 64–74. [Google Scholar]
  10. Xu, Q.W.; Chang, G.K. Adaptive Quality Control and Acceptance of Pavement Material Density for Intelligent Road Construction. Autom. Constr. 2016, 62, 78–88. [Google Scholar] [CrossRef]
  11. Graettinger, A.J.; Doherty, W.B.; Herron, M.; Siekmeier, J.; Petersen, L. Locating Soil Tests with Intelligent Compaction Data and Geographic Information System Technology. Transp. Res. Rec. 2018, 2310, 10–17. [Google Scholar] [CrossRef]
  12. Xue, Z.; Cao, W.; Liu, S.; Ren, F.; Wu, Q. Artificial Neural Network-Based Method for Real-Time Estimation of Compaction Quality of Hot Asphalt Mixes. Appl. Sci. 2021, 11, 7136. [Google Scholar] [CrossRef]
  13. Imran, S.A.; Barman, M.; Commuri, S.; Zaman, M.; Nazari, M. Artificial Neural Network-Based Intelligent Compaction Analyzer for Real-Time Estimation of Subgrade Quality. Int. J. Geomech. 2018, 18, 04018048.1–04018048.14. [Google Scholar]
  14. Ministry of Railways, PRC. Technical Specification for Continuous Compaction Control of Fill Engineering of Railway Earth Structure (Q/CR 9210-2015); China Railway Publishing House Co., Ltd.: Beijing, China, 2015.
  15. Tang, J.W.; Jiang, H.H.; Zhang, D.X.; Gao, M.X.; Wu, L.L.; Xiang, W.G. Technical Features and References of European and American Continuous Compaction Control Technical Regulations. J. Civ. Eng. Manag. 2020, 37, 59–66. [Google Scholar]
  16. Cai, H.B.; Kuczek, T.; Dunston, P.S.; Li, S. Correlating Intelligent Compaction Data to In Situ Soil Compaction Quality Measurements. J. Constr. Eng. Manag. 2017, 143, 4017038.1. [Google Scholar] [CrossRef]
  17. White, D.J.; Vennapusa, P.K.R.; Gieselman, H.H. Field Assessment and Specification Review for Roller-Integrated Compaction Monitoring Technologies. Adv. Civ. Eng. 2011, 2, 1–15. [Google Scholar] [CrossRef]
  18. Ling, J.; Lin, S.; Qian, J.; Zhang, J.; Han, B.; Liu, M. Continuous Compaction Control Technology for Granite Residual Subgrade Compaction. J. Mater. Civ. Eng. 2018, 30, 04018316.1–04018316.9. [Google Scholar] [CrossRef]
  19. Meehan, C.L.; Cacciola, D.V.; Tehrani, F.S.; Baker, W.J., III. Assessing Soil Compaction using Continuous Compaction Control and Location-Specific In Situ Tests. Autom. Constr. 2017, 73, 31–44. [Google Scholar] [CrossRef]
  20. Facas, N.W.; Rinehart, R.V.; Mooney, M.A. Development and Evaluation of Relative Compaction Specifications Using Roller-Based Measurements. Geotech. Test. J. 2011, 34, 102915. [Google Scholar]
  21. Hu, W.; Shu, X.; Huang, B.; Woods, M.E. An Examination of Compaction Meter Value for Asphalt Pavement Compaction Evaluation. Int. J. Pavement Eng. 2018, 19, 447–455. [Google Scholar] [CrossRef]
  22. Zhu, X.; Bai, S.; Xue, G.; Yang, J.; Cai, Y.; Hu, W.; Jia, X.; Huang, B. Assessment of Compaction Quality of Multi-Layer Pavement Structure Based on Intelligent Compaction Technology. Constr. Build. Mater. 2018, 161, 316–329. [Google Scholar] [CrossRef]
  23. Cao, L.P.; Zhou, J.; Li, T.; Chen, F.; Dong, Z. Influence of Roller-Related Factors on Compaction Meter Value and Its Prediction Utilizing Artificial Neural Network. Constr. Build. Mater. 2020, 268, 121078. [Google Scholar] [CrossRef]
  24. Caruana, R.; Niculescu, M.A.; Crew, G.; Ksikes, A. Ensemble Selection from Libraries of Models. In Proceedings of the Twenty-first International Conference (ICML 2004), Banff, AB, Canada, 4–8 July 2004; ACM: Banff, AB, Canada, 2004. [Google Scholar]
  25. Commuri, S.; Zaman, M. A Novel Neural Network-Based Asphalt Compaction Analyzer. Int. J. Pavement Eng. 2006, 7, 1–32. [Google Scholar] [CrossRef]
  26. Commuri, S.; Mai, A.T.; Zaman, M. Neural Network–Based Intelligent Compaction Analyzer for Estimating Compaction Quality of Hot Asphalt Mixes. J. Constr. Eng. Manag. 2011, 137, 634–644. [Google Scholar] [CrossRef]
  27. Nazarian, S.; Fathi, A.; Tirado, C.; Kreinovich, V.; Rocha, S.; Mazari, M. Evaluating Mechanical Properties of Earth Material During Intelligent Compaction; Research Report 933; NCHRP: Washington, DC, USA, 2020. [Google Scholar]
  28. Fathi, A.; Tirado, C.; Rocha, S.; Mazari, M.; Nazarian, S. A Machine-Learning Approach for Extracting Modulus of Compacted Unbound Aggregate Base and Subgrade Materials Using Intelligent Compaction Technology. Infrastructures 2021, 6, 142. [Google Scholar] [CrossRef]
  29. Ke, G.L.; Meng, Q.; Finley, T.; Wang, T.; Chen, W.; Ma, W.; Ye, Q.; Liu, T.Y. Lightgbm: A Highly Efficient Gradient Boosting Decision Tree. In Proceedings of the 31st Conference on Neural Information Processing Systems, Long Beach, CA, USA, 3–9 December 2017; pp. 3146–3154. [Google Scholar]
  30. Chen, T.Q.; Guestrin, C. XGBoost: A Scalable Tree Boosting System; ACM: San Francisco, CA, USA, 2016; pp. 785–794. [Google Scholar]
  31. Thurner, H.; Forssblad, L. The Compaction Meter-A Modern Method for the Surveillance and Control of Compaction. Rev. Gen. Routes Aerodr. 1979, 36, 67–71. [Google Scholar]
  32. Scherocman, J.A.; Rakowski, S.; Uchiyama, K. Intelligent Compaction, Does It Exist? Proc. Annu. Conf. Can. Tech. Asph. Assoc. 2007, 52, 373. [Google Scholar]
  33. Anderegg, R.; Kaufmann, K. Intelligent Compaction with Vibratory Rollers: Feedback Control Systems in Automatic Compaction and Compaction Control. Transp. Res. Rec. 2004, 1868, 124–134. [Google Scholar] [CrossRef]
  34. Kröber, W.; Floss, E.H.R.; Wallrath, W. Dynamic Soil Stiffness as Quality Criterion for Soil Compaction. In Geotechnics for Roads, Rail Tracks and Earth Structures; A. A. Balkema: Lisse, The Netherlands, 2001; pp. 189–199. [Google Scholar]
  35. Facas, N.W.; Paul, J.S.; Mooney, M.A. Influence of Rocking Motion on Vibratory Roller-Based Measurement of Soil Stiffness. J. Eng. Mech. 2010, 136, 898–905. [Google Scholar] [CrossRef]
  36. Abeywickrama, T.; Cheema, M.A.; Taniar, D. K-Nearest Neighbors on Road Networks: A Journey in Experimentation and In-Memory Implementation. Proc. VLDB Endow. 2016, 9, 492–503. [Google Scholar] [CrossRef]
  37. Svetnik, V. Random Forest: A Classification and Regression Tool for Compound Classification and Qsar Modeling. J. Chem. Inf. Comput. Sci. 2003, 43, 1947–1958. [Google Scholar] [CrossRef] [PubMed]
  38. Sun, Z.J.; Xue, L.; Xu, Y.M.; Zhang, L. Overview of deep learning. Appl. Res. Comput. 2012, 29, 8. [Google Scholar]
  39. Wu, L.L.; Jiang, H.H.; Tang, J.W.; Fan, S.F.; Yan, X.X. Continuous Compaction Monitoring Technology Based on Multiple Regression Analysis. Rock Soil Mech. 2020, 41, 2081–2090. [Google Scholar]
  40. Chen, C.; Hu, Y.B.; Jia, F.; Wang, X. Intelligent Compaction Quality Evaluation Based on Multi-Domain Analysis and Artificial Neural Network. Constr. Build. Mater. 2022, 341, 127583. [Google Scholar] [CrossRef]
  41. Wang, X.; Dong, X.; Zhang, Z.; Zhang, J.; Ma, G.; Yang, X. Compaction Quality Evaluation of Subgrade Based on Soil Characteristics Assessment using Machine Learning. Transp. Geotech. 2021, 32, 100703. [Google Scholar] [CrossRef]
  42. Wang, X.; Cheng, C.; Li, J.; Zhang, J.; Ma, G.; Jin, J. Automated Monitoring and Evaluation of Highway Subgrade Compaction Quality using Artificial Neural Networks. Autom. Constr. 2023, 145, 104663. [Google Scholar] [CrossRef]
Figure 1. Diagram of IC regression algorithms.
Applsci 13 05953 g001
Figure 2. (a) IC field test, (b) ring simpler method, (c) LWD test (diameter = 300 mm).
Applsci 13 05953 g002
Figure 3. Roller with IC equipment.
Applsci 13 05953 g003
Figure 4. The results of (a) standard Proctor test, (b) liquid-plastic limit test and (c) grain size analysis.
Applsci 13 05953 g004
Figure 5. (a) ISMV measured directly under roller accelerometer, (b) diagram of underlying soil stiffness ku.
Applsci 13 05953 g005
Figure 6. Structures of (a) ANN (7-56-1) and (b) RNN (7-42-42-1).
Applsci 13 05953 g006
Figure 7. Monadic linear regression results between different ICMV and ISMV, (a) CMV/CCV vs. ELWD, (b) Evib vs. ELWD, (c) CMV/CCV vs. compaction degree, (d) Evib vs. compaction degree. Note: D represents the compaction degree in the legend.
Applsci 13 05953 g007
Figure 8. Feature importance obtained by RF.
Applsci 13 05953 g008
Figure 9. Correlation of ICMV and ISMV at different moisture content zones, (a) CMV vs. ELWD, (b) CMV vs. compaction degree, (c) CCV vs. ELWD, (d) CCV vs. compaction degree, (e) Evib vs. ELWD, (f) Evib vs. compaction degree.
Applsci 13 05953 g009aApplsci 13 05953 g009b
Figure 10. Correlation between actual and predicted ISMV of different algorithms, (a,b) actual ELWD vs. predicted ELWD, (c,d) actual compaction degree vs. predicted compaction degree.
Applsci 13 05953 g010
Figure 11. Comparison of actual and predicted ISMV of different algorithms after monadic linear regression, (a,b) actual ELWD vs. predicted ELWD, (c,d) actual compaction degree vs. predicted compaction degree.
Applsci 13 05953 g011
Table 1. Roller Parameters.
WeightExcitation ForceFrequencyAmplitudeDrum WidthDrum Radius
21 t450 kN32 Hz1.10 mm2.2 m0.8 m
Table 2. Material Properties of Subgrade.
wopt from Standard Proctorγd from Standard ProctorNatural Moisture ContentLiquid LimitPlasticity
Index
CuCcCBRSoil Type
10.5%1.88 g/cm36~14%34%9.8%21.580.548.2SM
Table 3. Regression and classification algorithm models.
Linear AlgorithmsNonlinear Algorithms
Machine Learning (ML)Deep Learning (DL)
Linear regressionK-nearest neighbour (KNN) [36], Random forest (RF) [37], Light gradient boosting model (LGBM) [29]Artificial neural network (ANN), Recurrent neural network (RNN) [38]
Note: The hyper-parameters of models were automatically determined by GridSearchCV.
Table 4. Results of bivariate multiple-power regressions.
Type of ISMVType of ICMVInfluence FactorR2 of Different Power Number of Influence Factor
Power Number = 1Power Number = 2Power Number = 3
ELWDCMVw0.59910.63410.6766
v0.60070.64700.6862
Am0.60110.60140.6024
ku0.60890.60910.6094
CCVw0.43990.47530.4950
v0.43640.46820.4981
Am0.43140.43200.4335
ku0.43060.43090.4314
Evibw0.66170.69310.7535
v0.66620.70810.7746
Am0.65480.65630.6583
ku0.64890.65040.6512
Compaction degreeCMVw0.43610.47640.5308
v0.43920.47130.5236
Am0.44660.44620.4487
ku0.42740.42790.4293
CCVw0.33130.36670.4171
v0.3280.36290.4097
Am0.34810.34930.3504
ku0.33340.33890.3414
Evibw0.51580.55350.5901
v0.50930.54990.6004
Am0.51000.5180.5183
ku0.51170.51280.5128
Disclaimer/Publisher’s Note: The statements, opinions and data contained in all publications are solely those of the individual author(s) and contributor(s) and not of MDPI and/or the editor(s). MDPI and/or the editor(s) disclaim responsibility for any injury to people or property resulting from any ideas, methods, instructions or products referred to in the content.

