Abstract
One of the current focuses of modern bioinformatics is the development of hybrid models to process gene expression data, in order to create diagnostic systems for various diseases. In this study, we propose a solution to this problem that combines an inductive spectral clustering algorithm, random forest classifier, convolutional neural network, and alternative voting method for making the final decision about patient condition. In the first stage, we apply the spectral clustering algorithm to gene expression profiles using inductive methods of objective clustering, with the calculation of internal, external, and balance clustering quality criteria. This results in clusters of mutually correlated and differently expressed gene expression profiles. In the second stage, we apply the random forest classifier and convolutional neural network to identify the examined objects, containing as attributes the gene expression values in the allocated clusters. The presented research solves both binary- and multi-classification tasks. The final decision about the patient’s condition is made using the alternative voting method, considering the classification results based on the gene expression data in various clusters. The simulation results showed that the proposed technique was highly effective, achieving a high accuracy in object identification when both classifiers were used. However, the convolutional neural network had a significantly higher data processing efficiency than the random forest algorithm, due to its substantially shorter processing time.
1. Introduction
The modern artificial information processing systems used in various fields of intelligent data analysis and machine learning are mostly based on an analogy with the functioning of corresponding processes in biological organisms. Such processes include the functioning of gene networks, immune processes, the functioning of neural networks, and so on. The peculiarity of such systems is their high level of complexity, ability to learn, parallel processing of information, high level of security, and ability to recognize and make appropriate decisions. In this context, the development of modern artificial models for processing big data is possible with the use of a systemic approach, which involves the comprehensive application of knowledge and methods from various practical fields, such as molecular biology, mathematics, computer science, physics, and chemistry. Such approaches create conditions for increasing the objectivity of processing big data in real time, through the use of ensembles of methods, hybrid models, and effective quality criteria for assessing results at the corresponding stage of information processing implementation.
One of the current problems in modern bioinformatics is the processing of the gene expression data obtained in DNA microchip experiments [] or the more modern method of mRNA molecule sequencing []. The peculiarities of experimental data include a large number of genes that determine the state of the corresponding biological organism. As is well known, the number of expressed (active) genes that make up the human genome is approximately 25,000. At the same time, the number of each type of gene varies in the range from zero to hundreds of thousands. Creating medical diagnostic systems or models of gene regulatory networks using full data is not effective, because the process of interpreting the obtained results, in this case, is problematic.
Currently, deep learning models are actively used to process large datasets, such as deep neural networks [], convolutional neural networks [], and artificial deep networks [], which allow achieving a satisfactory diagnostic accuracy on large data, but at the same time, there are problems regarding the training time, network sensitivity, and verification of obtained models on other similar data. Solutions to the aforementioned problems are possible through the development and improvement of existing methods, models, and algorithms for processing large datasets. The implementation of this process involves the formation of quality experimental data by applying appropriate methods for normalizing gene expression values and reducing low-expressed genes in the first stage. The second stage involves the problem of forming subsets of differentially expressed and mutually correlated expression profiles of genes using hybrid models of high-dimensional data clustering. The third stage involves the development of a disease diagnostic model based on the formed clusters of gene expression profiles using deep learning methods, with corresponding verification of the obtained results.
This manuscript extends the authors’ previous work on gene expression data preprocessing [], comparative analysis of gene expression profile proximity metrics [], noninformative gene removal using statistical criteria and Shannon entropy [], and the formation of subsets of mutually correlated and differently expressed gene expression profiles through the joint application of various clustering and classification techniques [].
This manuscript presents the following main contributions:
- We introduce an inductive model of objective clustering, which utilizes a spectral clustering algorithm to generate subsets of gene expression profiles that are differentially expressed and mutually correlated.
- We propose and practically implement a hybrid model for diagnosing various types of cancer, which combines the inductive spectral clustering algorithm, the random forest classifier, a convolutional neural network, and the alternative voting method. This approach enhances the accuracy and objectivity of identifying an object’s state by parallelizing the information processing process.
2. Review of Literature
Many scientific works are currently devoted to applying intelligent data analysis and machine learning methods, including deep learning, for processing gene expression data to create diagnostic systems for various diseases. According to the findings in [], the authors introduced a method called an extremal learning machine (ELM) for categorizing gene expression data. This approach employs correlation analysis to identify helpful gene expression profiles. The authors achieved a binary classification accuracy of 79%. The study used 60 central nervous system tumors (including other types of tumor). However, it should be noted that a small dataset was used in the experiment, which may have affected the adequacy of the obtained results. Moreover, the effectiveness of the proposed model was evaluated based on only one dataset, which also does not contribute to the adequacy of the results. The accuracy of the obtained results was also not high, which is undoubtedly one of the drawbacks of the presented research results.
The research presented in [] explored using five distinct machine learning techniques for classifying gene expression data: the random forest algorithm, support vector machine, naive Bayes classifier, C4.5 decision trees, and k-nearest neighbor method. The study employed gene expression data from 358 patients with varying degrees of somatic mutations, sourced from The Cancer Genome Atlas (TCGA) database, to predict breast cancer. Among the methods used, the random forest algorithm achieved the highest accuracy of 70%, while the other machine learning techniques were found to be less precise.
In [], the authors explored the classification of two lung cancer subtypes, adenocarcinoma (AC) and squamous cell carcinoma (SCC), using classifiers based on the random forest algorithm and support vector machines (SVM). To identify informative genes, they employed Monte Carlo feature selection (MCSF) and incremental feature selection methods. The gene expression arrays used for modeling contained 20,502 genes from the Affymetrix GeneChip [], sourced from the Gene Expression Omnibus (GEO GSE43580) database. These data comprised 77 AC lung cancer samples and 73 SCC lung cancer samples. The results indicated that SVM achieved a higher accuracy when using 1100 optimal features (genes) for classification, compared to the 43 informative features (genes) obtained through MCSF. The accuracy rates dropped from 0.96 to 0.86 with SVM and from 0.93 to 0.88 with the random forest method. These findings highlight the significance of selecting informative gene expression profiles.
The findings of a study involving gene expression data obtained from lung adenocarcinoma samples, precisely 86 tumor samples and ten nontumor samples sourced from the Kent Ridge Biomedical Data Repository (available from []), are presented in []. The data comprised 7129 genes, and a subset of informative genes was formed using the mutual information estimation method. The model was trained using 70% of the samples, with the remaining 30% used for testing. Three binary classification methods were employed to detect the presence of tumors after identifying candidate genes directly related to lung cancer. Several selected genes were evaluated for their biological significance in lung cancer pathology, leading to the identification of six genes with high information gain that may be associated with lung cancer. These genes were then used as biomarkers for lung cancer classification in the proposed model using three classification methods: multi-layer perceptron (MLP), random sub-space (RSS), and sequential minimal optimization (SMO). The classification accuracy achieved with these methods was 87%, 68%, and 92%, respectively. However, it should be noted that the classification accuracy obtained in this study was also deemed unsatisfactory, which can be attributed to the model’s inability to perfectly form subsets of informative gene expression profiles.
The authors of [] introduced a feature selection strategy and a multigrain cascade forest classifier (gcForest) to predict four breast cancer subtypes. The modeling process employed RNA-Seq gene expression data from The Cancer Genome Atlas (TCGA). The proposed method aimed to enhance the classification accuracy and reduce the training time by selecting informative genes. To evaluate the effectiveness of gcForest, the classification results were compared with those of three well-known classifiers (KNN, SVM, and MLP). In the first stage of the study, the thirty most informative genes were selected. The modeling results revealed the higher efficiency of the gcForest algorithm compared to the other classifiers, with an accuracy of 0.92 achieved. However, a drawback of gcForest is that it requires discrete data, resulting in the loss of information and a decrease in data classification accuracy. Additionally, external data were not used to assess the adequacy of the proposed model in the presented studies.
In recent years, the growth of computing resources and their application in processing gene expression data has led to the widespread use of artificial intelligence methods based on deep learning (DL) [,,]. DL is a branch of machine learning that creates a structure with multiple levels, where the output of one level is the input of the next level. The DL network structure aims to emulate the mechanisms of the human brain in interpreting different types of data, such as sound, text, and images. DL uses principles similar to linear regression, where each neuron has a weighted value updated using the backpropagation algorithm, to minimize the global loss function. The application of DL has helped to overcome challenges in predicting cancer, by providing high accuracy in disease identification and faster analysis. The most common architectures of deep neural networks include convolutional neural networks (CNNs), recurrent neural networks (RNNs), and artificial neural networks (ANNs).
In [], the authors presented the results of their research on early cancer diagnosis using a deep neural network (DNN). The proposed model was tested on 37 different types of cancer using data from The Cancer Genome Atlas (TCGA), which contained the expression of 10,000 genes in 10,663 samples (9807 tumors and 856 normal samples). The authors investigated three different structures of deep neural network model: 3NN, 5NN, and 9NN. The performance of the proposed DNN model was compared to that of a support vector machine (SVM) model by calculating their accuracy of classifying the samples. The modeling results showed that the 5NN model achieved the highest diagnostic accuracy. However, it is worth noting that the disease identification accuracy was not high, and the model’s sensitivity to certain types of cancer was also limited, indicating that further refinement is necessary.
The findings of a study on cancer diagnosis using an ensemble of deep learning models are presented in []. The authors investigated the use of gene expression data from The Cancer Genome Atlas (TCGA) to diagnose lung, breast, and stomach cancers. The study included 162 lung cancer samples, 878 breast cancer samples, and 271 stomach cancer samples. The model achieved a diagnostic accuracy of 98% for all datasets. Despite this impressive result, there are significant drawbacks to the proposed model. First, it is highly complex and requires substantial time and computational resources for training. Second, interpreting this ensemble-based deep learning model is challenging.
After analyzing the research in this area, it can be concluded that there is currently no definitive solution to the problem of high-quality processing of gene expression data, for creating a diagnostic system for various diseases. However, we believe that this problem can be solved by employing a complex approach that combines modern methods of intelligent data analysis and machine learning with advanced information technologies for processing big data. In our research, we propose an approach to address this issue.
3. Material and Methods
3.1. Experimental Dataset Formation and Preprocessing
During the simulation process, gene expression data from The Cancer Genome Atlas (TCGA) [], obtained by applying RNA sequencing on the Illumina platform [], were used. Each initial data sample contained 19,947 types of genes as attributes, where the expression of each gene was determined by its activity level, which was proportional to the amount of the corresponding gene type. The experimental dataset contained nine types of data, eight of which corresponded to eight types of cancer, while the ninth type of data corresponded to samples for which no cancerous tumor was identified based on clinical trials. The total number of samples studied was 3269. Thus, at the initial stage of modeling, the gene expression matrix had the following form: 19,947). The classification of the experimental data used in the modeling process is presented in Table 1.

Table 1.
The classification of experimental gene expression data used in the modeling process.
At the initial stage, we removed uninformative gene expression profiles based on their absolute expression values, variance, and Shannon entropy, as outlined in []. This process resulted in the removal of 4814 gene expression profiles, resulting in a filtered gene expression value matrix in the following form: 14,451). These data were used in our research.
3.2. Application of an Objective Clustering Inductive Model Based on the Spectral Clustering Algorithm for Forming Subsets of Differentially Expressed and Mutually Correlated Gene Expression Profiles
We believe that the objectivity of identifying the object state can be enhanced by parallelizing the process of processing gene expression data. This can be achieved by forming subsets of differentially expressed and mutually correlated gene expression profiles, followed by classifying objects containing gene expression data in the selected clusters. The final decision is reached by analyzing the classification results of all clusters using an alternative voting system. Figure 1 shows a structural block diagram for implementing this procedure.
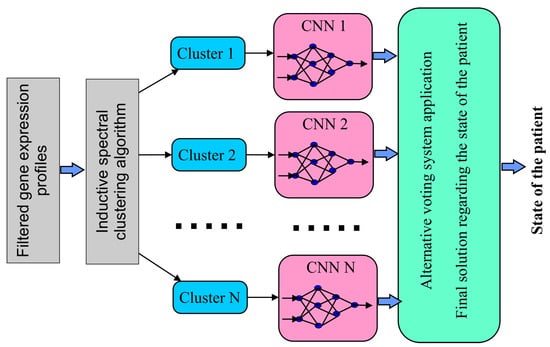
Figure 1.
Structural block diagram illustrating the step-by-step procedure for processing gene expression data in the diagnostic system of the investigated object.
The initial stage of the procedure illustrated in Figure 1 involves forming subsets of mutually correlated and differentially expressed gene expression profiles, by applying the inductive spectral clustering algorithm. The algorithm’s effectiveness for high-dimensional gene expression profiles clustering was demonstrated in []. To evaluate the proximity of gene expression profiles and clusters within the current modeling framework, we used a hybrid metric of gene expression profile proximity, based on mutual information maximization using various entropy calculation methods. The modified proximity metric is described in []. The minimum value obtained using this metric corresponds to the minimum distance between the corresponding gene expression profiles. Additionally, we employed this modified metric to estimate the closeness of gene expression profiles, clusters, and gene expression profiles and clusters.
The internal quality criterion used for clustering gene expression profiles considered the distribution within individual clusters in relation to the corresponding cluster’s median and the distribution of individual clusters (medians) in the feature space. The formula used to calculate the internal quality criterion for clustering in this case is given by:
where K is the number of clusters that form the cluster structure; (average distance within) is the average distance between gene expression profiles and the medians of the clusters in which these profiles are located:
where m is the total number of gene expression profiles; is the number of gene expression profiles in the k-th cluster; is the median of the k-th cluster; is the vector of expression values for the i-th gene; and is the value of mutual information (a higher value of mutual information corresponds to a smaller distance between gene expression profiles).
The second component of the criterion (1) is calculated as the average distance between all pairs of cluster medians that make up the cluster structure:
It is worth mentioning that a smaller value of criterion (1) indicates a better clustering based on this particular quality criterion. The methodology presented in [] was used to calculate the external and balance criteria.
The methodology for implementing the clustering algorithm within the inductive objective clustering framework, as presented in [,], involves the formation of two equivalent subsets of gene expression profiles using a corresponding distance metric. In this study, a modified distance metric, based on a complex application of different methods for maximizing mutual information, was used. The optimal cluster structure was formed by simultaneously applying the spectral clustering algorithm to equivalent subsets of gene expression profiles. The next stage involved forming the cluster structures, with the number of clusters ranging from 2 to 7. In each step, the internal quality criteria for clustering were calculated using Formulas (1)–(3), as mentioned earlier. The external quality criterion was calculated as the normalized difference between the internal criteria at each step of this procedure.
The reproducibility error that occurs during the process of forming the cluster structure was minimized with a smaller value of criterion (4). The balance criterion, which combines both internal and external quality criteria, was evaluated using Harrington’s desirability function, based on Algorithm 1 presented in [].
| Algorithm 1: Balance quality criterion value calculation |
 |
Figure 2 displays the simulation outcomes related to the identification of the most suitable cluster configuration.
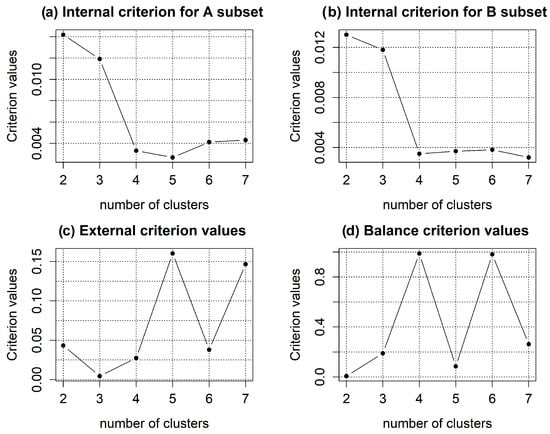
Figure 2.
Simulation results for determining the optimal cluster structure using the inductive algorithm of spectral clustering: (a,b) internal clustering quality criteria values depending on the number of clusters calculated on equivalent subsets A and B, respectively; (c) external clustering quality criterion; (d) balance criterion.
The simulation results for determining the optimal cluster structure are depicted in Figure 2. The findings confirmed the possible inconsistency between the internal and external clustering criteria in the process of creating the optimal cluster structure. The minimum value of the internal criterion corresponds to a five-cluster structure in subset A of gene expression profiles and a seven-cluster structure in subset B, as shown in Figure 2a,b. However, it should be emphasized that the difference between the values of the internal criteria within the range of the number of clusters from 4 to 7 is negligible. This finding indicates the complexity of selecting an optimal cluster structure based on the analysis of internal clustering quality criteria. The best structure in terms of reproducibility error is the three-cluster structure, since it has the minimum value of the external criterion, but the four- and six-cluster structures are also acceptable, according to the external criterion. The analysis of the balance criterion values, which include both internal and external clustering quality criteria components, suggests that the optimal structures are the four- and six-cluster structures, which correspond to the maximum value of the balance criterion.
The obtained results were validated by performing an object classification procedure using gene expression values and examining the three-, four-, five-, and six-cluster structures. Figure 3 depicts the distribution of gene expression profiles across the formed clusters.
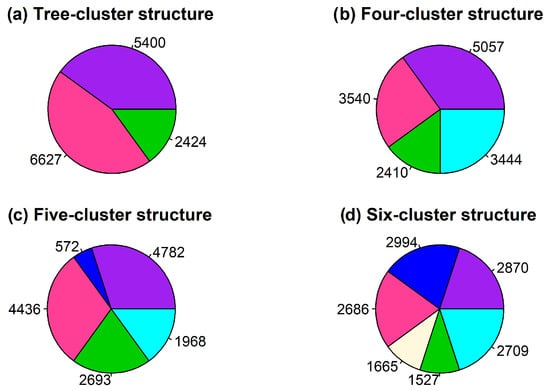
Figure 3.
Distribution pattern of gene expression profiles in clusters using the inductive spectral clustering algorithm.
Figure 3 reveals that the four- and six-cluster structures demonstrated an approximately uniform distribution of gene expression profiles in the formed clusters. This observation suggests a higher quality of distribution of the gene expression profiles in the clusters based on the criteria employed in the proposed model.
In the next stage, a convolutional neural network (CNN) was employed to analyze the gene expression data in the formed clusters. To correctly apply the CNN, the expression matrices were augmented with gene expression profiles containing zero values. The number of additional profiles was adjusted to make the total number of profiles a multiple of fifty, which is one of the parameters of the CNN filter.
4. Applying Convolutional Neural Network (CNN) to Gene Expression Data in Formed Clusters
Within the framework of the simulation process, we utilized a one-dimensional two-layer convolutional neural network to classify objects using gene expression data attributes in the formed clusters. The structure of the network and hyperparameter values were chosen based on the authors’ previous studies, as presented in []. The kernel size was set to 8, and the dense layer density was 256. The filter parameters for different cluster structures of the gene expression data are shown in Table 2. Similarly to their previous model, the authors divided the set of objects under investigation (3269) into three subsets. Whereby, 65% of the objects (2125) were used for training and validation, while 35% (1144) were used for testing. In this case, 70% of the objects from the first subset (1487) were used for network training, and 30% (638) were used for model validation.
Table 2.
Parameters of the filters used in the one-dimensional two-layer CNN.
Quality assessment of the model was performed by evaluating the nature of the changes in classification accuracy and loss function during the CNN training process, which were calculated with subsets of gene expression data used directly for training and validating the model. The adequacy of the model was evaluated by applying test data, with the calculation of classification quality criteria. Figure 4, Figure 5 and Figure 6 depicts the distribution characteristics of the respective classification quality criteria for samples calculated during modeling, when identifying the presence or absence of the corresponding disease using the gene expression data located in the highlighted clusters.
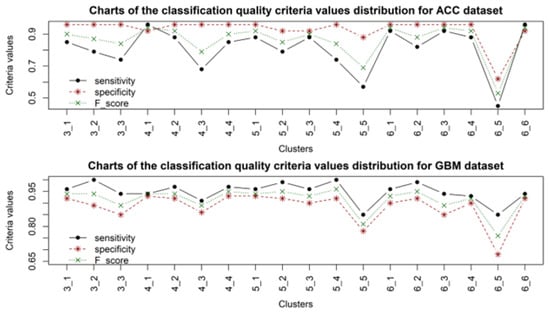
Figure 4.
Distribution diagrams of classification quality criteria values for samples of patients with ACC and GBM cancer, when using gene expression data from different clusters.
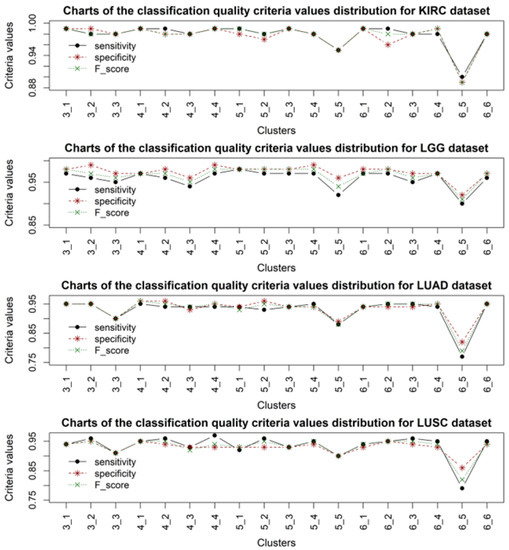
Figure 5.
Distribution diagrams of classification quality criteria values for samples of patients with KIRC, LGG, LUAD, and LUSC cancer, when using gene expression data from different clusters.
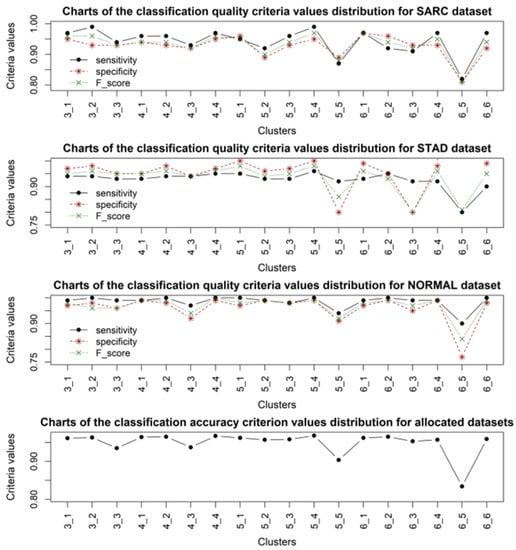
Figure 6.
Distribution diagrams of classification quality criteria values for samples of patients with SARC, STAD cancer, healthy patients (NORMAL), and classification accuracy of test data subsets, when using gene expression data from different clusters.
Analysis of the obtained results allowed us to identify a high convergence of the clustering quality criteria, the distribution of which for the obtained cluster structures is presented in Figure 2. It should be noted that, in almost all cases, the accuracy of sample classification was quite high, while in each cluster structure, one cluster of gene expression profiles could be distinguished, the application of which resulted in a lower classification accuracy compared to the other cases. According to the clustering criteria presented in Figure 2, the four- and six-cluster structures are optimal. According to the classification quality criteria, the four-cluster structure was the most stable for all types of sample studied. When using a six-cluster structure, five clusters provided a high classification accuracy according to the criteria used, while the fifth cluster yielded significantly lower results in sample classification. This fact indicates the adequacy of the distribution of gene expression profiles into clusters when forming the cluster structure. The results of sample classification using the four-cluster structure were the most stable for all types of data. However, it should be noted that the worst results for sample classification were obtained when using samples with ACC cancer. This can be explained by the smaller number of samples compared to the other types of data, which could undoubtedly have affected the model’s sensitivity. The best results were obtained when classifying samples for which cancer was not detected (NORMAL). The obtained results also indicated the feasibility of using an alternative voting system as the last step when making the final decision on the presence or absence of the corresponding disease, since decisions based on applying one set of gene expression data are not objective.
5. Application of an Alternative Voting System for Making the Final Decision about the State of the Examined Patients
The feasibility of using an alternative voting system in the stage of making a final decision regarding a patient’s health status was proven by the fact that the classification results obtained from different subsets of gene expression profiles formed during the clustering procedure could contradict each other. The clustering procedure involves the formation of subsets of gene expression profiles that are similar to each other based on corresponding metrics, and it is possible to form clusters of gene expression profiles that determine biological organism functional processes that are not directly related to the corresponding disease. Based on the simulation results presented in the previous section, when each clustering structure was applied, in most cases, the classification results of samples containing gene expression values of one of the clusters were lower compared to the results obtained when using data from other clusters; that is, the third cluster in three- and four-cluster structures, and the fifth cluster in five- and six-cluster structures. Obviously, this cluster can be disregarded when making a final decision regarding the patient’s condition. However, in this case, it is necessary to conduct a deep cluster analysis in each case when analyzing new data. Moreover, when using three- and four-cluster structures, the classification results obtained from the gene expression data of the third cluster were also quite high and may have affected the final decision regarding the presence or absence of the disease. The use of an alternative voting system involves using classification results obtained from all clusters, eliminating the need to choose the most informative clusters based on the disease’s discriminatory ability. This decision is made based on the consistency of the classification results from most clusters. In this instance, there are two possible cases:
- The sample belongs to the corresponding class (a corresponding type of cancer has been unambiguously identified or the patient has been recognized as healthy).
- The patient requires additional examination to determine their health status.
In the current modeling framework, the experimental gene expression data of patients results in an object classification belonging to the corresponding class when using data from two out of three clusters. For four- and five-cluster structures, the results must match based on the gene expression data from three out of any four clusters. In the case of a six-cluster structure, the number of such clusters must be at least four. If the classifier identifies different patient states based on gene expression data from different clusters, the patient’s condition is identified as undefined, indicating the need for further clinical studies.
It should be noted that increasing the number of clusters contributes to increasing the objectivity of making an adequate decision regarding the patient’s health status, by parallelizing the process of processing gene expression data, on the one hand, and increasing the number of possible alternatives, on the other.
5.1. Practical Implementation of the Binary Classification Model of Patient Health Status Based on a Multi-Cluster Structure of Gene Expression Data Using the Alternative Voting Method
The results of the binary classification of samples containing gene expression data using different cluster structures are presented in Figure 7.
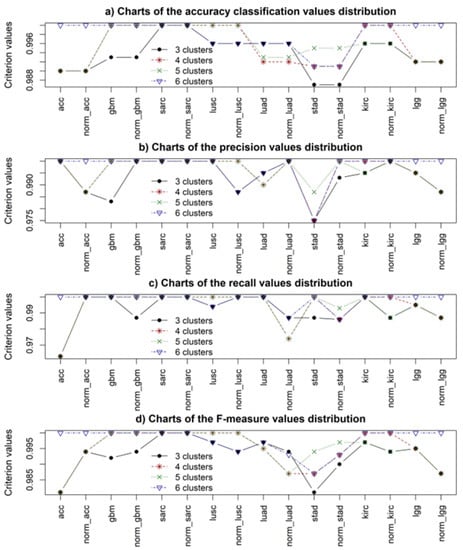
Figure 7.
Simulation results regarding the use of the random forest (RF) algorithm for binary classification of samples containing gene expression data from different cluster structures.
The random forest (RF) classification algorithm was used at this stage. The feasibility of using this type of algorithm was confirmed by the fact that the initial data were divided into subgroups during binary classification, and the number of samples in each group (considering the type of disease) was significantly less than the total number of samples. For such limited data, using a convolutional neural network is not reasonable. In addition, the feasibility of using the RF algorithm for the binary classification of samples based on gene expression data was demonstrated in []. The simulation procedure was carried out with the following steps:
- Formation of subsets of data, with samples corresponding to one type for each cluster structure. At this stage, nine subsets were formed, eight of which corresponded to different types of cancer, and the ninth subset contained gene expression data of patients for whom no disease was detected.
- Combination of subsets of gene expression data corresponding to different types of disease with the gene expression data of healthy patients. At this stage, eight subsets of gene expression data were formed for each cluster structure.
- Division of each data group into two subsets in a ratio of 0.65/0.35, with the first being used for model training and the second for model testing.
- Training the model by applying the RF algorithm to the first subset of data.
- Application of the model to test data. Calculation of binary classification quality criteria.
- Analysis of the obtained results.
The analysis of the obtained results allowed us to conclude that in all cases, the accuracy of binary classification of samples was quite high (ranging from 98 to 100 percent). More detailed analysis showed the higher effectiveness of the model when applying four- and six-cluster structures, which was consistent with the results of evaluating the quality of cluster structure based on the use of internal and external criteria for clustering quality. Analysis of the simulation results also allowed us to conclude that the best results were obtained when applying the six-cluster structure, which confirmed the feasibility of using the model to parallelize the gene expression data processing flow and to make a final decision on the object’s status by applying the alternative voting method. In this case, the importance of the previous stage of removing noninformative expression profiles based on statistical and entropy criteria and forming clusters of mutually correlated and differentially expressed gene expression profiles should be noted.
5.2. Practical Implementation of a Multiclass Model for Identifying the Health Status of Patients Based on a Multi-Cluster Structure of Gene Expression Data Using the Method of Alternative Voting
The practical implementation of a multiclass model for identifying the health status of patients (identification of the presence or absence of a particular type of cancer) based on the data presented in Table 1 was carried out by applying two types of classifier: a classifier based on the RF algorithm, and a convolutional neural network (CNN). The procedure for implementing this process involved the following steps:
- Formation of experimental data for each cluster structure in the form of a matrix, where the rows were samples under investigation, and the columns were the gene expression values of the corresponding cluster profiles. When using the data in Table 1, the total number of samples was 3269.
- Splitting the data into two subsets, also in a ratio of 0.65/0.35.
- Applying the classifier to the data used to train the model (65% of the total number of samples).
- Testing the model by applying test data. Forming generalized classification results for each cluster structure in the form of a matrix, where the rows were the samples that made up the test subset of data, and the columns were the classification results for each cluster of the current cluster structure.
- Forming the final classification result by applying the alternative voting method to the resulting matrix. According to the procedure described in the previous section, sample identification was based on the consistency of classification results using gene expression data from most clusters. If there was a discrepancy in the classification results, the sample was identified as undefined, requiring further clinical research for its objective identification.
- Calculation of classification quality criteria based on unambiguously identified samples.
- Analysis of the obtained results.
5.2.1. Results of Patient State Diagnosis Based on the Use of the Random Forest Algorithm
Figure 8 presents the simulation results using the random forest algorithm applied to gene expression data from different cluster structures.
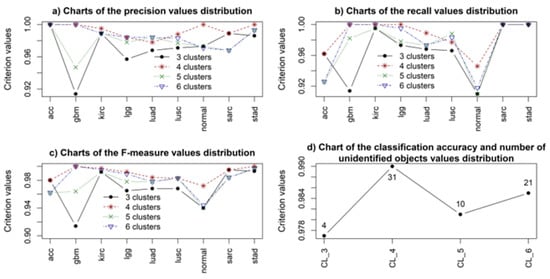
Figure 8.
Simulation results regarding the use of the random forest algorithm to solve the multi-class problem of identifying the health status of patients investigated for different types of cancer.
As mentioned above, the classification results were evaluated on test datasets. Analysis of the results allowed concluding that, based on the classification quality criteria, the four- and six-cluster structures are more attractive than the three- and five-cluster structures. This is consistent with the spectral clustering algorithm results (Figure 2). However, it should be noted that, out of the 1140 samples used to test the model, the state of 31 and 21 samples in the case of using the four- and six-cluster structures, respectively, was identified as undefined. This means that, in these patients, the type of cancer was not identified unambiguously, requiring further clinical studies to identify the disease type.
The analysis of the simulation results also indicated the higher effectiveness of using the four-cluster structure for identifying the type of cancer. Analysis of the classification quality criteria values for samples corresponding to different types of cancer and the health state of patients (Figure 8a–c) suggested higher values and a better stability of these criteria when using the four-cluster structure compared to using other cluster structures. However, it should be noted that, when using the four-cluster structure, the state of a relatively large number of objects (31 out of 1140) was identified as undefined, which is undoubtedly a drawback of the RF-based model. Another significant drawback was the large amount of time required to train the model. The current training of data for each model (when using each cluster structure), took about 80 h.
5.2.2. Results of Patient State Diagnosis Based on the Use of Convolutional Neural Network
In the current modeling to identify the type of cancer or patient state, a one-dimensional two-layer convolutional neural network (CNN) was used. The kernel size was set at 8, and the density of the dense layer was set to 256. The parameters of the filters used when using gene expression data from different cluster structures are presented in Table 2. The data distribution for training and testing the model was the same as in the previous models: 65% of the data were used for network training, and 35% (1140 samples) were used for testing. The simulation results regarding the application of CNN for classifying samples that made up the test data subset are presented in Figure 9.
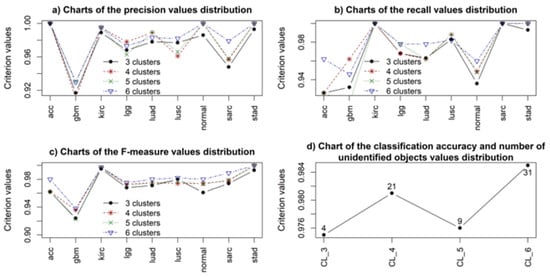
Figure 9.
The simulation results regarding the application of CNN for solving the multi-class problem of identifying the state of patients studied for different types of cancer.
The analysis of the simulation results allowed us to conclude that using four- and six-cluster structures when applying the CNN is also more attractive for identifying the type of cancer compared to three- and five-cluster structures. However, the difference in the sample identification results in the case of using CNN was significantly smaller compared to using the random forest algorithm classifier. Moreover, it should be noted that the training time for the CNN model was significantly shorter compared to the random forest algorithm classifier. The analysis of the simulation results also allowed us to conclude that using the six-cluster data structure when applying CNN allowed for better and more stable classification results for all samples and corresponding to all types of cancer, including samples from patients in whom cancer was not detected. However, it should be noted that, in the case of using the six-cluster structure, the state of 31 samples out of 1140, which made up the test data, was identified as undefined, which means that the results of applying different gene expression data clusters may contradict each other when determining the type of cancer. In this case, additional clinical research is necessary to determine the patient’s state or type of cancer unambiguously.
The results obtained regarding using a CNN for identifying the state of the investigated object based on gene expression data indicated the high effectiveness of the diagnostic system utilizing a CNN as a classifier. The use of the complete set of gene expression data also allowed obtaining a high accuracy of data classification, but questions may arise regarding the objectivity of the results. The formation of clusters of differentially expressed and mutually correlated gene expression profiles increases the objectivity of decision-making regarding the state of the object, by parallelizing the information flow, forming intermediate decisions based on gene expression data from different clusters, and making a final decision on the state of the corresponding object using an alternative voting method.
A comparative analysis of the simulation results obtained using the random forest algorithm and the CNN for gene expression data allowed us to conclude that both models were highly effective, but as mentioned above, the CNN’s training time was significantly shorter. If the random forest model was trained on the data for approximately 70 h, then the CNN model was trained for approximately 10 min. However, in terms of the classification accuracy and criteria values determining the first and second types of errors, the four-cluster structure when using the random forest algorithm allowed for better object identification results compared to the six-cluster structure when using the CNN. In both cases, 31 objects were identified as undefined.
6. Conclusions
In this study, we have presented the research results of creating a model for a diagnostic system used to assess the state of patients with various types of cancer. Gene expression data obtained through RNA sequencing on the Illumina platform were used as experimental data. Each sample of the initial data contained 14,451 types of genes as attributes. The experimental dataset consisted of nine types of data, eight of which corresponded to eight types of cancer, and the ninth corresponded to samples for which cancer was not identified based on clinical trials. The total number of studied samples was 3269.
We have proposed a hybrid inductive model for forming differentially expressed and mutually correlated gene expression profiles based on a spectral clustering algorithm. It was shown that internal and external clustering quality criteria did not allow us to adequately form the cluster structure. As a result, a balance clustering quality criterion was proposed, which includes both internal and external quality criteria as components. It was shown that four- and six-cluster structures were optimal according to the balance criterion. Assessment of the model adequacy for forming clusters of differentially expressed and mutually correlated gene expression profiles was performed by applying a classifier to samples containing gene expression data in the formed clusters as attributes. The random forest algorithm and convolutional neural network solved binary classification and multiclass identification tasks, respectively. In both cases, the clustering results were confirmed in terms of identifying optimal cluster structures in the previous stage of step-by-step data processing of gene expression profiles.
The results presented of the practical implementation of a hybrid model for diagnosing different types of cancer based on joint application of the inductive spectral clustering algorithm, the random forest algorithm, a convolutional neural network, and the alternative voting method allowed increasing the accuracy and objectivity of object identification, by parallelizing the information processing process. It was shown that a high accuracy of object identification was achieved when both classifiers were used, but the convolutional neural network had a significantly higher data processing efficiency compared to the random forest algorithm, due to a significantly shorter time for data processing.
The future prospects of the authors’ research include applying the proposed model to other datasets containing the results of the investigation of various types of disease.
Author Contributions
The individual contributions of the authors were as follows: Conceptualization, formal analysis, resources, writing—review and editing: S.B., L.Y.-D. and I.L.; methodology, software (R-programming), validation, statistical analysis and investigation, writing—original draft preparation: S.B. Results visualization: L.Y.-D. and I.L. All authors have read and agreed to the published version of the manuscript.
Funding
This research received no external funding.
Institutional Review Board Statement
The study was conducted in accordance with the Declaration of Helsinki, and approved by the Institutional Ethics Committee of Kherson State University, Ukraine (protocol No. 4 of 12 April 2023).
Informed Consent Statement
Not applicable.
Data Availability Statement
The gene expression datasets of patients examined on various types of cancer disease are freely available online at https://www.cancer.gov/about-nci/organization/ccg/research/structural-genomics/tcga.
Acknowledgments
We thank the team of researchers from the Center for Cancer Genomics at the National Cancer Institute, National Institutes of Health The Cancer Genome Atlas (TCGA) for the possibility of both downloading and applying the gene expression datasets for patients investigated for various types of cancer.
Conflicts of Interest
The authors declare no conflict of interest.
Abbreviations
The following abbreviations are used in this manuscript:
| CNN | Convolutional Neural Network |
| ELM | Extremal Learning Machine |
| TCGA | The Cancer Genome Atlas |
| SVM | Support Vector Machines |
| AC | Adenocarcinoma |
| SCC | Squamous Cell Carcinoma |
| MCSF | Monte Carlo Feature Selection |
| SMO | Sequential Minimal Optimization |
| MLP | Multilayer Perceptron |
| RSS | Random Subspace |
| DL | Deep Learning |
| OCIT | Objectice Clustering Inductive Technology |
| RF | Random Forest |
References
- Zhang, Y.; Zhang, Y.; Zhu, L.; He, P.; Wang, Q. A microchip electrophoretic assay for DNA methyltransferase activity based on methylation-sensitive endonuclease dpn II. Electrophoresis 2019, 40, 425–430. [Google Scholar] [CrossRef] [PubMed]
- Akrami, S.; Tahmasebi, A.; Moghadam, A.; Ramezani, A.; Niazi, A. Integration of mRNA and protein expression data for the identification of potential biomarkers associated with pancreatic ductal adenocarcinoma. Comput. Biol. Med. 2023, 157, 106529. [Google Scholar] [CrossRef] [PubMed]
- Chen, S.; Qiu, J.; Yang, H.; Yuan, W.; Gao, Z. Deep learning for inverse design of low-boom supersonic configurations. Adv. Aerodyn. 2023, 5, 13. [Google Scholar] [CrossRef]
- Meng, F.; Ren, T.; Liu, Z.; Zhong, Z. Toward earthquake early warning: A convolutional neural network for repaid earthquake magnitude estimation. Artif. Intell. Geosci. 2023, 4, 39–46. [Google Scholar] [CrossRef]
- Alhendi, A.; Al-Sumaiti, A.S.; Marzband, M.; Kumar, R.; Diab, A.A.Z. Short-term load and price forecasting using artificial neural network with enhanced markov chain for ISO new england. Energy Rep. 2023, 9, 4799–4815. [Google Scholar] [CrossRef]
- Babichev, S.; Durnyak, B.; Zhydetskyy, V.; Pikh, I.; Senkivskyy, V. Techniques of DNA microarray data pre-processing based on the complex use of bioconductor tools and Shannon entropy. CEUR Workshop Proc. 2019, 2353, 365–377. [Google Scholar] [CrossRef]
- Babichev, S.; Yasinska-Damri, L.; Liakh, I.; Durnyak, B. Comparison analysis of gene expression profiles proximity metrics. Symmetry 2021, 13, 1812. [Google Scholar] [CrossRef]
- Liakh, I.; Babichev, S.; Durnyak, B.; Gado, I. Formation of Subsets of Co-expressed Gene Expression Profiles Based on Joint Use of Fuzzy Inference System, Statistical Criteria and Shannon Entropy. Lect. Notes Data Eng. Commun. Technol. 2023, 149, 25–41. [Google Scholar]
- Babichev, S.; Yasinska-Damri, L.; Liakh, I.; Škvor, J. Hybrid Inductive Model of Differentially and Co-Expressed Gene Expression Profile Extraction Based on the Joint Use of Clustering Technique and Convolutional Neural Network. Appl. Sci. 2022, 12, 11795. [Google Scholar] [CrossRef]
- Kumar, C.A.; Ramakrishnan, S. Binary classification of cancer microarray gene expression data using extreme learning machines. In Proceedings of the 2014 IEEE International Conference on Computational Intelligence and Computing Research, Coimbatore, India, 18–20 December 2014; pp. 1–4. [Google Scholar]
- Vural, S.; Wang, X.; Guda, C. Classification of breast cancer patients using somatic mutation profiles and machine learning approaches. BMC Syst. Biol. 2016, 10, 264–276. [Google Scholar] [CrossRef] [PubMed]
- Yuan, F.; Lu, L.; Zou, Q. Analysis of gene expression profiles of lung cancer subtypes with machine learning algorithms. Biochim. Biophys. Acta Mol. Basis Dis. 2020, 1866, 165822. [Google Scholar] [CrossRef] [PubMed]
- Affymetrix GeneChip. System for Gene Expression Analysis. Available online: https://www.thermofisher.com/cz/en/home/life-science/microarray-analysis.html (accessed on 12 November 2019).
- Cano, A. Kent Ridge Biomedical Data Set Repository. Retrieved from ELVIRA Biomedical Data Set Repository. 2019. Available online: http://leo.ugr.es/elvira/DBCRepository/ (accessed on 2 March 2019).
- Pati, J. Gene expression analysis for early lung cancer prediction using machine learning techniques: An eco-genomics approach. IEEE Access 2019, 7, 4232–4238. [Google Scholar] [CrossRef]
- Xu, J.; Wu, P.; Chen, Y.; Zhang, L. Comparison of Different Classification Methods for Breast Cancer Subtypes Prediction. In Proceedings of the 2018 International Conference on Security, Pattern Analysis, and Cybernetics (SPAC), Jinan, China, 14–17 December 2018; pp. 91–96. [Google Scholar]
- Zhang, W.J.; Yang, G.; Lin, Y.; Ji, C.; Gupta, M.M. On definition of deep learning. In Proceedings of the World Automation Congress (WAC), Stevenson, WA, USA, 3–6 June 2018; pp. 1–5. [Google Scholar]
- Le Cun, Y.; Bengio, Y.; Hinton, G. Deep learning. Nature 2015, 521, 436–444. [Google Scholar] [CrossRef] [PubMed]
- Zhu, W.; Xie, L.; Han, J.; Guo, X. The Application of Deep Learning in Cancer Prognosis Prediction. Cancers 2020, 12, 603. [Google Scholar] [CrossRef] [PubMed]
- Divate, M.; Tyagi, A.; Richard, D.J.; Prasad, P.A.; Gowda, H.; Nagaraj, S.H. Deep Learning-Based Pan-Cancer Classification Model Reveals Tissue-of-Origin Specific Gene Expression Signatures. Cancers 2022, 14, 1185. [Google Scholar] [CrossRef] [PubMed]
- Xiao, Y.; Wu, J.; Lin, Z.; Zhao, X. A deep learning-based multi-model ensemble method for cancer prediction. Comput. Methods Programs Biomed. 2018, 153, 1–9. [Google Scholar] [CrossRef] [PubMed]
- El. Resource. Available online: https://www.cancer.gov/about-nci/organization/ccg/research/structural-genomics/tcga (accessed on 2 March 2022).
- El. Resource. Available online: https://www.illumina.com/ (accessed on 14 April 2022).
- Yasinska-Damri, L.; Babichev, S.; Spivakovsky, A.; Lemeshchuk, O. Formation and Analysis of Gene Expression Data Based on the Joint Use of Data Mining and Machine Learning Techniques. In Proceedings of the CEUR Workshop Proceeding, IntelITSIS’2023: 4th International Workshop on Intelligent Information Technologies and Systems of Information Security, Khmelnytskyi, Ukraine, 22–24 March 2023; Volume 3373, pp. 87–98. [Google Scholar]
- Babichev, S.; Durnyak, B.; Pikh, I.; Senkivskyy, V. An Evaluation of the Objective Clustering Inductive Technology Effectiveness Implemented Using Density-Based and Agglomerative Hierarchical Clustering Algorithms. Adv. Intell. Syst. Comput. 2020, 1020, 532–553. [Google Scholar]
- Yasinska-Damri, L.; Babichev, S.; Durnyak, B.; Goncharenko, T. Application of Convolutional Neural Network for Gene Expression Data Classification. In Lecture Notes in Data Engineering, Computational Intelligence, and Decision Making; Springer: Berlin/Heidelberg, Germany, 2023; Volume 149, pp. 3–24. [Google Scholar]
- Babichev, S.; Škvor, J. Technique of Gene Expression Profiles Extraction Based on the Complex Use of Clustering and Classification Methods. Diagnostics 2020, 10, 584. [Google Scholar] [CrossRef] [PubMed]
Disclaimer/Publisher’s Note: The statements, opinions and data contained in all publications are solely those of the individual author(s) and contributor(s) and not of MDPI and/or the editor(s). MDPI and/or the editor(s) disclaim responsibility for any injury to people or property resulting from any ideas, methods, instructions or products referred to in the content. |
© 2023 by the authors. Licensee MDPI, Basel, Switzerland. This article is an open access article distributed under the terms and conditions of the Creative Commons Attribution (CC BY) license (https://creativecommons.org/licenses/by/4.0/).