1. Introduction
The processes of implementing innovative projects require individualized action on many levels at the same time. However, these are essential steps for the development of the company and can bring significant results. The specific character of small-batch production requires the effective creation of new value for the customer as early as the innovation conception stage, against the reality of limited inputs at subsequent stages of the project. Small-batch production is a relatively poorly defined area of project management. There is still insufficient knowledge of the creation and implementation of technological innovations in the production environment.
This article aims to present an original method for implementing technological innovation in the aspect of designing the concept of technological innovation, and then evaluating and selecting the optimal variant of the solution. The research goal was realized on the basis of the development of a model of conduct in processes related to the design and selection of innovations, and a proposal for the technical preparation of production allowing the implementation of innovative solutions and control of technological processes under conditions of variable demand and small-batch production.
To implement this project, several methods combined provide a comprehensive approach to creating an innovative concept and then effectively managing the innovation project. The first method that was used was the Blue Ocean Strategy business concept, which focuses on value innovation with the aim of creating new value for customers. Creating a value proposition was another of the applied approaches; according to the authors of this concept, the value proposition should be based on an implementable business model that captures the projected value for the organization. Useful for the preparation and launch of new products and services is the Quality Function Development method. To evaluate and select the optimal solution, an approach was developed using the classical method of evaluating solution options, complemented by a risk assessment using fuzzy logic. The final stage involved the presentation of issues related to the technical preparation of production.
The developed solution is an integrated approach to project management with a focus on sustainable practices, which can ensure the long-term development and success of the organization. The proposed approach combines aesthetics with technical efficiency and ecology. In this way, it not only meets the needs of a specific group of stakeholders, but takes into account the wider impact. This paper presents a change in innovation project management. The requirement to achieve effective solutions in the shortest possible time in a production environment is necessary, and therefore the proposed methodology is the response to this situation.
2. Methods of Designing Innovative Product and Process Concepts
An especially interesting approach at the concept stage is the application of the schemes and procedures described in the Blue Ocean Strategy concept. The approach defined as the Blue Ocean Strategy was developed by W. Chan Kim and Renée Mauborgne [
1,
2] based on a study of 150 strategic moves for 30 industries. The Blue Ocean Strategy (BOS) concept is a breakthrough compared to conventional thinking in the field of strategic management [
3]. BOS is now one of the greatest discoveries in the area of strategy, often used by practitioners in the business world. The main idea of this concept says that instead of trying to outperform competitors in already known market spaces, so-called ‘red oceans’, it is necessary to explore previously unreached market spaces, so-called ‘blue oceans’ [
4]. Unfortunately, there is relatively limited knowledge of the methodology for implementing BOS in organizations [
5].
The Blue Ocean Strategy consists of a series of tools [
6,
7]. The Strategy Canvas has the form of a diagnostic diagram and helps to monitor the situation in the market space. This tool allows discernment of existing competitive factors. The diagram helps to understand the analyzed company’s strategic profile [
8].
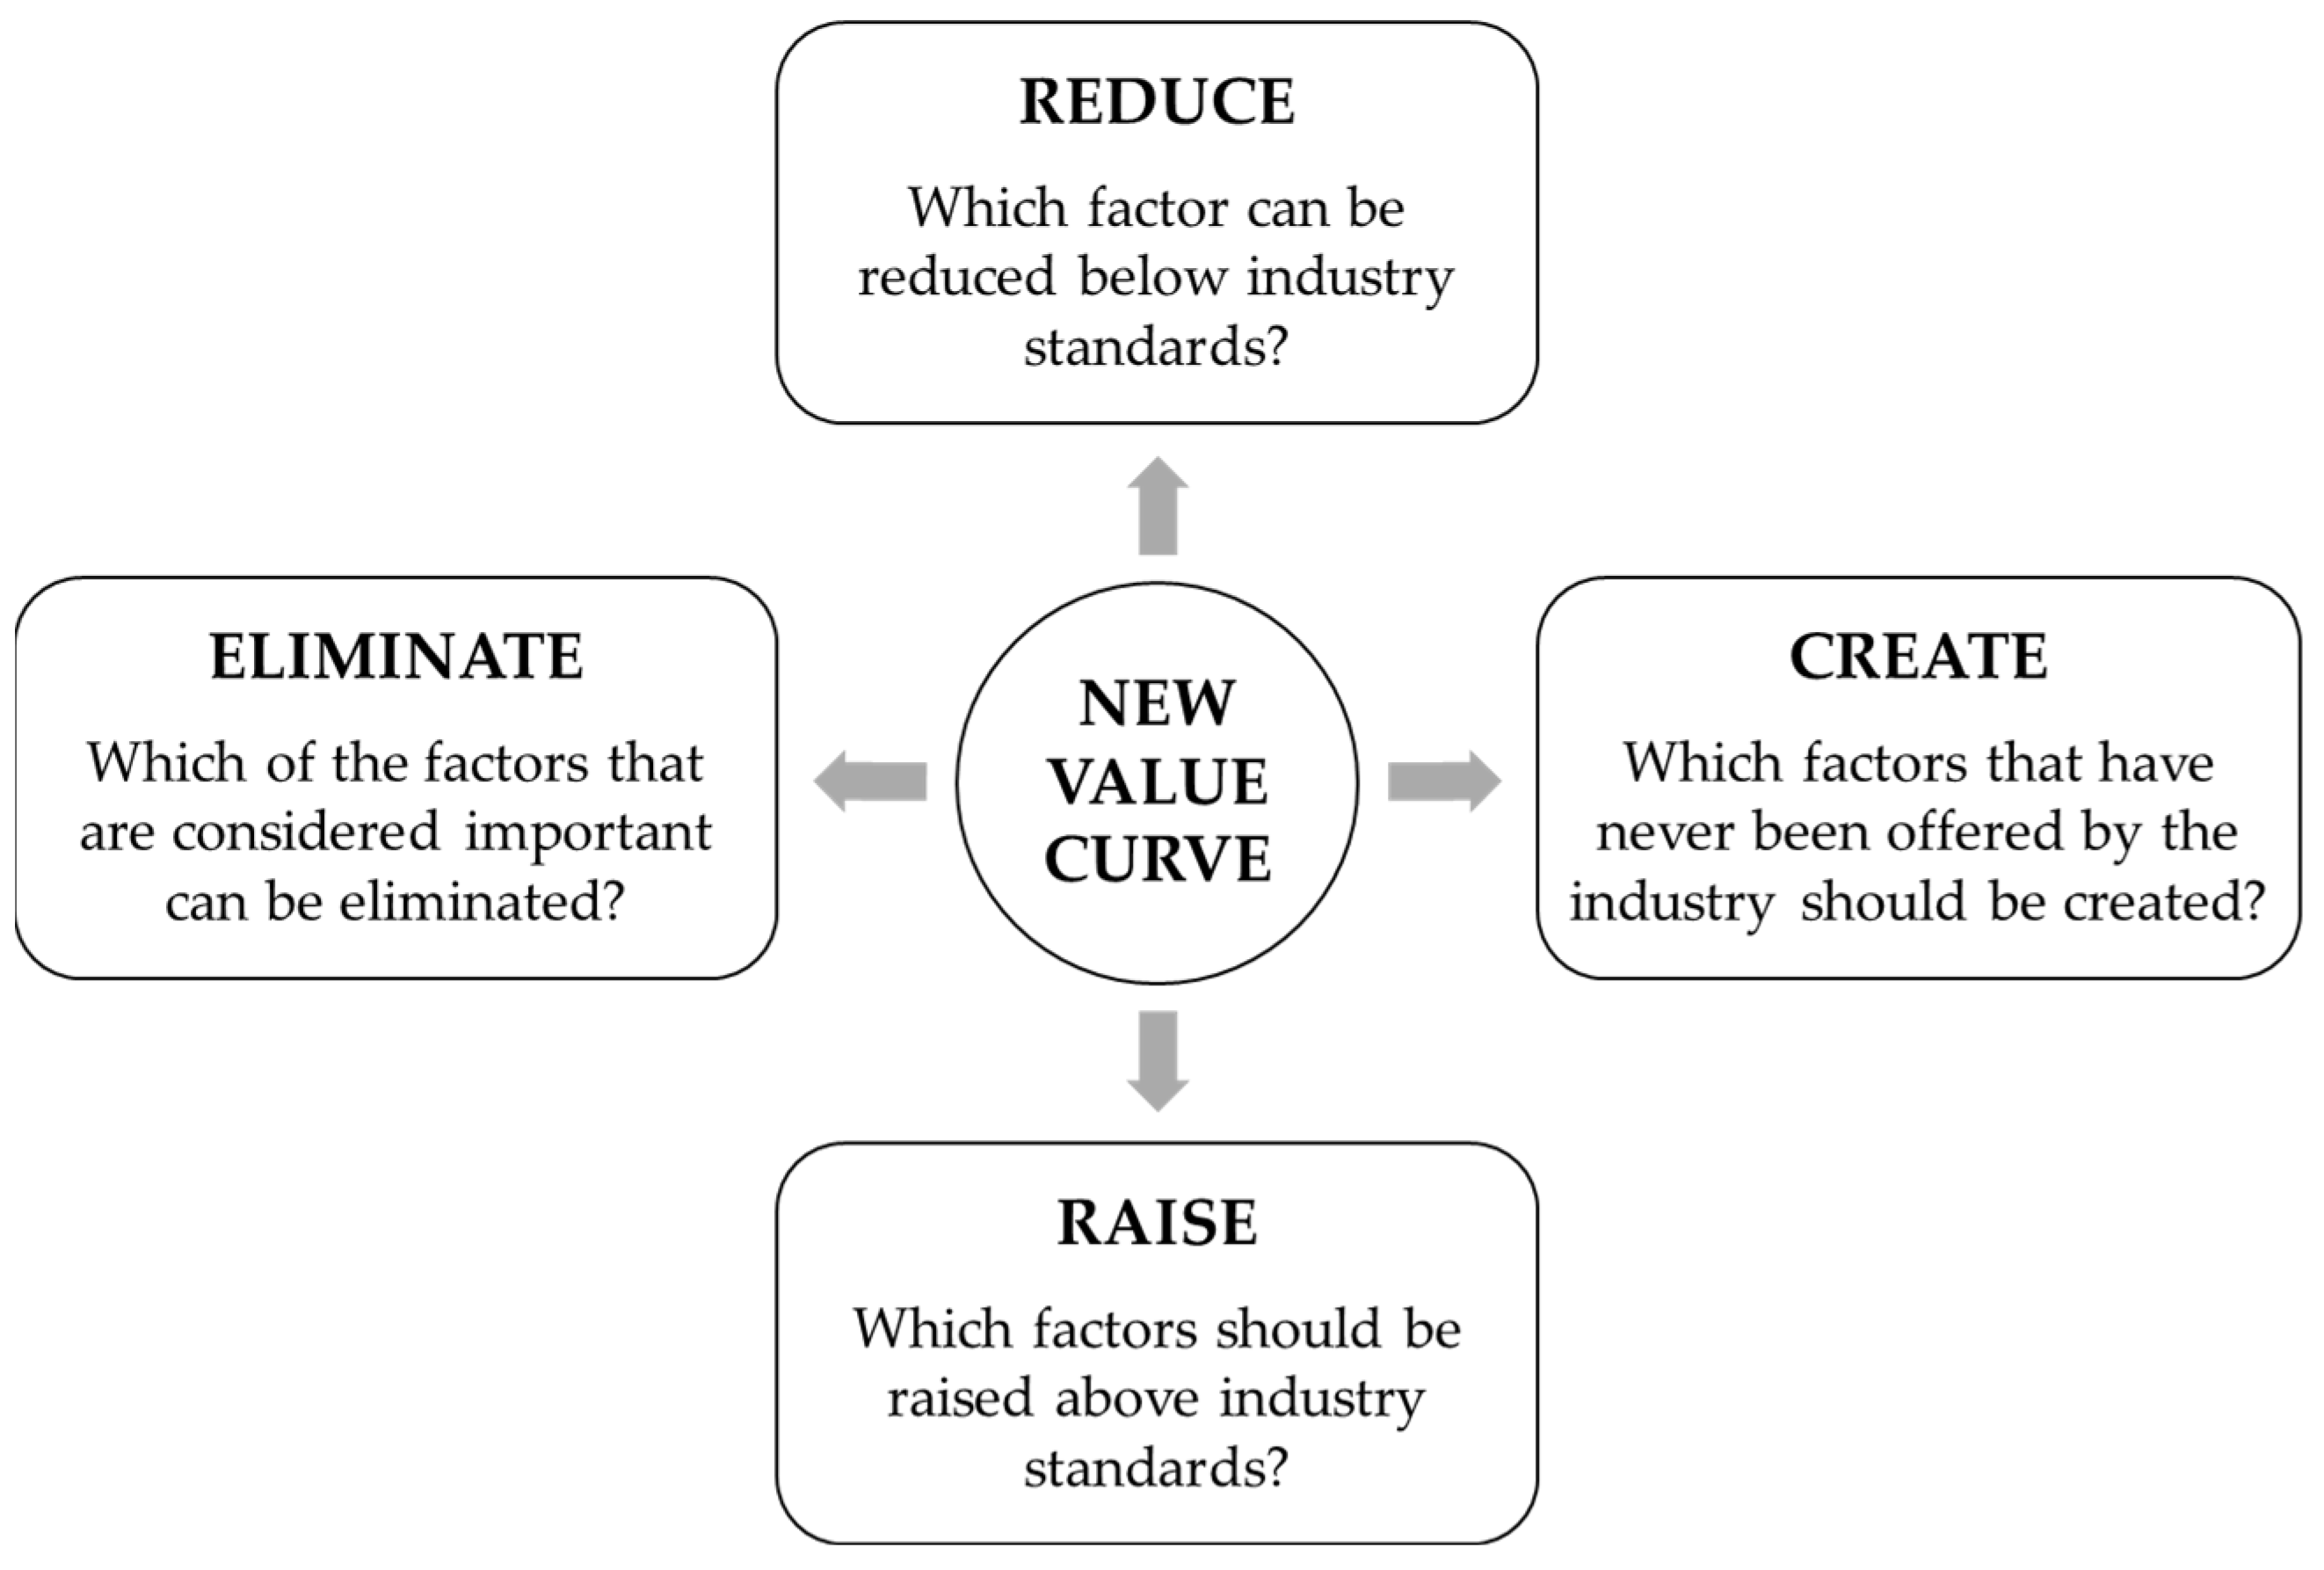
The next tool, the Four Actions Framework, is related to this. The answers to the questions asked within the Four Actions Framework result in analysis and the possibility of changing the elements of value—
Figure 1 [
9].
Reconstructing market boundaries is the rule that allows the creation of the Blue Ocean Strategy. The Six Paths Framework presents six approaches to transforming market boundaries—
Table 1. The outcome of these activities should be a move away from a defined industry and evaluation through the perspective of broader strategic customer groups [
1,
2].
To visualize the strategy following the BOS, four steps should be used [
1,
2]—
Table 2.
Another principle of the Blue Ocean Strategy is to reach beyond existing demand. To maximize the size of the blue ocean, companies need to take the opposite direction and should look at non-customers and realize their potential—
Figure 2 [
12].
Maximizing the size of the blue ocean is a sequence of formulating and evaluating the blue ocean idea. The starting point is the buyer experience cycle, where each stage is evaluated in terms of highlighted levels of usability. Using thirty-six boxes, it is possible to highlight where the weaknesses are. The second step is to determine the right strategic price for the company. Trying to secure the revenue side leads to the third element—cost. The final step is to address implementation difficulties [
14].
According to Alexander Osterwalder and Yves Pigneur [
15,
16], the value proposition should be based on an implementable business model that captures the projected value for the organization. The matrix developed by the authors mentioned above—the Business Model Canvas—is one of the simplest ways to develop a fully functional business model. Business models represent the aspects, and interactions between them, that a company takes into account when creating and delivering its value proposition [
17]. A good business model should create value and be implementable. A Business Model Canvas is one of the easiest ways to develop a fully functional business model—
Figure 3.
The Business Model Canvas and another tool, the Value Proposition Canvas, are connected; this second tool is key to the first, as it allows looking at the definitions of building value for customers. A value proposition is defined as a general view of a company’s range of products and services that are valuable from the customer’s point of view [
19]. The Value Proposition Canvas focuses on understanding the customer through the ‘customer profile’ and developing a value proposition tailored to that customer in a ‘value map’—
Figure 4 [
20].
Quality Function Development (QFD) is one of the most effective methods for converting consumer requirements into technical features in product quality. It is a sequence of steps to help transform quality indicators into technical requirements—
Figure 5 [
21].
Thus, it becomes an area of knowledge exchange between designers and those responsible for customer service. The QFD method is based on filling in an analytical matrix, called a House of Quality because of its characteristic shape. The diagram contains defined fields, the number of which depends on the nature, complexity of the task, and the formulated objective [
23]. The assumption of QFD is that the focus is on customer needs [
24].
The main principle and, simultaneously, the advantage of QFD is the development of products based on consumer requirements [
25]. As a result of this method, the product quality required by consumers can be guaranteed [
26].
3. Evaluation and Selection of Optimal Solution Options
Today’s production systems need to be flexible and risks should be kept to a minimum [
27]. Risk analysis involves identifying hazards, and determining the probability of the identified hazards, the size of the potential impact, and an indicator of the level of risk. The level of detail required in the risk analysis depends on the specific application, data availability, and the needs of the organization [
28].
Innovation processes and their implementation are subject to a significant level of risk caused by the unpredictability of the results of implemented innovations or difficulties in forecasting. The high uncertainty of the occurrence of risks of different nature is important, because in the case of innovation processes, the final collection of risks in given situations may be different. The level of risk, its nature, and frequency of occurrence may be different in each phase and depend on the specifics of a particular situation [
29]. The goal of multi-criteria decision making is to determine the best solution by considering more than one criterion in the selection process [
30]. The main purpose is to support people who make decisions when several possible solutions exist for a problem [
31].
The simplicity of implementation is one of the main advantages of the classical evaluation method. This approach requires formal conditions regarding the selection of experts or the choice of criteria. In this method, the skills and qualifications of the evaluator have a significant impact on the final result [
32].
Fast progress brings with it increased risks of intensifying innovation barriers. Fuzzy theory can be applied to the uncertainty that is related to risk assessment [
33]. Fuzzy logic is widely implemented for risk assessments [
34,
35]. Wide application of fuzzy logic to real-world problems has already been subjected to research [
36]. Fuzzy logic is used to solve problems that are characterized by significant uncertainty and ambiguity [
37].
Fuzzy logic was developed in the 1960s by Dr. Lotfi Zadeh. Fuzzy logic not only consists of extreme cases of truth (0 or 1), but also includes various states of truth in between [
38]. Research on fuzzy set theory and its application has grown in recent years. However, some fundamental questions still need to be answered [
39].
A fuzzy set
A in some (non-empty) space
X, which is written as
A ⊆
X, is called a set of pairs:
where
is the membership function of a fuzzy set Bold is not necessary on symbols in equations and text.
This function assigns to each element x ∈ X its degree of membership of the fuzzy set A, whereby three cases can be distinguished:
μA (x) = 1 means full membership of the fuzzy set A, i.e., x ∈ A,
μA (x) = 0 means no membership of an element x in the fuzzy set A, i.e., x ∉ A,
0 < μA (x) < 1 means partial membership of the element x to the fuzzy set A.
Decision-support systems allow the evaluation of performance and enable decisions to be made about project implementation [
40].
Current trends in manufacturing are based on the configurability of production, as the most important factor influencing the existing production environment is the customer [
41]. There is an existing need to look for new manufacturing methods and ways of organizing them. The project aims to ensure the required quality and minimize costs [
42]. There are several new solutions on the market, one of which may be the implementation of cloud-based manufacturing technology, which affects the management of these production systems [
43].
Two approaches to pre-production work can be observed: production preparation, which is a broader concept and includes the area of research, and technical production preparation. Technical preparation of production is a set of activities that are used to determine the technical characteristics of products, as well as methods of their manufacture [
44].
Each product requires appropriate construction and technological preparation for the production process. The share of technological preparation of production is 20 to 70% of the total labor intensity of technical preparation—this depends on the type of production [
45]. For unit and small-batch production, it is difficult and inefficient to automate the production preparation process [
46]. Manufacturing systems should take into account the dynamics, as well as the impact of uncertainty and unexpected change [
47]. The requirement to obtain effective solutions in the shortest possible time in a production environment is essential and can only be solved with effective production planning methods [
48].
4. Implementation Project of Technological Innovation in a Manufacturing Company
Presented below, the technological innovation implementation project evolved from the need to develop a methodology for dealing with the implementation of new solutions in small-batch production. As a result of the observed changes, there was a necessity to create a model for designing a technological innovation concept, and then evaluating and selecting the best variant of the innovative solution.
A flowchart containing the original procedure for dealing with the design of the innovation concept and the stage related to the selection and evaluation of technological innovation options was created (
Figure 6).
This paper presents a new business concept approach for industry, dedicated to a small-batch product. The modeled perspective, which involves designing a concept for an innovative solution, uses the tools of the Blue Ocean methodology combined with the concept of value proposition design. This is the first step of the proposed model—creating the concept of innovation. The two methodologies are proposed to be combined as complements and the results included in the Quality Function Development methodology. This represents the next stage of the proposed methodology involving the management of the innovation concept.
The application of a multi-criteria evaluation of variants, being the main component in the phase of evaluation and selection of the optimal solution, allows the identification of a compromise in the search for a solution that is favorable in terms of the technical, economic, and ergonomic criteria that are the basis of the assessment in the effort to make the optimal choice. A characteristic feature of the model created is the inclusion of risk as one of the criteria for assessment in the selection of the optimal variant representing the factor for directing action in the rationalization of production systems. For risk assessment, it was proposed to use a fuzzy inference system, thus allowing for a detailed analysis of the risk factors of technological innovation. This procedure enables the implementation of technological innovations.
To demonstrate the process methodology during the implementation of a technological innovation in a manufacturing company, a project was performed for a sports and leisure device produced in small batches.
4.1. Characteristics of the Company
The company on whose terms the project is based is an existing and well-known manufacturer of modern sports and leisure equipment. The enterprise focuses on creating safe, efficient, and environmentally friendly solutions. The equipment produced is designed for both winter and summer sports. Production is in accordance with the granted authorizations. Due to its experience in producing high-quality products, the company has received many certificates. The company allocates considerable finances to research innovative solutions and improving production technology. As a result, it strengthens its market position and increases the sales of its products year on year.
The main difficulty identified in the defined research area is the problem of creating innovation in the area of designing new equipment, and then implementing it and controlling it accordingly.
Indeed, the company aims to continuously improve its production processes in order to ensure the high quality of the manufactured devices. The increase in customer expectations, as well as intensifying competition, makes the company want to direct its activities to development.
4.2. Object of the Research
There are several main groups of equipment offered by the discussed company. An analysis will be performed on the conveyor belt. The ski conveyor is designed to transport people to the top. It can be used all year round—both in winter and summer, depending on the needs. It can transport people to the lift station, between the stations of two lifts, or can replace a short ski lift. The ski conveyor consists of a drive station, a return station, and intermediate segments, whose number depends on the length of the conveyor. The conveyor is equipped with a switchgear located near the drive station. The existing ski conveyor is equipped with sensors, safety features, and a fully controllable touch panel. The main advantages of the existing solution are its uncomplicated design, which makes the device easy to operate, it does not require extensive infrastructure, and transportation and assembly do not require complicated procedures. All devices comply with European regulations and recommendations.
The most important thing from the company’s point of view is to neutralize any negative impact on the environment. Among current trends, it was decided to direct the created innovation to ecological measures. The innovative idea is not to create an additional environmental burden.
In creating the value proposition, consideration was taken into account of:
- −
The company’s current resources and competences;
- −
Adaptation to customer needs;
- −
Improvement in the current solution.
4.3. Course of the Research
The proposed product concept approach aims to reduce the necessity for prototype testing and research, lowering design costs, which can be particularly important in small-batch production. Using the example of a ski conveyor belt, it is shown how selected techniques for developing the concept of a new product and intended directions of change methodically support the next step associated with planning an innovative product.
The purpose of the technological innovation strategy concept project is to present a proposal to apply selected new innovation strategy concept tools according to the Blue Ocean Strategy methodology with value proposition design in combination with Quality Function Development (
Figure 7).
The first step is the application of the procedural schemes described in the Blue Ocean Strategy concept. The techniques of this methodology, after competitive profiling to develop a new Strategy Canvas, comprise the competitive profiling change project:
- −
Four Actions Framework;
- −
Six Paths Framework to formulate a Blue Ocean Strategy;
- −
Focusing on a broad vision;
- −
Reaching beyond the limits of existing demand;
- −
The principle of maximizing the size of the blue ocean;
- −
Price Corridor of the Mass;
- −
Determining the price level inside the Corridor of the Mass.
The second step is another technique for offering new value, which states that a value proposition should be based on an implementable business model that captures the projected value for the organization. For this purpose, it is necessary to use a Business Model Canvas, a tool that describes how an organization creates and delivers value. The Business Model Canvas and another tool, the Value Proposition Canvas, are linked. The Value Proposition Canvas allows looking at the details of building value for customers. In addition, it also leads to the creation of a new product concept and has two main aspects that should be adjusted: the customer profile and the value map.
The essential elements of the Business Model Canvas that are subject to preparation are:
- −
Customer segments—groups of people and/or organizations that are targeted by the company to create value for them through a dedicated value proposition.
- −
Value propositions—developed product and service that create value for a given customer segment.
- −
Channels—the way the value proposition is communicated and delivered to a given customer segment.
- −
Relationships with customers—the types of relationships formed with each customer segment.
- −
Revenue streams—the result of the value proposition for a given customer segment.
- −
Key resources—the most important assets necessary to offer and deliver the previously described elements.
- −
Key activities—the most important activities that allow the company to perform well.
- −
Key partnerships—suppliers and partners that provide a flow of resources and activities from the external environment.
- −
Cost structure—all costs incurred to realize the given business model.
- −
Profit—calculated by subtracting all costs from the sum of all revenue streams.
The two mentioned methodologies are proposed to be combined as complements, and the effects are included in the Quality Function Development methodology. The application of the QFD technique is particularly useful in the context of risk minimization with the validity of the designed product parameters, and can therefore be included in the risk management system of an innovative product concept.
4.3.1. First Step: Creating an Innovation Concept
To proceed to the next stages of innovation project management, the value curves of the Strategy Canvas were developed taking into account the value offered—
Figure 8. The curves represent the current market situation.
The answers to the questions according to the Four Actions Framework provided the possibility of remodeling value elements and creating new experiences attractive to buyers. Many factors were designated to be strengthened, reduced, and eliminated. However, it was decided to create a factor focused on ecology and environmental protection. The effect of the six-path scheme activity resulted in moving away from industry-defining schemes, with evaluation through the lens of broader strategic customer groups;
Figure 9 shows the old and new strategy profiles. Path number one looked at alternative industries. The alternatives that could be exploited on the slopes were collated. Path two analyzed the strategic groups in the industries. In path three, buyer chains were analyzed. Buyers can be divided into two groups, namely, individual customers and B2B customers. Path four focused on the offering of complementary products and services. As a result, it was concluded that innovative technology would cause a reduction in the importance of upgrading services or purchasing accessories. The next path contributed to the analysis of functional and emotional factors, and the last path supported the conclusion that the availability of conveyor belts will increase in time, as well as interest from individual customers. Furthermore, there are no significant or rapid changes in the forecast trends.
To carry out the visualization of the strategy, the following activities were used: Visual Awakening, Visual Exploration, Visual Strategy Fair, and Visual Communication. Stage one of the visualization was a comparison of the company with its competitors by mapping out the current strategic situation and then identifying the points that need to be changed. Stage two of the visualization represents the identification of six paths for formulating a Blue Ocean Strategy. Stage three was the compilation of conclusions from practical observations. Stage four involved the compilation of strategic profiles. This also provided a place to analyze the three tiers of non-customers. The non-customers of the first tier are customers who use sports and leisure devices in their business. They are willing to replace traditional conveyor belts with innovative devices. The second tier includes purchasers of sports and leisure devices, but those who choose products from well-known brands. The rest are not interested in purchasing an innovative conveyor belt.
Reaching Beyond Existing Demand is another of the rules of the Blue Ocean Strategy. This approach focused on gaining as much demand as possible for a new offering, while reducing the scale of risk associated with creating a new market.
The strategy sequence according to the Blue Ocean maximization rule included the determination of the right price for the developed offer;
Figure 10 shows the determination of the Price Corridor of the Mass.
After analyzing several tools as part of the project to maximize the size of the blue ocean, the final analysis of the Blue Ocean Strategy sequence was carried out to determine whether the new product strategy concept created passes through all its four aspects.
To perform the value proposition matching, the Business Model Canvas project was developed, combining the customer profile, value map, and their matching.
The steps started with the creation of the Business Model Canvas. The next step was to develop a customer profile, which describes the specific customer jobs, and pains and gains of the customer. The different segments of the customer profile were ranked according to their importance (
Figure 11).
In the next step, the value map describing the value proposition was made. Similar to the customer profile, prioritization was performed (
Figure 12).
The final stage was to create a match involving a close linking the value map to the customer profile.
The use of the QFD method to convert the voice of the customer into product design criteria is still a subject of discussion and research. The beginning of the analysis of the new technology in combination with the Quality Function Development method involved the identification of customer requirements, which used the results from the previous steps. Step two was the determination of the importance of the requirements according to the customers, based on the results from the techniques of Strategy Canvas and Four Actions Framework. Step three involved determining the technical parameters of the product. As part of this phase, the technical parameters from the designer’s point of view were indicated, revealed through the analysis in the development of the Customer Map. Step four was the identification of the relationship between customer requirements and technical parameters. Three levels of dependencies are distinguished—their level is more easily established through the use of value map matching analyses and the customer profile. The fifth step in the construction of the QFD diagram was to assess the importance of the technical parameters. Validity was determined from the numerical ratings in the importance fields of requirements and dependencies. The results make it possible to identify the critical features of the product. Step six involved identifying dependencies, i.e., correlations between technical parameters. Correlations are easily identified after the next activity of the Business Model Canvas, i.e., testing the customer profile and value map. Correlations are neutral, positive, or negative. The seventh step involves a comparison with the competition. This constitutes a competitive analysis. The eighth step was to establish the technical target values. For this purpose, the target values that the measurable technical parameters must achieve were defined. Step nine aims to establish indicators of the technical difficulty of implementation.
The result is the House of Quality—
Figure 13. There were three levels of relationships between customer requirements and technical parameters: strong ●, medium ○ and weak ▽. In addition, correlations between technical parameters were identified. The correlations are neutral, positive, or negative.
4.3.2. Second Step: Evaluation and Selection of the Best Technological Innovation Concept
The next step is to use multi-criteria evaluation of variants in the optimal solution estimation and selection phase. The potential of multi-criteria-based decision making has been widely recognized, but there is still insufficient research in these areas. The defined model includes technological, ergonomic, and economic criteria. A feature of the model is the inclusion of risk as one of the evaluation criteria in the selection of the optimal option. The model is presented in
Figure 14.
Based on the previous stages, the following options were determined:
After identifying the options and several technical, economic, and ergonomic criteria, weighting factors were determined for:
- −
- −
The next step involved identifying the weighting factors for each group of criteria. For this purpose, a comparison with the groups of criteria was made, and this resulted in the determination of their weights. This was consecutively implemented for:
- −
- −
The next step was to determine the weighting factors for each group of criteria. For this purpose, there was a comparison with the groups of criteria, which led to the determination of their weights (
Table 9).
As a result of the above process, overall ratings were calculated and the best option was selected (
Table 10).
A number of conclusions can be drawn from the research, among which it is worth mentioning, from the customer’s point of view, the role of technical criteria, the need to maintain an attractive purchase cost, and the focus on minimizing costs arising from the operation of the equipment.
Classical methods of evaluating and selecting the variant are based mainly on the intuition of the evaluator. The collection of three options assessed against technical, economic, and ergonomic criteria of varying degrees of importance is given. The set of 14 specific criteria related to the implementation of innovation was identified. Within each criterion, the risks associated with the type of risk were identified, with a total of 56 risk factors identified. The risk factors for the innovation criterion located in the technical criteria group of variants with aluminum construction are presented in the
Table 11.
The parameter values P (probability), D (detectability), and C (consequences) were determined for each risk factor. A range of linguistic values were established to describe the probability of:
Probability: practically impossible, small, medium, high, very possible—
Figure 15.
Detectability: impossible, small, medium, high, very possible.
Consequences: very small, small, average, big, very big.
The values of the P, D, and C parameters for a single risk factor are the input values. These allow the construction of a rule base by specifying conditional rules in the form of IF–THEN. The correlations show that the assessment of an innovation risk factor depends primarily on the consequence of the risk—
Table 12.
Starting the inference process, the values of the innovation scores for each risk factor can be obtained. Taking into account the weights of the specific criteria, a weighted score for each risk factor is obtained.
The final evaluation result is achieved by aggregating the weighted evaluation values of the individual risk factors and then comparing them with the risk ranges.
4.3.3. Third Step: Technical Preparation of Production
The model (
Figure 16) shows the process of construction and technological production preparation. The model supports the process area of production preparation for the technological innovation implementation.
5. Discussion on the Obtained Results
The modeled perspective leads to the design of an innovative solution concept, and then the evaluation and selection of the optimal solution, in order to implement technological innovations.
5.1. Results
The proposed methodology takes into account a range of factors influencing the course of designing a new technological innovation, and provides complete feedback in the form of key recommendations for selecting the optimal solution, taking into account the risks of this decision. The paper proves that a combination of Blue Ocean Strategy tools, Value Proposition Design, and QFD can lead to positive results in achieving the proposed goals. In the proposed approach, Blue Ocean Strategy tools were complemented by business model development techniques. This allowed for the comprehensive development of an innovative solution concept. The tools were combined in a complementary way, and this allowed the translation of the market requirements obtained from the extended analysis into technical parameters and a set of conditions that should be fulfilled at each subsequent stage of product development by creating the QFD matrix. The use of the QFD matrix technique is particularly helpful in the context of minimizing the risk associated with the validity of the designed product parameters. To perform the risk analysis, a method was developed which, due to its inclusive character, is oriented to practical application in a dynamic production environment. The composition of the criteria, and the way of prioritizing them and the hazards, significantly facilitate the process of identifying the best solution variant. The goal of the proposal to combine different methods into a single model was to promote greater efficiency in the processes involved in delivering the value proposition required by customers. This article results in increasing the amount of research performed to support the implementation of new innovation solutions and to understand the dynamics of business models. Compared to other publications, the created project is characterized by a combination of methods that are treated separately in other publications. The created concept of the innovation concept management approach provides the possibility to predict the course of the next steps, and thus achieve greater flexibility and success.
5.2. Future Research Directions and Recommendations
There are several important aspects for future research. An important area in future studies will be the creation of a procedure to determine the consistency of the business model and the evaluation of the interconnectedness of the business model aspects. Equally important will be the development of research on controlling the design of a modular product, i.e., the creation of a design control procedure.
The methodology is extensive and involves several people; therefore, it is expensive and time-consuming. Consequently, it is recommended that is used to assist in the implementation of difficult and high-cost projects in small-batch production. The main challenge that concerns the formulated methodology is its possible simplification.
The conclusions of the research provide practical insights for today’s companies. It is necessary to understand the current resources and capabilities that are needed to diagnose the actual situation of the enterprise. The proposed methodology of innovation strategy concept management allows for skillfully managing projects more efficiently and productively. It directly results in increased customer satisfaction, as it allows for the realization of a project adapted to the requirements of existing and future customers, whose projects will be created according to plan, taking into account timescales and costs. The improved approach will result in increased efficiency in the delivery of innovative solutions and will enable the successful implementation of further projects. The expected results will motivate the team to further progress and continuous growth.
6. Conclusions
Nowadays, competition is increasing significantly, product life cycles are shortening, and the demands of buyers are changing very quickly. The proposed insights illustrate the complexity of creating innovative solution concepts. To respond to customer demands, product development is a key success factor in modern business.
This work presents new business approaches for industry, and for innovation in small-batch production conditions, by compiling effective design methodology tools. The proposal strives for a low-volume design effort, thus minimizing the need for the most expensive design stages, i.e., testing and trialing.
Based on the selected innovation example, it was shown how selected techniques for the development of a new product concept and development methodically support the next step related to the implementation of technological innovation.
The proposed solution takes into account the specifics of creating an innovative product concept for small-batch production under conditions of limited design effort, while effectively considering existing requirements and creating new value for the customer. An innovative approach can guarantee a company’s long-term success.
The results from these projects provide a recommendation for organizations facing problems in creating and implementing technological innovations. The knowledge gained from the project will help to manage innovation in the company and build innovative enterprises. This research provides practical knowledge of methodologies and procedures for diagnosing innovation needs. It shows a broader perspective on the creation of innovative services and solutions, taking into account the needs of customers. The acquired skills will enable the implementation of the best innovative technology and risk management in the operations of the organization. Thanks to this, managers will be able to build the prestige of managed organizations and public trust. The approach to innovation and value creation requires complex organizational capabilities that enable a company to gain continuity in its innovation activities. Successful and effective innovation management requires constantly thinking about innovation and mobilizing its organization. The proposed methodology allows more effective consideration of expert knowledge when estimating the risk factor.


 3
3 1
1 2
2