Article

The Modelling of Rock Fragmentation Mechanisms by Carbide Buttons Using the 3D Discrete Element Method

1
Key Laboratory of Urban Security and Disaster Engineering of Ministry of Education, Beijing University of Technology, Beijing 100124, China
2
State Key Laboratory of Hydroscience and Engineering, Tsinghua University, Beijing 100084, China
3
CNNC Key Laboratory on Geological Disposal of High-Level Radioactive Waste, Beijing Research Institute of Uranium Geology, Beijing 100029, China
*
Author to whom correspondence should be addressed.
Appl. Sci. 2023, 13(10), 6090; https://doi.org/10.3390/app13106090
Submission received: 20 April 2023 / Revised: 12 May 2023 / Accepted: 14 May 2023 / Published: 16 May 2023

Abstract

:
Button cutters are commonly used in hard rock drilling because the inserted carbide buttons provide exceptional wear resistance, impact resistance, and high strength in challenging geological formations. One of the most pressing issues in designing a button cutter is to study the rock breaking mechanisms of carbide buttons. In this study, the three-dimensional discrete element method (DEM) was employed to investigate the rock breaking mechanism and cutting performance of five widely used carbide buttons, i.e., spherical, saddle, wedge, conical, and parabolic buttons. The simulation results were compared with laboratory tests to reveal the rock indentation process. The crack propagation pattern, energy dissipation, and damage evolution associated with the force–penetration depth curve were investigated. Tensile damage was the primary determinant for crack propagation and coalescence. By systematically exploring the penetration index, specific energy, and crack propagation characteristics, the conical button had a high rock breaking efficiency when the penetration depth was low, and the saddle button had a high rock breaking efficiency when the penetration depth was high. The findings can provide references for the design of a button cutter.

1. Introduction

The safe disposal of high-level radioactive waste (HLW) is a significant topic and a challenging task for all countries utilizing nuclear energy. Deep geological disposal has been proposed as an appropriate method for dealing with HLW internationally. Its fundamental strategy is to deposit HLW in deep disposal pits after solidification and canning until its danger is reduced by radioactive decay to the point where there is no significant risk to humans or the environment [1]. Because of its high construction quality and low disturbance to the surrounding rock mass, mechanical excavation was commonly used to construct the disposal pit [2,3]. Due to the limited diameter of the shaft pit, the thrust per cutter provided by the excavation equipment is much lower than that of the usual tunnel boring machines (TBMs). Compared to disc cutters with the same diameter, button cutters that required less thrust for rock cutting are widely used as cutting tools for disposal pit excavation. It begins with the indentation of carbide buttons in the rock and progresses to the interaction between adjacent buttons [4,5], as shown in Figure 1. Thus, the structural parameters and arrangement of carbide buttons have a great influence on the rock breaking efficiency. Up to now, the influence of geometrical parameters of carbide buttons on rock breaking mechanisms is still an unresolved topic.
Laboratory tests are regarded as the most reliable and accurate approach to studying the effects of indenter structural parameters on rock breakage [6,7,8,9]. The influences of indenter structural parameters are mainly reflected in the indentation force, characteristics of chippings, and failure patterns. Cook et al. [10] summarized the failure modes of quasi-brittle rocks under blunt indenters and divided the rocks into three zones: (1) the core region of crushed rock, (2) the plastic zone, and (3) the elastic zone of intact rock. Kou [6] investigated the crack propagation patterns of three different indenters, including hemispherical, truncated, and cylindrical indenters, penetrating into granite. The comparison showed that the length and direction of the main crack were influenced by the contact area between the indenter and the rock, and the peak forces were also different. Ning et al. [11] studied the adaptability of cutters with different blade widths under hard or extremely hard rock conditions, and found that the influence of blade width on normal force was greater than that of rolling force.Zou et al. [12] proposed a thrust prediction model using a newly designed indentation-testing apparatus. In order to better understand the rock failure mechanism, some monitoring techniques were used to observe the initiation and propagation of cracks during indentation experiments [13,14,15,16]. Gao et al. [17] utilized the combination of digital image correlation (DIC) and ultra-high-speed photography to monitor crack initiation, propagation, and coalescence, and found that the fracture time, fracture toughness, and crack growth velocity all depended on the loading rate. Yin et al. [18] investigated the effect of the confining pressure on crack initiation and propagation modes using an acoustic emission monitoring approach. Wei et al. [19] analyzed the effect of loading rate on failure characteristics of asphalt mixtures using an acoustic emission technique. According to damage degree, the rock damaged zone could be divided into crushed, dense crack, and sparse zones [20]. Although the experimental method is reliable and accurate, it is time-consuming, costly, and unable to dynamically observe the failure process inside rocks.
As an alternative, numerical simulation has been widely employed to examine rock breaking mechanisms due to its low cost, visibility, and repeatability. The most commonly used numerical methods for rock breaking are the finite element method (FEM) and the discrete element method (DEM). FEM is difficult to describle the initiation and propagation of cracks, making it nearly impossible to model an actual rock breaking process [21,22]. DEM can simulate the macro-constitutive characteristics and micro-mechanical properties of rock materials [23,24,25,26,27]. Due to its ability to simulate real cracks, it has gained more attention in rock cutting issues [14,28,29,30,31,32,33,34]. Li et al. [35] used PFC2D to analyze the rock failure process under wedge indenters, and revealed that the rock fragmentation process was synchronized with the loading and unloading process of cutter forces. Zhu et al. [36] investigated the failure mechanism of indenters with different wedge angles during rock indentation using the discrete element method, and found that as the wedge angle increased, the fracture zone size and the indentation force increased, promoting the formation of subvertical crack. Zhang et al. [37] compared the rock breaking performances caused by arc and wedge cutters with two blades. The results showed that arc blades can produce larger rock breaking areas and longer lateral rocks than wedge blades. Although two-dimensional discrete element models can yield relatively high-resolution crack patterns, they are based on plane stress or plane strain assumptions, which still have significant limitations in characterizing real three-dimensional geometry and predicting indentation forces of buttons.
Only a few researchers have used the three-dimensional discrete element method to investigate the rock breaking mechanism of cutters and validated the simulation results with laboratory tests [38,39,40,41,42]. Xue et al. [43] constructed a large 3D model of cutter rock fragmentation to simulate the actual rock breaking process of cutters using the MatDEM software. Ucgul et al. [44] simulated the interaction between soil and different structure parameters of sweep tillage tools using DEM, and found that structure parameters had major effects on tillage forces and soil movement for shallow working. When using DEM to simulate 3D rock cutting, the increase in model dimensions and degrees of freedom leads to greater computational demand for numerical simulation [45]. Thus, researchers have to sacrifice model element resolution to achieve reasonable simulation time; that is, the particle radius in the existing 3D simulations mainly ranged from 1.3 and 6.0 mm. Due to the small contact area between the carbide button and the rock, the difference in the indenter profiles cannot be accurately characterized. In addition, the 3D crack propagation patterns in the rock breaking process cannot be observed explicitly.
The objective of this research is to numerically investigate the 3D rock breaking mechanism and failure process caused by five different carbide buttons (spherical, saddle, wedge, conical, and parabolic buttons) widely used in button cutters, and further to determine an optimal button for the design of small diameter button cutter used to cut Beishan granite. To overcome the computational bottleneck, GPU-based discrete element code was used. In the following sections, the principle of numerical methods and model setup details are first introduced. The rationality of numerical results is then validated by comparing it with an indentation experiment. Next, the rock breaking processes of five different buttons are investigated from both micro and macro perspectives. Then, the cutting efficiency of the five buttons are compared in terms of crack pattern and energy consumption. Finally, the conclusion of this study are drawn.

2. Numerical Simulation Model

2.1. GPU-Based Discrete Element Method

The discrete element method (DEM) was first introduced by Cundall and Strack [46] to study the behavior of granular assemblies. By introducing bonds, DEM was successfully used to simulate the behaviors of cohesive materials [47], e.g., soil and rock. For bonded particle models, materials are assembled from many mass particles linked to other particles via springs. Contact forces are generated when particles penetrate, slide, and rotate with other contact particles. The sum of contact force, shear force, external force, and gravity on a particle constitutes the combined force of the particle. The dynamic evolution of this particle system can be simulated by integrating equilibrium equations using Newton’s physics laws and explicit time algorithms [46,47]. In the explicit time algorithm, the step time is set very small to keep numerical stability. In addition, the velocity and acceleration of a particle are very low so that they can be assumed to be constant within a time step, allowing the calculation of the displacement of each particle. For quasi-static problems, the adaptive damping scheme can be applied to achieve equilibrium and can be written as follows:
f i = f i c s i g n ( u ˙ ) f i
where c is the local damping coefficient, f and u ˙ are the force vector and velocity vector for the particle i, respectively. Two contact particles are linked by a breakable bond. In this work, the widely used enhanced parallel bonded model was used for modelling rocks. In this contact model, the bond is represented as a finite area beam and includes seven parameters: normal and shear stiffness per unit area k ¯ n , and k ¯ s , tensile strength σt, cohesion strength c, friction angle φ, a moment contribution coefficient β, and bond-radius multiplier λ, which defines the bond radius R ¯ = λ m i n R A , R B ; with R A and R B being the radii of the two bonded particles. The relative motions between two contact particles cause increments of contact forces and moments due to the contact stiffness. The particle movements and the resultant forces and moments follow Newton’s law of motion. The change of contact forces and moments due to the relative particle movements are determined, respectively, by Equations (2) and (3):
F n ¯ = k ¯ n A ¯ U n ,   F s ¯ = k ¯ s A ¯ U s
M ¯ n = k ¯ n J ¯ θ n , M ¯ s = k ¯ s I ¯ θ s
where F n ¯ , F s ¯ , and M ¯ n , M ¯ s are the contact forces and moments at the contact zone center, respectively, in the normal (n) and shear (s) directions; U n , U s and M ¯ n , M ¯ s are the relative displacements and rotations between the two bonded particles, respectively, in the normal (n) and shear (s) directions; and A ¯ , I ¯ and J ¯ are, respectively, the area, moment of inertia, and polar moment of inertia of the bond cross-section, determined by Equation (4):
A ¯ = π R ¯ 2 ,   I ¯ = 1 4 π R ¯ 4 ,   J ¯ = 1 2 π R ¯ 4
Elements are originally bonded to each other. The maximum tensile and shear stresses, σ ¯ m a x and τ ¯ m a x , acting at the contact are obtained by Equation (5):
σ ¯ m a x = F ¯ n A ¯ + β M ¯ s R ¯ I ¯ ,   τ ¯ m a x = F ¯ s A ¯ + β M ¯ n R ¯ I ¯
If σ ¯ m a x > or τ ¯ m a x > c σ n tan φ , the bond breaks by tension or shear, and its moments are then removed from the model.
As DEM requires a large number of particles to generate representable specimens, it usually faces computational difficulties in 3D problems. To improve computational efficiency, many researchers have employed GPU parallel technology to accelerate DEM [48,49,50]. However, to the best of our knowledge, few released DEM codes can simulate millions or even tens of millions of 3D particles available for public use. We have developed a novel 3D GPU-based DEM code utilizing hybrid programming in MATLAB with CUDA C++, and incorporated the enhanced parallel bonded model for the simulation of rock materials. With the aid of GPUs, this code can handle simulations with more than 10 million 3D particles with high performance, and can realize large-scale simulations of rock failure problems. The following numerical simulation will be performed using the developed GPU-based DEM code.

2.2. Model Setup

2.2.1. Numerical Model

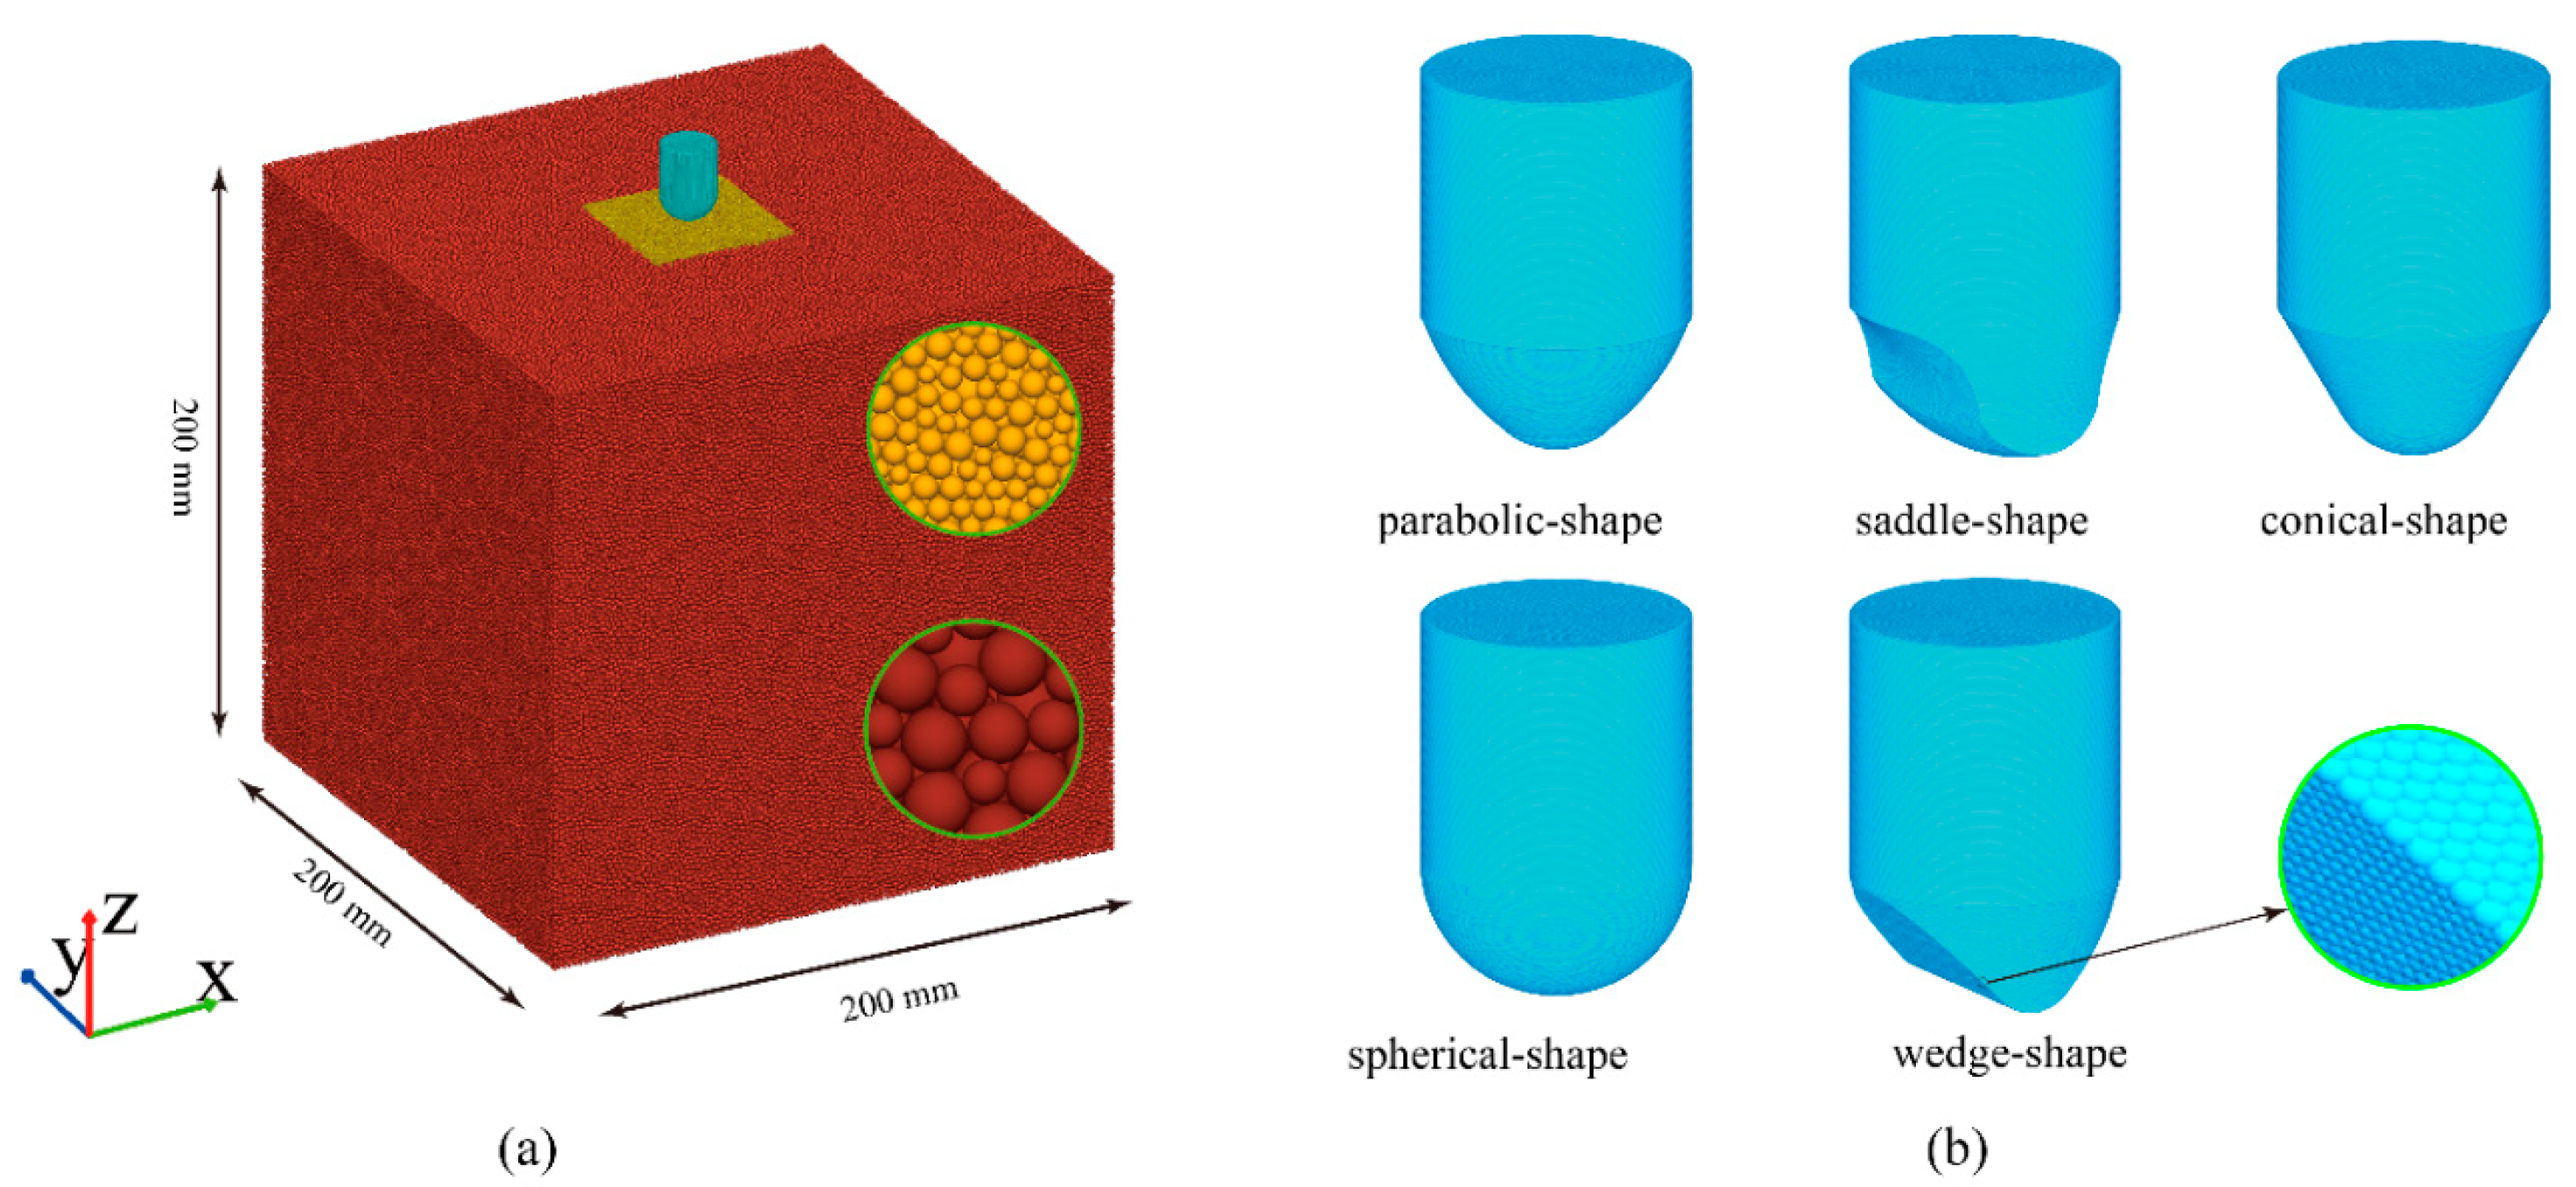
Five types of commonly used carbide buttons, including conical, spherical, parabolic, saddle, and wedge buttons, will be investigated in this work. Figure 2 shows the structural parameters of these five carbide buttons. These buttons have the same diameter of 18 mm. The rock sample is granite in Beishan, Gansu Province.
The numerical model of the button penetrating into the rock is shown in Figure 3a. The rock specimen has dimensions of 200 × 200 × 200 mm (width × length × height) to reduce the boundary effect. To produce high-resolution simulation results, a local particle refinement scheme was adopted. A cube region directly below the button, with a size of 50 × 50 × 50 mm, is selected as a refined area (yellow zone in Figure 3a). The region size can ensure that cracks only extend inside this region. The refined model consists of 1,395,887 particles with a radius of 0.18 mm to 0.31 mm, while the outer part consists of 1,373,962 particles with a radius of 0.75 mm to 1.2 mm. By introducing local refinement techniques, the particle number of the rock samples will be greatly reduced, thereby saving simulation time.
The geometry of buttons was built from the surface profile. Instead of a triangular mesh adopted in previous studies [51], this work used a particle clump to model the button surface as shown in Figure 3b. The motions of the particle clump were entirely controlled by applied velocity boundary conditions. The particles for buttons have a radius of 0.15 mm and overlap neighboring ones by 0.05 mm. The particle numbers for spherical, saddle, wedge, conical, and parabolic buttons are 118,640, 122,109, 124,877, 123,426 and 115,966, respectively. In this way, the geometric profile of buttons can be built with a very high resolution, so that the difference in button structural parameters can be reflected in the interaction process between rock and buttons.
Except for the top surface, the boundary conditions are applied to the other five faces of the rock sample by fixing its normal displacement. The button moved in the z-direction while also fixing its displacement in other directions. The penetration velocity applied to the cutters is set to 0.1 m/s and the max penetration is 3 mm. For a quasi-static problem, a local damping factor of 0.7 was used to apply a damping force to particle motions. To meet the requirement of numerical stability, the timestep satisfies Δ t = 2 ζ m i n m i / m a x ( k n , k s ) , where scaling coefficient ζ (0.1 as a default) is used to adjust the time-step. Accordingly, the time step took about 5 × 10⁻⁸ s. The corroding displacement increment of cutters is only 5 × 10⁻⁹ m/ step. Each simulation performed 600,000 steps.

2.2.2. Calibration

Four commonly used calibration methods, namely Young’s modulus (E) and Poisson’s ratio (ν), Brazilian splitting strength (BTS), and uniaxial compression strength (UCS) obtained from the laboratory were used to determine the DEM micro bond parameters. Based on the experimental results according to ISRM specifications, the physical and mechanical properties of Beishan granite are shown in Table 1.
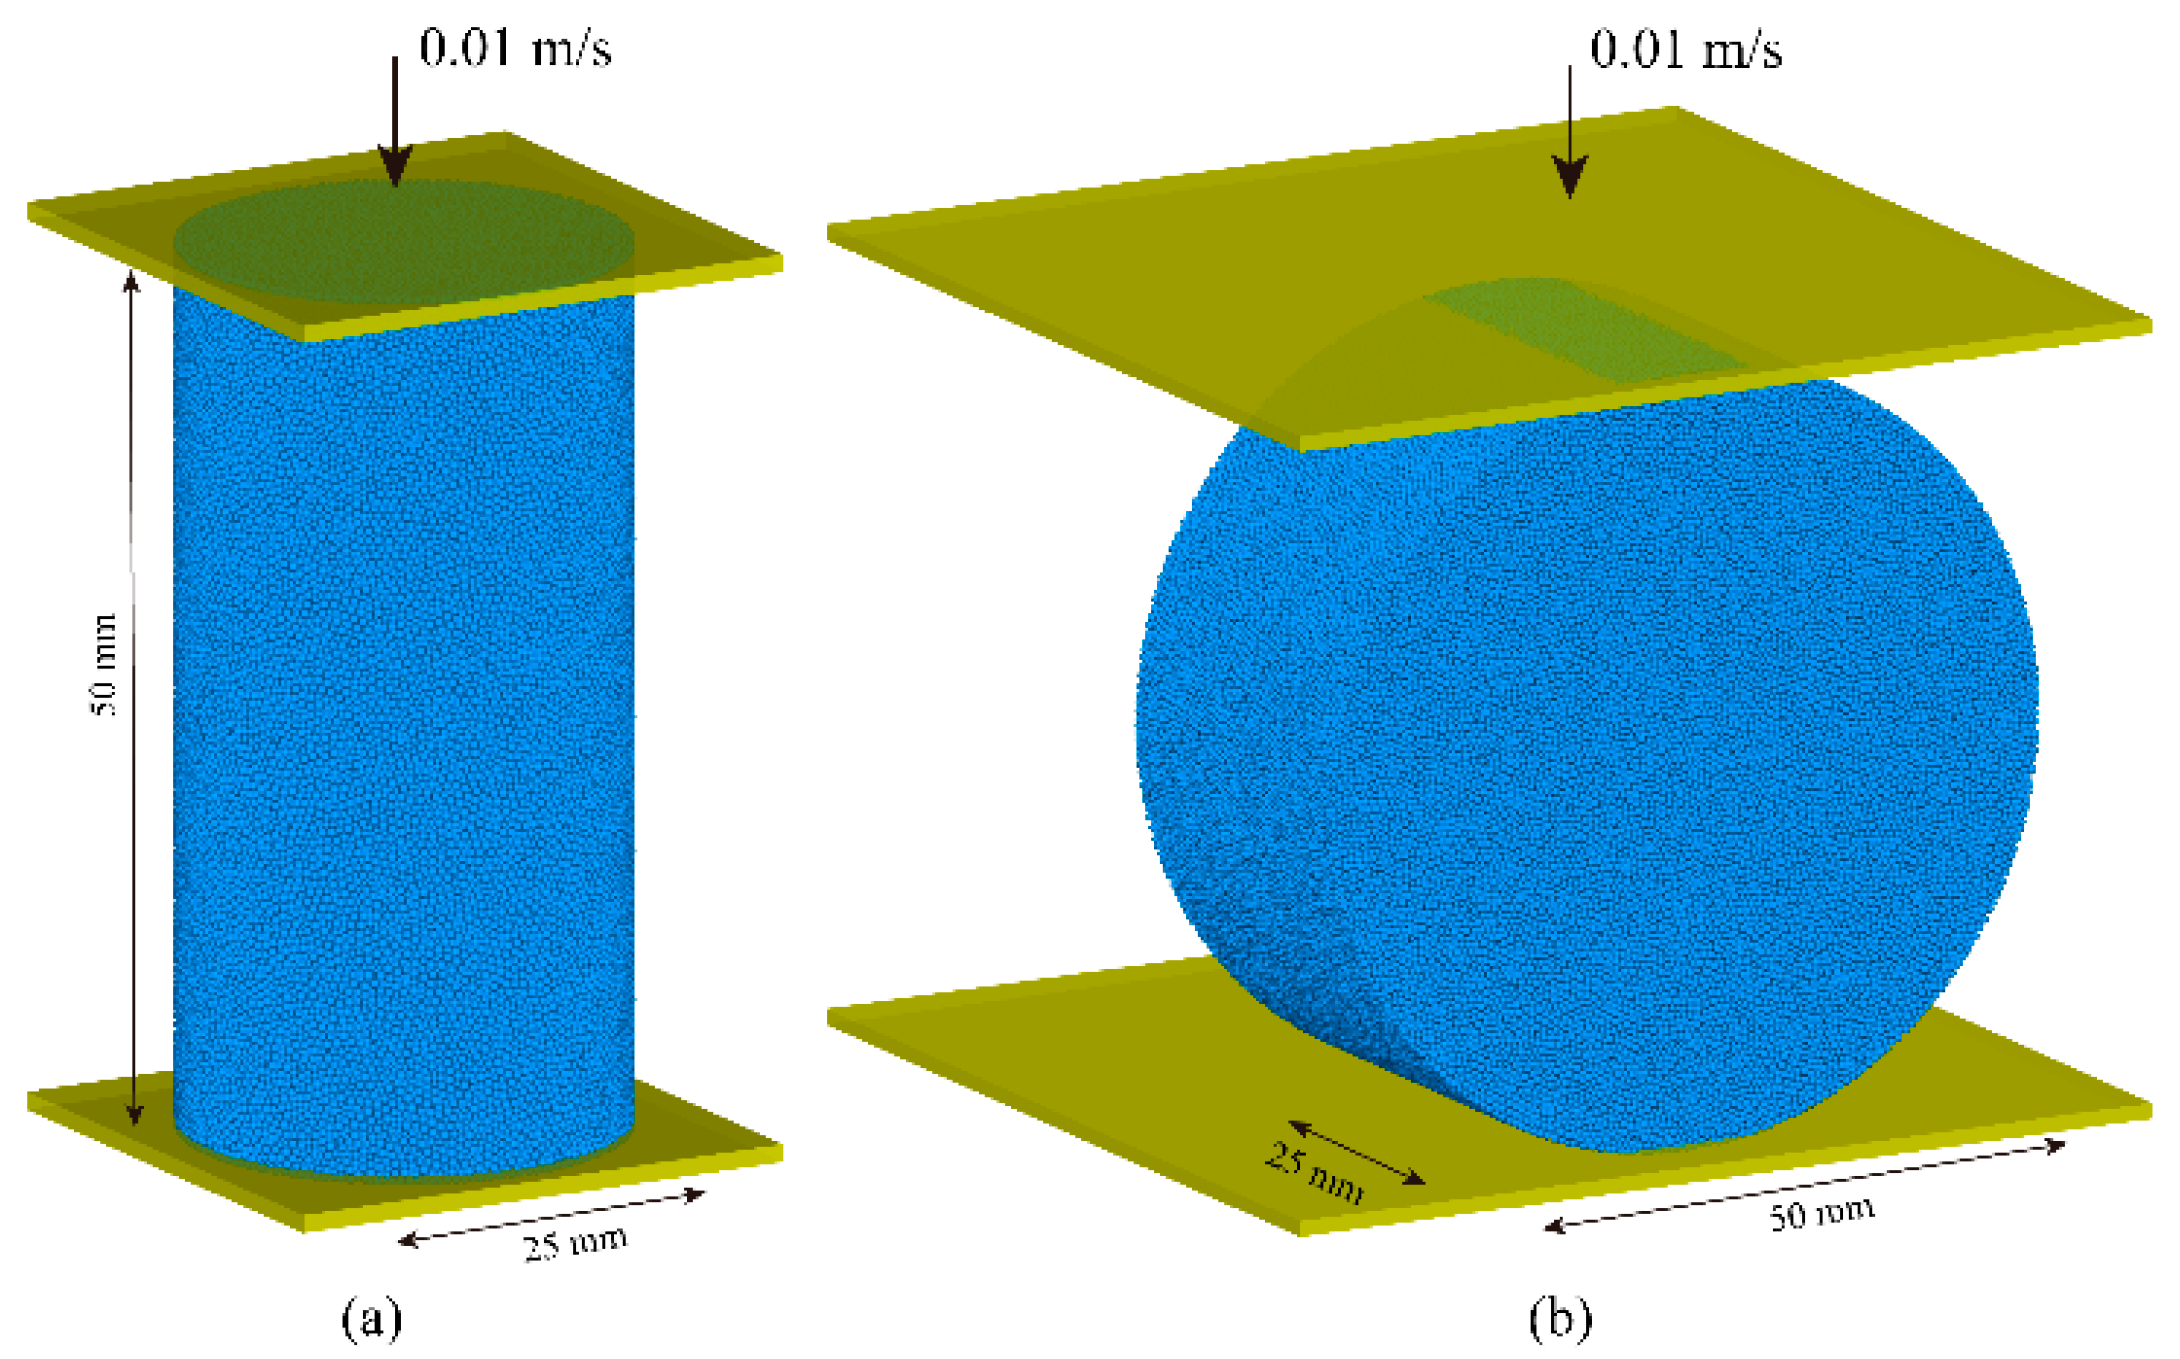
The models consisted of 2 cylindrical samples with dimensions of 25 mm (diameter) × 50 mm (height) for the uniaxial compression test and 50 mm (diameter) × 25 mm (thickness) for the Brazilian disc test, as shown in Figure 4. The samples were constructed from randomly packed particles with a radius of 0.18 mm to 0.31 mm. The number of particles in the samples used for uniaxial compression test and Brazilian disk test was 280,141 and 568,854, respectively. Both samples were subjected to compression by two walls with a loading speed of 0.01 m/s. The parameter calibration was still a trial-and-error process, and the calibration result is illustrated in Table 1. It can be seen that both elasticity and strength parameters were well predicted.

2.3. Numerical Monitoring

2.3.1. Crack Events

During the simulation process, bond failure is treated as microcracks, accompanied by energy release and acoustic emission (AE) events. These cracks can be classified as shear cracks or tensile cracks based on the failure criterion. For an AE event, its bond strain energy can be calculated as
E ¯ k = 1 2 F ¯ n 2 k ¯ n A ¯ + F ¯ s 2 k ¯ s A ¯ + M ¯ t 2 k ¯ s J ¯ + M ¯ b 2 k ¯ n I ¯

2.3.2. Damage Value

The damage value (D) of particles was defined as the ratio of the number of broken bonds to the number of initial bonds. The value of D varies from 0 to 1. In this study, the coordinate number (CN) of particle packing is about 9.04, which defines the total average number of initial bonds for all the particles. If D < 0.3, it means one or two bonds of a particle are broken, and this particle will be classified into an elastic zone or main cracked zone. If 0.3 < D < 1, it means most of the bonds of a particle are broken, but this particle is still bonded with other particles, which will be classified into a plastic zone or microcrack zone. D is equal to 1 for complete damage, which will be classified into a crushed zone.

3. Model Validation

3.1. Experimental Design

In order to verify the reliability of numerical simulation of rock indentation, an indentation test by the spherical carbide button was conducted. An electro-hydraulic servo universal testing machine with a maximum axial force of 1000 kN was used to load the axial force in the indentation test. A robust bearing platform and sample fixer were used to fix the rock sample and locate the indentation position, as shown in Figure 5. The loading force and displacement curves can be automatically obtained. After the indentation test, the fluorescent crack visualization method was employed to observe the crack pattern under the carbide button.

3.2. Validation

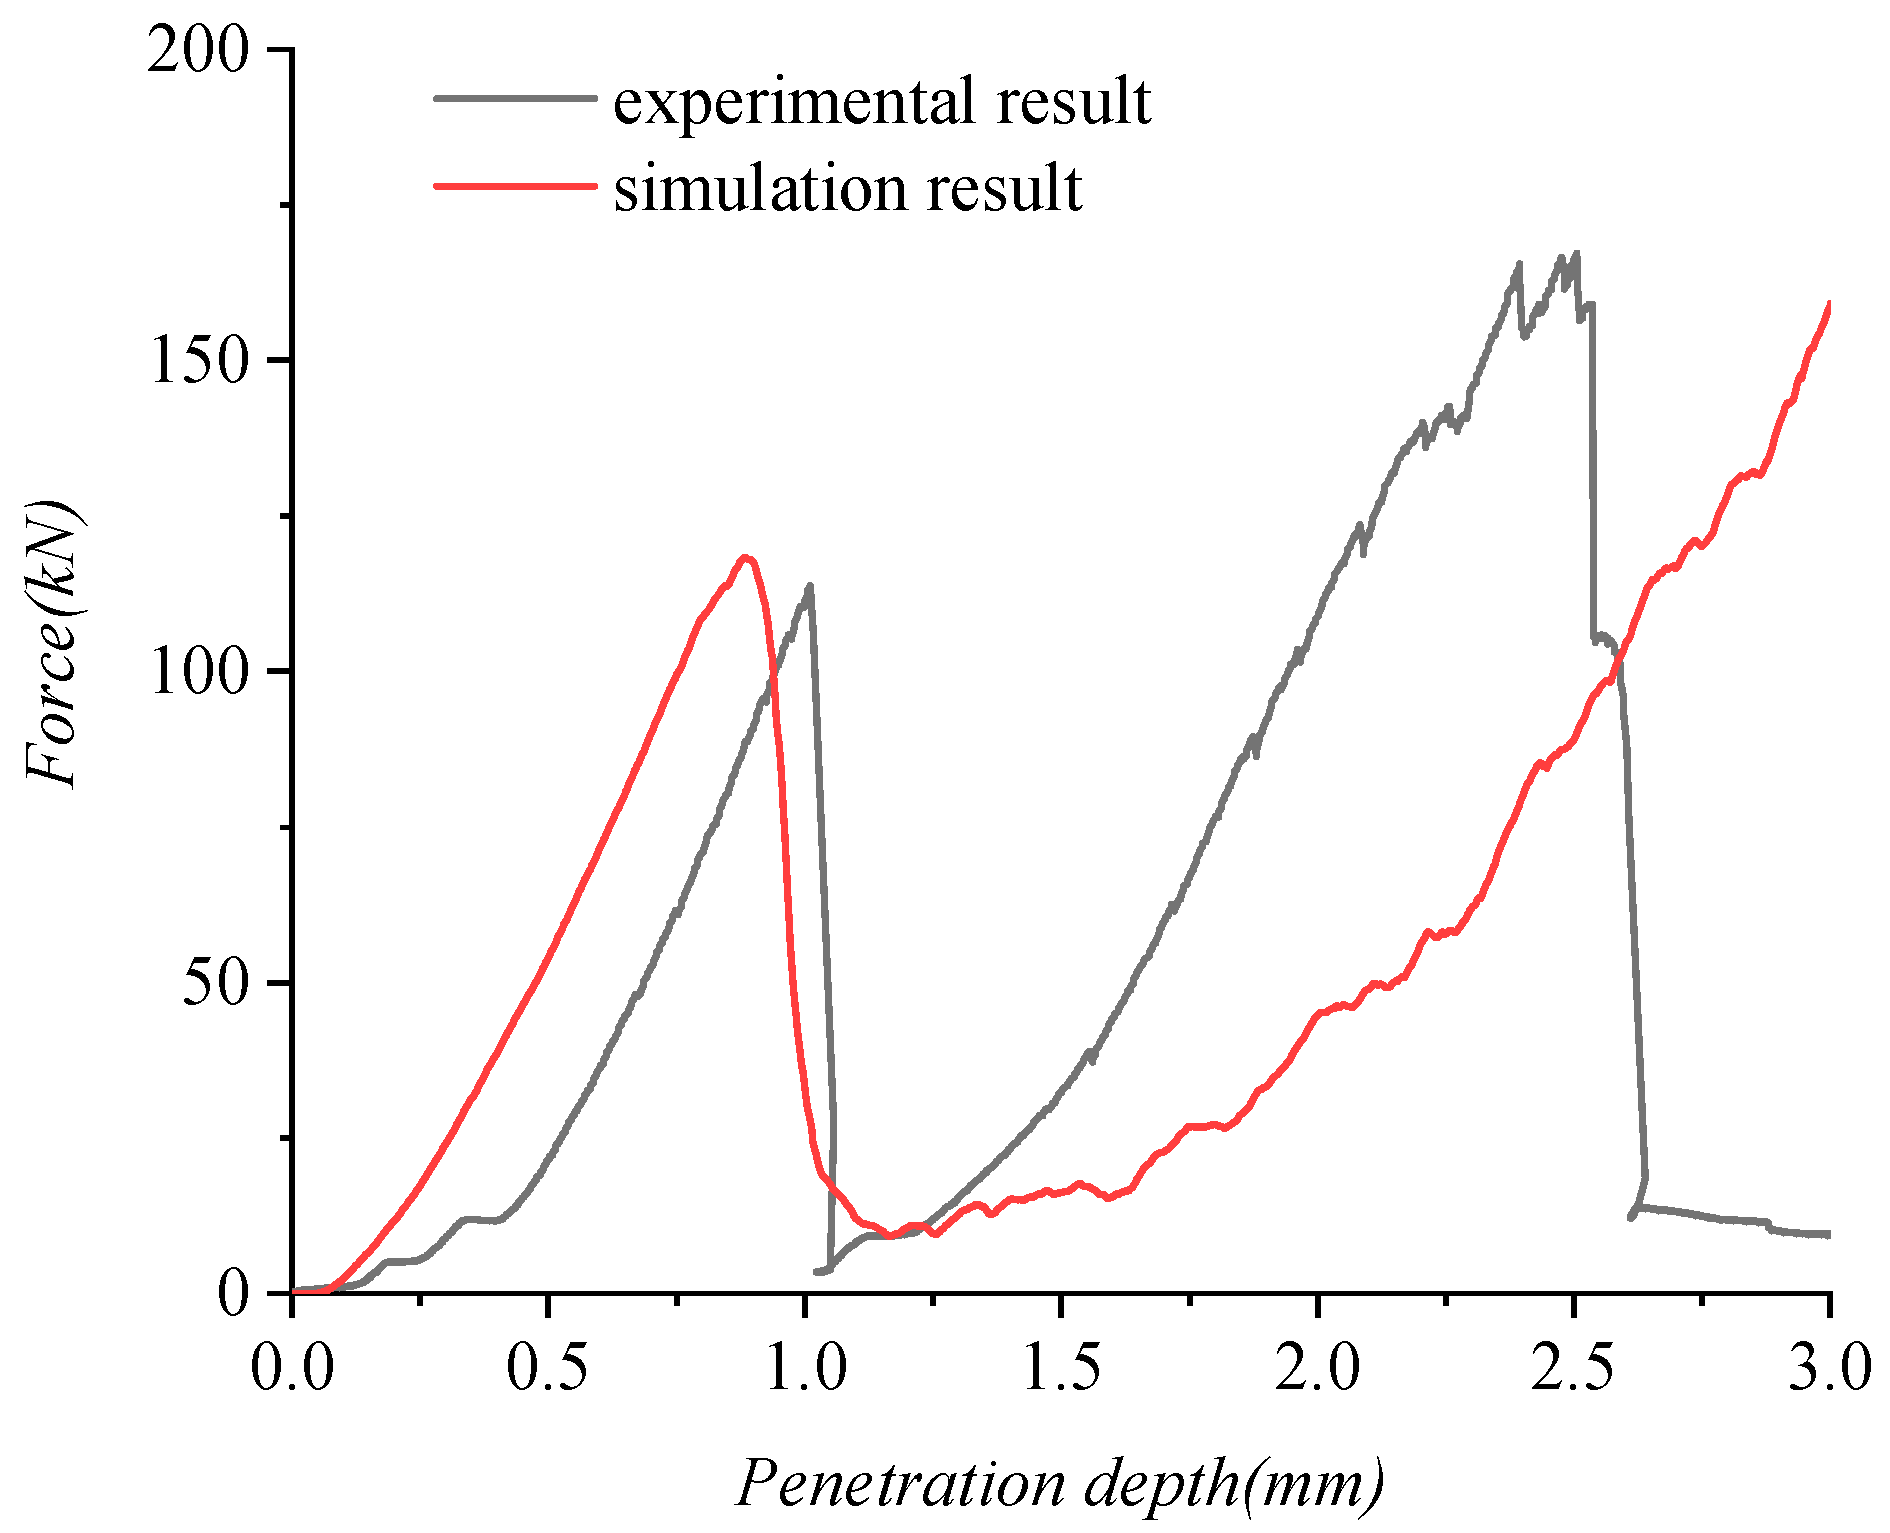
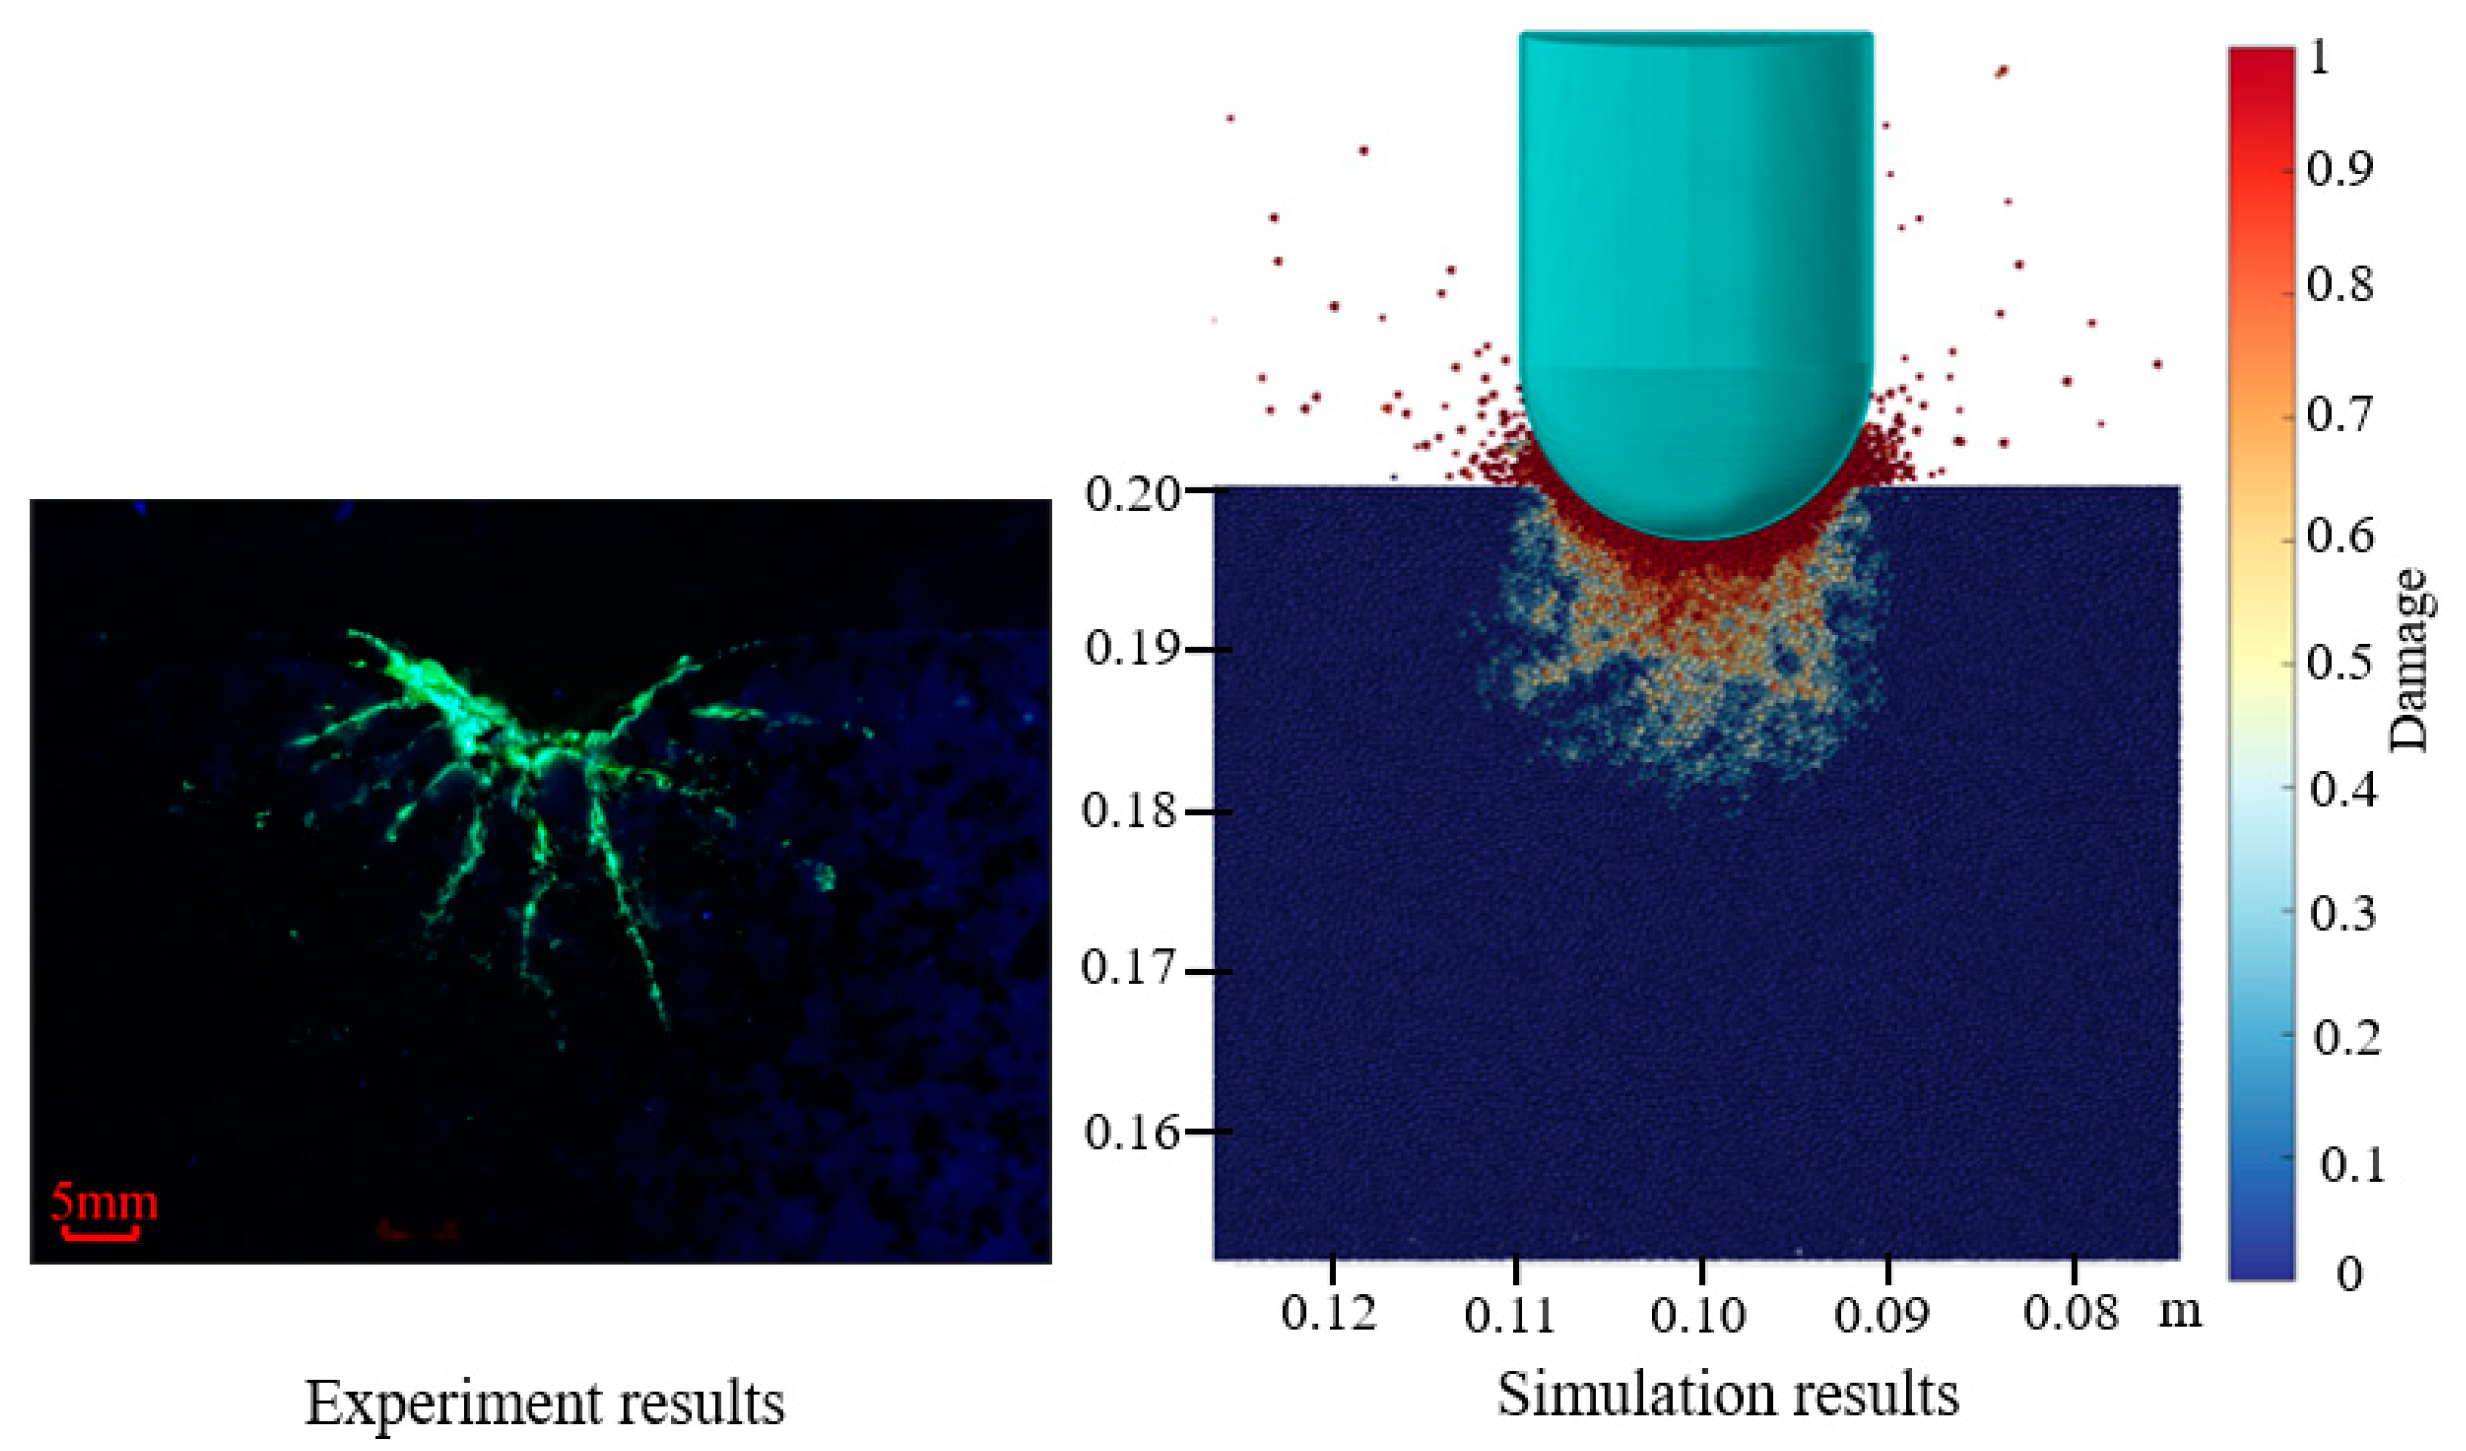
The curves of indentation force changed with penetration depth obtained from the simulation and experiment are shown in Figure 6. It can be seen that the trends of these two curves were extremely similar. The first force peak of both curves occurred at a penetration depth of about 1 mm, and the values were almost identical. Figure 7 depicts the crack pattern of rock penetrated by a spherical button at the penetration depth of 3 mm. The experimental results showed that several equal-length radial cracks distributed uniformly around the indenter. Similarly, numerical simulations also exhibited similar crack patterns and damage ranges. Thus, the numerical simulation results were in agreement with the experimental findings. It can be concluded that the numerical simulation was reliable to predict the penetration force and simulate the rock damage mechanism, and can be further used to study other types of buttons.

4. Analysis of the Rock Breaking Process

4.1. Force–Penetration Depth Curve and AE Events

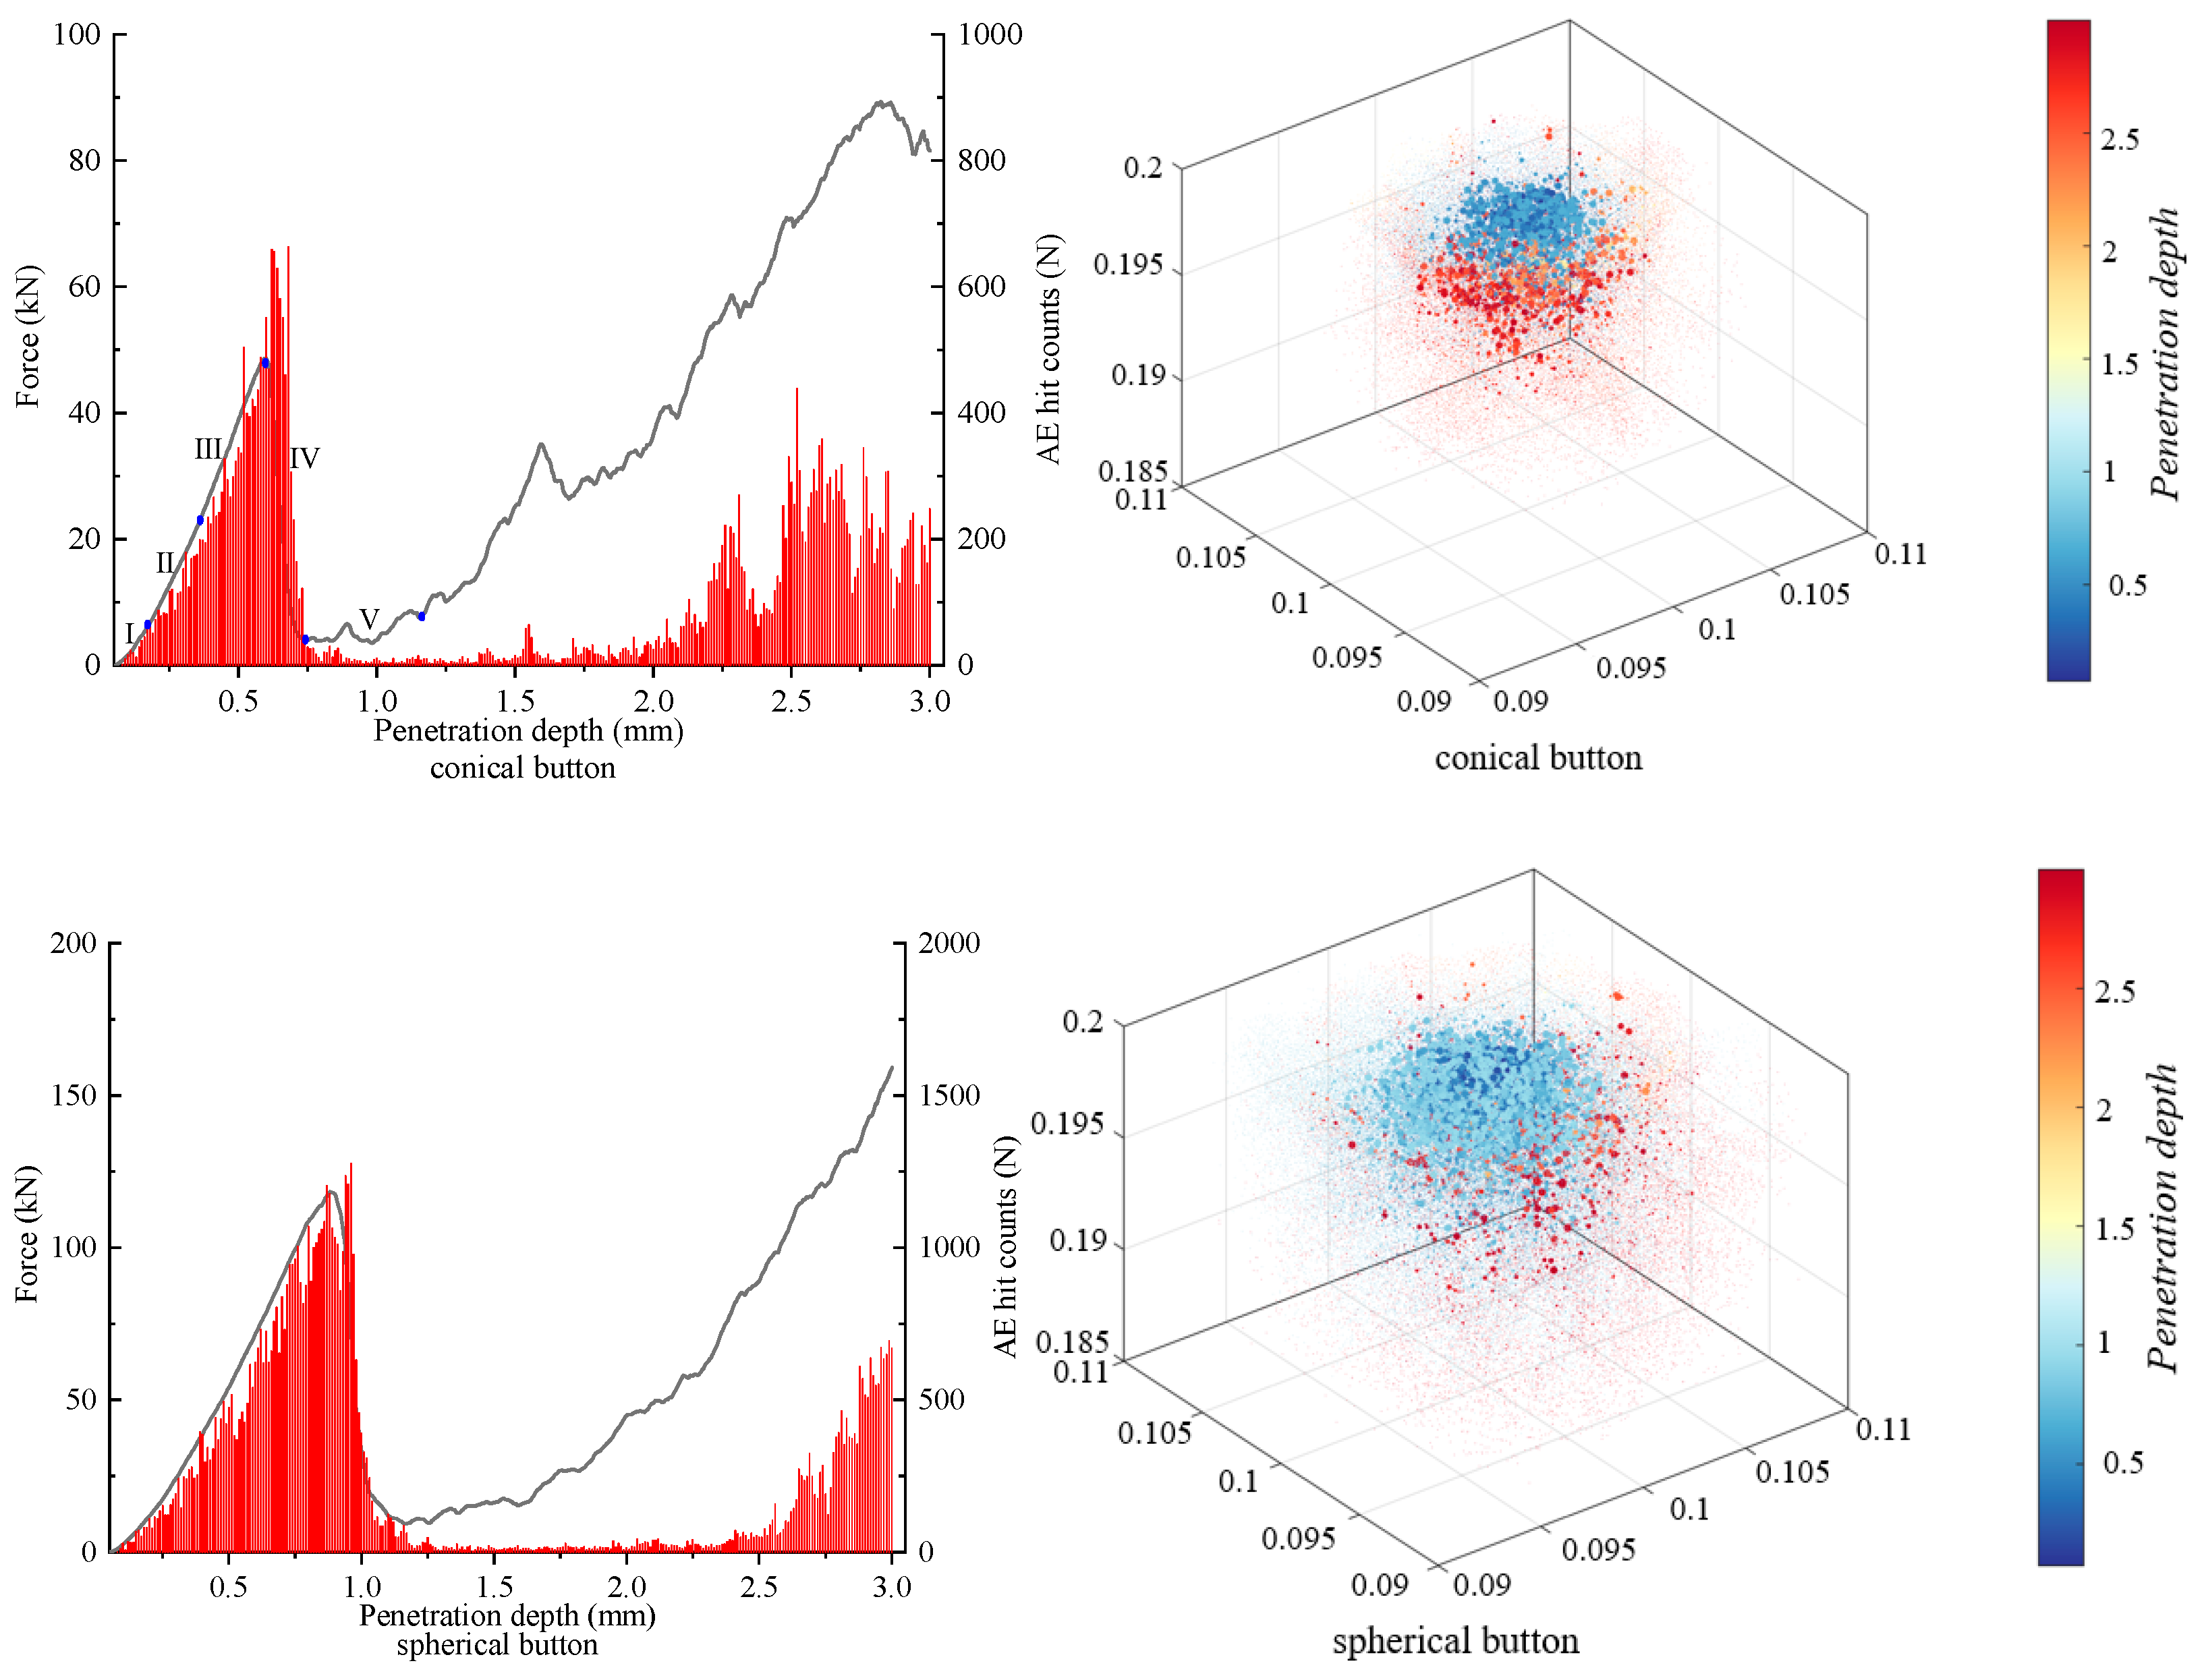
The force–penetration depth curves and acoustic emission (AE) events caused by five types of carbide buttons are depicted in Figure 8. In the spatial distribution graph of the AE events, the size of points represents their energy magnitude, while the color indicates the penetration depth at which they formed. The force–penetration depth curves for all five buttons exhibited a consistent trend of multiple loading–unloading cycles. During each loading–unloading cycle, the number of AE events gradually increased and reached a peak when the peak force suddenly decreased. Take the conical button as an example. The indentation force gradually increased as the penetration depth increased during stage I. It corresponded with the closure of pre-existing microflaws, and only a few AE events were detected. In stage II, the indentation force increased approximately linearly with the penetration depth. The number of AE events also increased gradually, mainly resulting in microcracks. The rock deformed in an elastic–plastic manner. In stage III, the indentation force increased nonlinearly with the increase of penetration depth, indicating that the rock exhibited anisotropic characteristics. The indentation force fluctuated until it reached the peak value, and the rock was severely damaged. During this stage, a large number of AE events were generated. Subsequently, the indentation force dropped sharply and entered unloading stage IV, accompanied by a large number of AE events. The particles at the contact between the button and the rock were completely destroyed, forming a crushed zone. When reaching stage V, the load transfer capacity of the crushed zone was almost zero, and the indentation force increased very slowly until the rock was recompacted and entered a new loading and unloading cycle. Due to the loss of symmetry in the stress distribution under the carbide button after the rock was damaged, the fluctuation of indentation force was more obvious in the new cycle. The peak forces of the saddle, spherical, wedge, parabolic, and conical buttons were 135, 118, 116, 53, and 49 kN, respectively. This indicated that the saddle button required the maximum thrust provided by the equipment during rock breaking.
The contact between conical, spherical, and parabolic buttons and rocks is point contact. They have the same AE event distribution pattern, i.e., a hemispherical high-density AE event aggregation zone was formed beneath the button during the first loading and unloading cycle. New AE events subsequently occurred uniformly outside the zone as the carbide buttons continued to penetrate into the rock. Among these three buttons, the spherical button produced the largest AE zone range and most AE events during the first loading and unloading cycle. This is because its profile has the largest curvature, which allows it to penetrate the largest volume at the same depth. The contact between the wedge button and the rock can be described in a linear manner. AE events first occurred at the chamfers on both ends of the button, and a slit-shaped high-density AE events aggregation zone was formed beneath the wedge button during the first loading and unloading cycle. New AE events in the following loading cycles mainly occurred beneath the zone. For the saddle button, its contact with the rock started at point contact and gradually transformed into an arc-shaped line contact as the penetration depth increased. AE events first occurred at the contact point between the saddle button and the rock, and a slit-shaped high-density AE events aggregation zone was formed beneath the saddle button in the first cycle. Different from other buttons, new AE events mainly occurred at both ends of the slit-shaped AE zone.

4.2. Crack Propagation Pattern

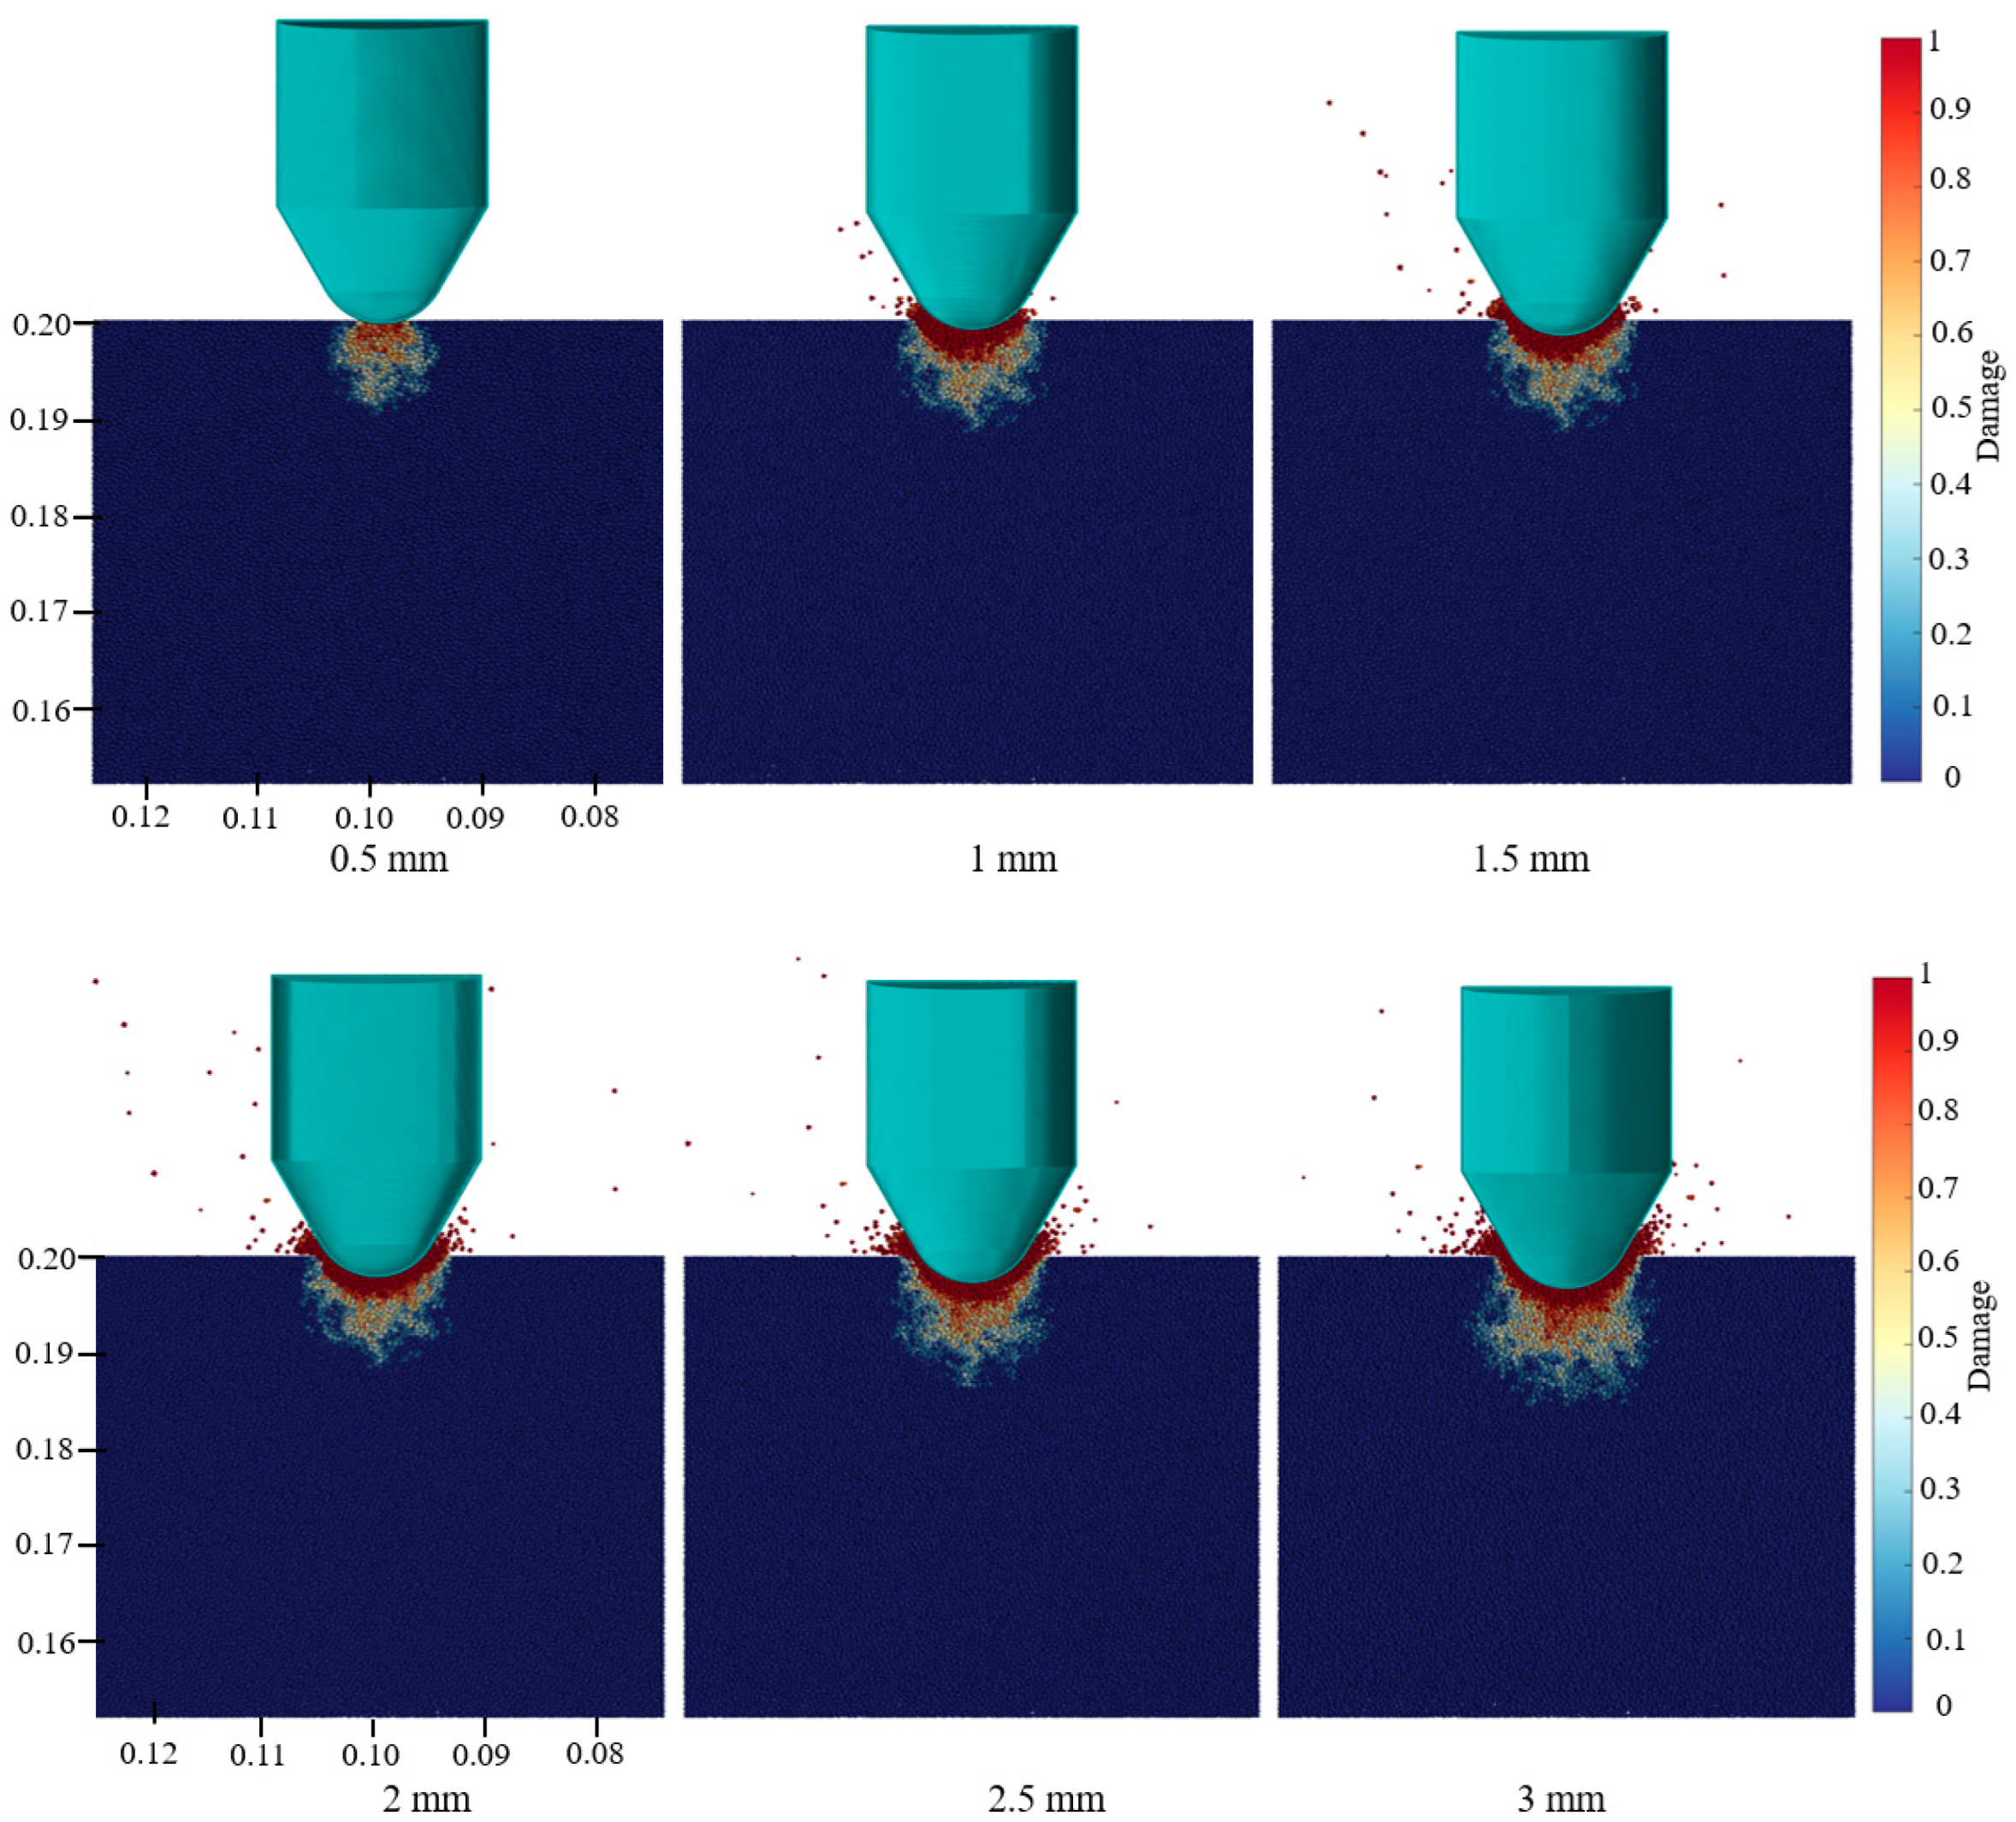
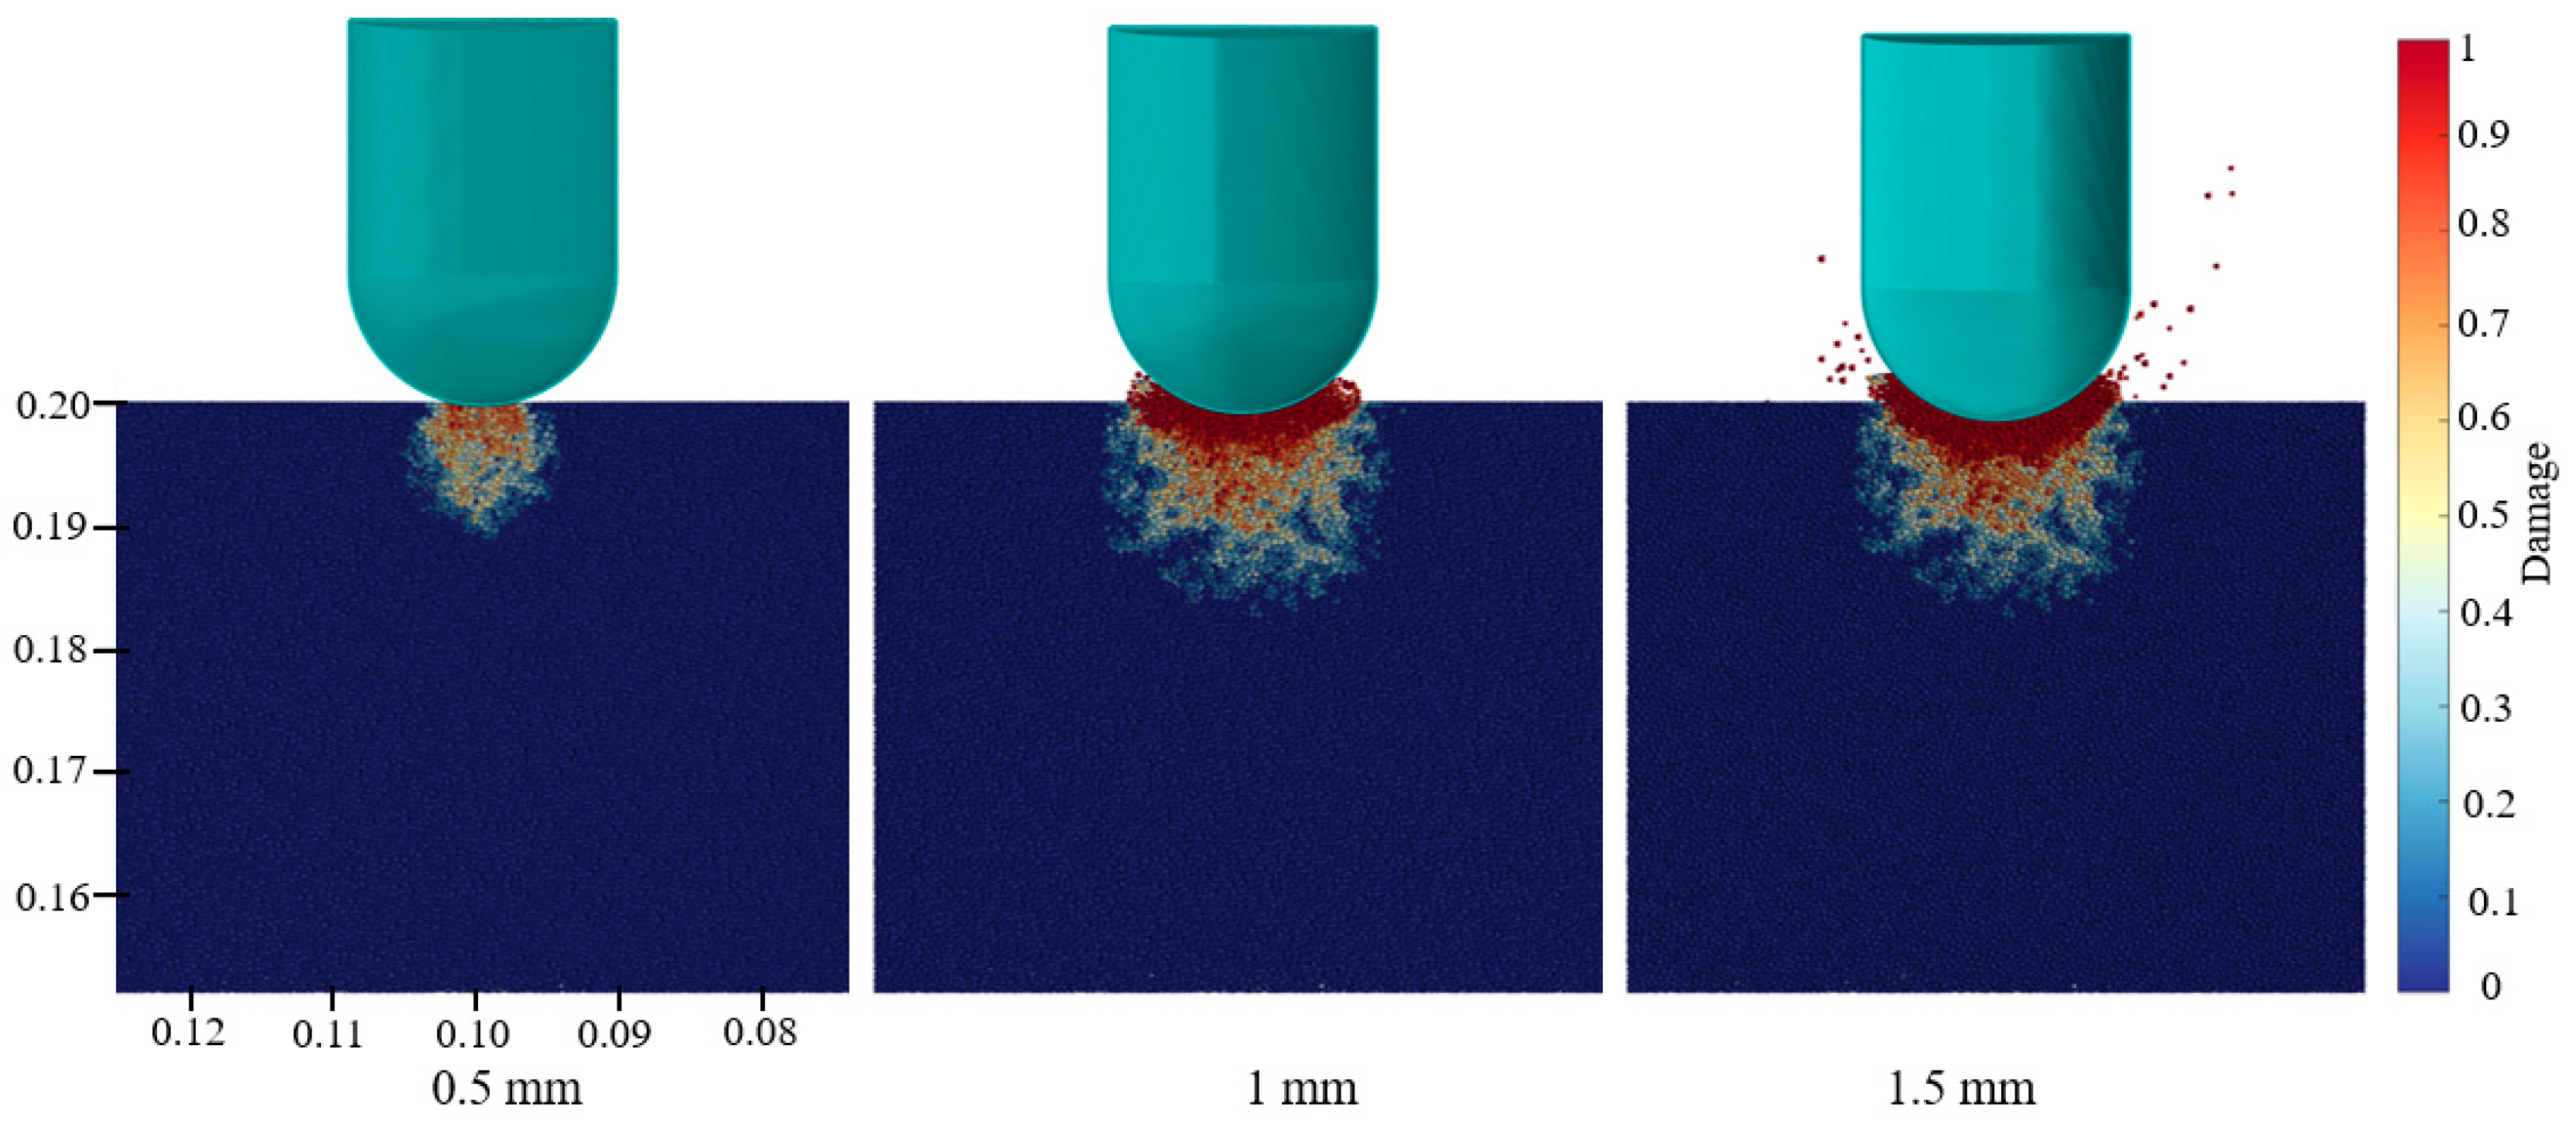
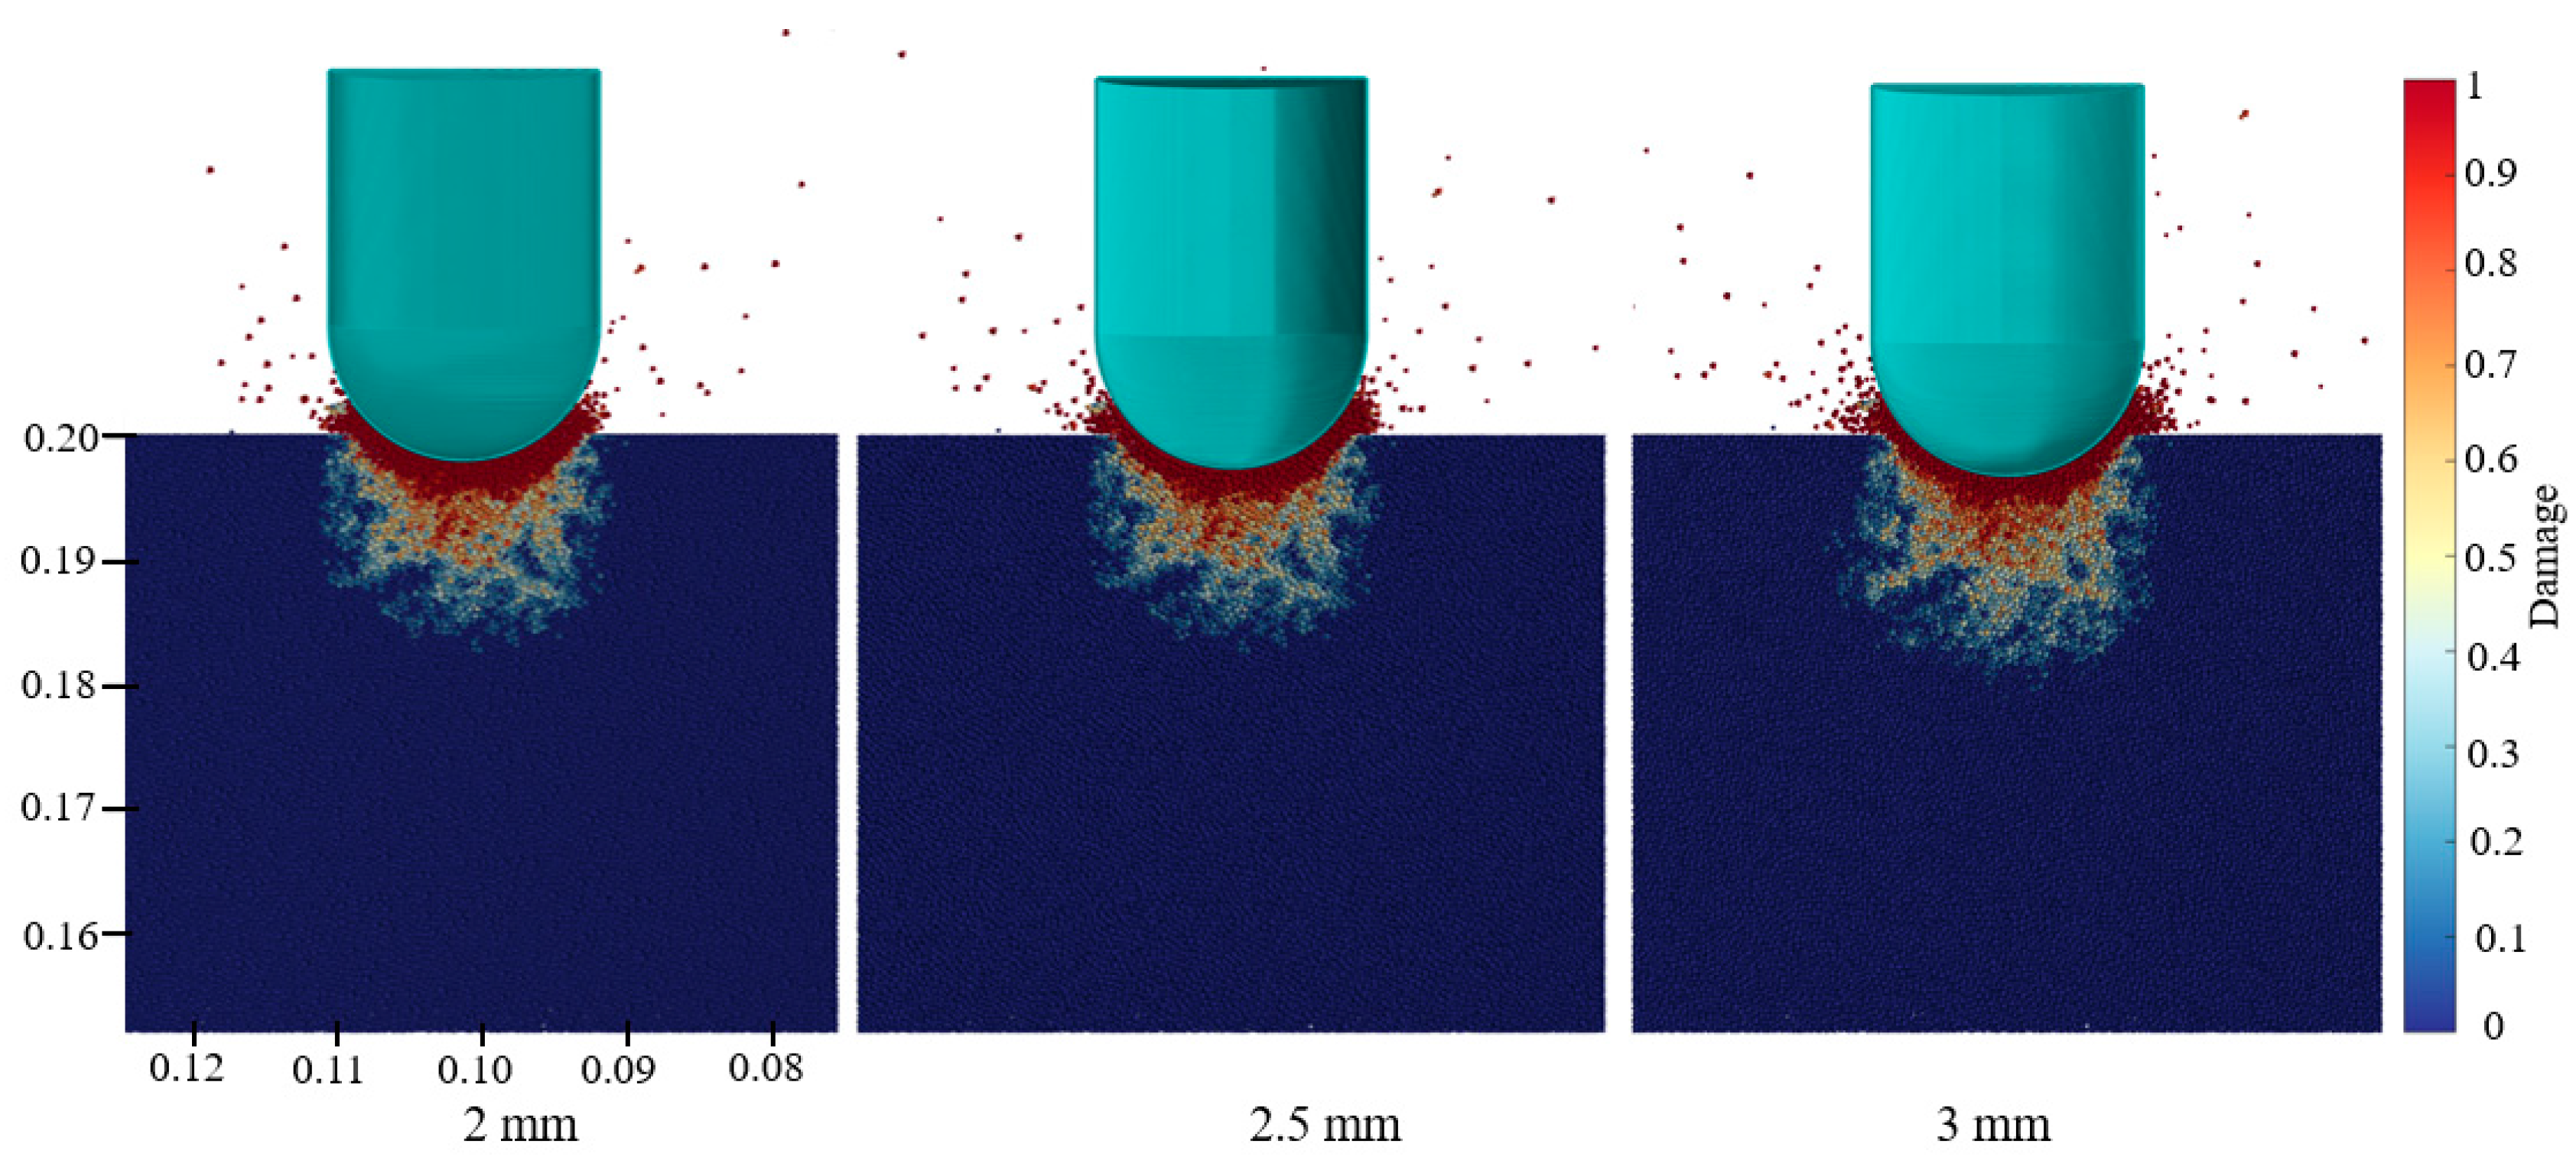
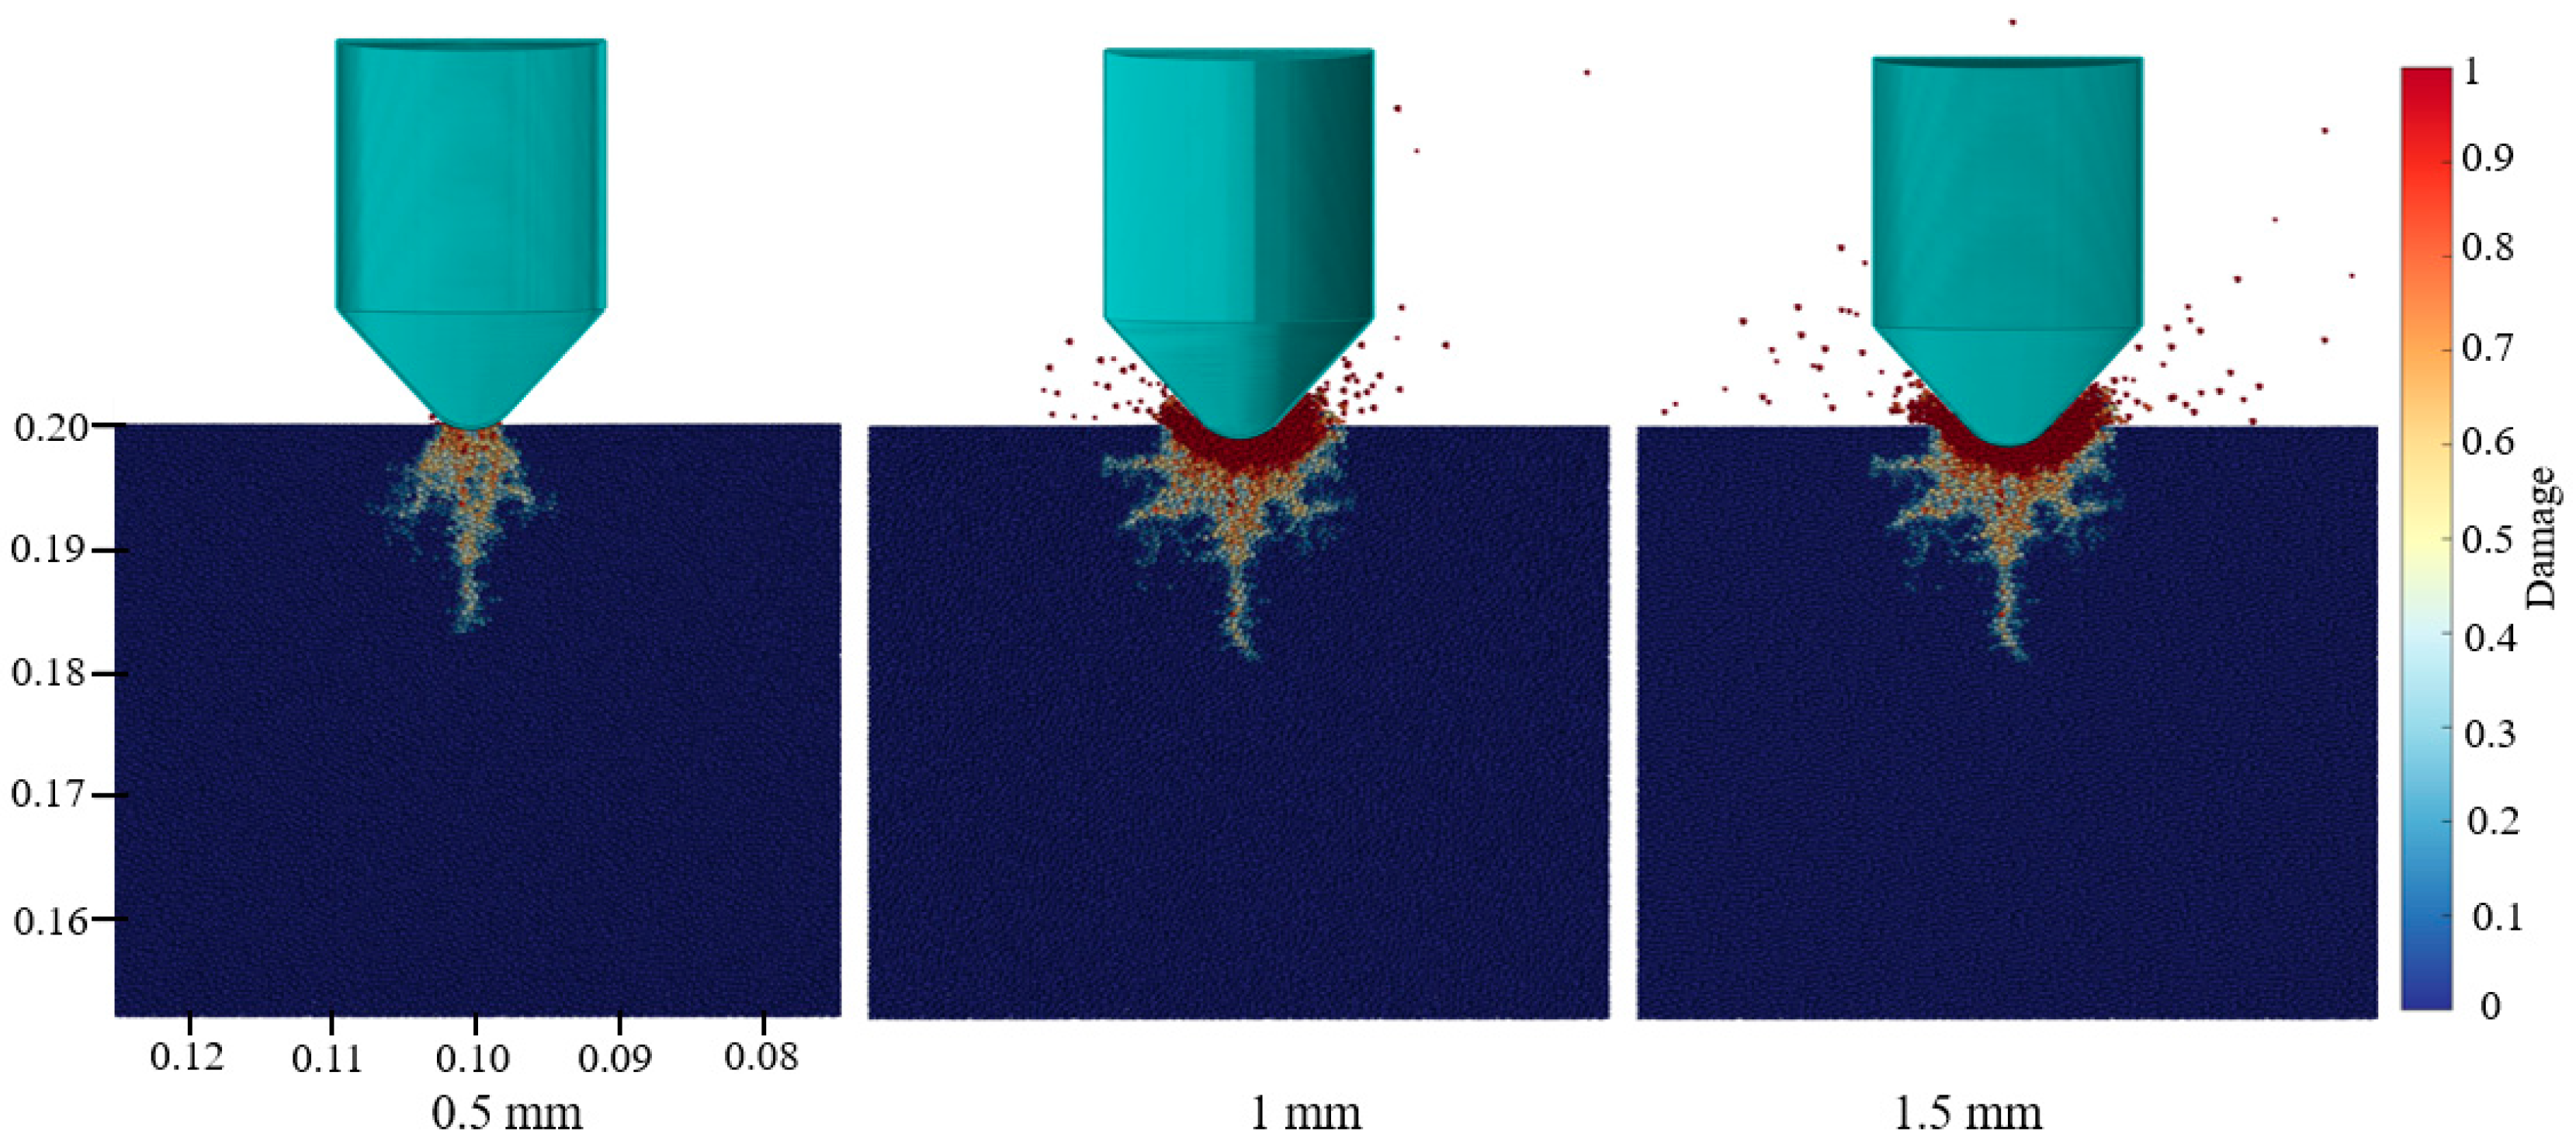
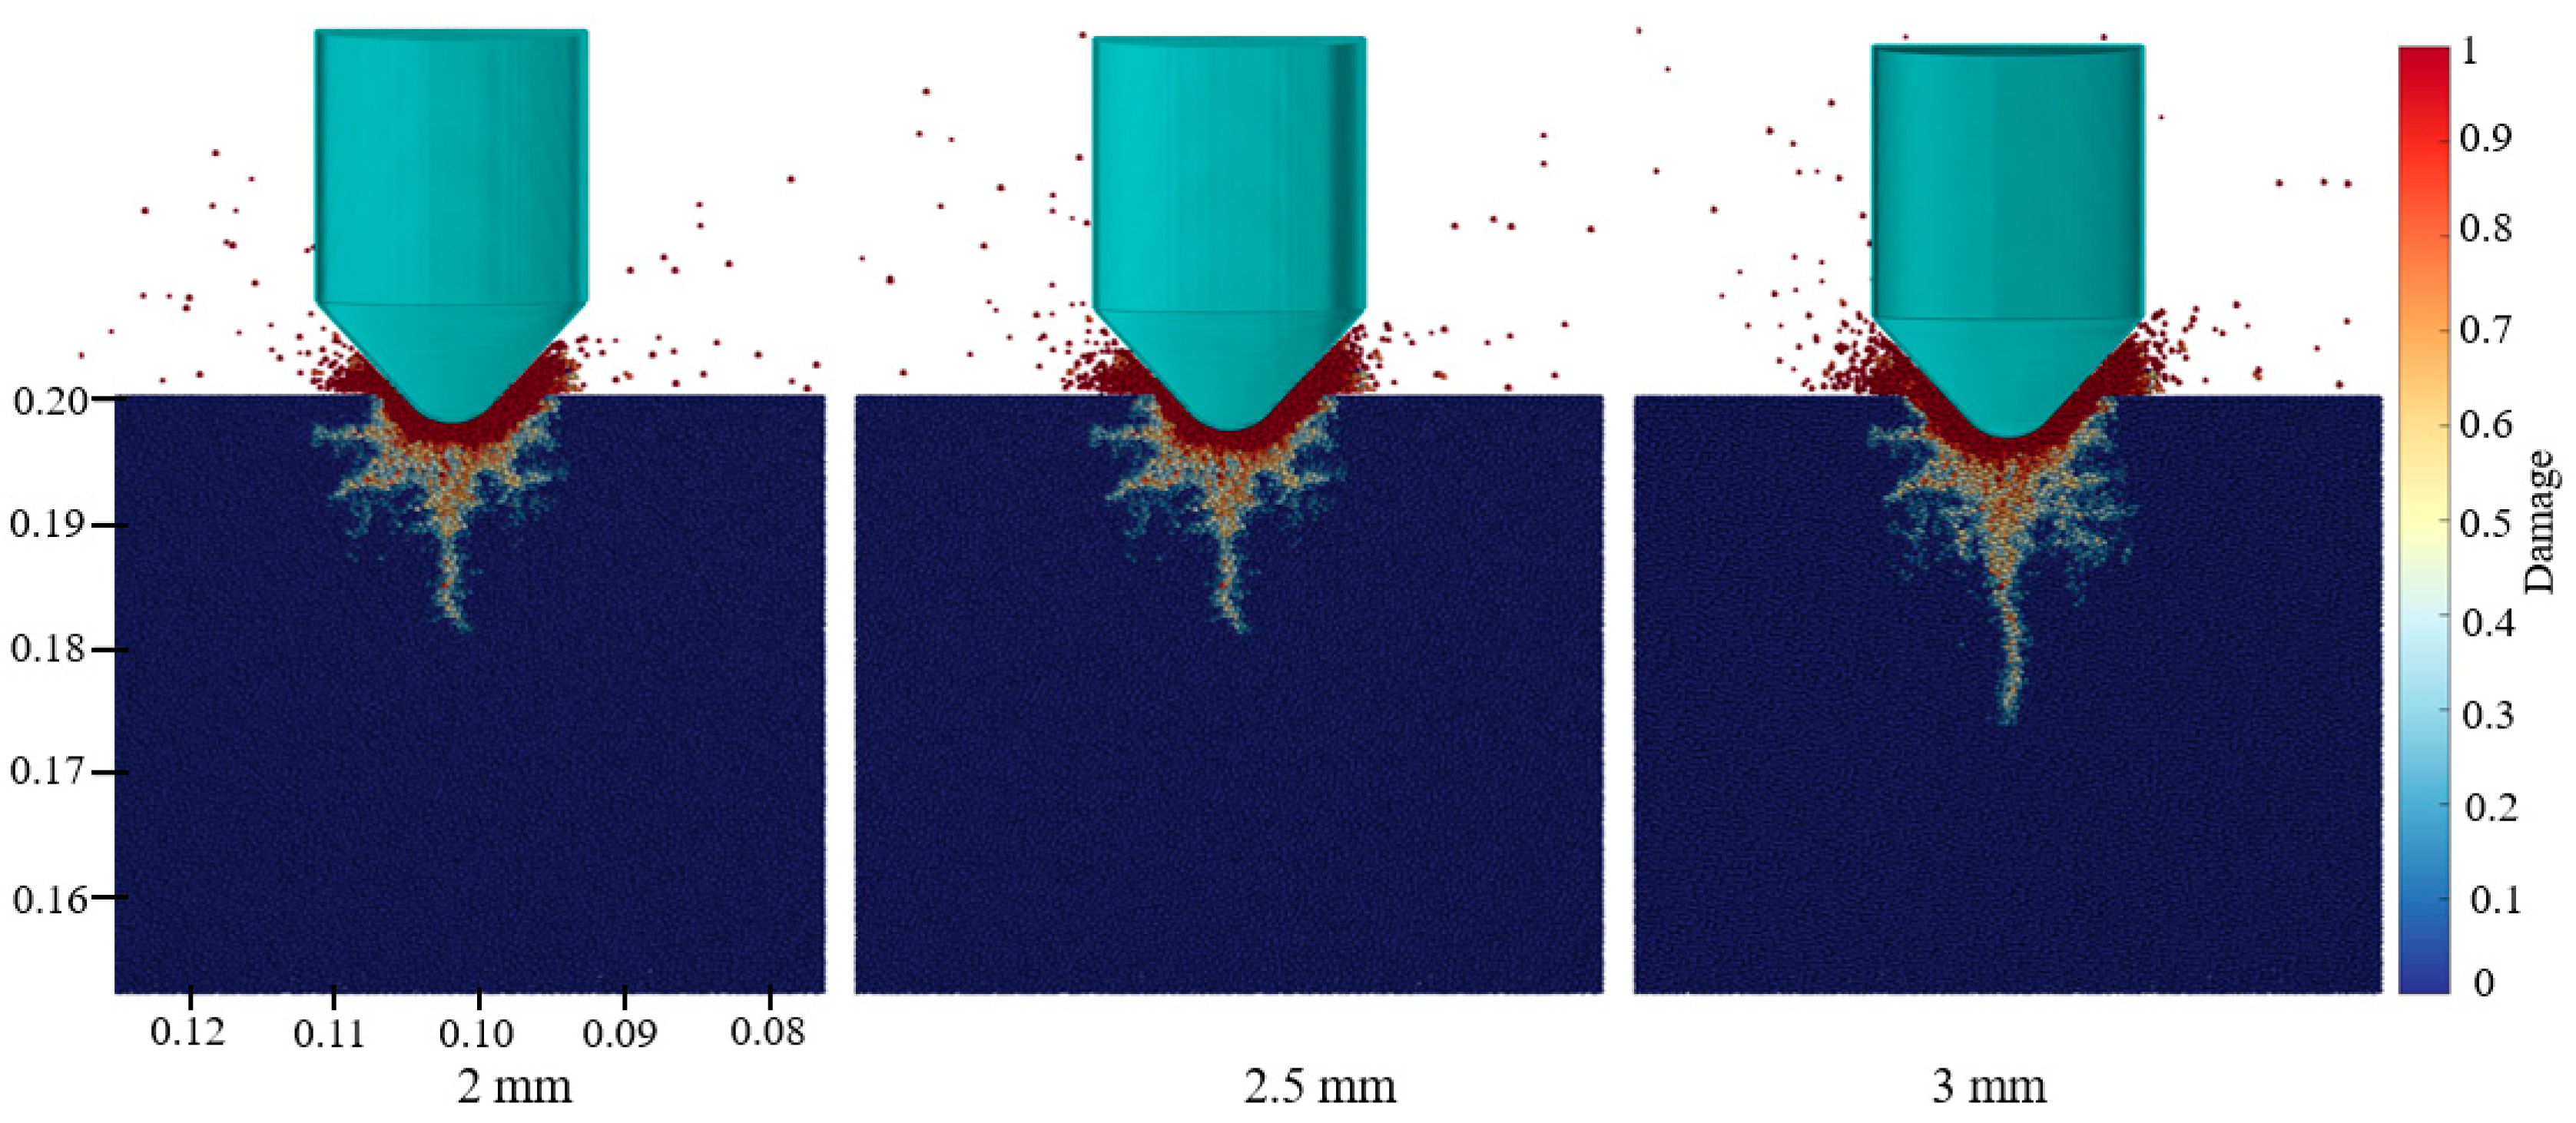
Figure 9, Figure 10, Figure 11, Figure 12 and Figure 13 depict the crack propagation patterns formed by five carbide buttons at various penetration depths. When the penetration depth was 0.5 mm, the rock failure mainly occurred directly beneath the carbide button, forming a crushed zone, but the number of cracks was relatively small. As the penetration depth increased, the dense crushed zone transferred energy to the hemispherical plastic failure zone, resulting in a large number of cracks at the penetration depth of 1 mm. There are more tensile cracks than shear cracks, indicating that tensile failure dominates the rock damage. As the penetration depth further increased, the trend of increasing the failure zone slowed down, but the cracks still had some extension.
The final crack pattern indicates that conical, parabolic, and spherical buttons mainly produced uniform radial propagation. Both wedge and saddle buttons produced vertical cracks. The vertical cracks produced by the wedge button were significantly longer than other buttons. Besides, the lateral cracks produced by the saddle button were significantly longer than the vertical cracks. The coalescence of lateral cracks between adjacent carbide buttons will form rock fragments, and the length of lateral cracks has a significant impact on the chip size and rock breaking efficiency. Therefore, the saddle button has the greatest rock breaking potential.

4.3. Stress Distribution

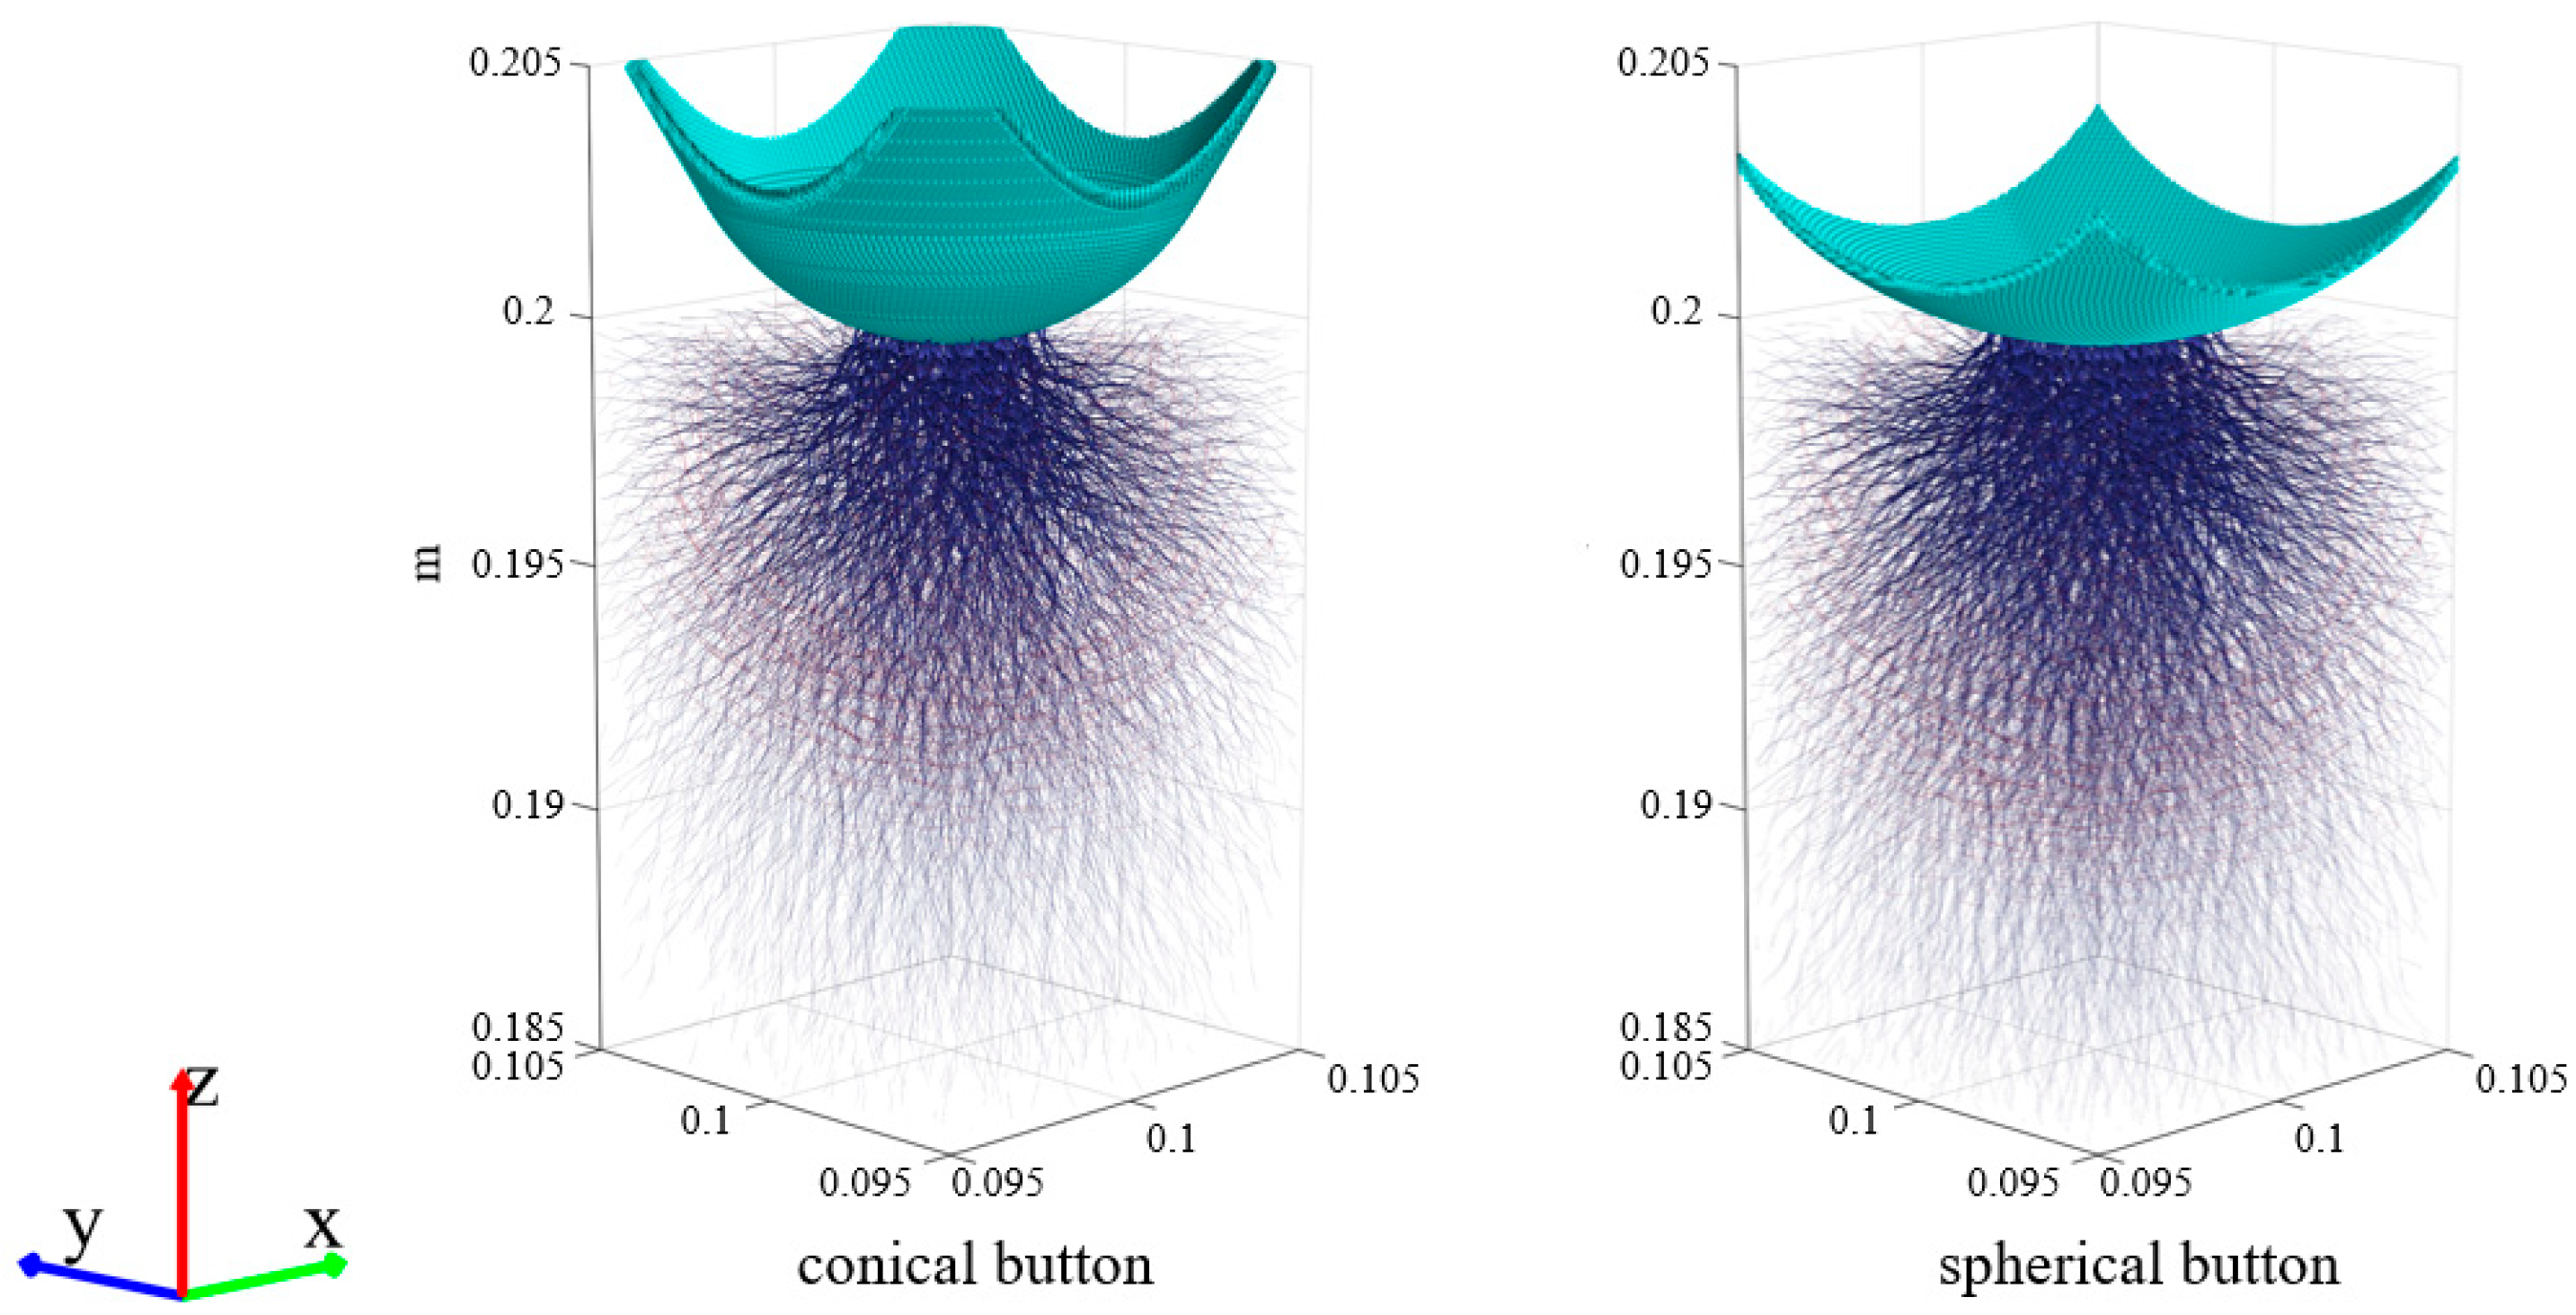
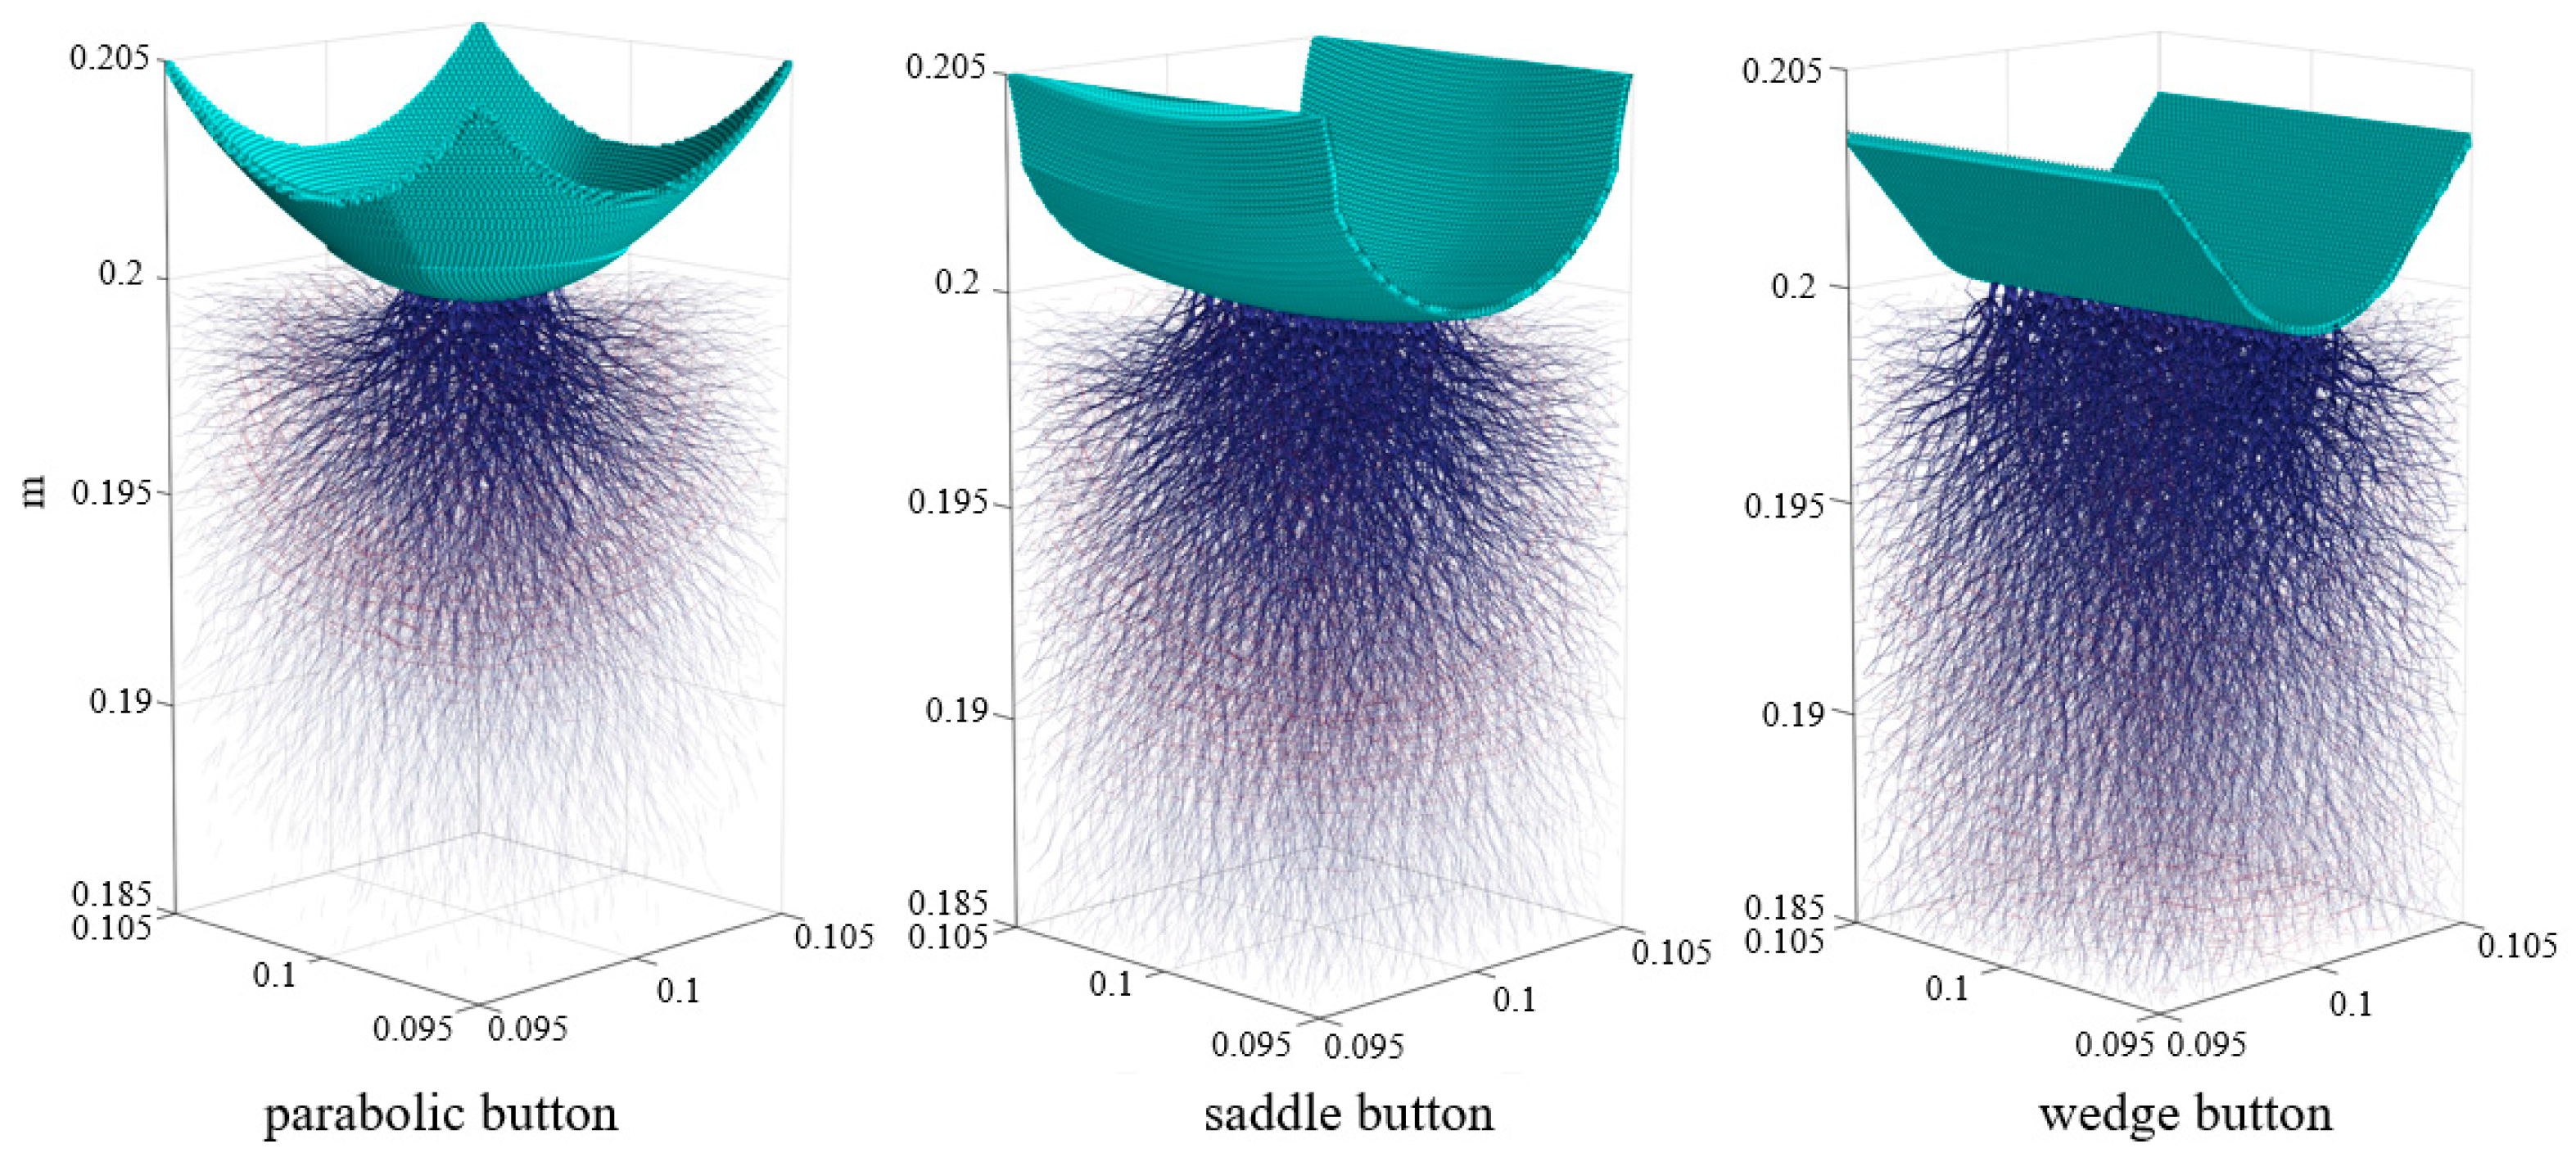
For a better explanation of the rock failure mechanism subjected to different buttons, the force chain between particles at the penetration depth of 0.5 mm was analyzed, as shown in Figure 14. The thickness and direction of the line correspond to the magnitude and direction of normal force, respectively. Red represents tension, while blue represents pressure. The tension distribution is spherical, while the pressure is radially spread. This is in accordance with the famous Boussinesq elastic field. For conical, spherical, or parabolic buttons, a hemispherical contact force chain was established beneath these buttons under point contact load, forming uniform radial cracks. The force chain of the wedge button was distributed in an inverted pyramid shape, which was the reason why vertical cracks were more developed. In terms of stress distribution ranges, the wedge button had the largest, followed by saddle and spherical buttons, and conical and parabolic buttons had the smallest. It could explain the difference in indentation force required for each carbide button to penetrate into rocks at the same penetration depth.

5. Cutting Performance Evaluation

5.1. Penetration Index

The penetration index was also widely used to assess the difficulty of rock breaking with cutting tools. Morris et al. [52] established a drillability index p′/F, by measuring the crater depth (p′) produced at the threshold force (F) at which chips form. i.e., the peak force. The method is not suitable for situations where rock fragments are not formed. The different drillability index in this study can be applied to any condition, whether chip formation occurs or not. The indentation force and the penetration depth were automatically recorded during the indentation process, and the penetration index ( P I ) is the ratio of the maximum force at each penetration depth ( F m ) to the maximum penetration depth ( p ), indicating how difficult it is for an indenter to penetrate the rock, as calculated by Equation (7).
P I = F m p
where P I is the penetration index, F m is the maximum force at each penetration depth (kN), and p is the maximum penetration depth (mm).
The P I values for saddle, spherical, wedge, parabolic, and conical buttons were 45, 39, 38, 17, and 16 kN/mm, respectively. This indicated that the conical button had the highest penetration ability, while the saddle button was the worst. The conical button was easier to penetrate into the rock. However, the force–penetration curve only reflects the performance of the cutter in penetrating into rocks, without considering the volume of rock fragmentation. Therefore, the crack propagation pattern and energy consumption should be carefully studied.

5.2. Crack Pattern

The propagation and coalescence of cracks between adjacent carbide buttons cause the button cutter to break rocks, resulting in rock fragments. The size of the rock fragments is determined by the extent of the lateral crack propagation as a carbide button penetrates into the rock. The radial crack propagation direction has an inclined angle with the free surface of the rock, which can represent the rock breaking volume of a carbide button. Therefore, the propagation range of lateral or radial cracks has a significant impact on the rock breaking volume and specific energy. Therefore, the larger the lateral or radial crack’s propagation range, the greater the rock breaking potential of the carbide button. The ratio of the crack width to depth is defined to reflect the rock breaking potential of a carbide button. A large ratio of the crack width to depth corresponds to a high rock breaking potential. It can be calculated by Equation (8):
χ = w c d c
where χ is the width-to-depth ratio, w c is the width of the crack zone (mm), and d c is the depth of the crack zone (mm).
The ratio of crack width to depth χ with penetration depth is shown in Figure 15. Except for the parabolic button, all buttons generated the largest χ at or near the penetration depth of 1 mm, consistent with the penetration depth corresponding to the first peak force. The saddle button had the largest χ, while the wedge button had the smallest χ. This indicates that the saddle button is more prone to produce lateral cracks while the wedge button is more prone to produce vertical cracks. Therefore, the wedge button is not suitable for the Beishan granite, while the saddle button has the greatest rock breaking potential.

5.3. Specific Energy

Specific energy ( S E ) is usually used to evaluate the rock breaking efficiency of rock-cutting tools. It is defined as the amount of energy required to break a unit volume of rocks and can be calculated using Equation (9):
S E = W V = 0 3 F p d p V
where S E denotes the specific energy (KJ/cm3), W denotes the consumption energy (KJ), and V denotes the volume of rock fragments (cm3).
The specific energy values of five carbide buttons at different penetration depths are shown in Figure 16. When the penetration was 0.5 mm, there were almost no rock fragments generated beneath the carbide button, so the specific energy was not calculated. The S E values with conical buttons were smaller when the penetration depth was less than or equal to 1.5 mm. The S E value of the saddle button decreased as the penetration depth increased. The research results showed that the carbide button and the saddle button are the best choices as the button cutter’s penetration depth varies.

5.4. Energy Dissipation Distribution

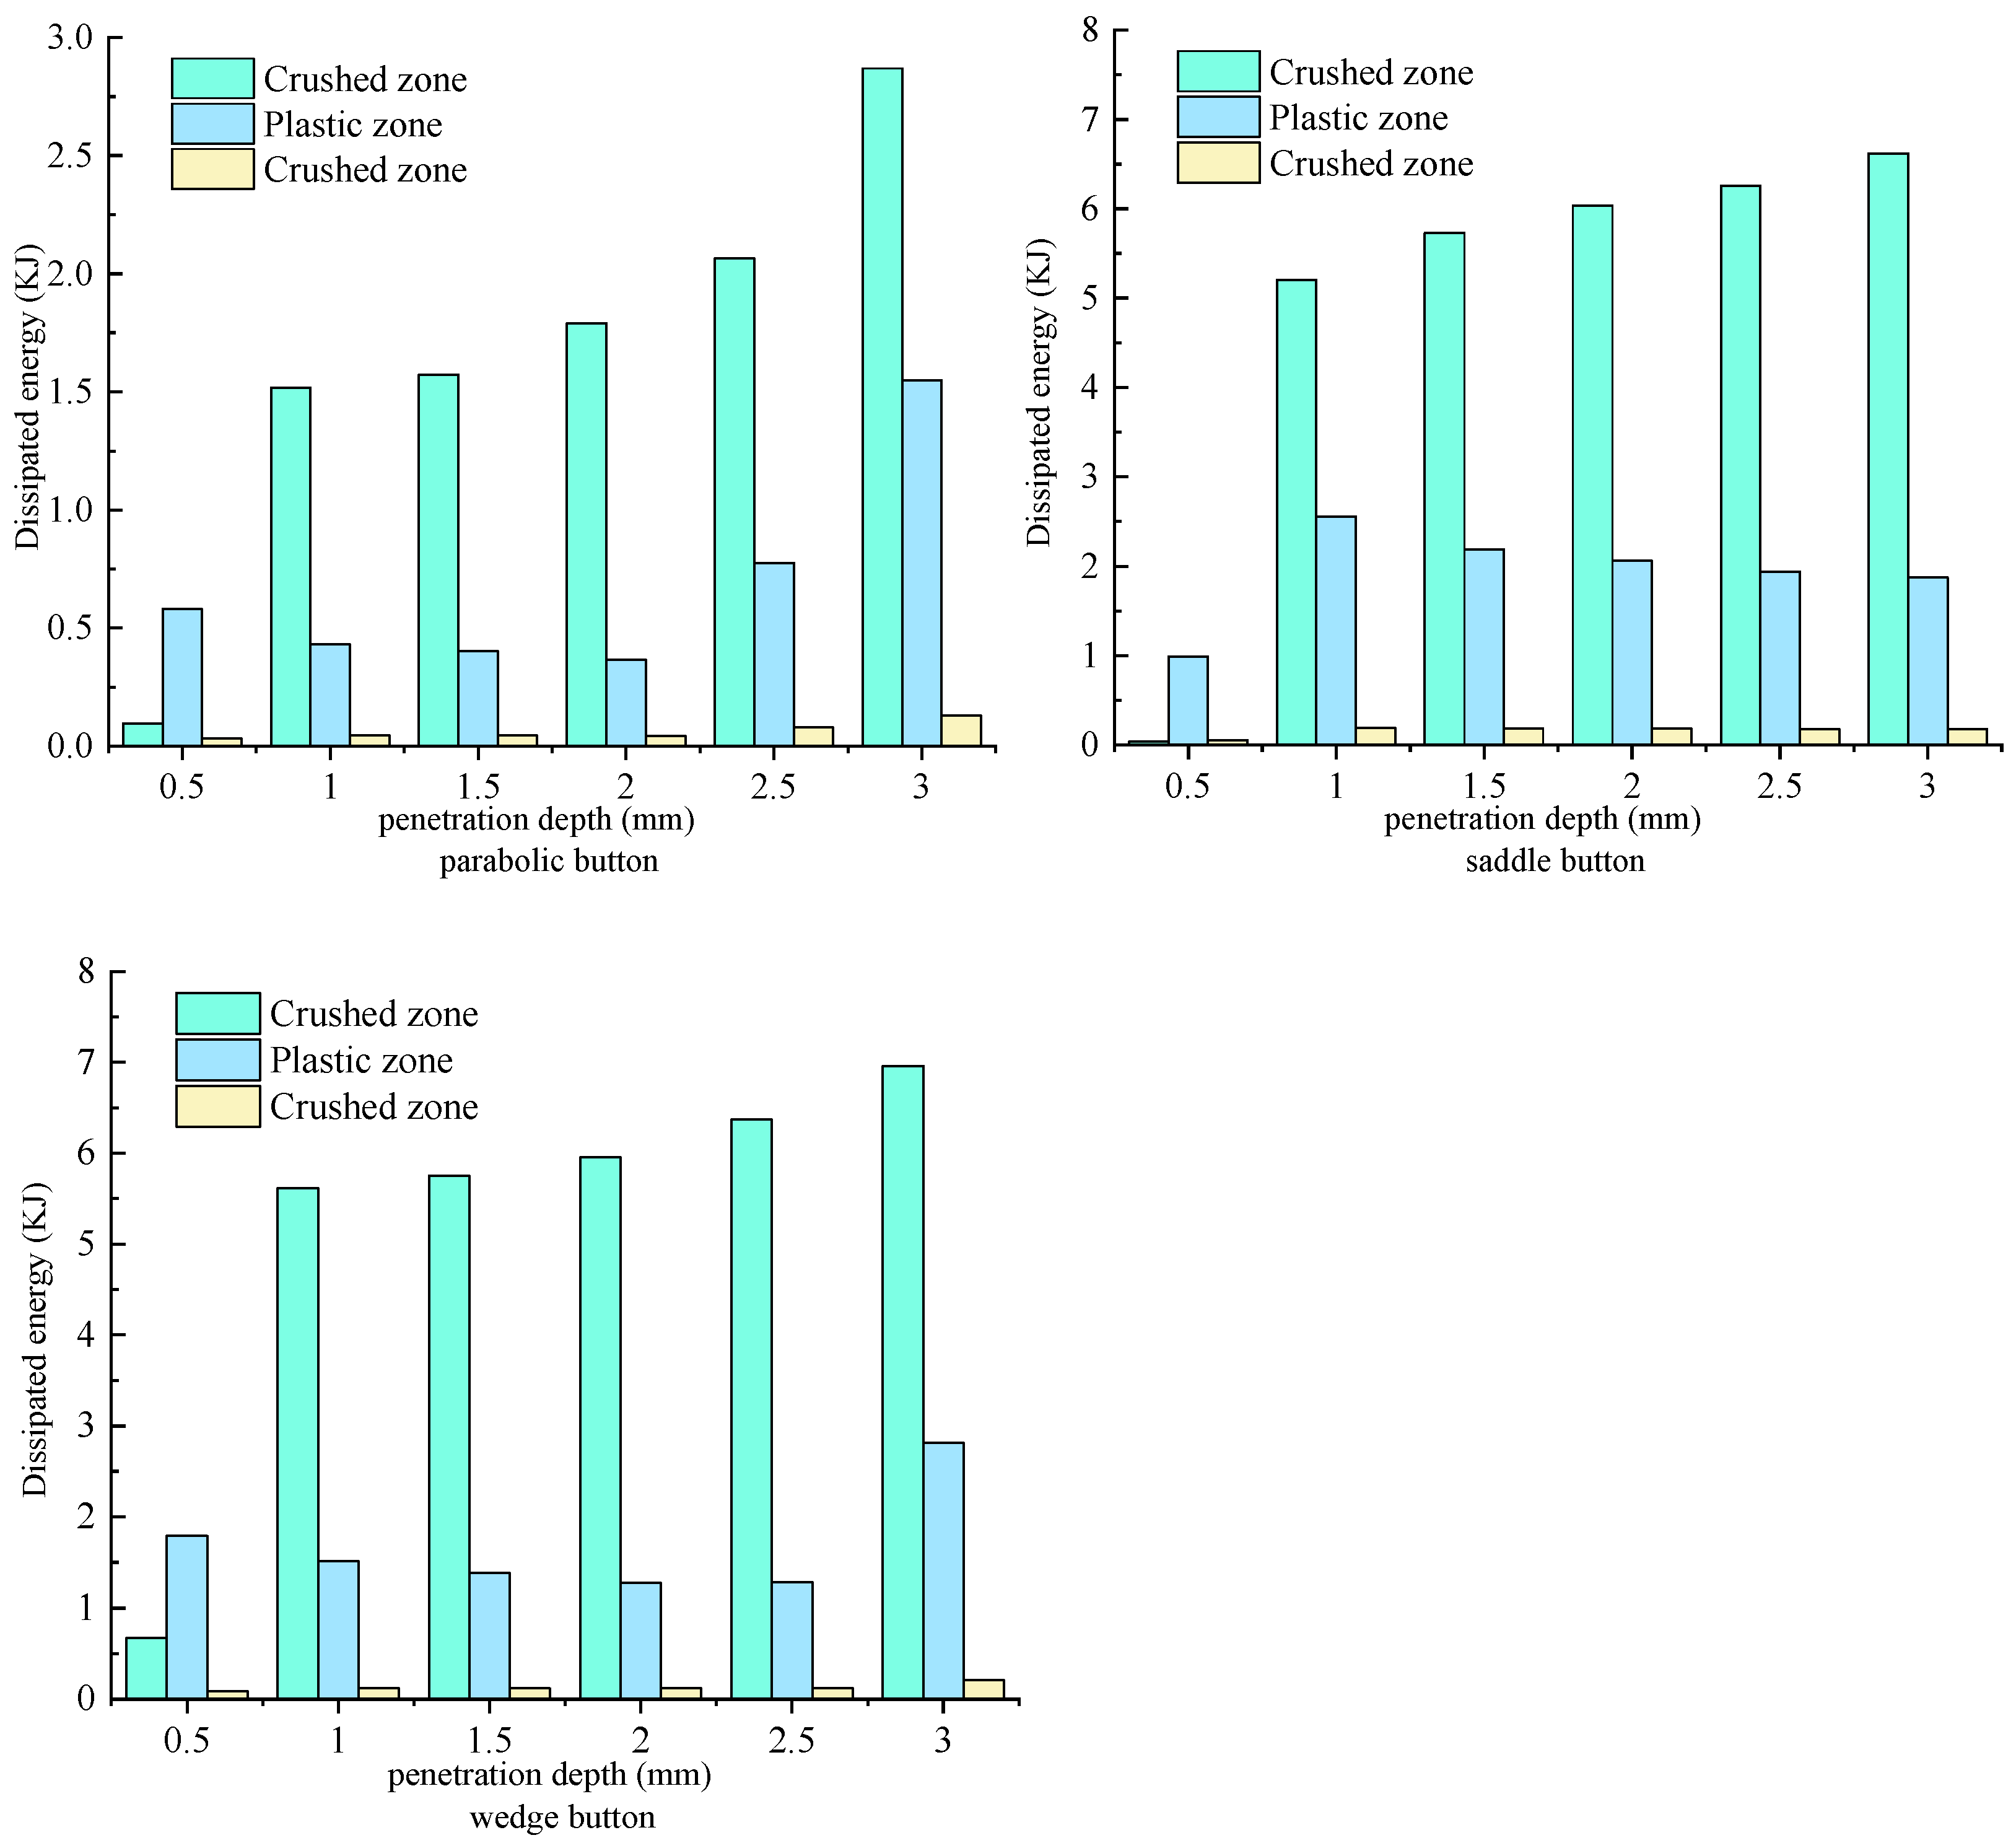
Previous studies have rarely analyzed the distribution of energy consumption during three-dimensional rock breaking processes. The proportion of energy consumption distribution in the crushed, plastic, and main cracked zones can reflect the rock breaking efficiency of carbide buttons. The higher proportion of energy consumption in the crushed zone, the lower the energy consumption used to generate cracks, and the lower the rock breaking potential of the carbide button. The distribution of dissipated energy in three damaged zones under these five buttons at various penetration depths is depicted in Figure 17. It was found that the energy consumption in the crushed zone of carbide buttons cutting rock was around 67~76%, and that in the plastic zone was between 17~21%, while that for crack propagation was only less than 4~6%. The spherical and saddle buttons consumed the least energy in the crushed area, indicating better energy utilization and distribution. Because these two carbide buttons had a larger contact area with rocks, the range of the crushed zone generated was also larger, resulting in an increase in the contact area between the crushed and plastic zones, which could transfer more energy to the plastic zone and generate more cracks.

6. Conclusions

Investigating the rock breaking mechanism of carbide buttons is the key to designing a button cutter. In this study, the three-dimensional discrete element method was used to study the rock breaking mechanism of five commonly used carbide buttons, i.e., spherical, saddle, wedge, conical, and parabolic buttons. In order to obtain high-resolution simulation results, a local particle refinement scheme was employed for the establishment of numerical models, and a GPU parallel technique was used to accelerate the simulation. The rationality of the numerical simulation results was verified by the indentation test. Further, a detailed comparative analysis was conducted on five different buttons, including crack propagation patterns, energy dissipation, and damage evolution associated with the force–penetration depth curve.
Cracks’ distributions are different. For conical, spherical, or parabolic buttons, a hemispherical contact force chain was established beneath these buttons under a point contact load, and a hemispherical high-density AE event aggregation zone was formed beneath the buttons, forming uniform radial cracks. The wedge button was in a line contact with the rock, and the force chain was distributed in an inverted pyramid shape. AE events first occurred at the chamfers on both ends of the button, a slit-shaped high-density AE events aggregation zone was formed beneath the wedge button as the penetration depth increased, and new AE events mainly occurred beneath the zone after the first failure of the rock, which was the reason why vertical cracks were more developed. The contact between the saddle button and the rock changed from point to curved surface contact as the penetration depth increased, and the contact force chain also changed from a hemispherical to an inverted pyramid shape. AE events first occurred at the contact point, and a slit-shaped high-density AE events aggregation zone was formed beneath the saddle button as the penetration depth increased. The newly generated AE events mainly occurred at both ends of the slit-shaped AE zone after the first failure of the rock. Therefore, the saddle button was prone to produce vertical and lateral cracks, but the lateral cracks are more developed.
The penetration index, crack propagation characteristics, specific energy, and energy dissipation distribution were systematically explored. In terms of penetration index, the conical button was easier to penetrate into rocks, while the wedge button was the most difficult to penetrate. In terms of crack propagation pattern, the saddle button was prone to produce longer lateral cracks, which helped to form large rock fragments. In terms of specific energy, the conical button had lower specific energy at low penetration depth, while the saddle button had lower specific energy at high penetration depth. In terms of energy dissipation distribution, the spherical and saddle buttons were better. Overall, the saddle button had more advantages in breaking hard rocks such as Beishan granite.

Author Contributions

Conceptualization: Q.G.; Methodology: X.Z. and Y.M.; Simulation: Y.M.; Formal analysis and investigation: Y.M., H.M. and X.Z.; Writing—original draft preparation: Y.M. and L.Y. All authors have read and agreed to the published version of the manuscript.

Funding

This research received no external funding.

Institutional Review Board Statement

Not applicable.

Data Availability Statement

Data will be provided upon request.

Acknowledgments

This work has been supported by the China Atomic Energy Authority (CAEA) through the Geological Disposal Program.

Conflicts of Interest

The authors declare no conflict of interest.

References

  1. Kujundžić, T.; Korman, T.; Macenić, M. State of the art of drilling large diameter boreholes for deposition of high level waste and spent nuclear fuel. Rud.-Geološko-Naft. Zb. 2012, 24, 49–59. [Google Scholar]
  2. Autio, J.; Kirkkomäki, T. Boring of Full Scale Deposition Holes Using a Novel Dry Blind Boring Method; Report POSIVA-96-07; Posiva Oy: Eurajoki, Finland, 1996. [Google Scholar]
  3. Andersson, C.; Johansson, Å. Boring of Full Scale Deposition Holes at the Äspö Hard Rock Laboratory. Operational Experiences Including Boring Performance and a Work Time Analysis; Svensk Kärnbränslehantering AB SWECO: Solna, Sweden, 2002. [Google Scholar]
  4. Wu, F.; Yin, L.; Zhang, H.; Gong, Q. Rock Fragmentation Mechanism and Efficiency Under Inserted-tooth Roller Cutter by Rotary Cutting Test. China J. Highw. Transp. 2018, 31, 150–159. [Google Scholar]
  5. Zou, J.; Huang, X.; Gao, M.; Pang, J. Numerical Discrete Element Analyses for Rock-Breaking Effects of Inserted-Tooth Hob and Cooperative Mechanism Between the Inserted Tooth. Geotech. Geol. Eng. 2023, 41, 1325–1338. [Google Scholar] [CrossRef]
  6. Kou, S.Q. Some Basic Problems in Rock Breakage by Blasting and by Indentation. Ph.D. Thesis, University of Luleå, Luleå, Sweden, 1995. [Google Scholar]
  7. Lindqvist, P.A. Rock Fragmentation by Indentation and Disc Cutting. Ph.D. Thesis, University of Luleå, Luleå, Sweden, 1982. [Google Scholar]
  8. Pang, S.S.; Goldsmith, W. Investigation of Crack Formation During Loading of Brittle Rock. Rock Mech. Rock Eng. 1990, 23, 53–63. [Google Scholar] [CrossRef]
  9. Pang, S.S. Investigations of Pneumatic Percussive Processes Involving Rocks. Ph.D. Thesis, University of California, Berkeley, CA, USA, 1986. [Google Scholar]
  10. Cook, N.G.W.; Hood, M.; Tsai, F. Obervations of crack growth in hard rock loaded by an indenter. Int. J. Rock Mech. Min. Sci. Geomech. Abstr. 1984, 21, 97–107. [Google Scholar] [CrossRef]
  11. Ning, B.; Xia, Y.; Lin, L.; Zhang, X.; He, Y.; Liu, Y. Experimental study on the adaptability of cutters with different blade widths under hard rock and extremely hard rock conditions. Acta Geotech. 2020, 15, 3283–3294. [Google Scholar] [CrossRef]
  12. Zou, J.; Yang, W.; Zhang, T.; Wang, X.; Gao, M. Experimental investigation on hard rock fragmentation of inserted tooth cutter using a newly designed indentation testing apparatus. Int. J. Min. Sci. Technol. 2022, 32, 459–470. [Google Scholar] [CrossRef]
  13. Liu, H. Numerical Modelling of the Rock Fragmentation Process by Mechanical Tools. Ph.D. Thesis, Luleå University of Technology, Luleå, Sweden, 2004. [Google Scholar]
  14. Chen, L.H.; Labuz, J.F. Indentation of rock by wedge-shaped tools. Int. J. Rock Mech. Min. Sci. 2006, 43, 1023–1033. [Google Scholar] [CrossRef]
  15. Zhang, H.; Huang, G.; Song, H.; Kang, Y. Experimental investigation of deformation and failure mechanisms in rock under indentation by digital image correlation. Eng. Fract. Mech. 2012, 96, 667–675. [Google Scholar] [CrossRef]
  16. Song, H.; Zhang, H.; Fu, D.; Kang, Y.; Huang, G.; Qu, C.; Cai, Z. Experimental study on damage evolution of rock under uniform and concentrated loading conditions using digital image correlation. Fatigue Fract. Eng. Mater. Struct. 2013, 36, 760–768. [Google Scholar] [CrossRef]
  17. Gao, G.; Yao, W.; Xia, K.; Li, Z. Investigation of the rate dependence of fracture propagation in rocks using digital image correlation (DIC) method. Eng. Fract. Mech. 2015, 138, 146–155. [Google Scholar] [CrossRef]
  18. Yin, L.J.; Gong, Q.M.; Ma, H.S.; Zhao, J.; Zhao, X. Use of indentation tests to study the influence of confining stress on rock fragmentation by a TBM cutter. Int. J. Rock Mech. Min. Sci. 2014, 72, 261–276. [Google Scholar] [CrossRef]
  19. Wei, H.; Zhang, H.; Li, J.; Zheng, J.; Ren, J. Effect of loading rate on failure characteristics of asphalt mixtures using acoustic emission technique. Constr. Build. Mater. 2023, 364, 129835. [Google Scholar] [CrossRef]
  20. Zhao, X.B.; Yao, X.H.; Gong, Q.M.; Ma, H.; Li, X. Comparison study on rock crack pattern under a single normal and inclined disc cutter by linear cutting experiments. Tunn. Undergr. Space Technol. 2015, 50, 479–489. [Google Scholar] [CrossRef]
  21. Zhang, Z.; Zhao, D.; Zhao, Y.; Gao, K.; Zhang, C.; Lv, X. 3D numerical simulation study of rock breaking of the wavy PDC cutter and field verification. J. Pet. Sci. Eng. 2021, 203, 108578. [Google Scholar] [CrossRef]
  22. Xi, Y.; Wang, W.; Fan, L.; Zha, C.; Li, J.; Liu, G. Experimental and numerical investigations on rock-breaking mechanism of rotary percussion drilling with a single PDC cutter. J. Pet. Sci. Eng. 2022, 208, 109227. [Google Scholar] [CrossRef]
  23. Kazerani, T.; Zhao, J. Micromechanical parameters in bonded particle method for modelling of brittle material failure. Int. J. Numer. Anal. Methods Geomech. 2010, 34, 1877–1895. [Google Scholar] [CrossRef]
  24. Peng, J.; Wong, L.N.Y.; Teh, C.I.; Li, Z. Modeling Micro-cracking Behavior of Bukit Timah Granite Using Grain-Based Model. Rock Mech. Rock Eng. 2017, 51, 135–154. [Google Scholar] [CrossRef]
  25. Wong, L.N.Y.; Peng, J. Numerical investigation of micro-cracking behavior of brittle rock containing a pore-like flaw under uniaxial compression. Int. J. Damage Mech. 2020, 29, 1543–1568. [Google Scholar] [CrossRef]
  26. Li, J.; Zhang, J.H.; Yang, X.R.; Zhang, A.; Yu, M. Monte Carlo simulations of deformation behaviour of unbound granular materials based on a real aggregate library. Int. J. Pavement Eng. 2023, 24, 2165650. [Google Scholar] [CrossRef]
  27. Zhu, X.; Qian, G.P.; Yu, H.A.; Yao, D.; Shi, C.; Zhang, C. Evaluation of coarse aggregate movement and contact unbalanced force during asphalt mixture compaction process based on discrete element method. Constr. Build. Mater. 2022, 328, 127004. [Google Scholar] [CrossRef]
  28. Gong, Q.M.; Zhao, J.; Hefny, A.M. Numerical simulation of rock fragmentation process induced by two TBM cutters and cutter spacing optimization. Tunn. Undergr. Space Technol. 2006, 21, 264. [Google Scholar] [CrossRef]
  29. Zhang, X.P.; Wong, L.N.Y. Cracking Processes in Rock-Like Material Containing a Single Flaw Under Uniaxial Compression: A Numerical Study Based on Parallel Bonded-Particle Model Approach. Rock Mech. Rock Eng. 2011, 45, 711–737. [Google Scholar] [CrossRef]
  30. Zhang, X.P.; Wong, L.N.Y. Crack Initiation, Propagation and Coalescence in Rock-Like Material Containing Two Flaws: A Numerical Study Based on Bonded-Particle Model Approach. Rock Mech. Rock Eng. 2012, 46, 1001–1021. [Google Scholar] [CrossRef]
  31. Gong, Q.M.; Zhao, J.; Jiao, Y.Y. Numerical modeling of the effects of joint orientation on rock fragmentation by TBM cutters. Tunn. Undergr. Space Technol. 2005, 20, 183–191. [Google Scholar] [CrossRef]
  32. Gong, Q.M.; Jiao, Y.Y.; Zhao, J. Numerical modelling of the effects of joint spacing on rock fragmentation by TBM cutters. Tunn. Undergr. Space Technol. 2006, 21, 46–55. [Google Scholar] [CrossRef]
  33. Moon, T.; Oh, J. A Study of Optimal Rock-Cutting Conditions for Hard Rock TBM Using the Discrete Element Method. Rock Mech. Rock Eng. 2012, 45, 837–849. [Google Scholar] [CrossRef]
  34. Zhou, X.P.; Zhai, S.F.; Bi, J. Two-Dimensional Numerical Simulation of Rock Fragmentation by TBM Cutting Tools in Mixed-Face Ground. Int. J. Geomech. 2018, 18, 06018004. [Google Scholar] [CrossRef]
  35. Li, X.F.; Li, H.B.; Liu, Y.Q.; Zhou, Q.; Xia, X. Numerical simulation of rock fragmentation mechanisms subject to wedge penetration for TBMs. Tunn. Undergr. Space Technol. 2016, 53, 96–108. [Google Scholar] [CrossRef]
  36. Zhu, X.; Liu, W.; He, X. The investigation of rock indentation simulation based on discrete element method. KSCE J. Civ. Eng. 2016, 21, 1201–1212. [Google Scholar] [CrossRef]
  37. Zhang, X.; Wu, J.; Hu, D.; He, M.; Xia, Y. Comparative Study on Rock Breaking Performances by Arc and Wedge TBM Hob with Two Blades. Geotech. Geol. Eng. 2021, 39, 4581–4591. [Google Scholar] [CrossRef]
  38. Jiang, B.; Zhao, G.F.; Gong, Q.; Zhao, X.-B. Three-dimensional coupled numerical modelling of lab-level full-scale TBM disc cutting tests. Tunn. Undergr. Space Technol. 2021, 114, 103997. [Google Scholar] [CrossRef]
  39. Jiang, H.; Meng, D. 3D numerical modelling of rock fracture with a hybrid finite and cohesive element method. Eng. Fract. Mech. 2018, 199, 280–293. [Google Scholar] [CrossRef]
  40. Rojek, J.; Oñate, E.; Labra, C.; Kargl, H. Discrete element simulation of rock cutting. Int. J. Rock Mech. Min. Sci. 2011, 48, 996–1010. [Google Scholar] [CrossRef]
  41. Su, O.; Akcin, N.A. Numerical simulation of rock cutting using the discrete element method. Int. J. Rock Mech. Min. Sci. 2011, 48, 434–442. [Google Scholar] [CrossRef]
  42. Xiao, N.; Zhou, X.P.; Gong, Q.M. The modelling of rock breakage process by TBM rolling cutters using 3D FEM-SPH coupled method. Tunn. Undergr. Space Technol. 2017, 61, 90–103. [Google Scholar] [CrossRef]
  43. Xue, Y.; Zhou, J.; Zhao, F.; Zhao, H. A Fine Simulation Analysis of Rock Fragmentation Mechanism of TBM Disc Cutter with DEM. Comput. Exp. Simul. Eng. 2020, 75, 1189–1204. [Google Scholar] [CrossRef]
  44. Ucgul, M.; Saunders, C.; Fielke, J.M. Comparison of the discrete element and finite element methods to model the interaction of soil and tool cutting edge. Biosyst. Eng. 2018, 169, 199–208. [Google Scholar] [CrossRef]
  45. Zhou, X.; Gong, Q.; Liu, X.; Xu, H.; Yin, L. Rock Chip Properties of TBM Penetration in Jointed Rock Masses Based on an Improved DICE2D Simulation. Rock Mech. Rock Eng. 2022, 55, 7547–7568. [Google Scholar] [CrossRef]
  46. Cundall, P.A.; Strack, O.D. A discrete numerical model for granular assemblies. Geotechnique 1979, 29, 47–65. [Google Scholar] [CrossRef]
  47. Potyondy, D.O.; Cundall, P.A. A bonded-particle model for rock. Int. J. Rock Mech. Min. Sci. 2004, 41, 1329–1364. [Google Scholar] [CrossRef]
  48. Xue, Y.; Zhou, J.; Liu, C.; Shadabfar, M.; Zhang, J. Rock fragmentation induced by a TBM disc-cutter considering the effects of joints: A numerical simulation by DEM. Comput. Geotech. 2021, 136, 104230. [Google Scholar] [CrossRef]
  49. Zhou, Q.; Xu, W.J.; Liu, G.Y. A contact detection algorithm for triangle boundary in GPU-based DEM and its application in a large-scale landslide. Comput. Geotech. 2021, 138, 104371. [Google Scholar] [CrossRef]
  50. Liu, G.Y.; Xu, W.J.; Sun, Q.C.; Govender, N. Study on the particle breakage of ballast based on a GPU accelerated discrete element method. Geosci. Front. 2020, 11, 461–471. [Google Scholar] [CrossRef]
  51. Labra, C.; Rojek, J.; Onate, E. Discrete/Finite Element Modelling of Rock Cutting with a TBM Disc Cutter. Rock Mech. Rock Eng. 2017, 50, 621–638. [Google Scholar] [CrossRef]
  52. Miller, T.M.; Cheatham, J.B. Analysis of the indentation of a compacting material by a perfectly rough wedge. Int. J. Rock Mech. Min. Sci. Geomech. Abstr. 1972, 9, 475–492. [Google Scholar] [CrossRef]
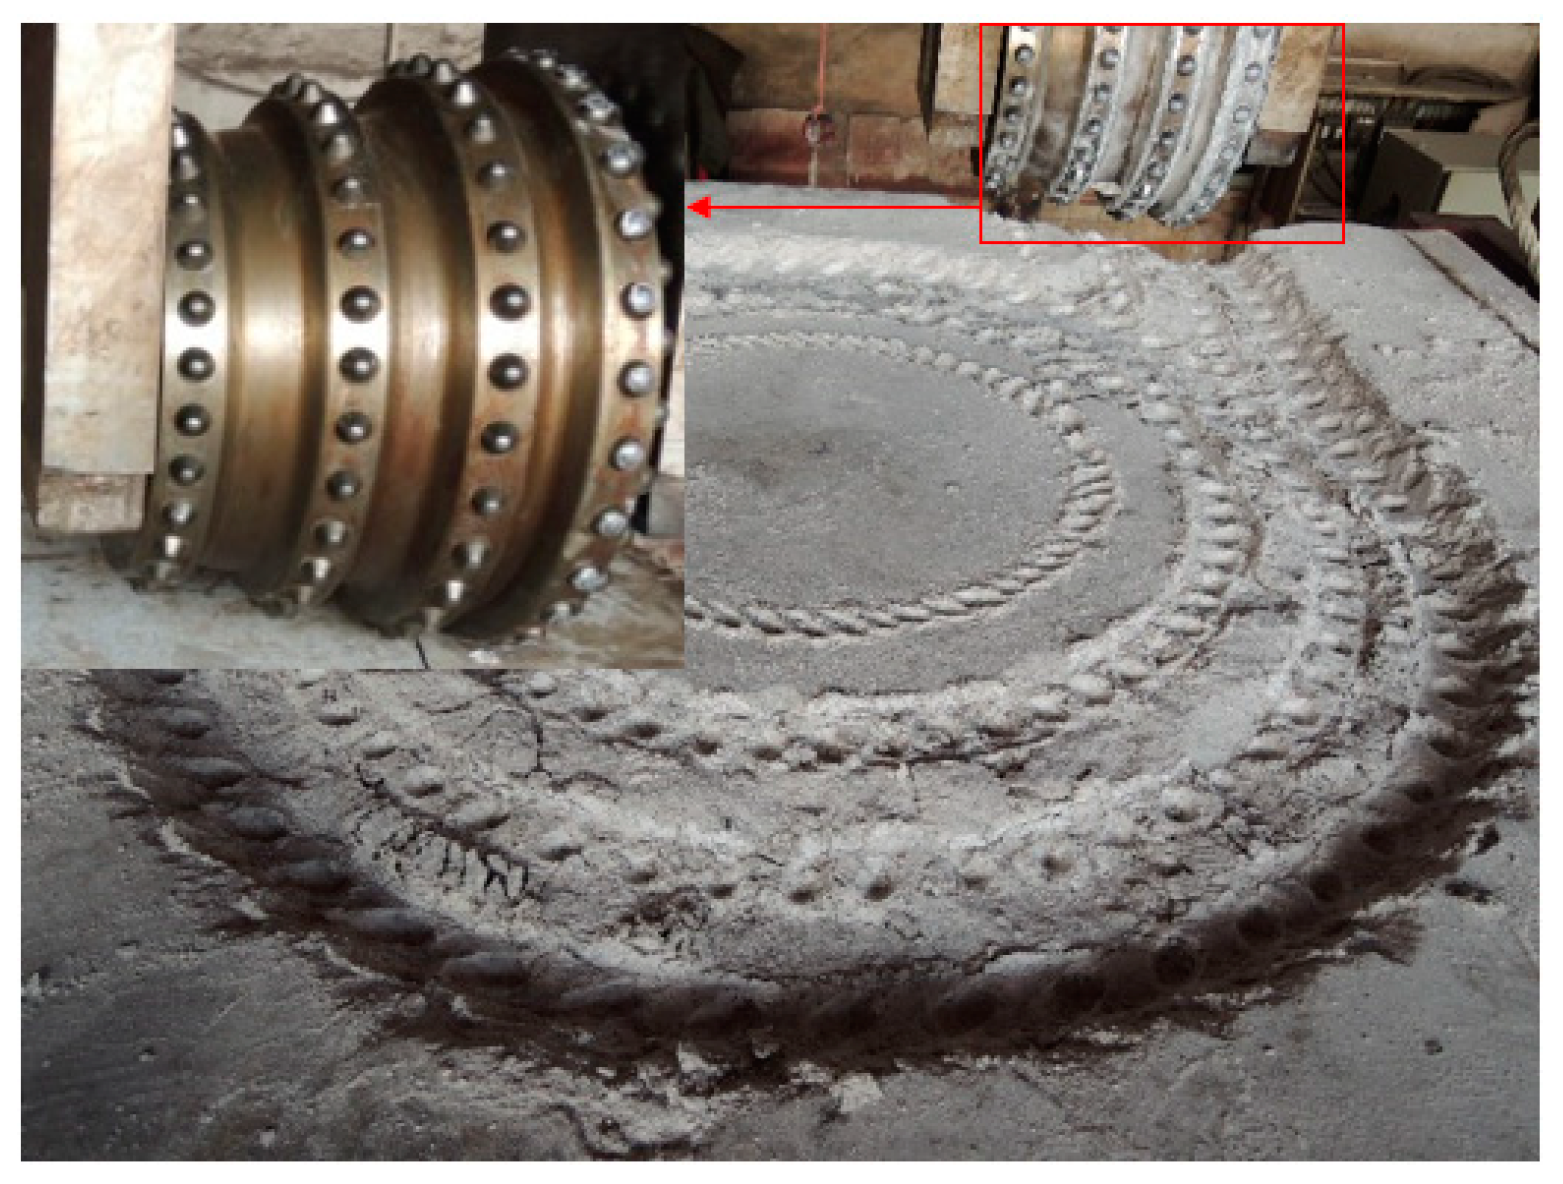
Figure 1. Button cutter and its rock breaking effect.
Applsci 13 06090 g001
Figure 2. Carbide buttons with different geometric parameters.
Applsci 13 06090 g002
Figure 3. Numerical model of the indentation test: (a) numerical simulation model; (b) carbide button model.
Applsci 13 06090 g003
Figure 4. Numerical model for (a) uniaxial compression test and (b) Brazilian disc test.
Applsci 13 06090 g004
Figure 5. Indentation test platform: (a) sample fixer, (b) holder and indenter.
Applsci 13 06090 g005
Figure 6. Comparison of the numerical simulation and experiment results.
Applsci 13 06090 g006
Figure 7. Crack propagation mode after the spherical button penetrated rock for 3 mm.
Applsci 13 06090 g007
Figure 8. The force–indentation depth curve and acoustic emission (AE) events.
Applsci 13 06090 g008aApplsci 13 06090 g008b
Figure 9. The crack distribution patterns formed by the conical button at different penetration depths.
Applsci 13 06090 g009
Figure 10. The crack distribution patterns formed by the spherical button at different penetration depths.
Applsci 13 06090 g010aApplsci 13 06090 g010b
Figure 11. The crack distribution patterns formed by the parabolic button at different penetration depths.
Applsci 13 06090 g011
Figure 12. The crack distribution patterns formed by the saddle button at different penetration depths.
Applsci 13 06090 g012
Figure 13. The crack distribution patterns formed by the wedge button at different penetration depths.
Applsci 13 06090 g013aApplsci 13 06090 g013b
Figure 14. Contact force chain formed between rock particles at the penetration depth of 0.5 mm.
Applsci 13 06090 g014aApplsci 13 06090 g014b
Figure 15. χ for five carbide buttons at different penetration depths.
Applsci 13 06090 g015
Figure 16. Volume and specific energy of the damaged zone.
Applsci 13 06090 g016
Figure 17. Dissipated energy distribution for different zones in the indentation process.
Applsci 13 06090 g017aApplsci 13 06090 g017b
Table 1. Micro and macro mechanical properties of Beishan granite.
Micro ParametersMacro Parameters from ExperimentsMacro Parameters
Predicted by Simulation
Cement effective modulus E * ¯ = 5.7 GPaE = 23 GPaE = 23 GPa
Ratio of cement normal to shear stiffness k ¯ s / k ¯ n = 0.2ν = 0.19ν = 0.19
Tensile strength σ t = 28 MPaUCS = 108 MPaUCS = 106 MPa
Cohesion strength c = 50 MPaBTS = 6.5 MPaBTS = 6.5 MPa
Friction angle φ = 15°
Moment contribution coefficient β = 0.5
Bond−radius multiplier λ = 1
Disclaimer/Publisher’s Note: The statements, opinions and data contained in all publications are solely those of the individual author(s) and contributor(s) and not of MDPI and/or the editor(s). MDPI and/or the editor(s) disclaim responsibility for any injury to people or property resulting from any ideas, methods, instructions or products referred to in the content.