Article

Optimal Load Frequency Control of a Hybrid Electric Shipboard Microgrid Using Jellyfish Search Optimization Algorithm

by
Yannis L. Karnavas
* and
Evaggelia Nivolianiti
Electrical Machines Laboratory, Department of Electrical and Computer Engineering, Democritus University of Thrace, 671 00 Xanthi, Greece
*
Author to whom correspondence should be addressed.
Appl. Sci. 2023, 13(10), 6128; https://doi.org/10.3390/app13106128
Submission received: 9 March 2023 / Revised: 3 May 2023 / Accepted: 14 May 2023 / Published: 17 May 2023

Abstract

:
This paper examines the critical topic of load frequency control (LFC) in shipboard microgrids (SMGs), which face challenges due to low system inertia and the intermittent power injection of renewable energy sources. To maintain a constant frequency (even under system uncertainties), a robust and well-tuned controller is required. In this paper, a study was conducted first by examining the performance of three different controller architectures, in order to determine which is the most-appropriate for the multi-energy SMG system. The time delays that occur due to communication links between the sensors and the controller were also considered in the analysis. The controllers were tuned using a very recent bio-inspired optimization algorithm called the jellyfish search optimizer (JSO), which has not been used until recently in LFC problems. To assess the tuning efficiency of the proposed optimization algorithm, the SMG’s frequency response results were comprehensively compared to the results obtained with other bio-inspired optimization algorithms. The results showed that the controllers with gains provided by the JSO outperformed those tuned with other bio-inspired optimization counterparts, with improvements in performance ranging from 19.13% to 93.49%. Furthermore, the robustness of the selected controller was evaluated under various SMG operational scenarios. The obtained results clearly demonstrated that the controller’s gains established in normal conditions do not require retuning when critical system parameters undergo a significant variation.

1. Introduction

Maritime microgrids (MGs) are facing significant changes due to high levels of carbon dioxide emissions. The International Marine Organization predicts that, by 2050, CO2 emissions from marine vessels could increase by approximately 250% [1,2]. In recent years, a greater focus has been placed on managing and regulating maritime microgrids as a way to conserve traditional fuel sources and provide carbon-neutral power. Alternative energy sources such as wind, solar, and wave power are being examined for use in hybrid maritime MG systems, but the challenge of the frequency fluctuations caused by the stochastic nature of these sources is a concern. The instability of the system can be avoided by implementing energy storage systems (ESSs), such as batteries or flywheels, in conjunction with renewable energy sources (RESs). This will improve the maritime power system’s dependability and enhance the quality of the power. Additionally, the use of diesel generators (DGs) as a backup source of power is a potential source of CO2 emissions, so alternative options such as fuel cells are also being considered as eco-friendly options for use in standalone hybrid maritime microgrid systems [3].
Several efforts have been made to reduce CO2 emissions from maritime vessels. Up-to-date research has covered a range of topics such as ship propulsion topologies [4,5], hybrid power supply systems [6], and optimization in energy storage systems [7]. Furthermore, there are studies that have analyzed the performance of various components, such as batteries [8] and diesel generators [9] in electric ships. Additionally, environmental and economic considerations have been discussed in relation to hybrid systems that use photovoltaic (PV), diesel, and energy storage units [10,11]. Some studies have also looked at ways to improve the efficiency of ship microgrids through energy management and maneuvering approaches [12]. Furthermore, much research has been performed on determining the optimal size of the ESS in hybrid MG systems to address the unpredictable and inconsistent nature of renewable resources [13,14,15]. However, there has been less focus on designing control strategies for shipboard microgrids. Some efforts that have been made in this regard are described in [16,17,18]. The purpose of [16] was to present a frequency-sharing approach for dealing with the PV panels’ highly stochastic nature when integrated with naval MGs. Reference [17] presents a hybrid energy storage system that includes both batteries and ultracapacitors (UCs) to provide pulsating active power, resulting in a decrease in the capacity of batteries and DG and an increase in fuel consumption. The authors in [18] present a case study of a hybrid-electric ferry that utilizes a DC/AC hybrid distribution and ESS for the shipboard power system (SPS) to improve the efficiency. Prior research on control strategies for maritime microgrid systems have covered various topics. However, until recently, little attention has been given to the LFC problem in SMGs.
In shipboard microgrids, LFC is a crucial issue since it regulates the balance between load demand and power generation [3]. LFC involves monitoring and controlling the frequency of the microgrid’s power system in order to keep it within a safe operating range [19]. LFC’s primary goal is to ensure that the frequency of the system remains stable and that any deviations are quickly corrected. In shipboard microgrids, LFC is particularly challenging due to the presence of intermittent RESs and the low inertia of the system. This means that the system is more susceptible to frequency fluctuations caused by changes in power generation or load demand. Several control strategies have already been proposed to address the LFC issue in conventional microgrid systems. Among others, these include proportional–integral–derivative (PID) [20], fractional-order PID (FOPID) [21], non-linear fractional-order PID (NLFOPID) [22], and a non-integer controller [23]. Furthermore, the optimal adjustment of the controller parameters is crucial for improving the dynamics of a system. To achieve this, various heuristic algorithmic tools such as teaching–learning-based optimization (TLBO) [24], the grasshopper optimization algorithm (GOA) [25], the genetic algorithm (GA) [26], salp swarm algorithm (SSA) optimization [27], particle swarm optimization (PSO) [28], and others are used to tune the controllers’ parameters in microgrids. The majority of the earlier control techniques were developed for conventional generation units with high system inertia and do not take into account the intermittent nature of RESs for short-term frequency stabilization. However, maritime microgrids have low inertia and incorporate intermittent renewable energy sources. Although numerous LFC solutions have been suggested for traditional power systems and conventional MG, the amount of research conducted on dealing with LFC in marine/shipboard MGs is limited.
Recent studies [29,30,31] proposed different algorithms for solving the issue of frequency control in different shipboard MG systems. Reference [29] introduces a coordinated control technique that utilizes an SSA-optimized hybrid fuzzy fractional-order PI-fractional-order PID (FFOPI-FOPID) to decrease frequency deviations caused by load changes. The GOA and butterfly optimization algorithm (BOA) are used to tune the controller gains of fuzzy-based PID with a filter and fractional-order controller in [30,31], respectively.
Based on the above, the current work was motivated by several key points of importance:
  • Recently, the marine industry has adopted renewable energy sources, which makes it crucial to optimize SMGs.
  • An emerging area of research concerns the problem of the LFC of ship microgrids, which becomes particularly challenging due to the high fluctuating propulsion loads and low inertia that characterize the SMGs.
  • The previous research on LFC in shipboard microgrids overlooked the time delay in communication lines. This gap highlights the need for the further development of improved frequency control techniques.
  • Studies carried out in this field investigate and utilize metaheuristic algorithms to determine optimal controller design parameters for microgrids on ships.
Metaheuristics methods have gained popularity over traditional methods in solving optimization problems due to their ease of use and the reliability of their outcomes. In recent times, swarm-based bio-inspired algorithms have been shown to be highly effective in solving a diverse array of optimization problems [32]. This paper utilized a recently developed swarm-based optimization strategy, which is called the “jellyfish search optimizer” (JSO). This algorithm is known for its high rate of convergence and its ability to effectively tune the controller parameters [33]. The JSO has been already used to solve a variety of problems [32] related to power system and energy generation, civil engineering, communication and networking, etc. However, it has not been applied to LFC problems until recently. In this study, the JSO was used in order to optimally tune three different controller topologies, i.e., a PID with filter (PIDF), an FOPID, and a 2DOF-PIDF (2-degree-of-freedom PIDF) one, for the LFC problem of a multi-source ship microgrid. Furthermore, the effectiveness of the suggested approach was assessed by comparing its performance with other commonly used bio-inspired optimization methods such as ant–lion optimization (ALO) [34], the grey wolf optimizer (GWO) [35], the GOA [36], the Harris hawks optimization (HHO) [37], and the whale optimization algorithm (WOA) [38], providing a comprehensive analysis of the controller’s performance. The selected algorithms share the characteristic of being parameter-free. This means that they do not have parameters that are initialized. The key contributions of this work can be summarized as follows:
  • A recently proposed shipboard microgrid system was further examined and analyzed for frequency regulation studies. This extends the scope of previous research in the field of LFC in SMGs, because the study considered the time delay between the sensor and the controller;
  • The performance of different metaheuristics optimization algorithms, including ALO, the GWO, the GOA, HHO, the WOA, and the proposed JSO, was assessed. The evaluation offers insights into which algorithm is most suitable for this application;
  • The performance of various controllers, including PIDF, FOPID, and 2DOF-PIDF, was evaluated. The system dynamics were analyzed under changing solar, wave, and load conditions in the shipboard microgrid. This analysis provides a comprehensive understanding of the system dynamics and highlights the effectiveness of the controllers in regulating frequency;
  • The sensitivity of the proposed JSO-tuned controller to variations in system parameters was examined. By analyzing the sensitivity, the research provides information on the controller’s resilience and identified how certain parameters influence its effectiveness.
The rest of this paper is structured as follows: In Section 2, the modeling aspects of the proposed frequency response model for the maritime microgrid are outlined. The design of the controllers and the performance index that are used are described in Section 3. Section 4 delves into the jellyfish search optimizer (JSO) and its application in the system. The simulation results for the frequency response model are examined and evaluated in Section 5, including a comparison of the performance of the different controllers and optimization algorithms. Section 6 provides a further analysis of the robustness of the suggested controller for three different examined cases. Finally, the conclusions of this research are presented in Section 7.

2. Description of the Shipboard Microgrid under Study

The general scheme of the system studied in the present work is shown in Figure 1 composed of a ship’s DG, a proton exchange membrane fuel cell (PEMFC), and RESs such as sea wave energy (SWE) and photovoltaic [39]. The shipboard MG also consists of an energy storage system, which includes a flywheel energy storage system (FESS) and a battery energy storage system (BESS). Furthermore, the system takes into account a time delay ( τ d ). Time delays are a significant non-linear variable that can impact the effectiveness of control mechanisms. Such delays can occur due to communication line congestion or data blockages, leading to undesirable outcomes. The controller relies on the communication network to exchange information, which means there are limitations on the data that can be transmitted and received. One of these constraints is τ d , which has been recognized as a factor that can affect the system’s overall performance.

2.1. Diesel Generators

Diesel generators (DGs) are typically known to have favorable characteristics, such as high efficiency, durability, and fast starting [40]. Controlled DGs have been demonstrated as a viable backup option for shipboard MGs, as they can respond quickly and accurately to changes in load demand. The DG can effectively address variations in loads, PV, and SWE. Figure 1 shows a continuous time transfer function modeling the relationship between the LFC signal and the DG’s output power. In this transfer function, the governor and generator are represented by first-order inertia plants [39]:
G D G ( s ) = 1 1 + T g s 1 1 + T d s

2.2. Proton Exchange Membrane Fuel Cell

The fuel cells (FCs) are static electrochemical devices that transform the chemical energy of reactants (oxidant and fuel) into electrical energy. The study focuses on the use of a commonly used type of fuel cell called PEMFC, in order to control the output fluctuations of RES power generation. The PEMFC’s dynamic model is [41]:
q H 2 p H 2 = K a n M H 2
where q H 2 , p H 2 is the hydrogen flow (kmol·L) and partial pressure of hydrogen, respectively (kPa), K a n denotes the anode valve constant ( kmol · kg atms 1 ), and M H 2 is the hydrogen molar mass (kg kmol·L).
The PEMFC output voltage is given by [41]:
V c e l l = E B ln ( C I F c ) R int I F C
where B and C are the activation voltage constants, R i n t denotes the internal resistance ( Ω ), I F C is the feedback current of the FC (A), and E represents the Nernst immediate voltage.
The PEMFC has a number of benefits over other fuel cells [42], such as a simple structure, quick start-up times, and the ability to withstand low temperatures. The PEMFC is composed of an FC, an interconnection device, and an inverter. The inverter is a voltage control type to convert the supplied power into a normal voltage and frequency, a total of 120 ms is needed. The system interconnection device’s power switchover took approximately 10 ms. As a result, the linearized transfer function of the PEMFC is shown in (5) [43]:
G F C ( s ) = 1 1 + T f c s 1 1 + T i n v 1 s 1 1 + T i c s

2.3. Renewable Energy Sources

2.3.1. Sea Wave Energy Source

Systems known as sea wave energy (SWE) systems are those that transform energy from the sea waves into electrical energy. In this study, the SWE system was regarded as one of the shipboard MG’s RES components. There are many device types for SWE, but the wave energy conversion (WEC) device is the one that is most-frequently used to integrate wave energy into the power grid. The WEC system transforms the vertical movements caused by waves into rotational motion to produce electricity. These movements result from the WEC system rising and falling relative to its anchoring system as waves come in. The equations of motion describe the behavior of a body under the influence of external forces, restoring properties, mass, and damping [44]:
F = m z ¨
where m is the mass of the body, z ¨ is its acceleration, and F represents the total forces acting on the system. The equation for the total forces on the body in this study is given as
F = F m + F h s + W + F R + F P T O + F W k + F V D
where W is the body’s weight, F m is the mooring force, F h s represents the hydrostatic force, F P T O is the force resulting from the power take-off devices, F R denotes the hydrodynamic forces, F W k represents the vertical components of the forces generated by the incoming waves that excite the system, and F V D represents the vertical viscous drag force.
Without taking into account the SWE’s non-linearity, Relationship (8) is used to represent the SWE’s linearized transfer function [39,44]:
G S W E ( s ) = 1 1 + T g 2 s 1 1 + T h s

2.3.2. Photovoltaic Source

The second RES used in this shipboard system is photovoltaic. The PV converts the solar energy into electricity [45]. The corresponding circuit diagram for the PV cell is shown in Figure 2 and consists of a series resistor ( R s ), light current ( I L ), and external contacts. Additionally, a parallel resistance ( R s h ) was utilized, producing a minor leakage current. The reason for representing the PV cell model using a random power source is due to the irregular nature of the power generated by the system, which is determined by the changing levels of sunlight intensity and temperature. Equation (8) represent the diode current ( I D ), while (9) gives the instantaneous current of the PV cell:
i p v ( t ) = I L I D I D = I r s ( e γ ( v p v ( t ) + i p v ( t ) R s ) 1 )
i p v ( t ) = I L I r s ( e γ ( v p v ( t ) + i p v ( t ) R s ) 1 )
where γ is the diode ideality factor, I r s is the reverse saturation current of the diode, and i p v and v p v denote the current and the voltage through the PV cell array. In order to connect the PV power plant to the control area, a grid-side inverter and a DC–DC converter were used. The highest power point tracking conditions are produced by the DC–DC converter. Transfer functions were used to model these power electronic circuits [39], as shown in (10):
G P V ( s ) = 1 1 + T i n v 2 s 1 1 + T c s

2.4. Energy Storage System

In order to keep the hybrid power system stable, energy storage devices are crucial for quickly supplying power generation subsystems that are low on energy. In this study, a battery energy storage system (BESS) and a flywheel energy storage system (FESS) were used. The BESS’s time constant is limited to a few seconds because it takes some time to charge the battery cells. A voltage-controlled source, E, plus an internal resistor make up the BESS model [30]. The following equations give the battery voltage and state of charge (SOC):
E = E o K Q Q i d t + A exp ( B i d t ) S O C = 100 ( 1 1 Q i d t )
where E represents the no load voltage, E 0 is the battery constant voltage, Q is the battery’s total capacity, A denotes the exponential zone amplitude, K is the polarization voltage, B is the exponential zone time constant inverse, and i represents the battery’s current.
In contrast to other ESS, such as batteries or capacitors, the FESS stores energy as kinetic energy. This unique feature enables the FESS to accumulate excess energy during low-demand periods and deliver it instantly during peak periods when there is high energy demand. The FESS uses the stored kinetic energy to quickly spin up a rotor, which generates electricity that can be supplied to the grid. Under normal conditions, the motor is employed to convert electrical energy from the power system into kinetic energy, which is then stored in the rotating flywheel. When the electrical load demand increases or an emergency arises, the stored kinetic energy is converted back into electrical energy by the generator and supplied to the connected electrical load. As shown next, the transfer functions of the BESS and FESS can each be represented as a first-order lag [46], i.e.,
G F E S S ( s ) = 1 1 + T F E S S s , G B E S S ( s ) = 1 1 + T B E S S s
Based on the above, and as Figure 1 illustrates, the whole transfer function model of an SMG, the frequency deviation can now be expressed as
Δ f = Δ P DG + Δ P FC + Δ P SW + Δ P PV Δ P FESS Δ P BESS Δ P load D · Δ f Δ P DG + Δ P FC + Δ P SW + Δ P PV Δ P FESS Δ P BESS Δ P load D · Δ f 2 H 2 H

3. Control Strategy and Optimization Function

3.1. Optimization Function Justification

To utilize a recent heuristic optimization method for creating a controller, the initial step involves establishing an objective function that considers the necessary constraints and specifications. The integral absolute error (IAE), integral-squared error (ISE), integral-time-squared error (ITSE), and integral time absolute error (ITAE) are performance indices that are typically considered in the control design. IAE- or ISE-based tuning cannot decrease the settling time as effectively as the ITAE criterion. Furthermore, a large controller output is provided by an ITSE-based controller for a quick change in set point. The literature has shown that the ITAE is more effective than other performance criteria [47]. The ITAE is used as the optimization objective function for the controller gains in this study, and it is given by
J = I T A E = 0 T s i m t Δ f d t
where T s i m is the time range of the simulation and Δ f is the frequency deviation of the system.

3.2. PIDF Controller

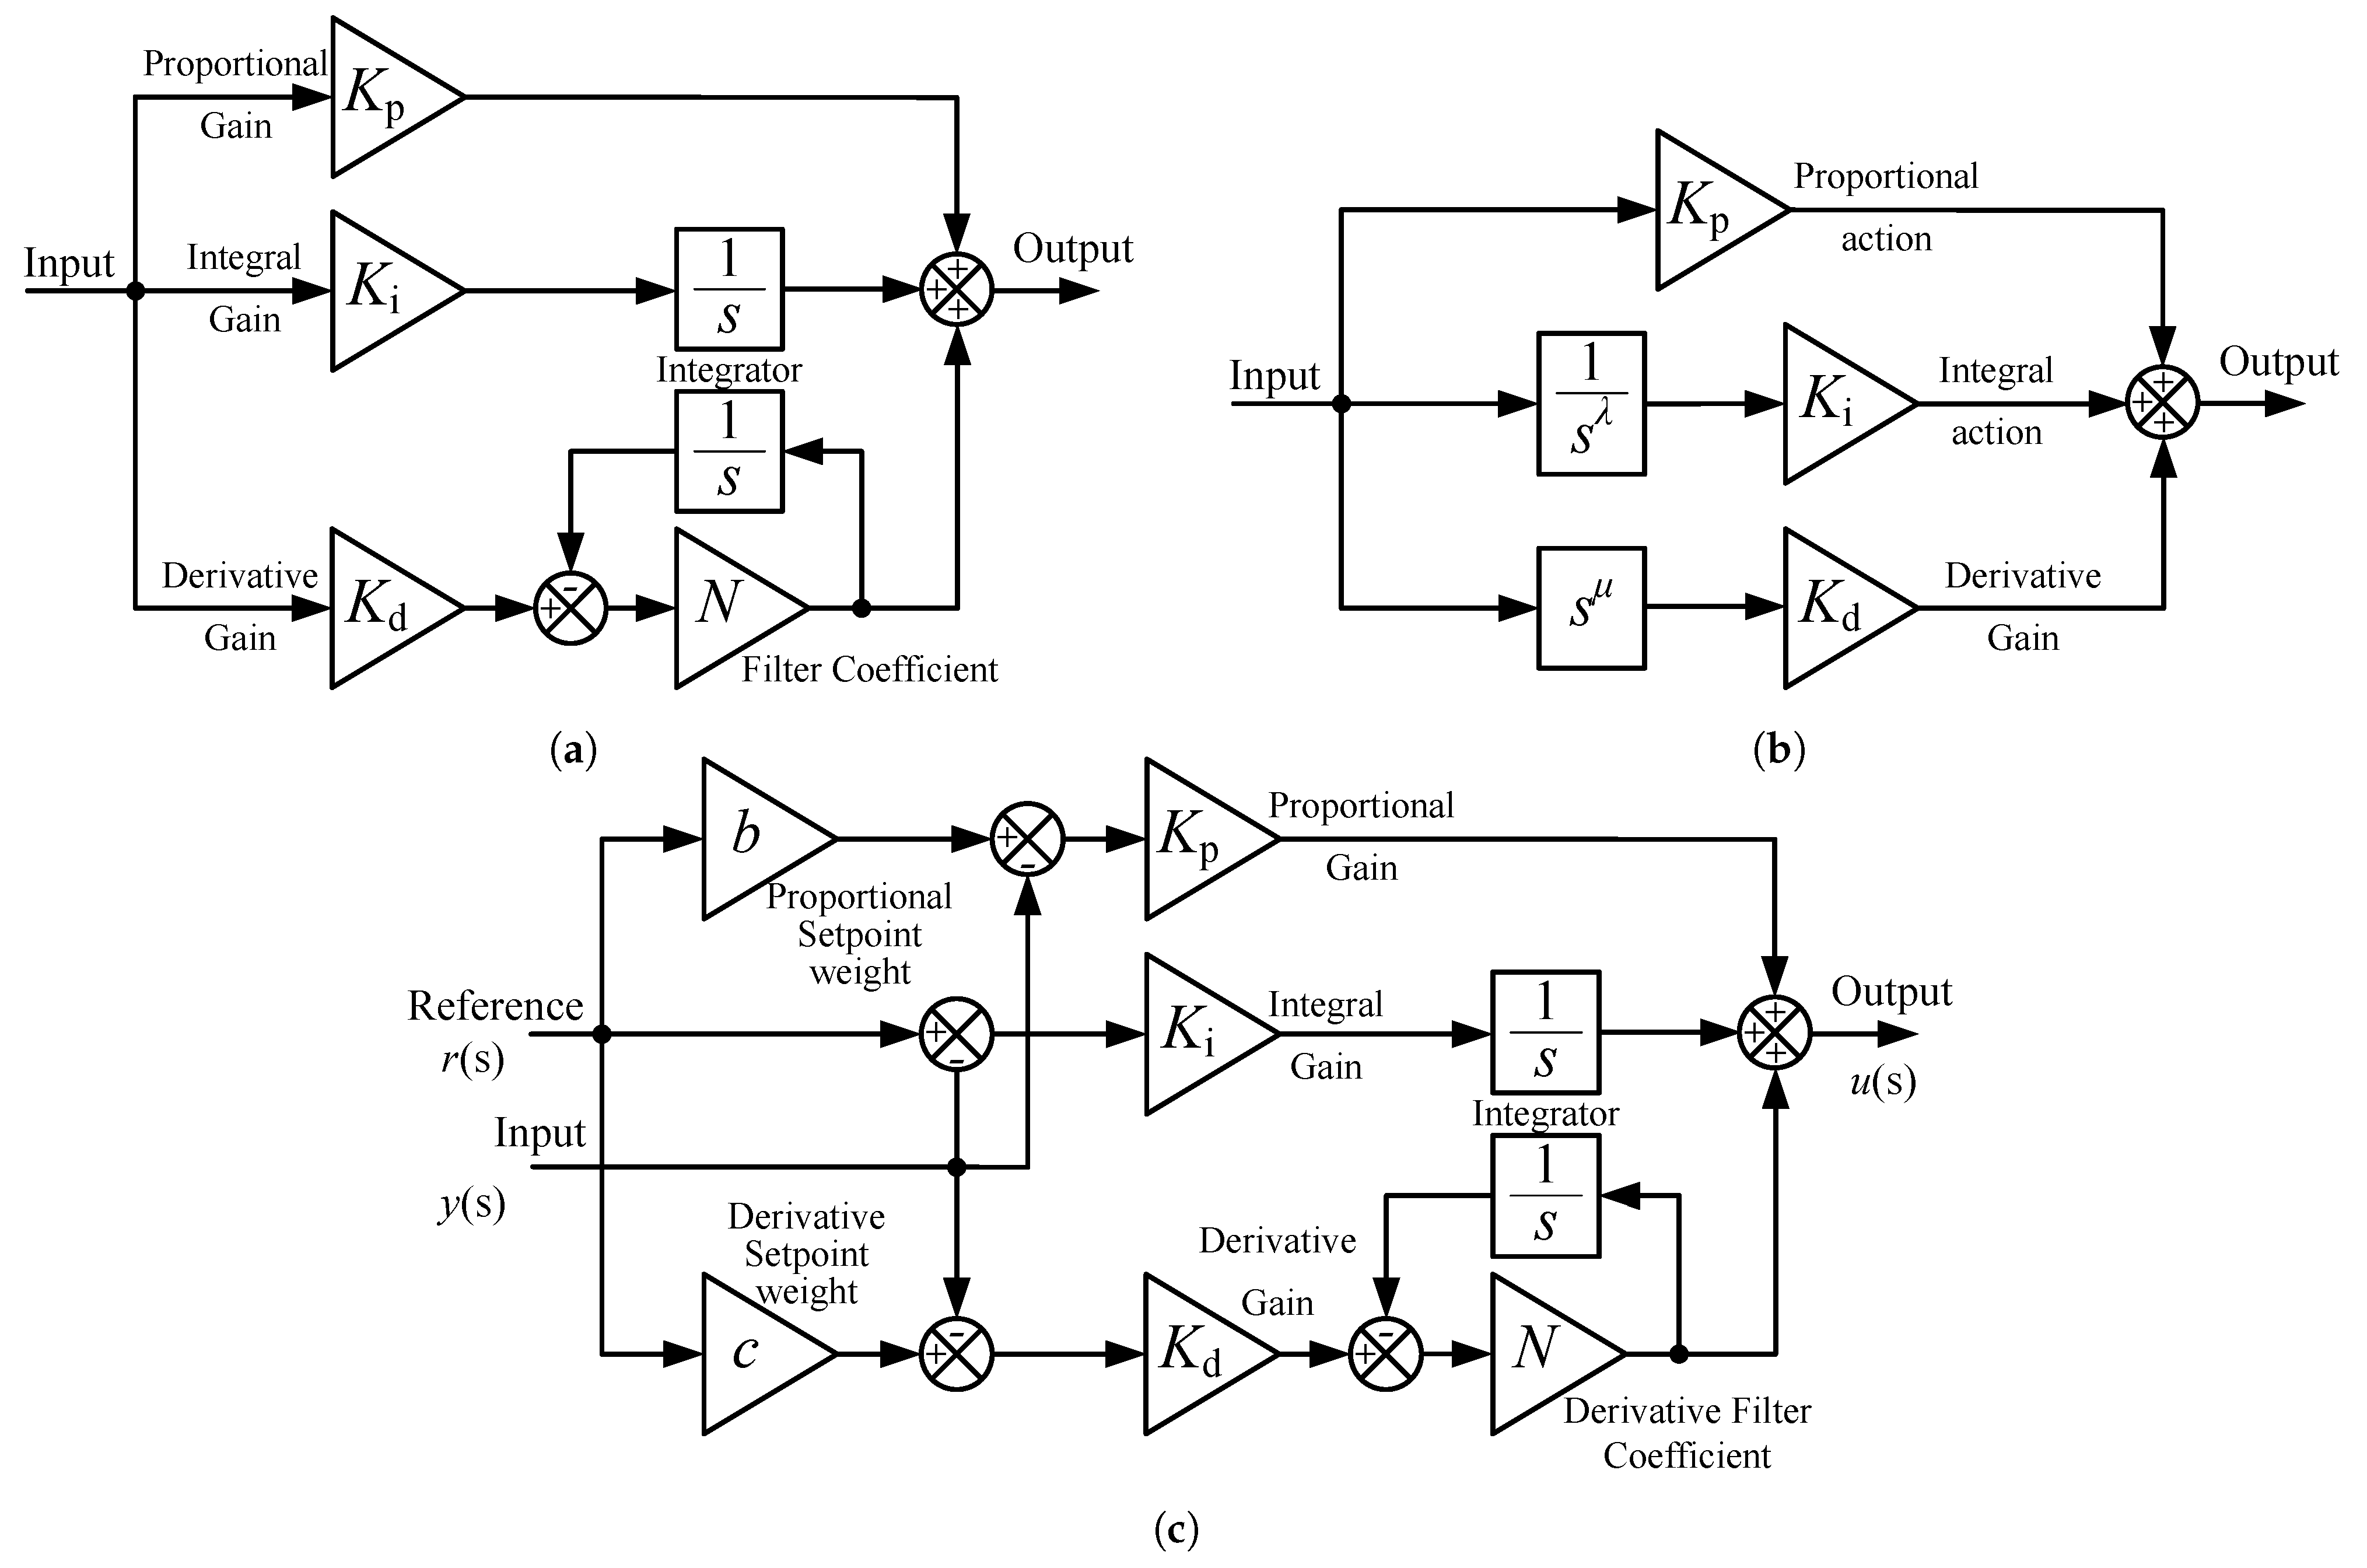
The first controller investigated in the LFC loops of the shipboard MG is a PID controller that incorporates a derivative filter coefficient N. The controller’s structure is illustrated in Figure 3a. The use of a filter on the derivative term is required to decrease the effect of noise in the system. More specifically, the majority of industrial processes employ traditional PI and PID controllers because of their straightforward and reliable design, low cost, and efficiency for linear systems. A derivative factor was applied to the PI controllers in order to speed up the system’s reaction because PI controllers make the system respond slowly. However, this could also enhance the impact of system noise [48]. The addition of a filter to the derivative term is a practical solution to address these issues since it helps reduce high frequency noise and prevents chattering caused by noise. The PIDF operation is described mathematically as [45]
G c ( s ) = K p + K i 1 s + K d N 1 + N 1 s
where K p , K i , K d are the proportional, integral, and derivative gain, respectively, and N is the derivative filter coefficient. In this context, the optimization of the fitness function of the problem can be given as
J min ( K p , K i , K d , N ) = 0 T s i m t Δ f d t s u b j e c t t o : K p min K p K p max K i min K i K i max K d min K d K d max N min N N max

3.3. FOPID Controller

A fractional-order PID (FOPID) controller is a type of control that has several advantages. One of the main advantages is improved robustness and flexibility, meaning that FOPID controllers are more resistant to parameter variations and external disturbances, allowing for stable control of the system even when there are changes in the system dynamics. Furthermore, FOPID controllers can achieve a faster response time and better steady-state performance than traditional PID controllers. The structure of an FOPID controller is shown in Figure 3b, and the corresponding mathematical expression can be given as
G c ( s ) = K p + K i s λ + K d s μ
where μ is a differential order and λ is an integral order to provide the PID controller’s settings a larger tuning range [49]. The optimization of the fitness function in this case is given by
J min ( K p , K i , K d , λ , μ ) = 0 T s i m t Δ f d t s u b j e c t t o : K p min K p K p max K i min K i K i max K d min K d K d max λ min λ λ max μ min μ μ max

3.4. 2DOF-PIDF Controller

The term “degree of freedom” (DOF) in a control system pertains to the quantity of distinct closed-loop transfer functions that can be autonomously adjusted. It is a measure of the control system’s ability to make changes to the system’s behavior. A two-DOF (2DOF) control system has benefits over a single DOF control system when it comes to meeting the performance requirements during design. The 2DOF controller generates a signal based on the discrepancy between the reference signal and the measured output of the system. In Figure 3c, the parallel 2DOF-PIDF controller’s structure is depicted, and r, y, and u stand for the reference signal, measured system output feedback, and output signal, respectively. The transfer functions for the 2DOF-PIDF controller are provided by [50,51]:
K p ( b r y ) + K i 1 s ( r y ) + K d N 1 + N 1 s ( c r y )
where b and c are the proportional and derivative set point weight, respectively. The optimization of the fitness function in the case of the 2DOF-PID is given by:
J min ( K p , K i , K d , N , b , c ) = 0 T s i m t Δ f d t s u b j e c t t o : K p min K p K p max K i min K i K i max K d min K d K d max N min N N max b min b b max c min c c max

4. Overview of the Jellyfish Search Optimizer

Around the world, jellyfish are found in water of varying temperatures and depths. Jellyfish can swarm when conditions are favorable, and a massive group of them is known as a jellyfish bloom. Because of their poor swimming abilities, the orientation of jellyfish in relation to currents plays a crucial role in sustaining jellyfish blooms and preventing them from becoming stranded. The formation of a swarm is influenced by a variety of variables, such as ocean currents, temperature, oxygen and nutrient availability, and predation. Ocean currents are the most-crucial of these factors because they can gather jellyfish into a swarm. Furthermore, swarms are more likely to occur when the ocean temperature is increasing since jellyfish can survive in such environments better than other sea creatures. In summary, jellyfish swarms are greatly influenced by their surrounding ecosystem, and their ability to swim in the direction of the current is vital to their survival.

4.1. Mathematical Model

The three idealized principles that form the basis of the suggested optimization algorithm are as follows:
1.
A “time control system” regulates the switching behavior of jellyfish between movement within the swarm and tracking the ocean current.
2.
In their migration through the ocean, jellyfish are attracted to areas where food is more abundant and actively seek out such regions.
3.
The quantity of food present at a given location, as well as the associated objective function dictate the degree of its attractiveness.

4.1.1. Ocean Current

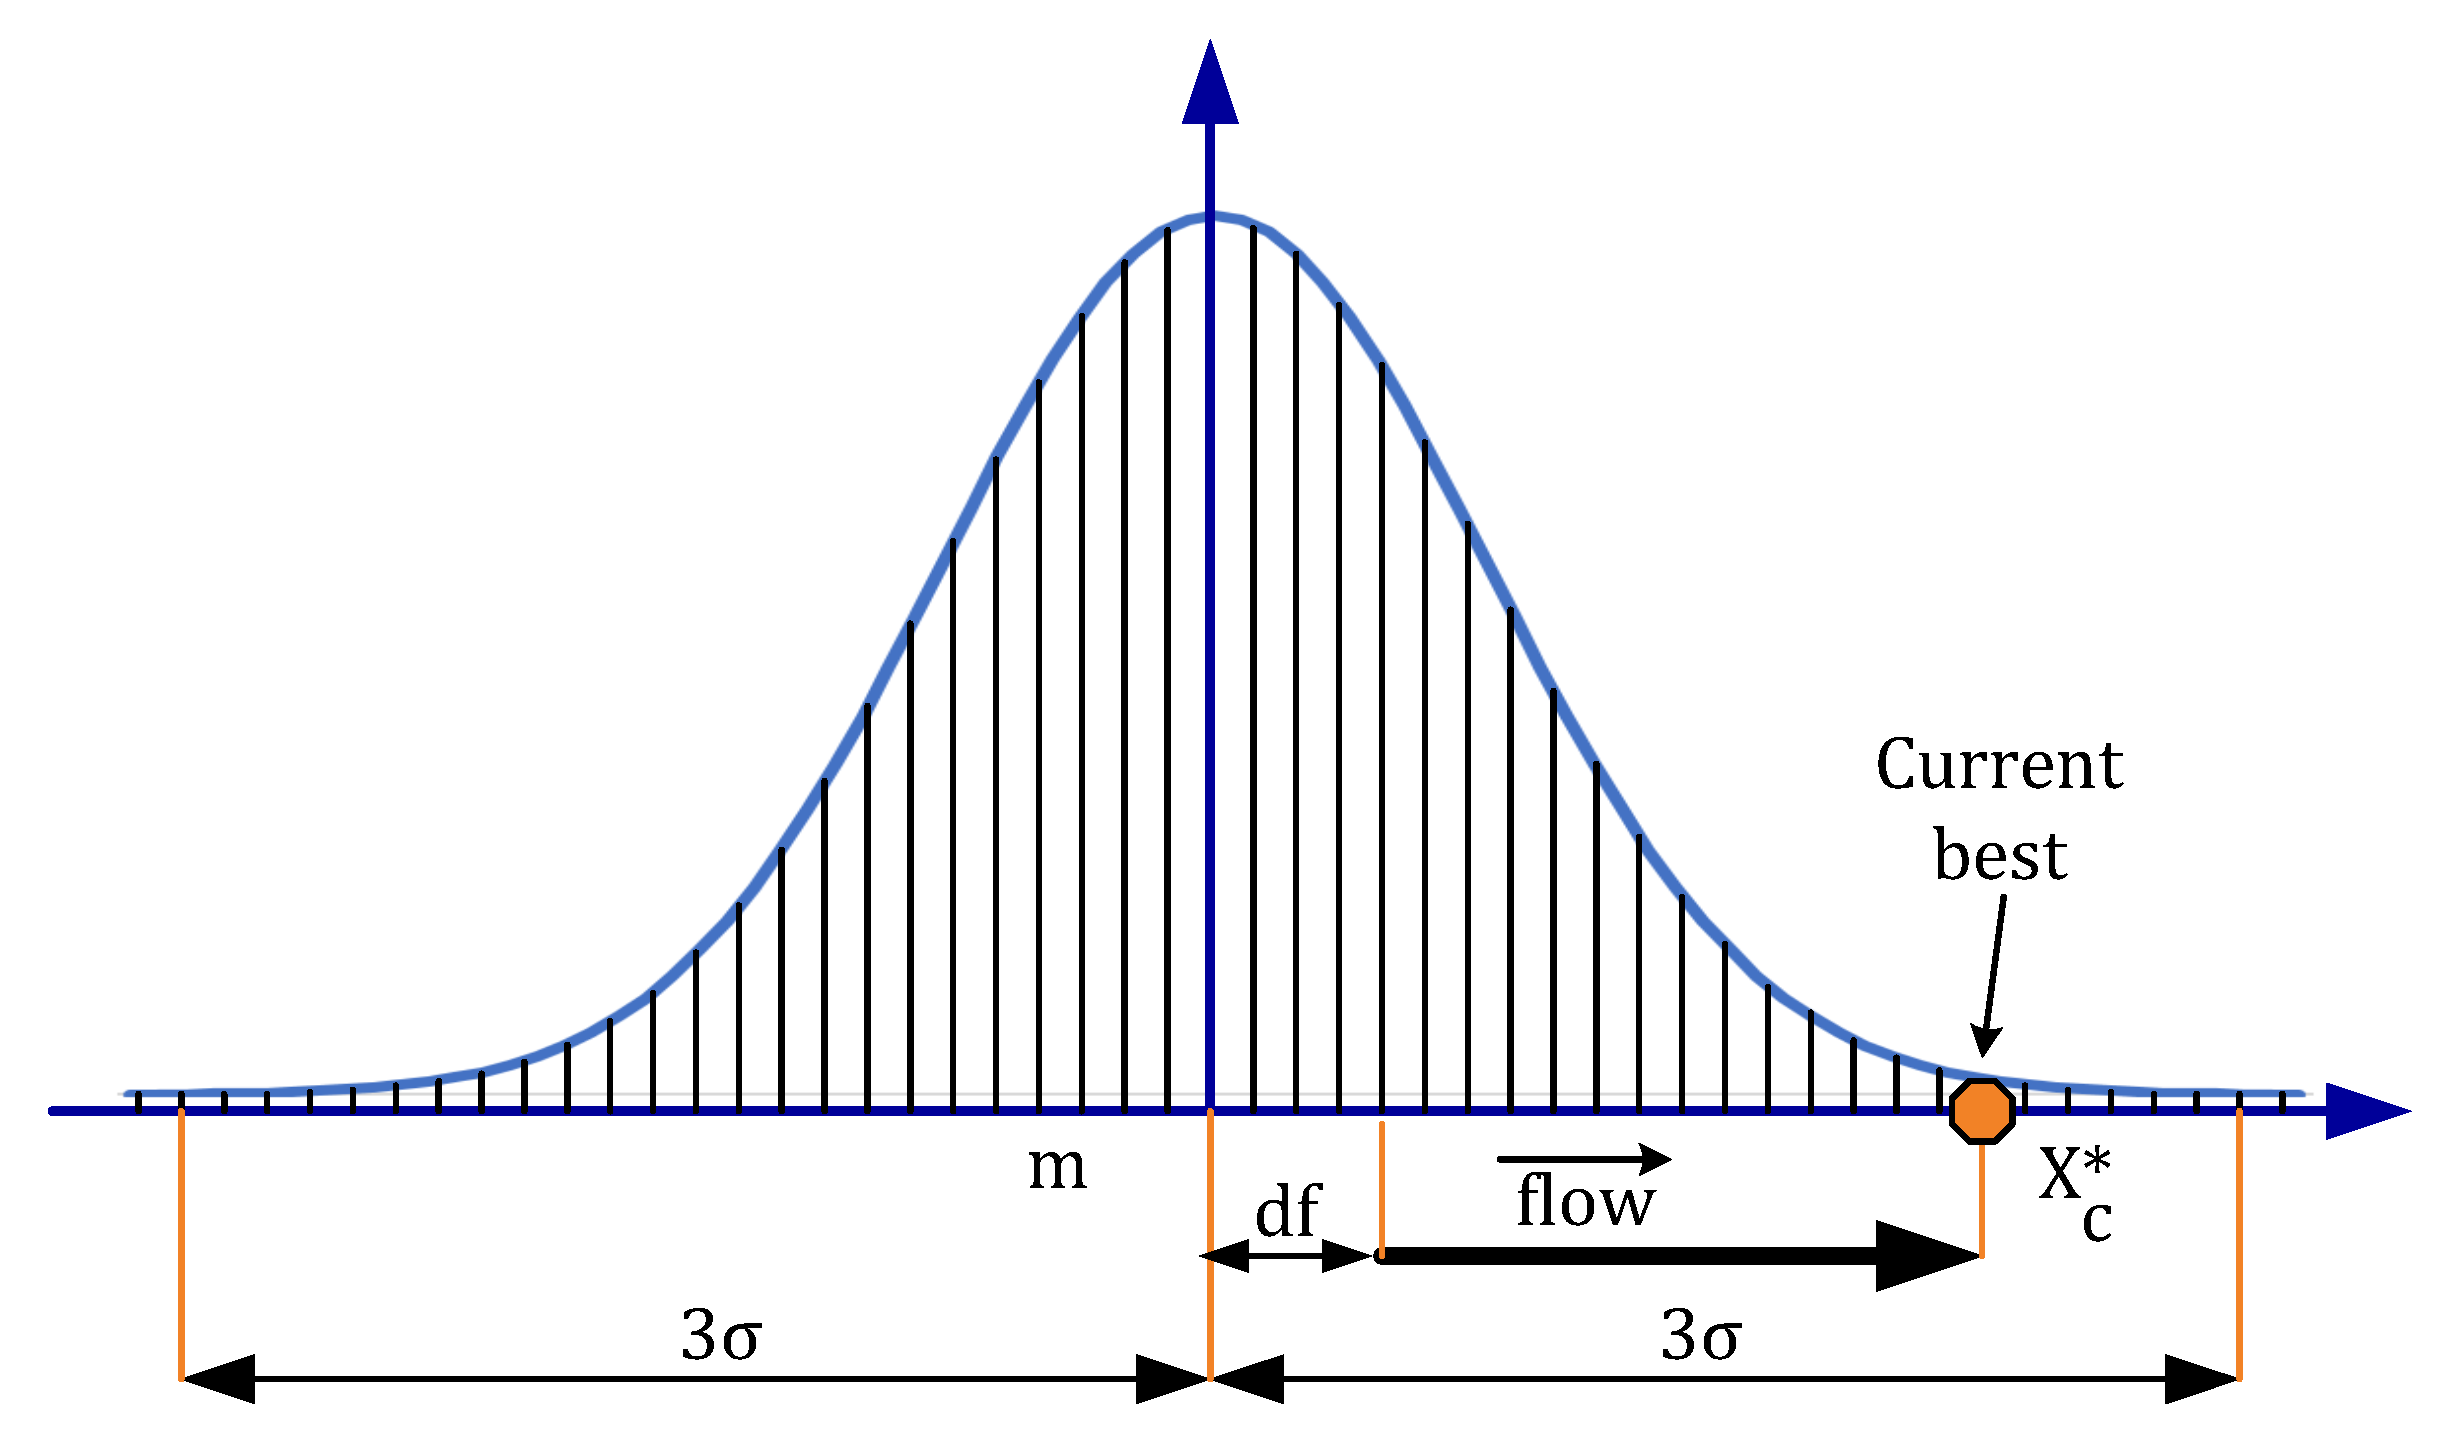
The presence of a significant concentration of nutrients in the ocean current is what draws jellyfish to it. The ocean current’s direction ( f l o w ) is defined by averaging all the vectors from each jellyfish in the ocean to the jellyfish currently in the best position
f l o w = 1 n j e l f l o w j = 1 n j e l ( X c a f X j ) = X c a f X j n j e l = X c a f m
where n j e l is the population of jellyfish; X c indicates the jellyfish’s current best position in the swarm; a f signifies the attraction factor; m is the average position of all jellyfish. The difference between the interest jellyfish’s current best location and the swarm’s mean location is denoted by d f . A distance of ± β σ around the mean position contains a given likelihood of all jellyfish, where β is a distribution coefficient and σ is the standard deviation of the distribution, which is based on the assumption that jellyfish have a normal spatial distribution in all dimensions (see Figure 4). Thus,
d f = σ × r a n d w ( 0 , 1 ) × β , σ = r a n d y ( 0 , 1 ) × m
where r a n d ( 0 , 1 ) w × r a n d ( 0 , 1 ) y = r a n d ( 0 , 1 ) . Hence, flow can be represented as:
f l o w = X c m × r a n d ( 0 , 1 ) × β
Each jellyfish’s new position is given by
X j ( t + 1 ) = X j ( t ) + r a n d ( 0 , 1 ) × f l o w
where X j ( t ) denotes the location of the jth jellyfish at time t [52].

4.1.2. Jellyfish Swarm

When jellyfish are in a swarm, they can move either passively (Type “A”) or actively (Type “B”). Initially, most jellyfish in the swarm exhibit Type “A” motion, but they gradually transition to displaying more Type “B” movements. During Type “A” motion, jellyfish move within their current location, and the position of each jellyfish is updated according to:
X j ( t + 1 ) = X j ( t ) + γ × ( B u B l ) × r a n d ( 0 , 1 )
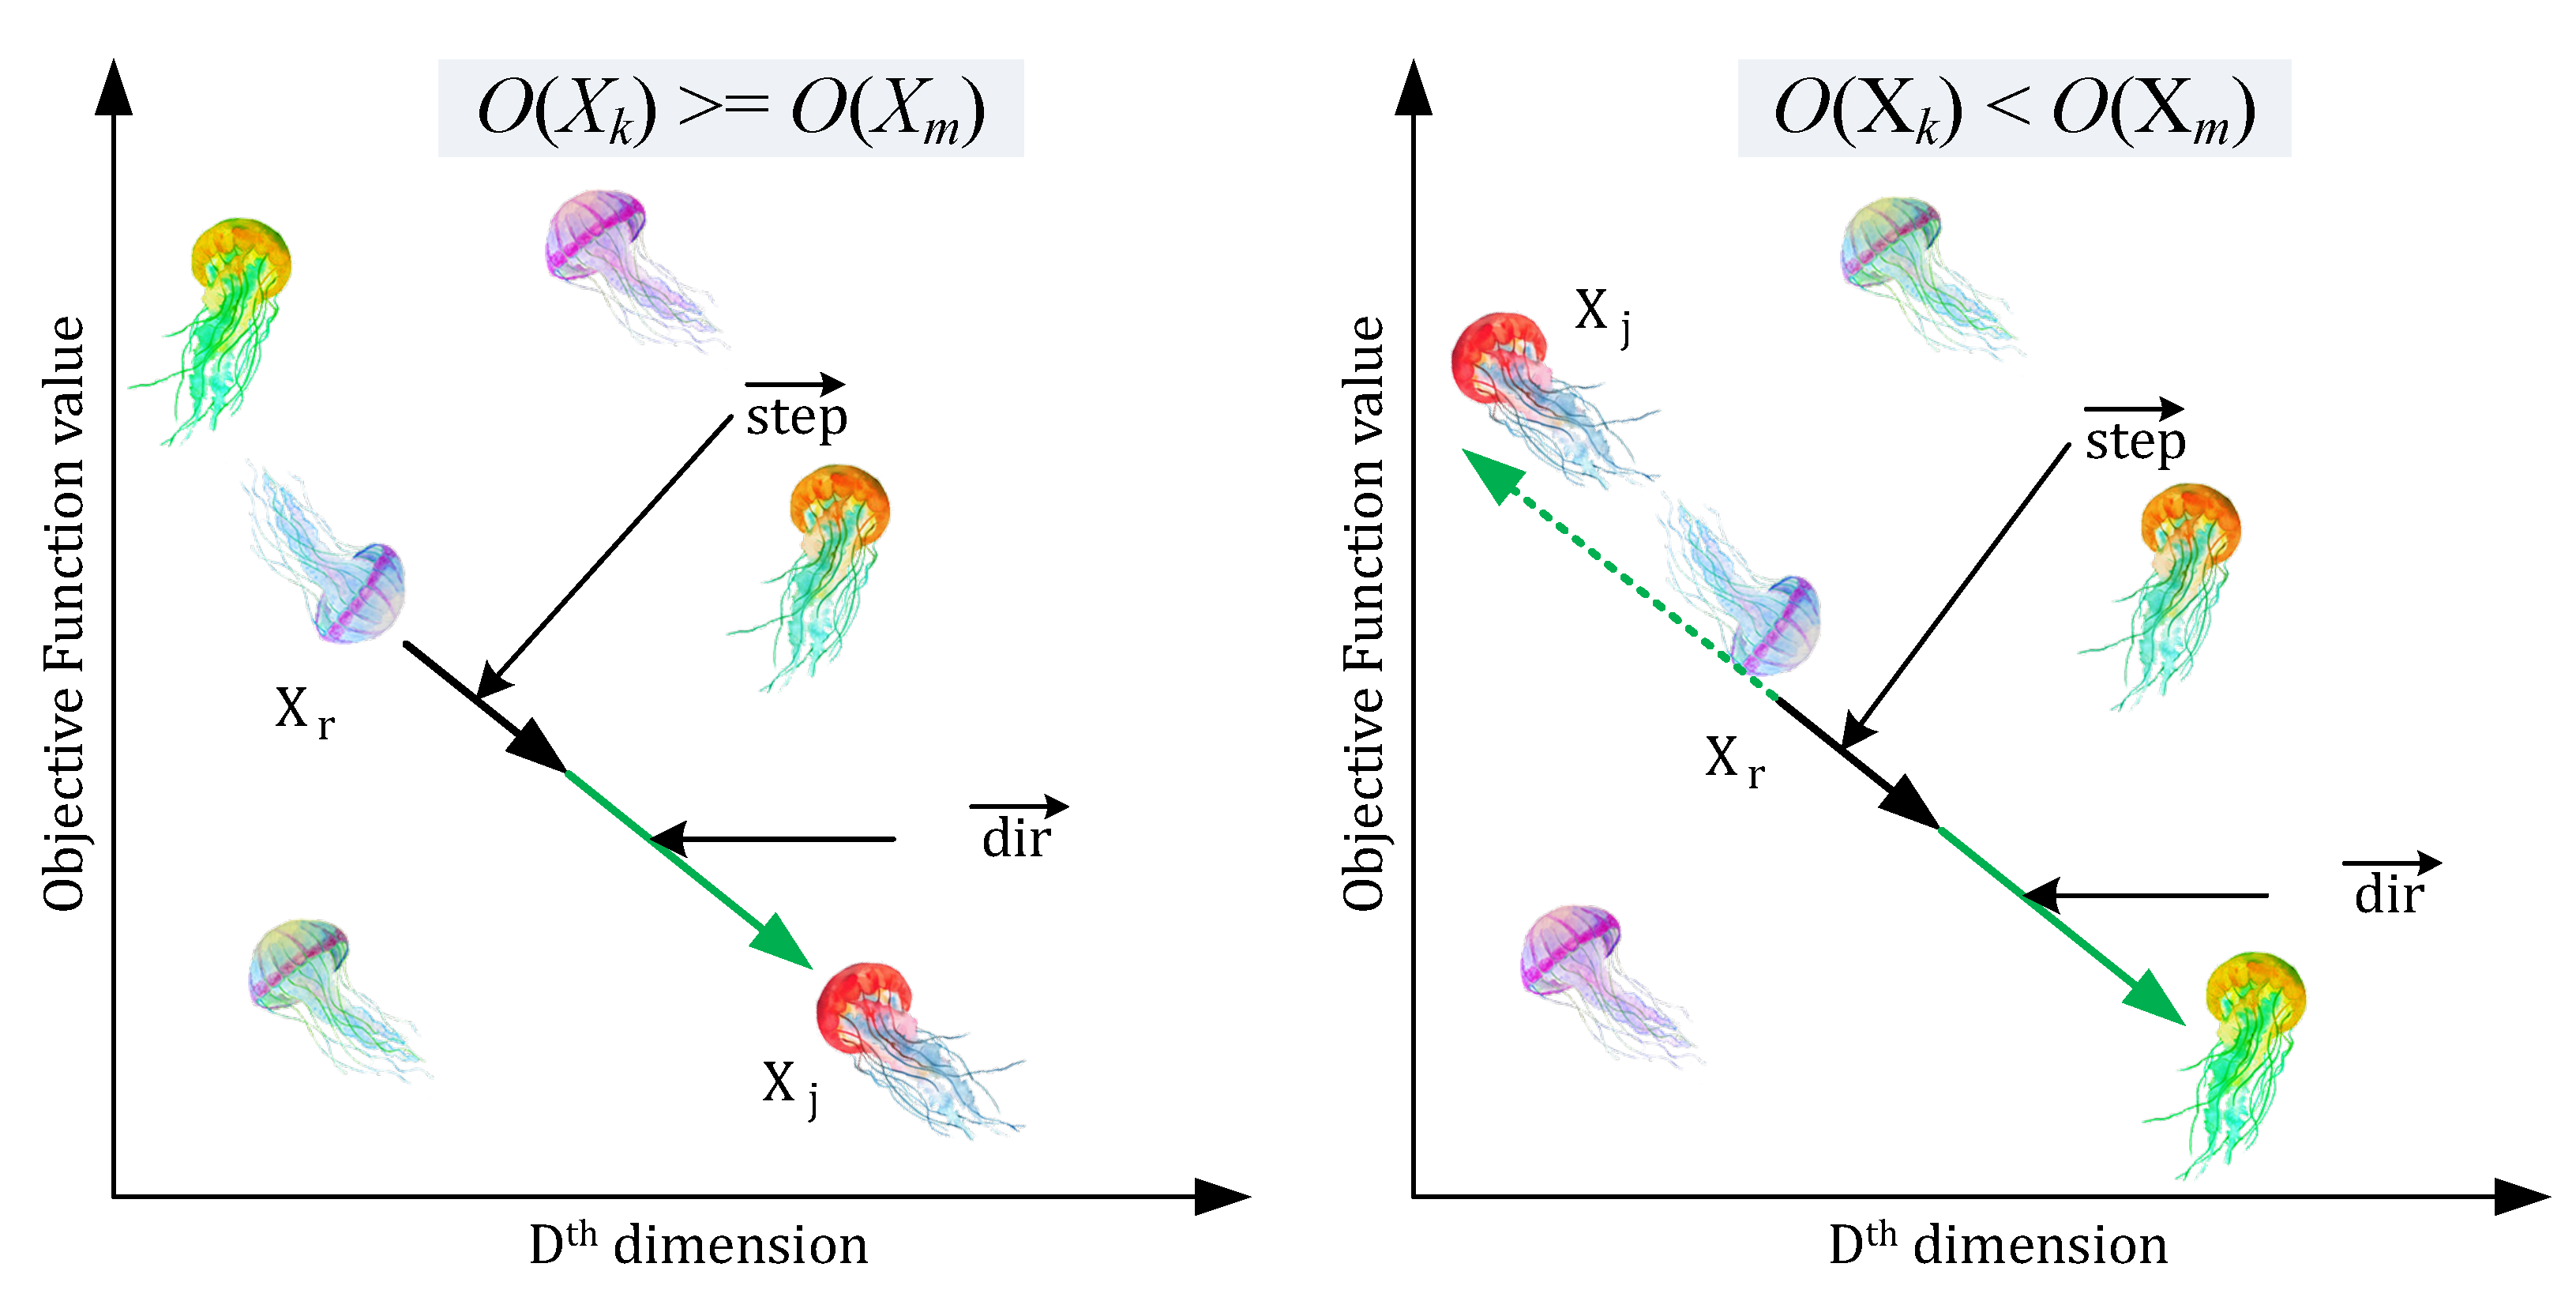
The motion coefficient, represented by γ , is associated with the extent of movement around the jellyfish’s position. The lower bound and the upper bound are denoted by B l and B u , respectively. To simulate the second motion, the jellyfish of interest (j) is chosen at random, and a vector from the chosen jellyfish (r) to the jellyfish of interest (j) is utilized to calculate the direction of movement. The selected jellyfish (r) will move toward the jellyfish of interest (j) when the latter’s location has more food than the former’s does. If the amount of food accessible to the chosen jellyfish (r) is less than that available to the jellyfish of interest (j), it immediately moves away from it. Each jellyfish in a swarm navigates towards the optimal direction in search of food. The direction of motion (Figure 5) is denoted by Equation (27), and the new position of the jellyfish is simulated by Equation (28).
s t e p = X j ( t + 1 ) X j ( t ) s t e p = d i r × r a n d ( 0 , 1 )
d i r = X r ( t ) X j ( t ) X j ( t ) X r ( t ) i f O ( X r ) O ( X j ) O ( X r ) > O ( X j )
where the objective function of position X is “ O · ” and
X j ( t + 1 ) = s t e p + X j ( t )

4.1.3. Time Control Mechanism

To determine the type of motion over time, a time control mechanism was employed. This mechanism governs the behavior of jellyfish by directing them towards the ocean current, as well as Type “A” and Type “B” motions within the swarm. The time control mechanism is composed of a constant value, C t , and a time control function, f t ( t ) , which regulates the jellyfish’s ability to switch between moving with the ocean current and within the swarm. The time control function is a random value that varies from 0 to 1 over time. When the value of the time control function exceeds C t , the jellyfish move along with the ocean current. Conversely, when the value is less than C t , the jellyfish move within the swarm. The time control function can be expressed using the following formula:
f t ( t ) = ( 1 t i t e r max ) × ( 2 × r a n d ( 0 , 1 ) 1 )
where i t e r m a x is the maximum iteration count [52,53].

4.1.4. Population Initialization and Boundary Conditions

The jellyfish population is typically initialized randomly. Numerous chaotic maps are created with the aim of enhancing the variety of the initial population. The logistic map offers a wider range of starting values than randomly selecting values, and it reduces the risk of early convergence. Moreover, since the world has oceans distributed across its surface, due to the spherical shape of the Earth, if a jellyfish moves beyond a specific search area, it will re-enter the opposite boundary. This process of re-entering can be described by Equation (30):
X j , d = ( X j , d B u , d ) + B l ( d ) if X j , d > B u , d X j , d = ( X j , d B l , d ) + B u ( d ) if X j , d < B l , d
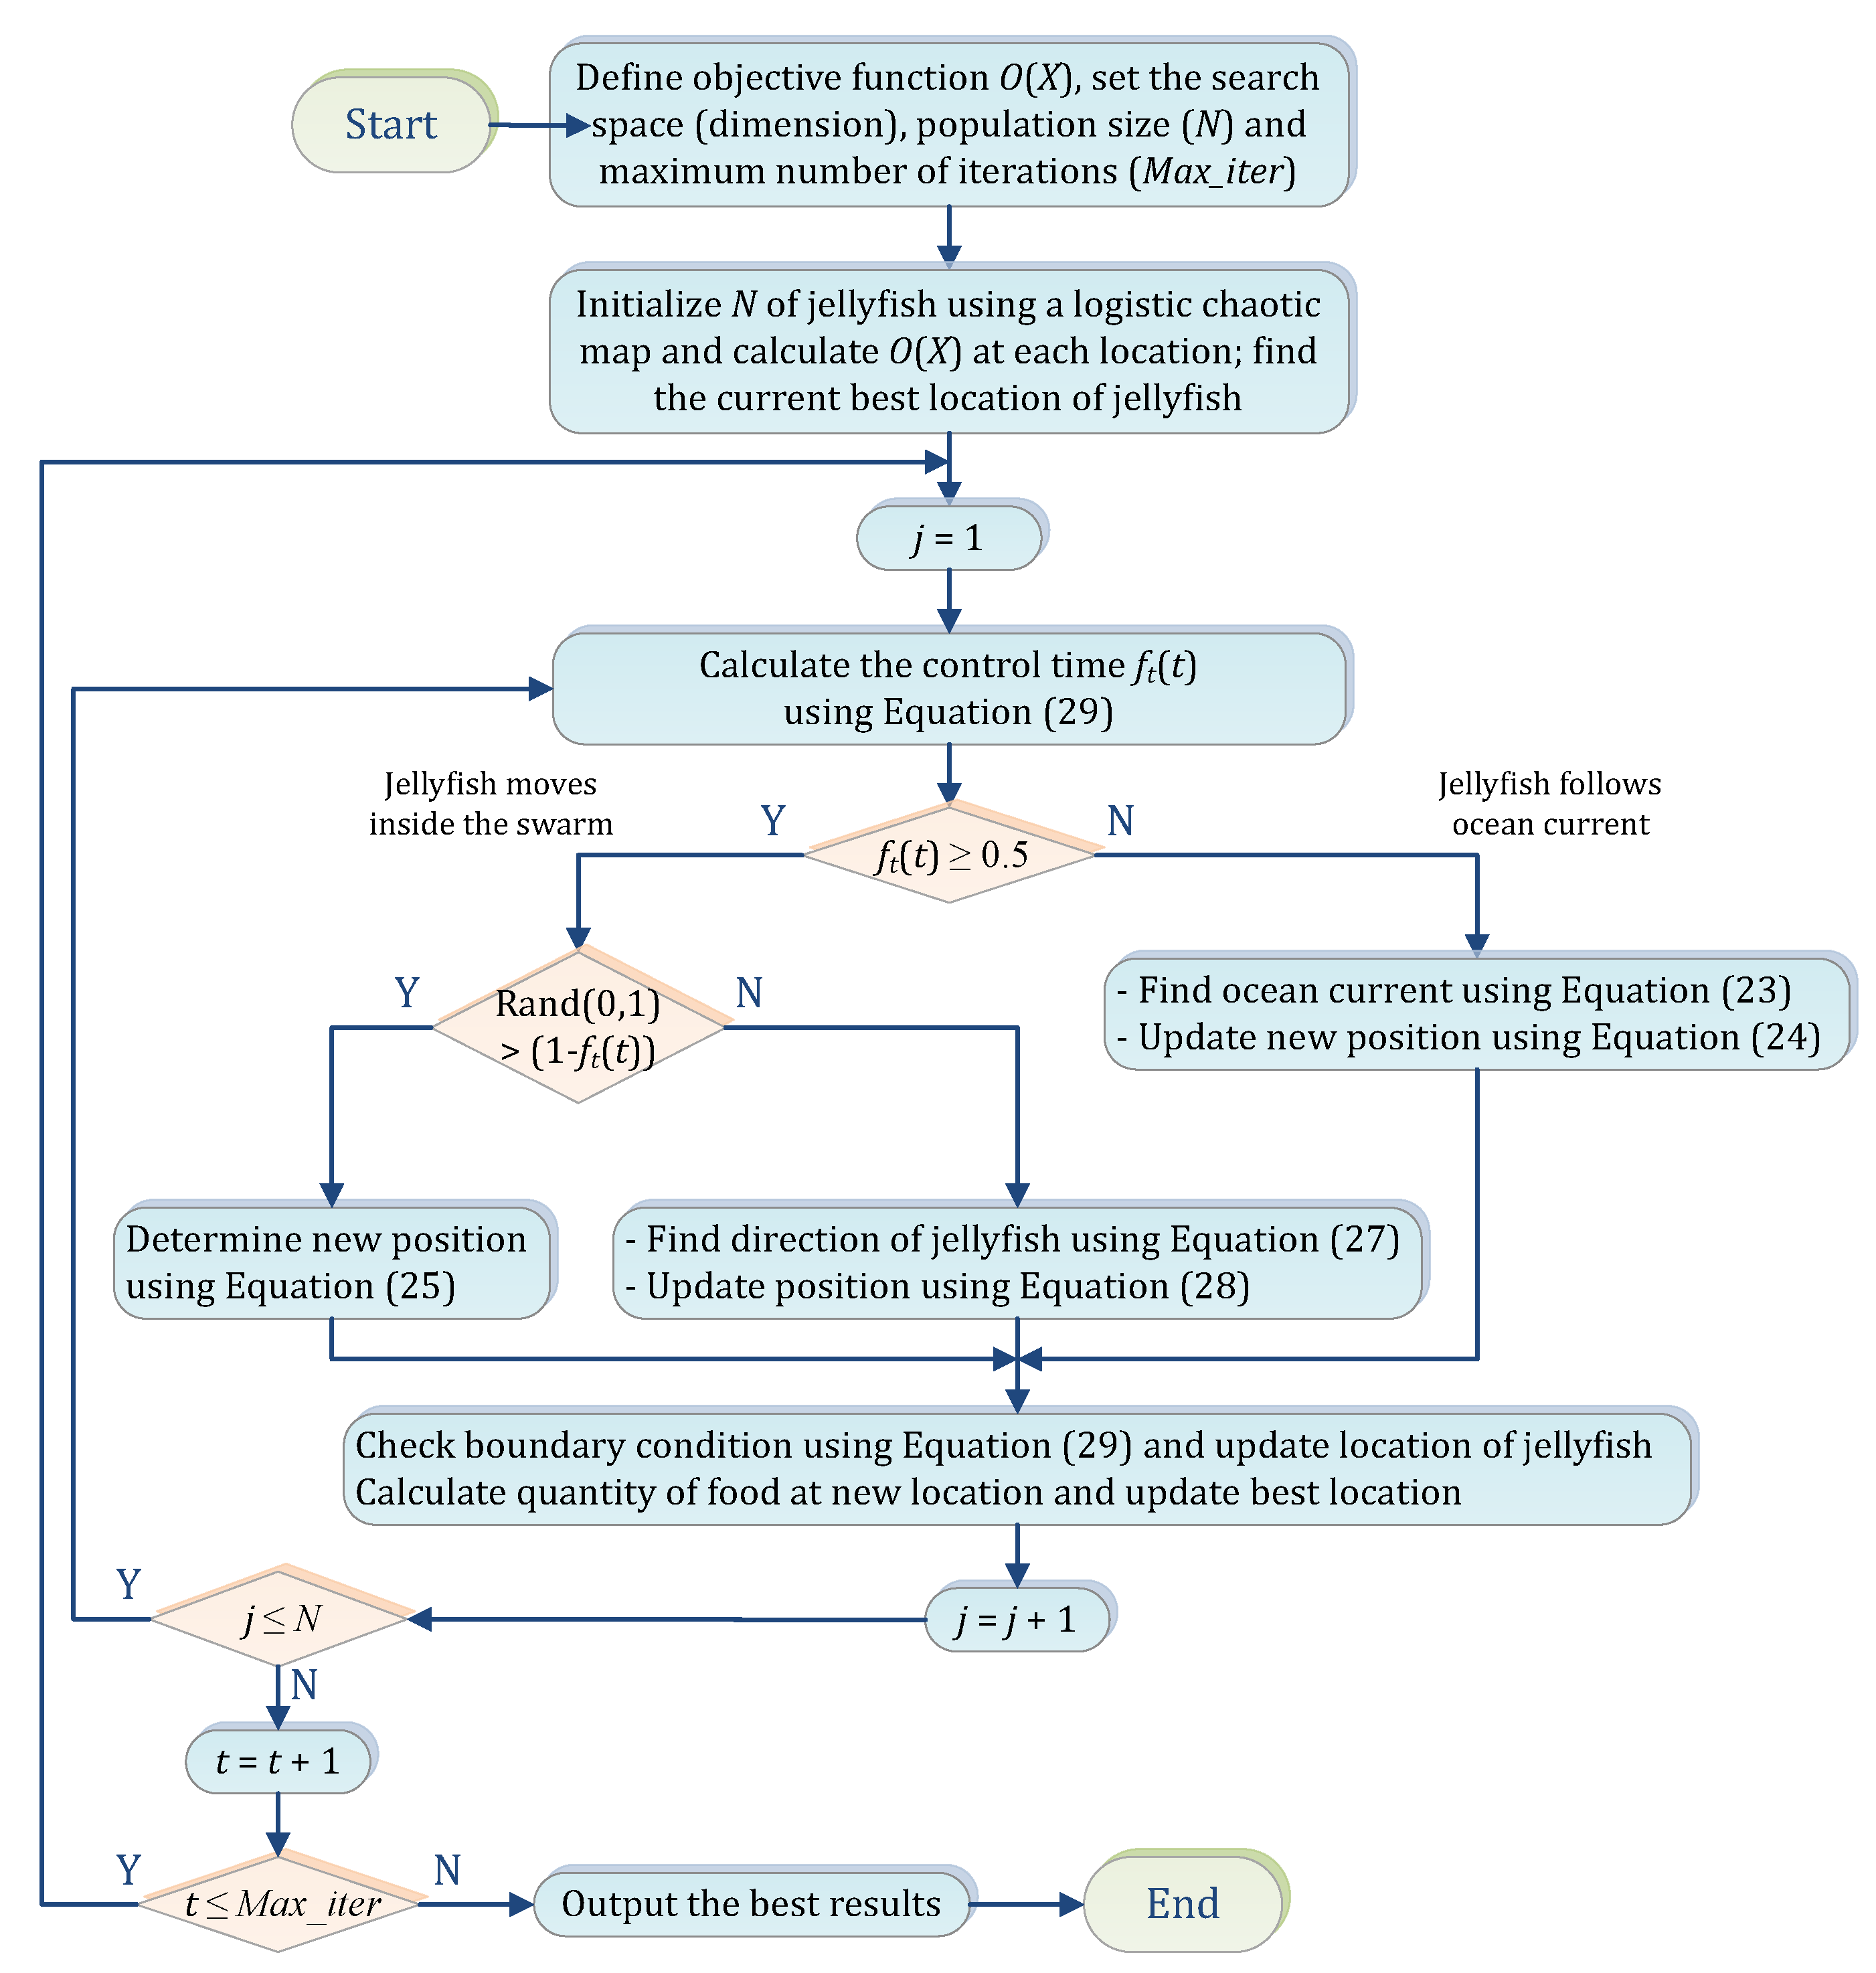
The jth jellyfish’s position in the dth dimension is represented by X j , d . After applying boundary constraints, the new position is denoted as X j , d . The upper and lower bounds of the search space in the dth dimension are represented by B u , d and B l , d , respectively [53]. The above process is described in the flowchart in Figure 6.

5. Controller Optimization Procedure

Initially, the shipboard MG system was considered for the frequency regulation problem with constant variations in the renewable sources and a constant step load variation as a disturbance. The values for the solar source and the sea wave source were obtained from the average values of real data, which will be presented in the following section. Thus, for the solar source, the value of 0.06 p.u. was used, while for the sea wave source, the value of 0.075 p.u. was used, and the variation in the load was given the value of 0.1 p.u. At first, the LFC problem was implemented with the PIDF controller and its gains were adjusted with the different algorithms: ALO, GOA, GWO, HHO, JSO, and WOA. The same procedure was followed for FOPID and 2DOF-PIDF. For the reliability of the results, each simulation experiment was performed 10 times, with 100 iterations and a population number of 50, where the ranges of the gains are taken as shown in Table 1. Also, for clarity reasons, the parameters of the shipboard microgrid are given in Table A1.
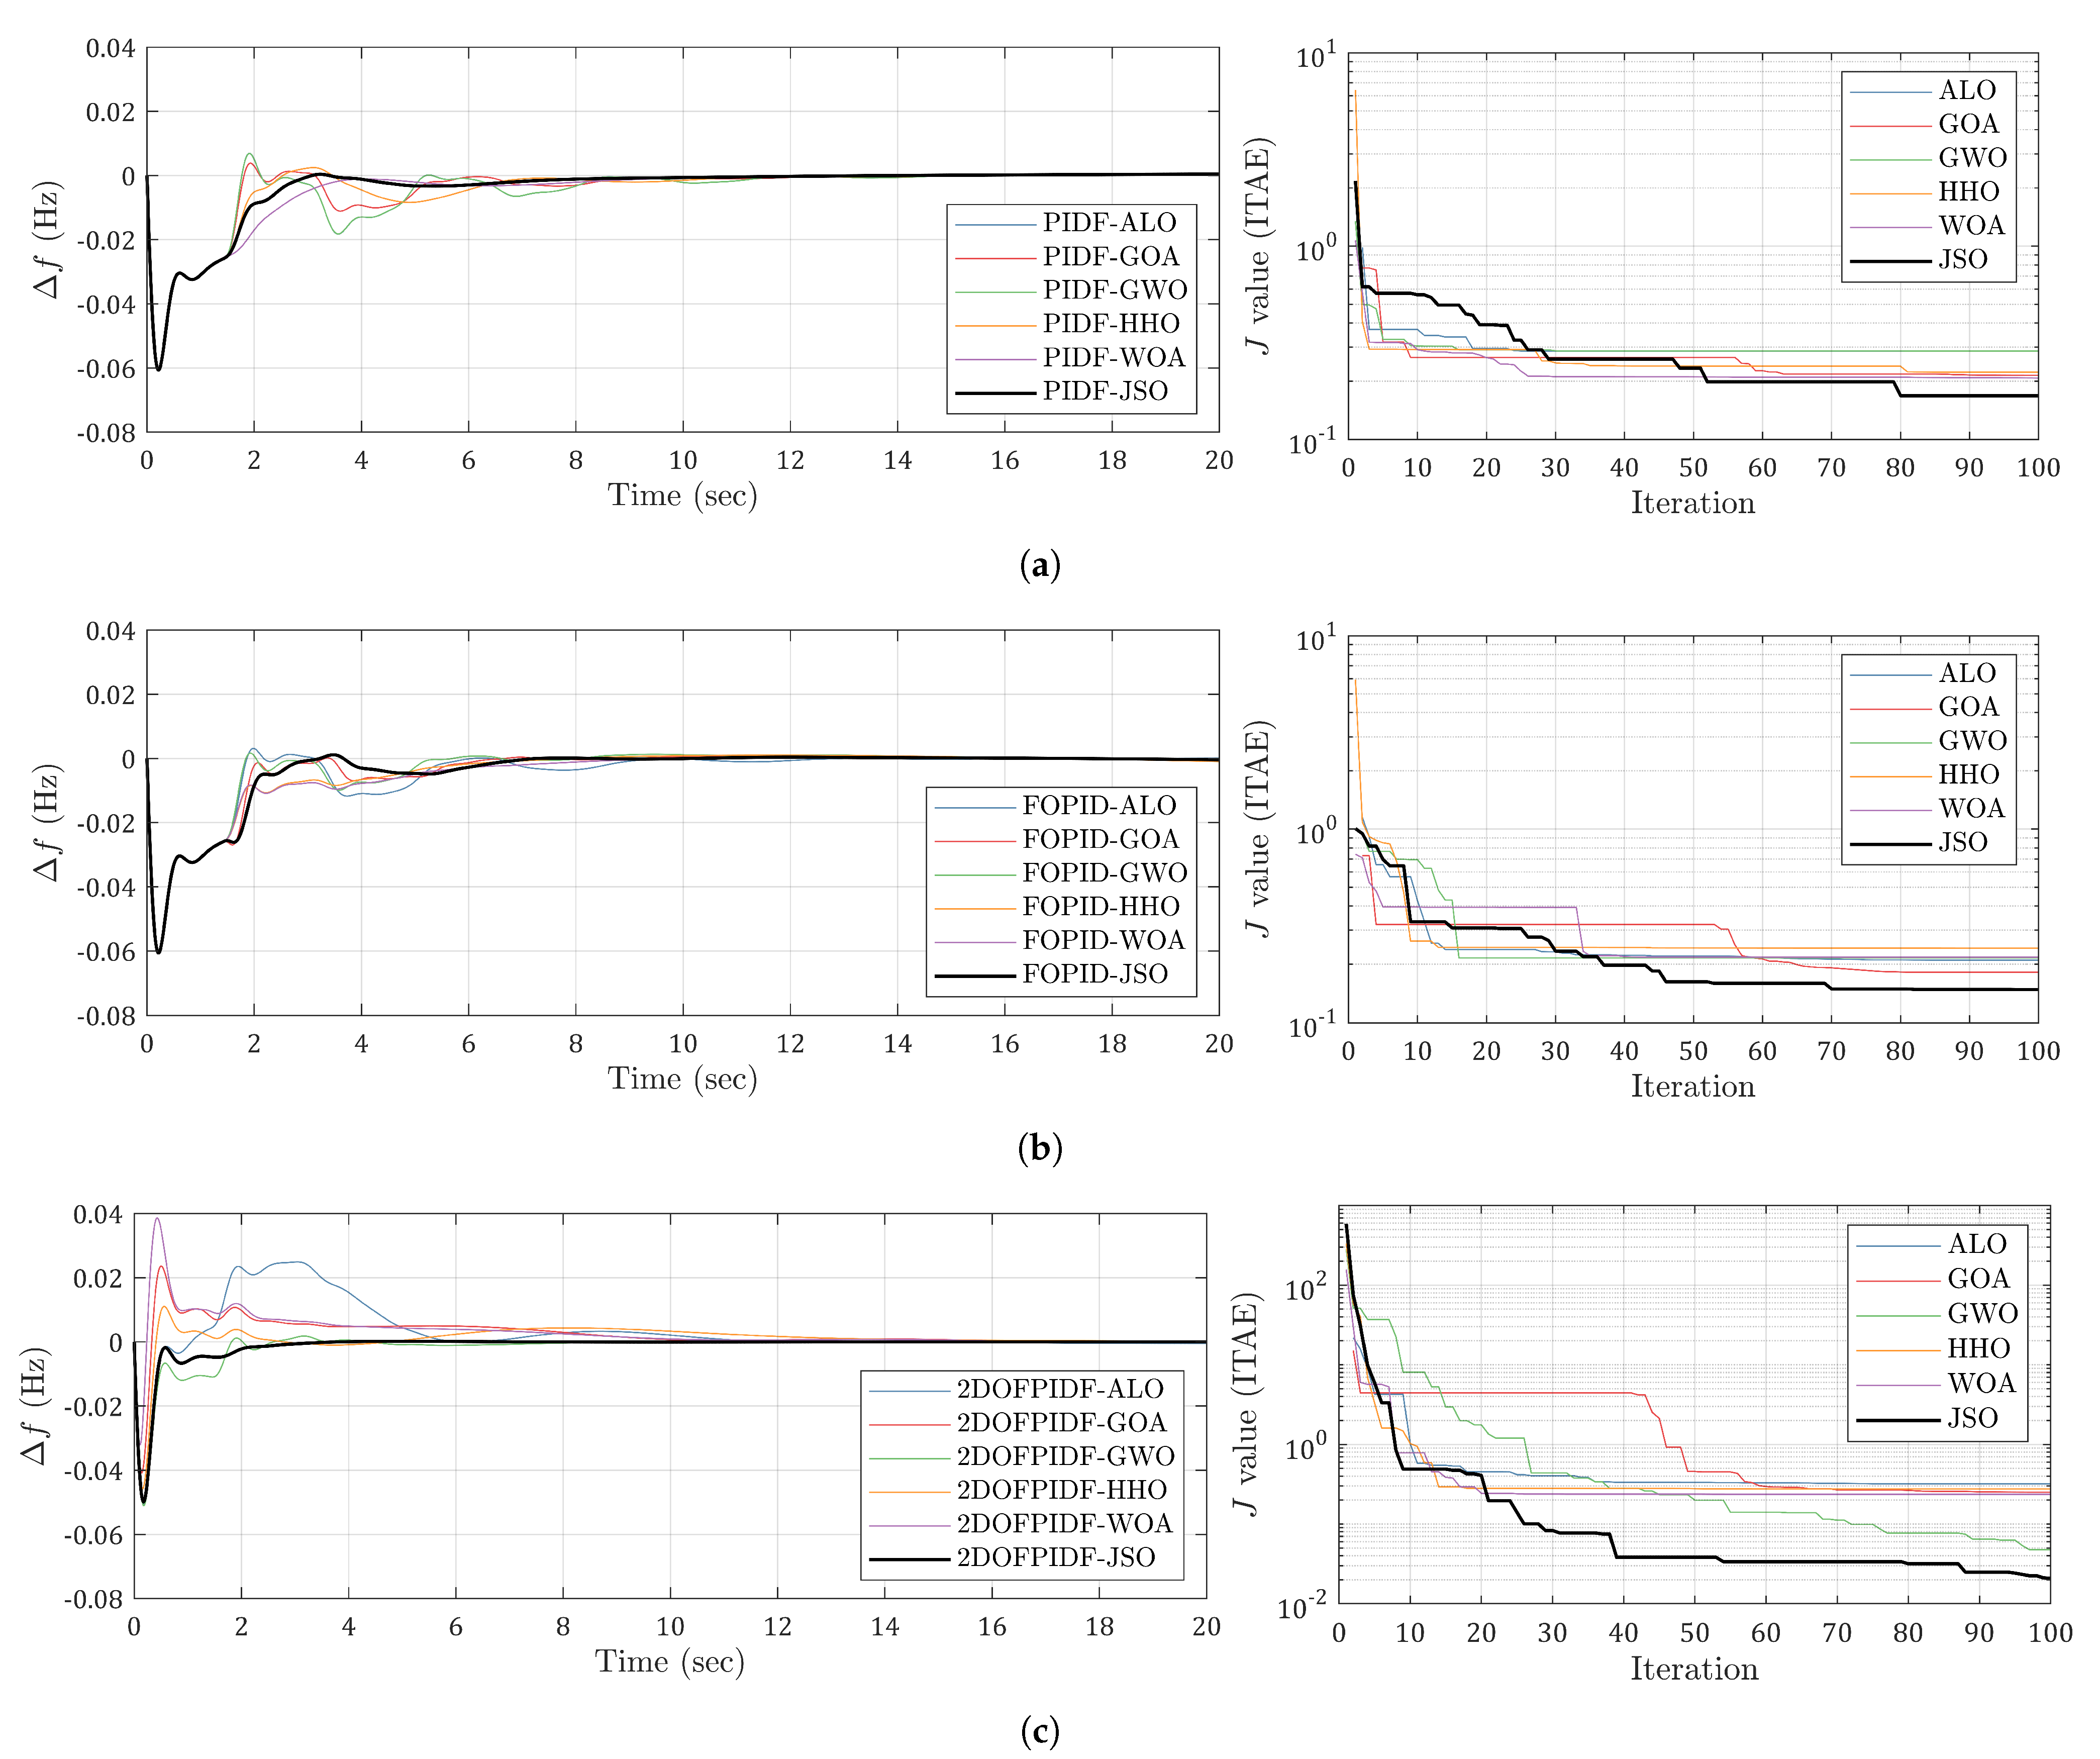
The simulations have yielded significant results, which are summarized in Figure 7a–c and Table 2. With regard to the PIDF controller, Table 2 shows that the ITAE for the different algorithms are (in descending order) the GWO (0.2867), ALO (0.2867), HHO (0.2228), GOA (0.2146), WOA (0.2081), and JSO (0.1683). Figure 7a provides a visual representation of the frequency response of the PIDF controller exhibited by the different optimization algorithms. The figure clearly shows that the GWO (6.8512 mHz) and ALO (6.6323 mHz) produced the highest overshoot, while the JSO and WOA did not show any overshoot. Notably, all the optimization algorithms began with an initial undershoot value of −59.761 mHz. It was observed that GWO (14.5088 s) and ALO (14.5059 s) exhibited the longest settling times, while the JSO (12.4524 s) and GOA (12.3677 s) had the shortest settling times. From the convergence curve, it is clear that the GWO and ALO converged in the first iterations (they were trapped in a local minimum), while the value of the JSO objective function continuously decreased as the iterations passed and managed to give the minimum ITAE. In summary, the results demonstrated that the JSO algorithm is the most-effective optimization algorithm for the first PIDF controller, producing the lowest ITAE value, the second-shortest settling time, and no overshoot.
For the FOPID controller, the results indicated that (in descending order) the HHO (0.2418) algorithm yielded the highest ITAE value, followed by the GWO (0.2157), WOA (0.2156), ALO (0.2095), GOA (0.1818), and JSO (0.1479). Interestingly, it was observed that all algorithms produced undershoots of −69.171 mHz, with no significant differences among them. However, the overshoots were relatively zero, except in the cases of the ALO (3.1125 mHz) and GWO (1.5037 mHz). In terms of settling time, the HHO (18.2348 s) and GWO (18.1233 s) exhibited the longest settling times. Convergence curves for FOPID were plotted using different meta-heuristic optimization techniques to investigate their performance behavior. The results showed that the HHO, GWO, WOA, and ALO converged prematurely and failed to reduce the objective function effectively. In contrast, the JSO and GOA produced smoother convergence curves, resulting in lower objective function values.
For the last controller (2DOF-PIDF) considered for the frequency load problem in the shipboard MG, the ITAE value for the different algorithms (in descending order) was obtained to be the ALO (0.3194), HHO (0.2748), GOA (0.2509), WOA (0.2370), GWO (0.0476), and JSO (0.0208). Furthermore, it was observed that the WOA (38.175 mHz), GOA (22.854 mHz), and HHO (10.853 mHz) exhibited the largest overshoots, while the GOA (15.6126 s), WOA (15.2957 s), and ALO (15.0948 s) presented the largest settling times. Notably, it was found that the overshoot was not common among all algorithms, and the worst behavior was demonstrated by the GWO (−51.074 mHz) and ALO (−50.361 mHz). The convergence curve analysis revealed that the HHO, WOA, and ALO demonstrated early convergence, whereas the performance of the GWO and JSO decreased until the end of the iterations.
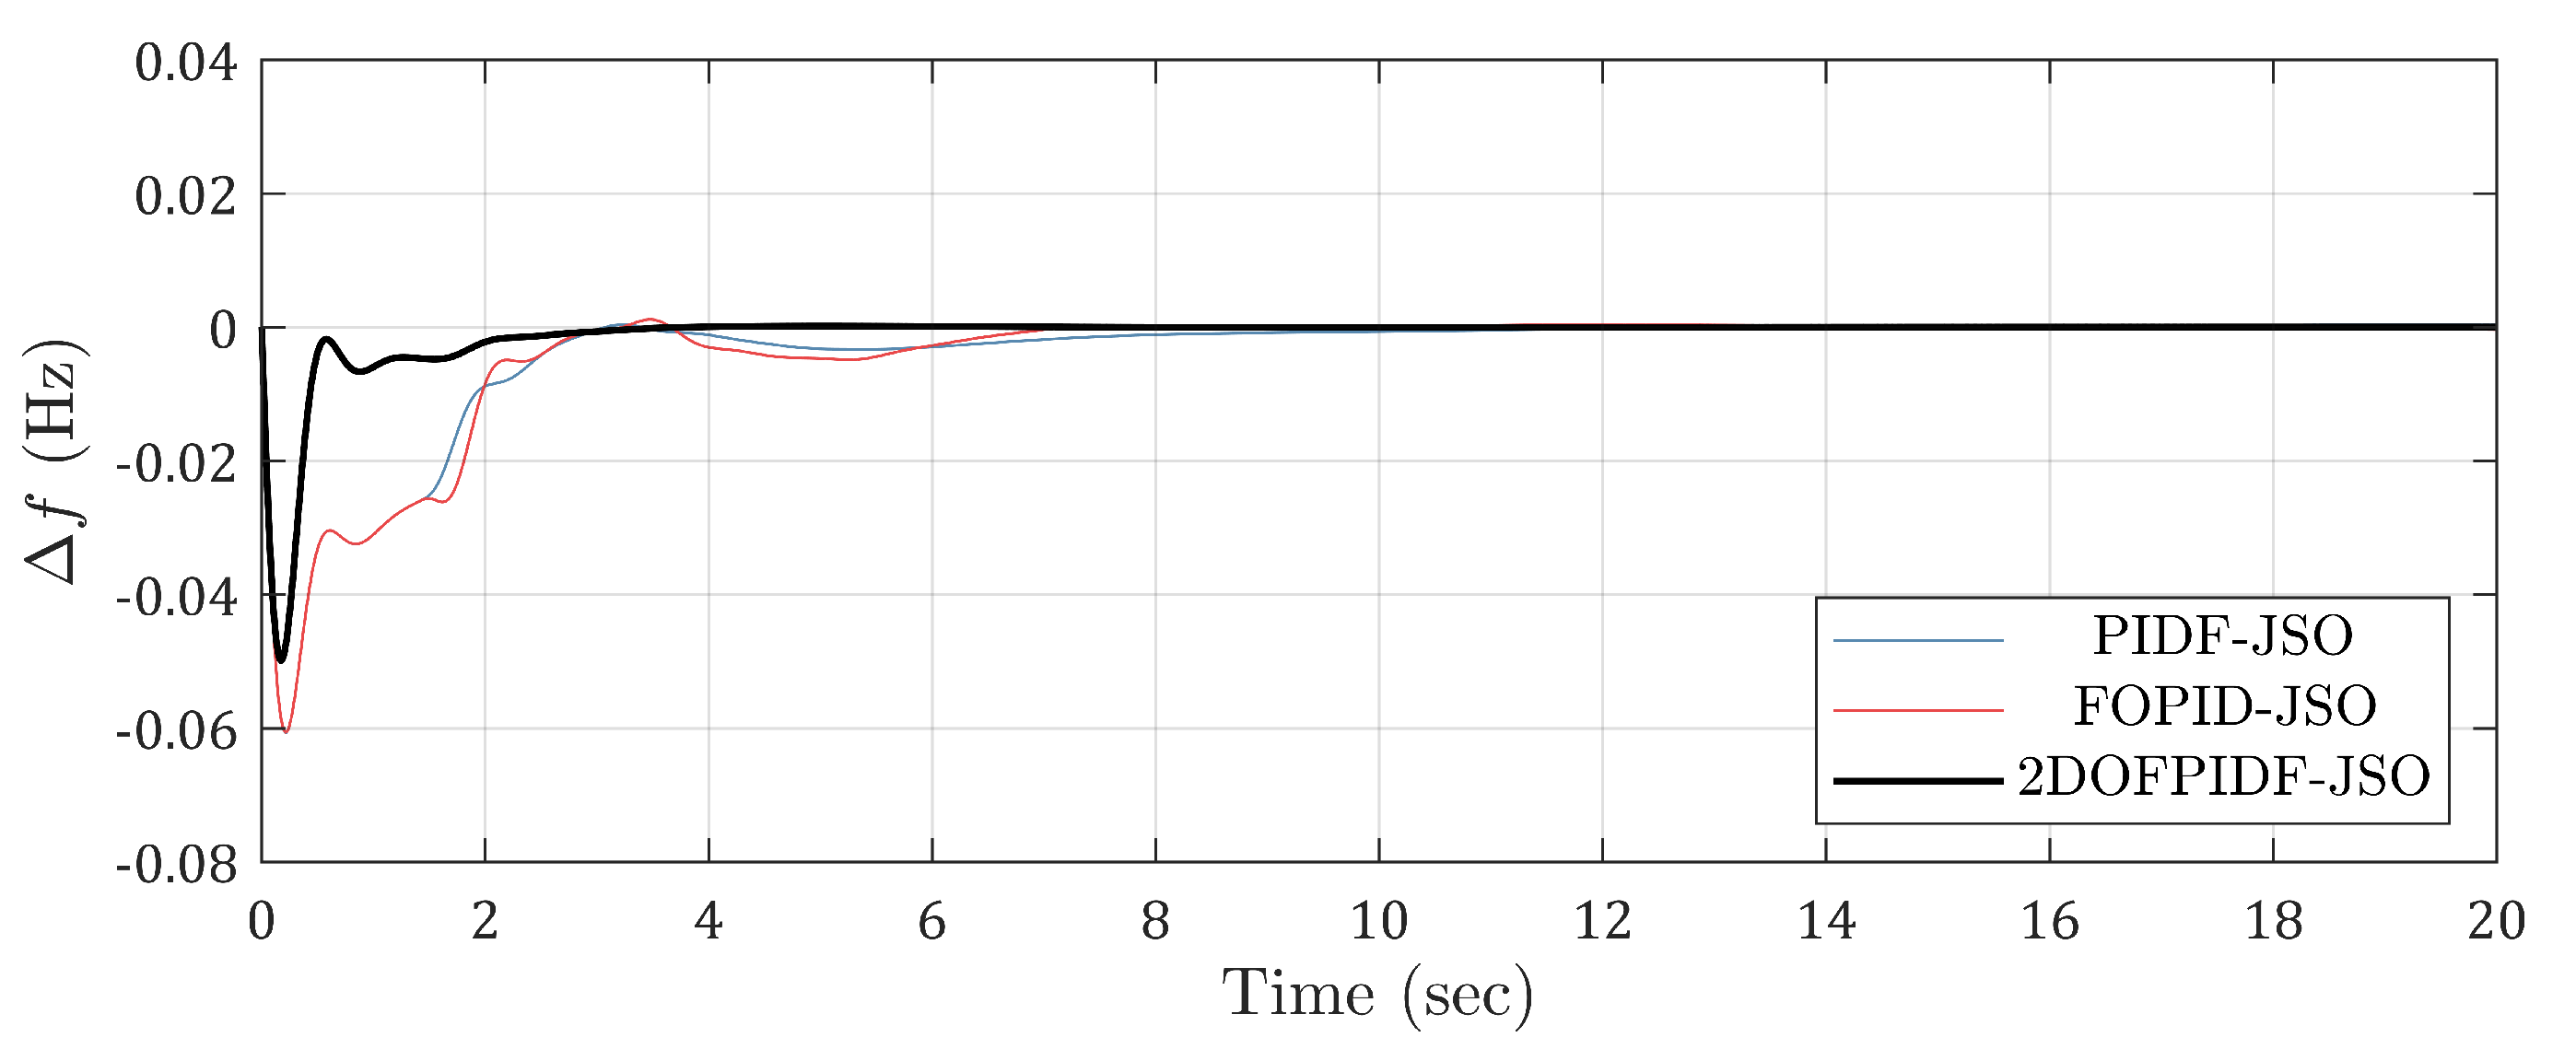
All algorithms successfully found gain values that led the system to stability for all types of controllers. The convergence graphs indicated that the ALO algorithm presented the fastest convergence, followed by the HHO, GWO, and WOA. Further analysis showed that the HHO and WOA produced the lowest ITAE values for the PIDF controller, whereas the ALO and GOA showed the best results for the FOPID controller, and the GWO and JSO showed the lowest ITAE values for 2DOF-PIDF. Figure 8 shows the frequency response for the best triad of the PIDF, FOPID, and 2DOF-PIDF controllers, which were tuned with the JSO algorithm. It was observed that the JSO consistently produced the smallest objective function values across all three controllers, with no overshoot. Additionally, the frequency response of the 2DOF-PIDF-JSO controller showed a shorter settling time (improved by 74.67% and 77.95% for the PIDF-JSO and FOPID-JSO controllers, respectively) and less overshoot (improved by 16.56% and 17.13% for the PIDF-JSO and FOPID-JSO controllers, respectively), as depicted in Figure 8. On average, the 2DOF-PIDF controller yielded the lowest objective function, followed by FOPID (deterioration of 85.93% compared to the JSO) and PIDF (deterioration of 87.64% compared to the JSO). These findings suggest that the JSO algorithm can be a useful tool for optimizing gain values for various types of controllers, with the potential to improve system performance and stability. At this point, it should be noted that deciding the superiority of one algorithm over another is challenging, as the no-free-lunch (NFL) theorem explains. The NFL theorem states that there is no single algorithm that can correctly solve every problem. Rather, many problems are best suited for different algorithms. In this particular case, the JSO, which is superior in solving the shipboard microgrid LFC problem, may have difficulty in solving another type of problem.

6. Further Analysis of Designed Controller Robustness

Three different cases were taken into consideration, and simulations were run to demonstrate the performance of the suggested controller, which is based on the JSO optimization technique. The values of the optimized controller parameters obtained from the simulation are displayed in Table 2.

6.1. Case 1: Random Multi-Step Energy–Load Variation

In this considered case, the source and load disturbances were divided according to the actual data to be presented in the next subsection into three levels: “low”, “medium”, and “high”. According to the real data measurements, for the load disturbances, the “low” value was 0.32 p.u., the “medium” value was 0.525 p.u. and the “high” value was 0.73 p.u., respectively. The same levels for the wave energy corresponded to 0.015 p.u., 0.0825 p.u., and 0.15 p.u., while for the solar energy, the “low”, “medium”, and “high” levels were 0 p.u., 0.06 p.u., and 0.12 p.u., respectively. Thus, three profiles of multi-step variations were created for solar, wind, and load shown in Figure 9, which included all possible combinations (three sources and three levels = 3 3 = 27 possible combinations). It should be stated that this case cannot correspond to reality because the magnitude of changes observed within such a short time frame seems implausible to occur in reality. However, this case was tested in order to demonstrate the reliability of the JSO-tuned 2DOF-PID controller in all possible cases of disturbance, even in the worst case when the load was at its maximum and the renewable sources could not contribute (i.e., t = 680–700 s).
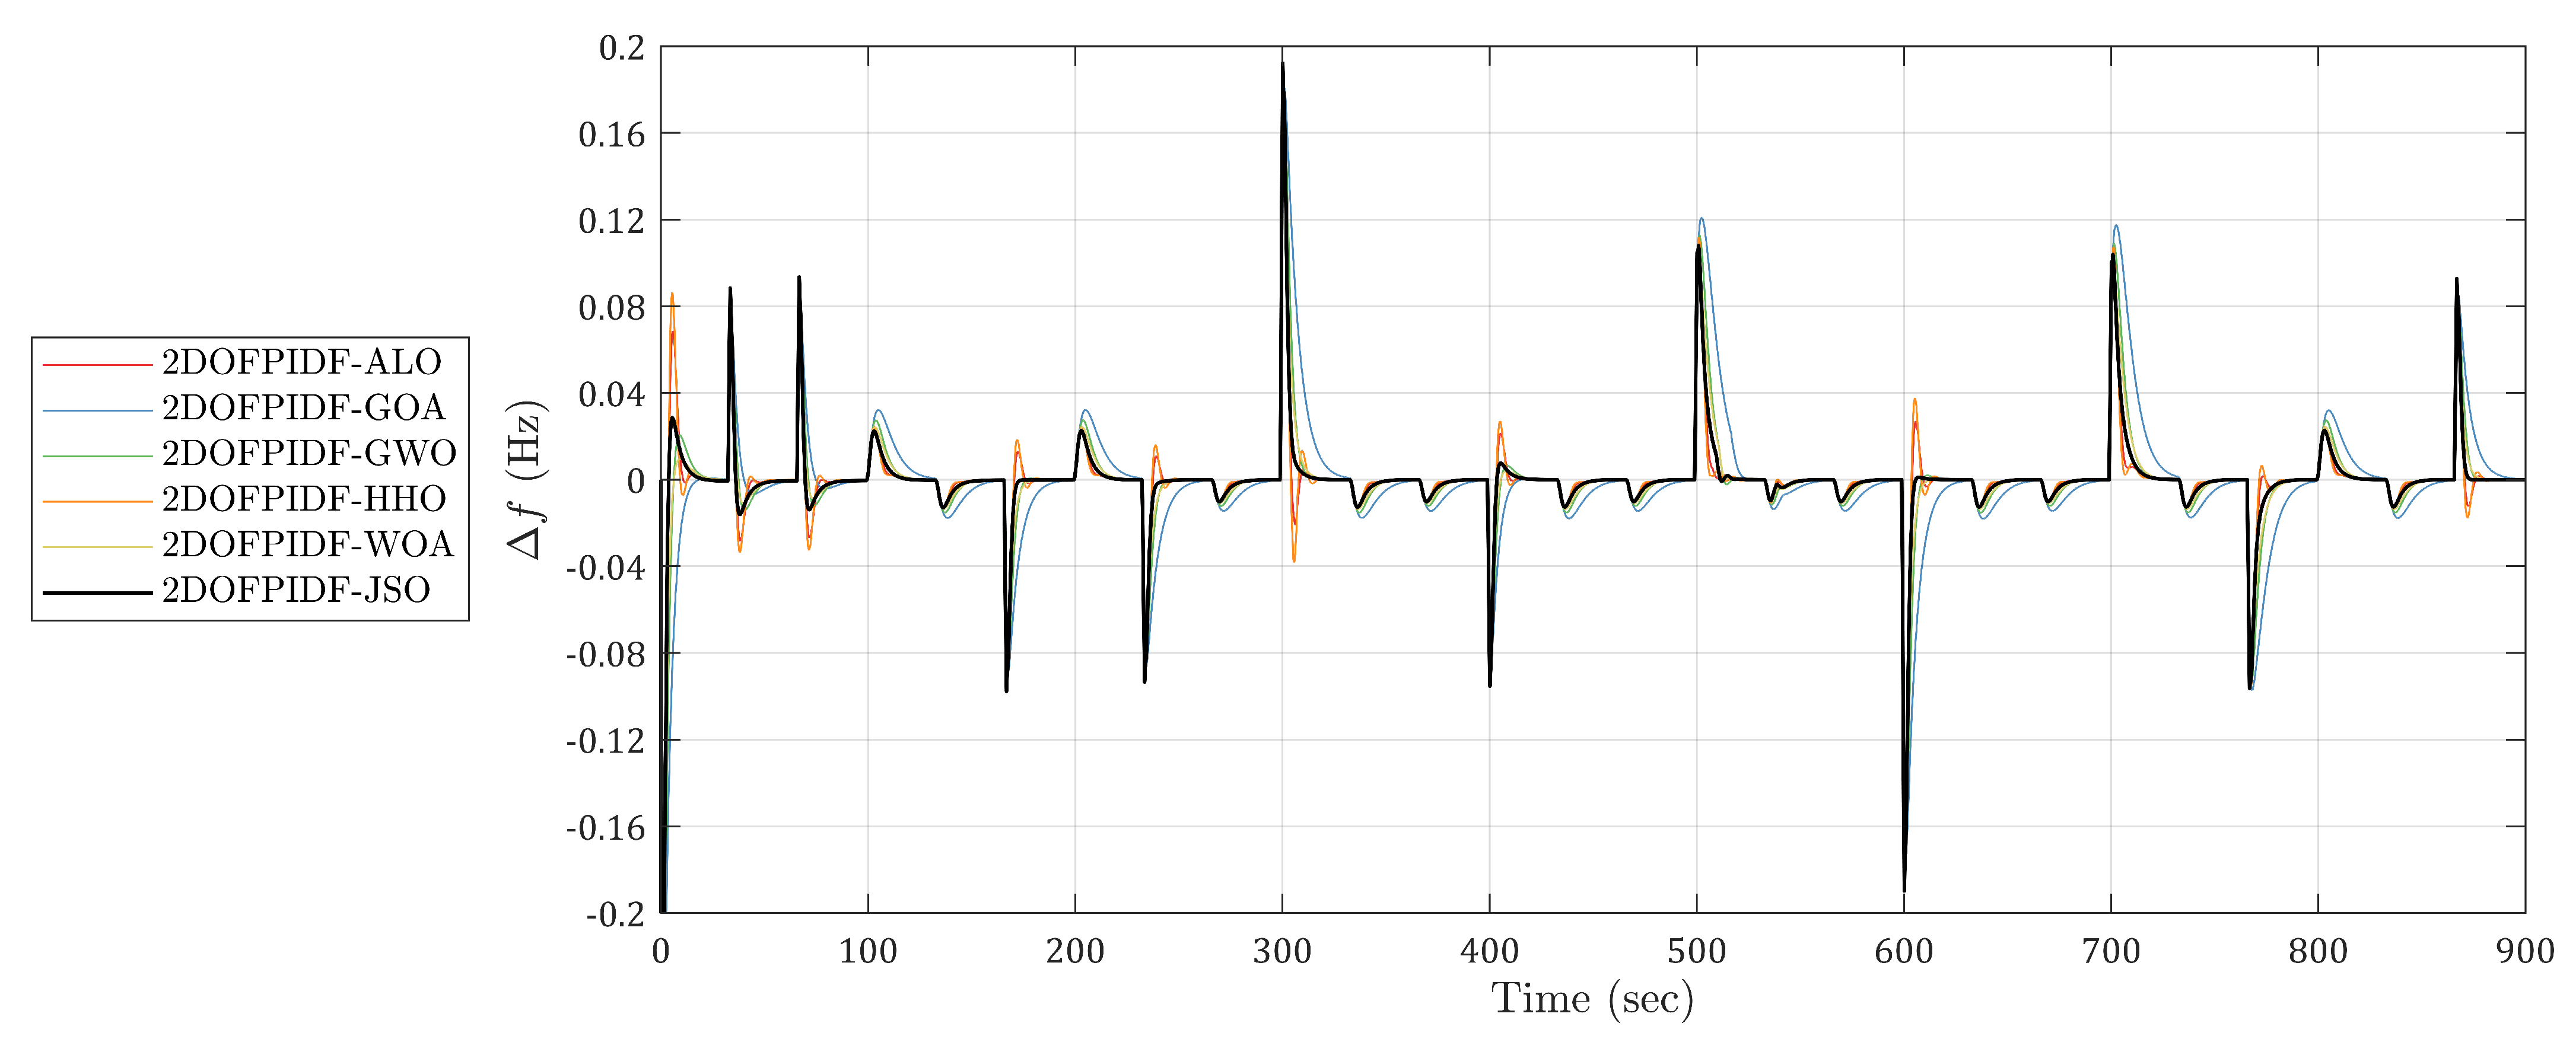
Figure 10 depicts the frequency response with the 2DOF-PIDF controller for all the considered bio-inspired optimization algorithms. It can be concluded that the response frequency deviation range lied between [−0.2 0.2] Hz at most. By observing Figure 10, it can be seen that, at the instant where the maximum overshoot (t = 300 s) and maximum undershoot (t = 600 s) occurred, the load went from the maximum value to the minimum and from the minimum to the maximum, respectively. The remaining peaks of the frequency response appeared whenever the load changed between the three predefined levels.
In the same figure, when the load presents its maximum value (0.73 p.u.) and the solar and wave sources do not contribute (0 p.u. and 0.015 p.u., respectively) at time t = 670–700 s, there is a negligible frequency deviation. Furthermore, when the load increased from its lowest value to its highest value “instantaneously” at t = 600 s, there was a maximum undershoot of 180 mHz. Nevertheless, this case is unrealistic as the loads and the contribution of renewable sources changed abruptly and with large variations. However, even in this scenario, the 2DOF-PIDF controller demonstrated superior performance in managing extreme frequency fluctuations within the shipboard microgrid.

6.2. Case 2: Stochastic Power Fluctuations—Real Data

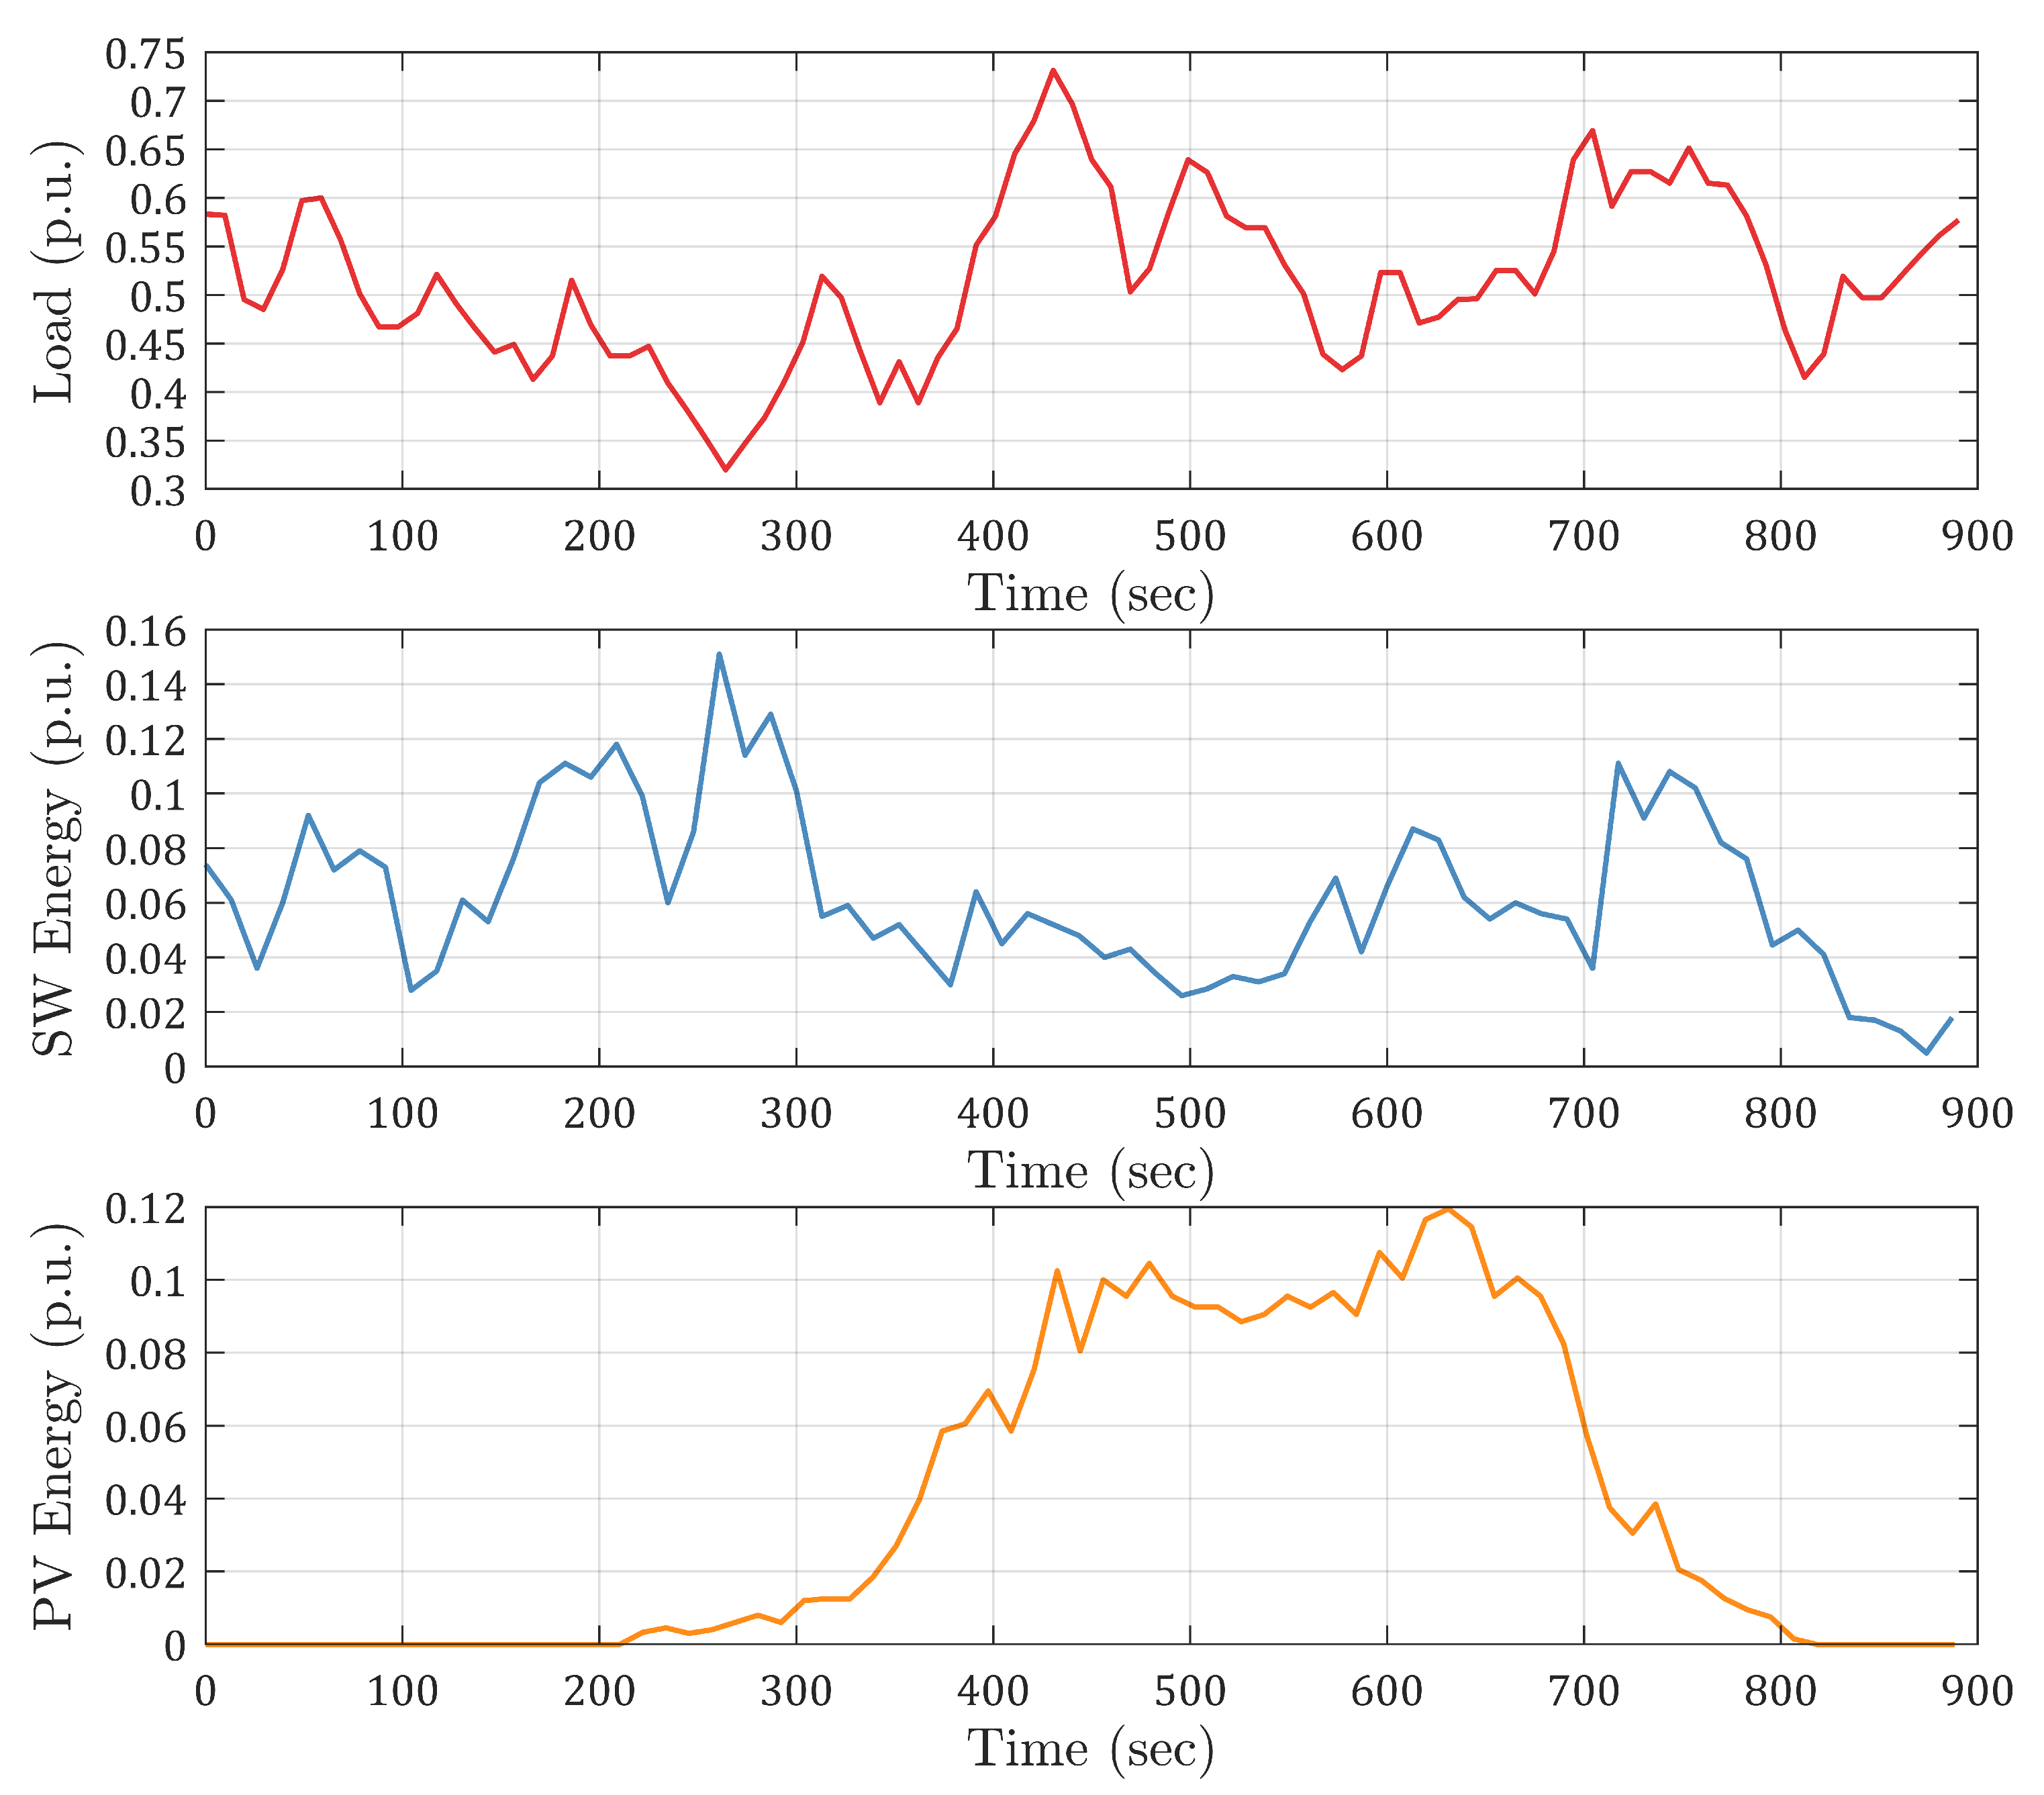
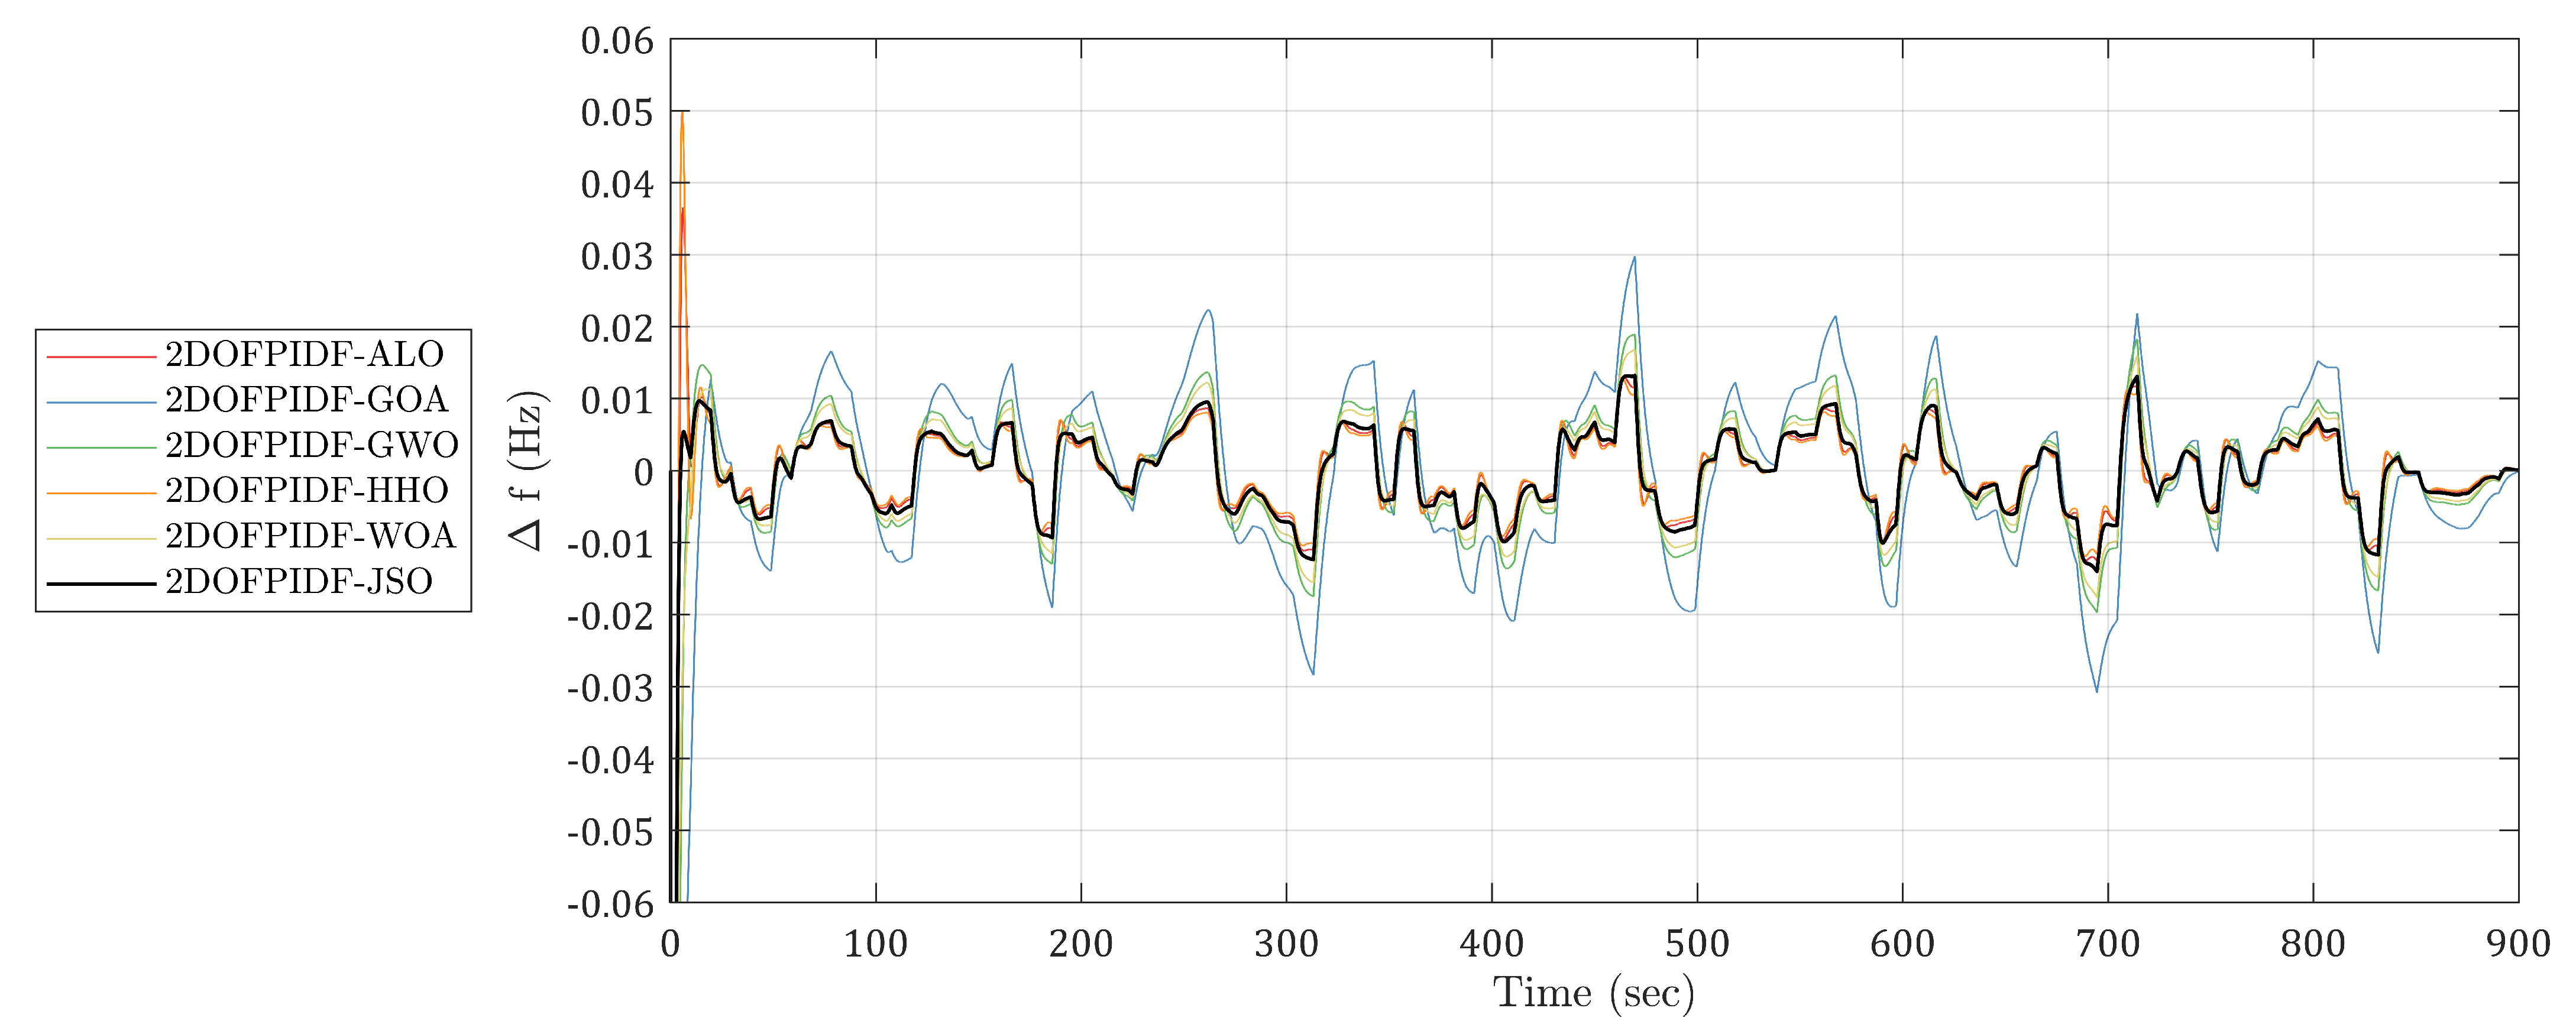
In this case, a realistic real recorded waves and solar dataset, as is depicted in Figure 11, was collected from the international ocean data center and the Keweenaw Research Center [23], taking into consideration the validation of the proposed load–frequency controller approach. This examined case was carried out for the purposes of providing more realistic simulation results. Figure 12 depicts the frequency response comparison of the six different algorithms with the 2DOF-PIDF controller.
In this case, the frequency deviation response range lied between [−0.03 0.03] Hz for controllers optimized, e.g., with the GOA and GWO, while the corresponding range for the JSO-tuned 2DOF-PIDF was only ±0.01 Hz. Additionally, it was observed that there were no “sharp” edges in this plot because the changes in the load and the corresponding RES energy contribution were changing more smoothly.
Figure 12 shows that, when the load presents its maximum value (0.73 p.u.) and the solar energy contributes at 80% of its maximum value (i.e., 0.1 p.u.), while wave energy contributes less than 50% of its maximum value (i.e., 0.06 p.u.) at approximately t = 420 s, there is a frequency deviation of −8.14 mHz in the case of the GOA, −3.02 mHz in the case of the WOA and GWO, and −2.26 mHz in the case of the JSO. Furthermore, at the time of t = 825 s, the contribution of renewable sources was almost negligible (0 p.u. and 0.02 p.u. for solar and wave, respectively), while when the load demand was almost 50% of its maximum value (0.55 p.u.), the frequency deviation for the GOA, ALO and JSO were −25.43 mHz, −11.7 mHz, −10.38 mHZ, respectively. As demonstrated in Figure 12, all examined bio-inspired algorithm-tuned controllers were capable of balancing demand and generation, even under fast-changing random load conditions, but the 2DOF-PIDF-JSO controller outperformed.

6.3. Case 3: Sensitivity Analysis—System’s Parameter Variation

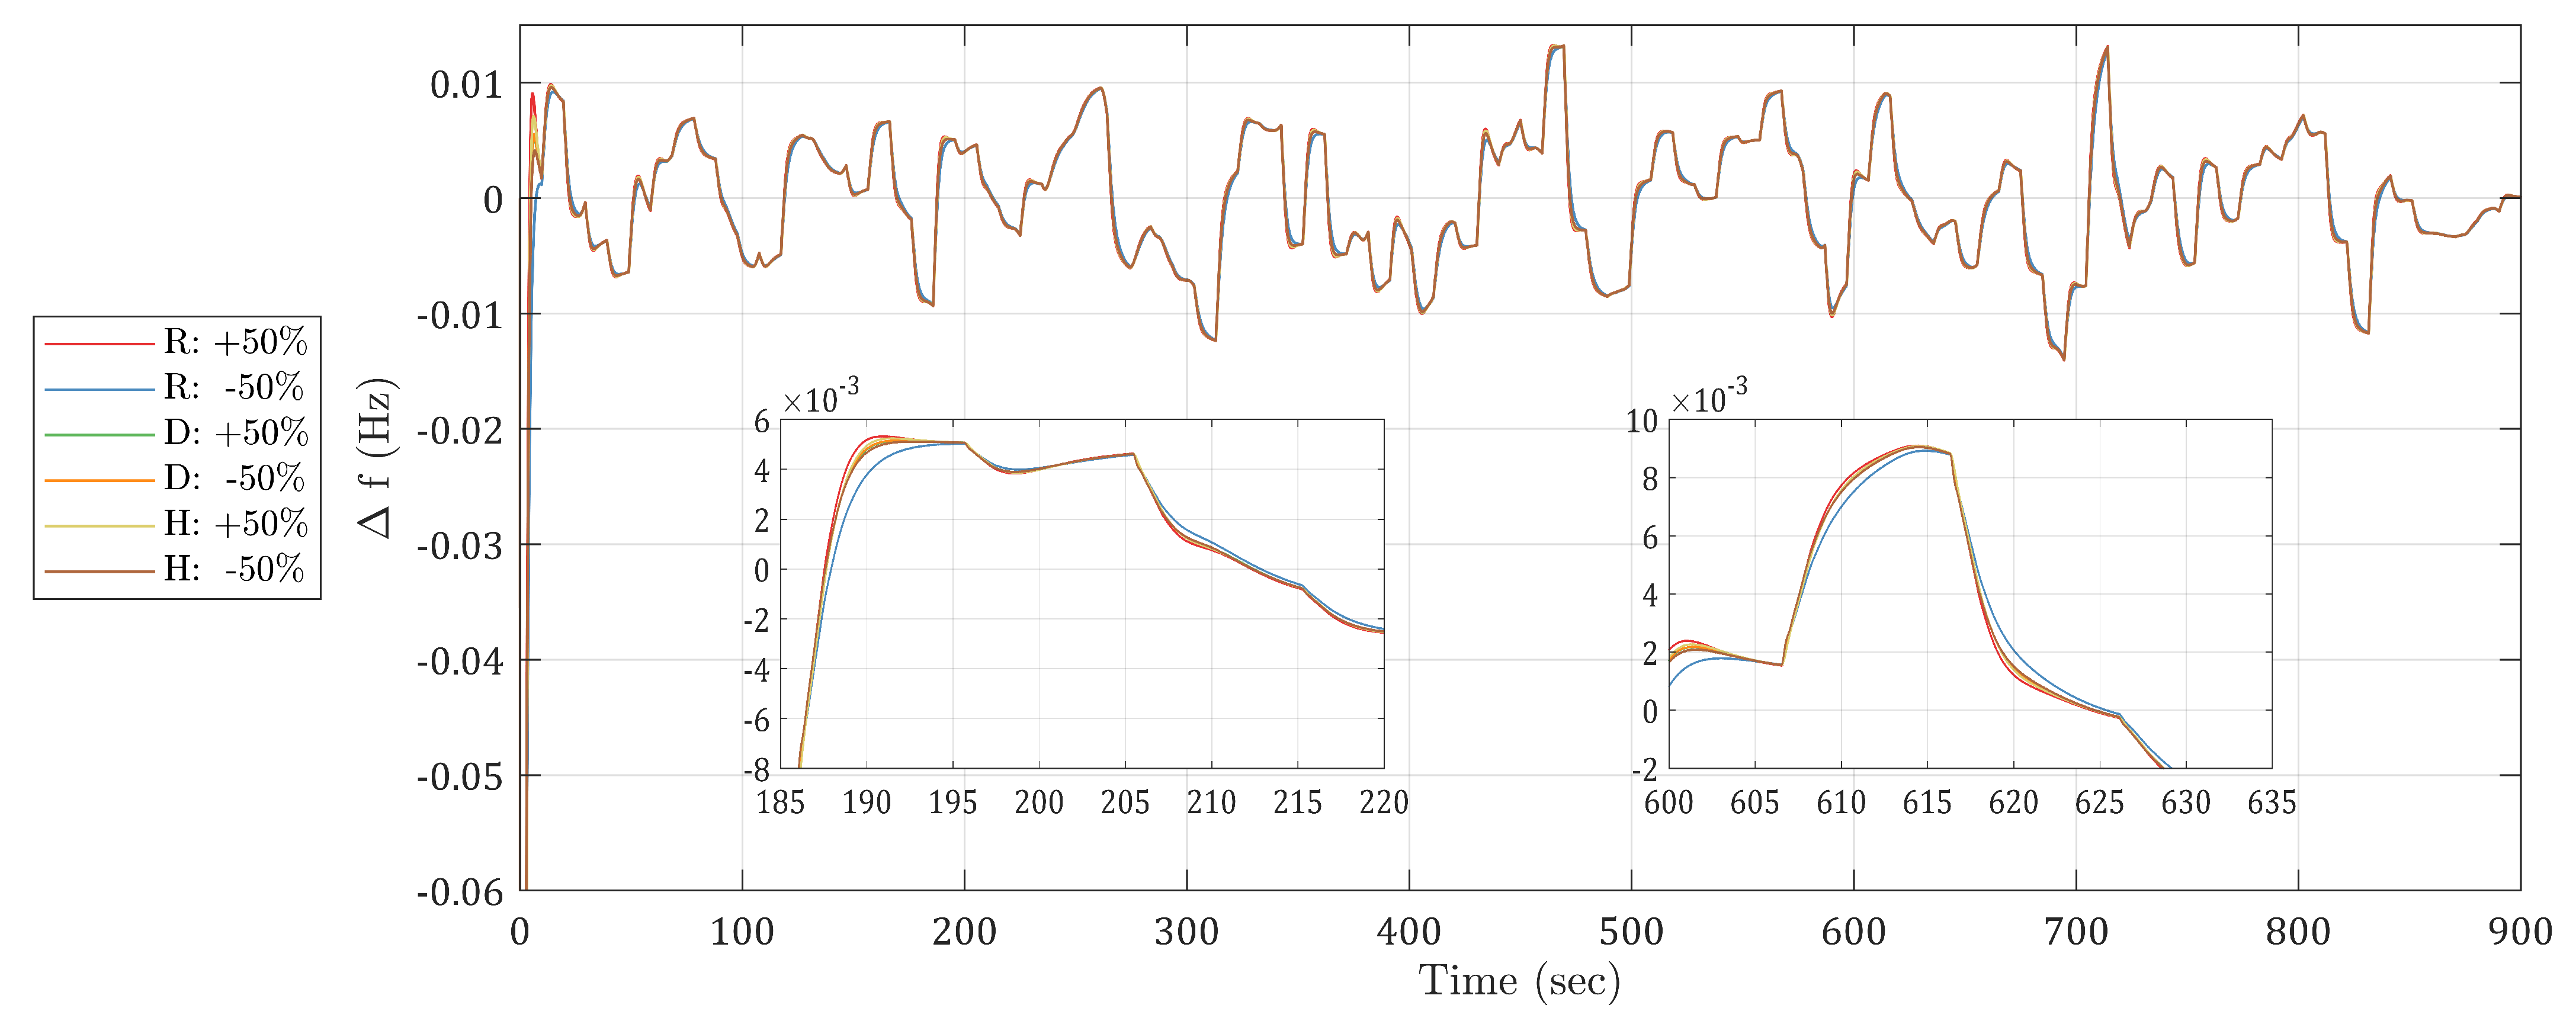
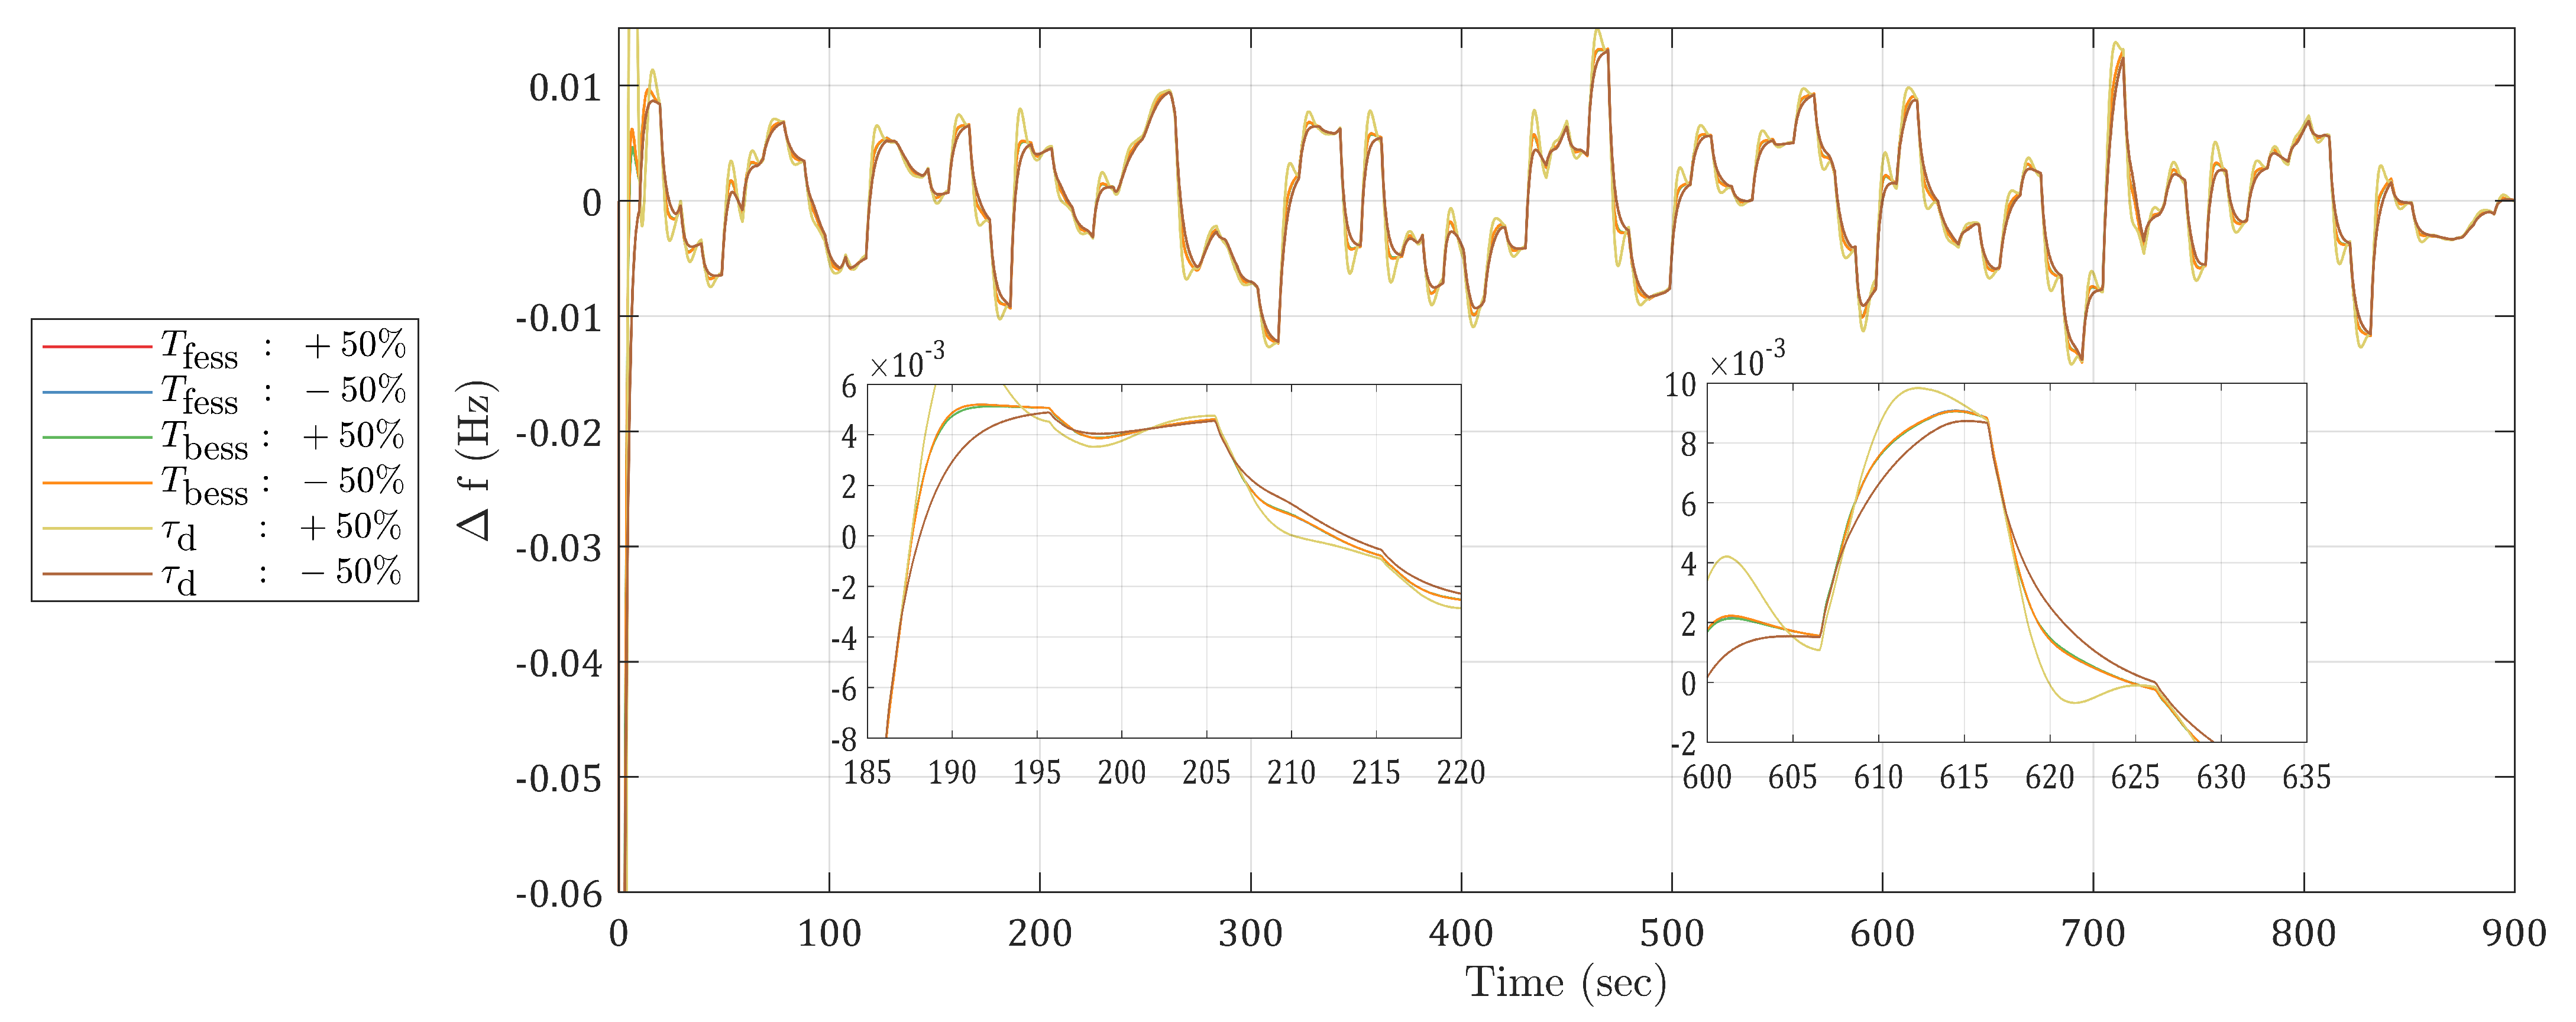
Sensitivity analysis is crucial for proving any controller’s effectiveness. This subsection demonstrates how the proposed controller (2DOF-PIDF-JSO) performed under various operational conditions based on parameter uncertainty. The effect of the variation of the system parameters on the dynamic response of the power system was investigated, and the obtained results are summarized graphically in Figure 13 and Figure 14. In the first one, the R, D, and H parameters are altered both +50% and −50% from their nominal values (i.e., R n o m = 3 p.u. MW/s, D n o m = 0.012 p.u./Hz, and H n o m = 0.1 p.u.·s, respectively), while in the latter, T f e s s , T b e s s , and τ d are also altered ±50% (where T f e s s , n o m = 0.1 s, T b e s s , n o m = 0.1 s, and τ d , n o m = 1.4 s). Figure 13 and Figure 14 show the effect of the system dynamics in terms of shipboard MG frequency deviation for the Case 2 real RES energy contribution and load data. It can be easily seen that the impact of modifying the system parameters on the system’s dynamic performance was actually negligible.
Thus, it can be concluded that the suggested approach is stable under a variety of scenarios and that the controller gains determined under nominal conditions do not need to be changed (re-tuned) when a large percentage of variation is applied to the system parameters.

7. Conclusions

In this paper, the issue of load frequency regulation in a contemporary shipboard microgrid (SMG) arising from the literature was investigated. The simulation model employed in this study comprised a variety of power-generating components, including a photovoltaic system, a diesel generator, a wave energy conversion system, a battery, and a flywheel storage system. The methodology followed for solving this load frequency control problem was divided into two phases: a controller optimization procedure and an analysis of the proposed controller’s robustness. The SMG system was initially considered with a constant variation in the renewable sources and a constant step load variation, leveraging average values of real data to establish the values for the solar and wave sources. For the purposes of ensuring reliable results, three different controller architectures (PIDF, FOPID, and 2DOF-PIDF) were evaluated, and their gains were obtained using various bio-inspired algorithms (ALO, GOA, GWO, HHO, JSO, and WOA). The simulation results indicated that the 2DOF-PIDF-JSO controller exhibited superior performance in terms of power system stability compared to other controllers designed using heuristic algorithms (improved by 93.49%, 91.71%, 56.3%, 92.43%, and 91.22% for the ALO-, GOA-, GWO-, HHO-, and WOA-tuned 2DOF-PIDF controllers, respectively). Furthermore, the 2DOF-PIDF-JSO controller yielded the lowest objective function, followed by the FOPID-JSO (deterioration of 85.93%) and PIDF-JSO (deterioration of 87.64%).
The assessment and analysis of the results demonstrated that the proposed approach provides improved stability in terms of settling time and reduces frequency deviation, resulting in a reduction in peak overshoot and undershoot. To ensure the superiority and robustness of the 2DOF-PIDF-JSO controller (second phase), three distinct simulation cases were considered. In the first case, according to real data, the renewable sources and load disturbances were categorized into three zones: high, medium, and low. This case was studied to show the 2DOF-PID-JSO controller’s dependability in potential disturbance scenarios, even in the worst-case scenario where the load is at its maximum and the renewable sources are unable to contribute. The second case incorporated real data obtained from a real data center, providing a more realistic simulation study. The final case involved a sensitivity analysis, which was conducted to evaluate the stability and robustness of the proposed JSO-tuned controller. The results of these simulations demonstrated the superior performance of the 2DOF-PIDF-JSO controller in maintaining frequency control in the SMG system, highlighting its effectiveness in maintaining stability in the face of disturbances.
The results presented indicated that the JSO algorithm outperformed all other algorithms across all examined cases. This can be attributed to the JSO algorithm’s ability to rapidly identify promising areas without any disruption. By using a time control mechanism and a chaotic map to enhance the diversity of the initial population and alternate movements, the JSO algorithm achieved better outcomes due to a well-balanced approach between exploring and exploiting. As a result, the JSO algorithm has great potential as a metaheuristic algorithm for resolving a variety of optimization problems.
Finally, some suggestions for future actions aiming to enhance the performance of load frequency control in SMGs may include:
-
The possibility of integrating other green energy sources, such as the combination of wind, PV, and wave energy, into these systems. The orientation of the PV panel and the likelihood of unplanned power generation system shutdowns could both be taken into account in this context;
-
Investigations into different hybrid energy storage solutions to solve the issue of LFC. Such a system might combine a superconducting magnetic energy storage (SMES) system with battery storage as an example. This strategy could have distinct advantages over current hybrid storage systems and offer insightful information for enhancing frequency load control for SMGs;
-
The SMG considered in this study can be tested in the future with different optimization methods and different controllers, while the corresponding obtained results can then be compared with the findings of the current paper.

Author Contributions

Conceptualization, Y.L.K. and E.N.; methodology, Y.L.K. and E.N.; software, Y.L.K.; validation, Y.L.K. and E.N.; formal analysis, Y.L.K. and E.N.; investigation, E.N.; writing—review and editing, Y.L.K. and E.N.; data curation, E.N.; writing—original draft preparation, E.N.; supervision, Y.L.K.; visualization, Y.L.K.; resources, Y.L.K.; project administration, Y.L.K. All authors have read and agreed to the published version of the manuscript.

Funding

This research received no external funding.

Institutional Review Board Statement

Not applicable.

Data Availability Statement

Not applicable.

Conflicts of Interest

The authors declare no conflict of interest.

Abbreviations

The following abbreviations are used in this manuscript:
2DOF-PIDF2-degree-of-freedom PID with filterBESSbattery energy storage system
ALOant-lion optimizerDGdiesel generator
BOAbutterfly optimization algorithmFCfuel cell
ESSenergy storage systemFESSflywheel energy storage system
FFOPI(D)fuzzy fractional-order PI(D)GAgenetic algorithm
FOPIDfractional-order PIDGWOgrey wolf optimizer
GOAgrasshopper optimization algorithmITAEintegral time absolute error
HHOHarris hawks optimizationLFCload-frequency control
JSOjellyfish search optimizerNFLOPIDnon-linear fractional-order PID
MGmicrogridPIDFproportional-integral-derivative with filter
PEMFCproton exchange membrane fuel cellPVphotovoltaics
PSOparticle swarm optimizationSDGship diesel generator
RESrenewable energy sourceSPSshipboard power system
SMGship microgridSSAsalp swarm algorithm
SoCstate of chargeTLBOteaching–learning-based optimization
SWEsea wave energyWECwave energy conversion
UCultra-capacitorsWOAwhale optimization Algorithm

Appendix A. System Parameters

The shipboard microgrid parameters are given in Table A1.
Table A1. System parameters.
ParameterValue (Unit)ParameterValue (Unit)
Diesel source PV source
time constant T g 0.08 (s)time constant ( T i n v 2 )4.0 (s)
time constant T d 0.40 (s)time constant ( T c )0.5 (s)
ramp rate limit δ d g 0.05 (p.u. MW/s)flywheel
PEMFC source time constant ( T f e s s )0.1 (s)
time constant ( T f c )0.26 (s)battery
time constant ( T i n v 1 )0.04 (s)time constant ( T b e s s )0.1 (s)
time constant ( T i c )0.004 (s)system
SWE source inertia constant (M)0.2 (p.u.·s)
time constant ( T g 2 )0.5 (s)damping coefficient (D)0.012 (p.u./Hz)
time constant ( T h )4.0 (s)droop regulation (R)3.0 (p.u. MW/s)

References

  1. Mutarraf, M.; Terriche, Y.; Niazi, K.; Vasquez, J.; Guerrero, J. Energy Storage Systems for Shipboard Microgrids—A Review. Energies 2018, 11, 3492. [Google Scholar] [CrossRef]
  2. Issa, M.; Ilinca, A.; Martini, F. Ship Energy Efficiency and Maritime Sector Initiatives to Reduce Carbon Emissions. Energies 2022, 15, 7910. [Google Scholar] [CrossRef]
  3. Latif, A.; Hussain, S.M.S.; Das, D.C.; Ustun, T.S. Double stage controller optimization for load frequency stabilization in hybrid wind-ocean wave energy based maritime microgrid system. Appl. Energy 2021, 282, 116171. [Google Scholar] [CrossRef]
  4. Inal, O.B.; Charpentier, J.F.; Deniz, C. Hybrid power and propulsion systems for ships: Current status and future challenges. Renew. Sustain. Energy Rev. 2022, 156, 111965. [Google Scholar] [CrossRef]
  5. Nguyen, H.P.; Hoang, A.T.; Nizetic, S.; Nguyen, X.P.; Le, A.T.; Luong, C.N.; Chu, V.D.; Pham, V.V. The electric propulsion system as a green solution for management strategy of CO2 emission in ocean shipping: A comprehensive review. Int. Trans. Electr. Energy Syst. 2021, 31, e12580. [Google Scholar] [CrossRef]
  6. Hein, K.; Yan, X.; Wilson, G. Multi-Objective Optimal Scheduling of a Hybrid Ferry with Shore-to-Ship Power Supply Considering Energy Storage Degradation. Electronics 2020, 9, 849. [Google Scholar] [CrossRef]
  7. Wu, X.; Liu, J.; Men, Y.; Chen, B.; Lu, X. Optimal Energy Storage System and Smart Switch Placement in Dynamic Microgrids with Applications to Marine Energy Integration. IEEE Trans. Sustain. Energy 2022, 14, 1205–1216. [Google Scholar] [CrossRef]
  8. Bertinelli Salucci, C.; Bakdi, A.; Glad, I.K.; Vanem, E.; De Bin, R. A novel semi-supervised learning approach for State of Health monitoring of maritime lithium-ion batteries. J. Power Sour. 2023, 556, 232429. [Google Scholar] [CrossRef]
  9. Yang, T.; Wu, L.; Li, X.; Zhu, M.; Brennan, M.J.; Liu, Z. Active Vibration Isolation of a Diesel Generator in a Small Marine Vessel: An Experimental Study. Appl. Sci. 2020, 10, 3025. [Google Scholar] [CrossRef]
  10. Letafat, A.; Rafiei, M.; Sheikh, M.; Afshari-Igder, M.; Banaei, M.; Boudjadar, J.; Khooban, M.H. Simultaneous energy management and optimal components sizing of a zero-emission ferry boat. J. Energy Storage 2020, 28, 101215. [Google Scholar] [CrossRef]
  11. Huang, M.; He, W.; Incecik, A.; Cichon, A.; Królczyk, G.; Li, Z. Renewable energy storage and sustainable design of hybrid energy powered ships: A case study. J. Energy Storage 2021, 43, 103266. [Google Scholar] [CrossRef]
  12. Nasiri, S.; Peyghami, S.; Parniani, M.; Blaabjerg, F. A comprehensive theoretical approach for analysing manoeuvring effects on ships by integrating hydrodynamics and power system. IET Electr. Syst. Transp. 2022, 12, 89–101. [Google Scholar] [CrossRef]
  13. Diab, A.A.Z.; Sultan, H.M.; Mohamed, I.S.; Kuznetsov, O.N.; Do, T.D. Application of Different Optimization Algorithms for Optimal Sizing of PV/Wind/Diesel/Battery Storage Stand-Alone Hybrid Microgrid. IEEE Access 2019, 7, 119223–119245. [Google Scholar] [CrossRef]
  14. Roy, A.; Auger, F.; Olivier, J.C.; Schaeffer, E.; Auvity, B. Design, Sizing, and Energy Management of Microgrids in Harbor Areas: A Review. Energies 2020, 13, 5314. [Google Scholar] [CrossRef]
  15. Bao, X.; Xu, X.; Zhang, Y.; Xiong, Y.; Shang, C. Optimal Sizing of Battery Energy Storage System in a Shipboard Power System with considering Energy Management Optimization. Discrete Dyn. Nat. Soc. 2021, 2021, 9032206. [Google Scholar] [CrossRef]
  16. Mutarraf, M.; Terriche, Y.; Niazi; Khan, F.; Vasquez, J.; Guerrero, J. Control of Hybrid Diesel/PV/Battery/Ultra-Capacitor Systems for Future Shipboard Microgrids. Energies 2019, 12, 3460. [Google Scholar] [CrossRef]
  17. Xiao, Z.X.; Li, H.M.; Fang, H.W.; Guan, Y.Z.; Liu, T.; Hou, L.; Guerrero, J.M. Operation Control for Improving Energy Efficiency of Shipboard Microgrid Including Bow Thrusters and Hybrid Energy Storages. IEEE Trans. Transp. Electrif. 2020, 6, 856–868. [Google Scholar] [CrossRef]
  18. Zhaoxia, X.; Tianli, Z.; Huaimin, L.; Guerrero, J.M.; Su, C.L.; Vasquez, J.C. Coordinated Control of a Hybrid-Electric-Ferry Shipboard Microgrid. IEEE Trans. Transp. Electrif. 2019, 5, 828–839. [Google Scholar] [CrossRef]
  19. Kumar, D.; Mathur, H.D.; Bhanot, S.; Bansal, R.C. Forecasting of solar and wind power using LSTM RNN for load frequency control in isolated microgrid. Int. J. Model. Simul. 2021, 41, 311–323. [Google Scholar] [CrossRef]
  20. Alayi, R.; Zishan, F.; Seyednouri, S.R.; Kumar, R.; Ahmadi, M.H.; Sharifpur, M. Optimal Load Frequency Control of Island Microgrids via a PID Controller in the Presence of Wind Turbine and PV. Sustainability 2021, 13, 10728. [Google Scholar] [CrossRef]
  21. Wang, H.; Zeng, G.; Dai, Y.; Bi, D.; Sun, J.; Xie, X. Design of a Fractional Order Frequency PID Controller for an Islanded Microgrid: A Multi-Objective Extremal Optimization Method. Energies 2017, 10, 1502. [Google Scholar] [CrossRef]
  22. Fayek, H.H. Load Frequency Control of a Power System with 100% Renewables. In Proceedings of the 2019 54th International Universities Power Engineering Conference (UPEC), Bucharest, Romania, 3–6 September 2019; pp. 1–6. [Google Scholar] [CrossRef]
  23. Yildirim, B.; Gheisarnejad, M.; Khooban, M.H. A New Parameter Tuning Technique for Noninteger Controllers in Low-Inertia Modern Power Grids. IEEE J. Emerg. Sel. Top. Ind. Electron. 2022, 3, 279–288. [Google Scholar] [CrossRef]
  24. Koley, I.; Datta, A.; Panda, G.K.; Debbarma, S. TLBO Optimised PIDD Controller for Coordinated Control in a Hybrid AC/DC Microgrid. In Proceedings of the 2022 4th International Conference on Energy, Power and Environment (ICEPE), Shillong, India, 29 April–1 May 2022; pp. 1–6. [Google Scholar] [CrossRef]
  25. Lal, D.K.; Barisal, A.K.; Tripathy, M. Load Frequency Control of Multi Area Interconnected Microgrid Power System using Grasshopper Optimization Algorithm Optimized Fuzzy PID Controller. In Proceedings of the 2018 Recent Advances on Engineering, Technology and Computational Sciences (RAETCS), Allahabad, India, 6–8 February 2018; pp. 1–6. [Google Scholar] [CrossRef]
  26. Askarzadeh, A. A Memory-Based Genetic Algorithm for Optimization of Power Generation in a Microgrid. IEEE Trans. Sustain. Energy 2018, 9, 1081–1089. [Google Scholar] [CrossRef]
  27. Sharma, P.; Prakash, A.; Shankar, R.; Parida, S.K. A Novel Hybrid Salp Swarm Differential Evolution Algorithm Based 2DOF Tilted-Integral-Derivative Controller for Restructured AGC. Electr. Power Compon. Syst. 2019, 47, 1775–1790. [Google Scholar] [CrossRef]
  28. Chung, I.Y.; Liu, W.; Cartes, D.A.; Schoder, K. Control parameter optimization for a microgrid system using particle swarm optimization. In Proceedings of the 2008 IEEE International Conference on Sustainable Energy Technologies, Singapore, 24–27 November 2008; pp. 837–842. [Google Scholar] [CrossRef]
  29. Malik, S.; Suhag, S. A coordinated control strategy for frequency regulation in hybrid shipboard power system using novel salp swarm algorithm tuned fractional controller. Int. J. Ambient Energy 2022, 43, 5638–5653. [Google Scholar] [CrossRef]
  30. Choudhary, A.K.; Prakash, S.; Sharma, M.; Dhundhara, S. Grasshopper optimisation based robust power/frequency regulator for shipboard micro-grid. IET Renew. Power Gener. 2020, 14, 3568–3577. [Google Scholar] [CrossRef]
  31. Mondal, A.; Latif, A.; Das, D.C.; Hussain, S.M.S.; Al-Durra, A. Frequency regulation of hybrid shipboard microgrid system using butterfly optimization algorithm synthesis fractional-order controller. Int. J. Numer. Modell. Electron. Netw. Devices Fields 2022, e3058. [Google Scholar] [CrossRef]
  32. Chou, J.S.; Molla, A. Recent advances in use of bio-inspired jellyfish search algorithm for solving optimization problems. Sci. Rep. 2022, 12, 19157. [Google Scholar] [CrossRef]
  33. Shubham; Roy, S.P.; Mehta, R.K.; Singh, A.K.; Roy, O.P. A novel application of jellyfish search optimisation tuned dual-stage (1 + PI)TID controller for microgrid employing electric vehicle. Int. J. Ambient Energy 2022, 43, 8408–8427. [Google Scholar] [CrossRef]
  34. Fathy, A.; Kassem, A.M. Antlion optimizer-ANFIS load frequency control for multi-interconnected plants comprising photovoltaic and wind turbine. ISA Trans. 2019, 87, 282–296. [Google Scholar] [CrossRef]
  35. Srinivasarathnam, C.; Yammani, C.; Maheswarapu, S. Load Frequency Control of Multi-microgrid System considering Renewable Energy Sources Using Grey Wolf Optimization. Smart Sci. 2019, 7, 198–217. [Google Scholar] [CrossRef]
  36. Guha, D.; Roy, P.K.; Banerjee, S. Grasshopper optimization algorithm scaled fractional order PI-D controller applied to reduced order model of load frequency control system. Int. J. Modell. Simul. 2020, 40, 217–242. [Google Scholar] [CrossRef]
  37. Karnavas, Y.L.; Nivolianiti, E. Load Frequency Control in Multi-Source Power Generation Systems using Harris Hawks Optimization Algorithm. In Proceedings of the 2022 International Conference on Communications, Information, Electronic and Energy Systems (CIEES), Veliko Tarnovo, Bulgaria, 24–26 November 2022; pp. 1–6. [Google Scholar] [CrossRef]
  38. Guha, D.; Roy, P.K.; Banerjee, S. Whale optimization algorithm applied to load frequency control of a mixed power system considering non-linearities and PLL dynamics. Energy Syst. 2020, 11, 699–728. [Google Scholar] [CrossRef]
  39. Yildirim, B.; Gheisarnejad, M.; Khooban, M.H. A Robust Non-Integer Controller Design for Load Frequency Control in Modern Marine Power Grids. IEEE Trans. Emerg. Top. Comput. Intell. 2022, 6, 852–866. [Google Scholar] [CrossRef]
  40. Esfahani, Z.; Roohi, M.; Gheisarnejad, M.; Dragičević, T.; Khooban, M.H. Optimal Non-Integer Sliding Mode Control for Frequency Regulation in Stand-Alone Modern Power Grids. Appl. Sci. 2019, 9, 3411. [Google Scholar] [CrossRef]
  41. Bhuyan, S.; Hota, P.; Panda, B. Power Quality Analysis of a Grid-connected Solar/Wind/Hydrogen Energy Hybrid Generation System. Int. J. Power Electron. Drive Syst. 2018, 9, 377–389. [Google Scholar] [CrossRef]
  42. Methekar, R.; Prasad, V.; Gudi, R. Dynamic analysis and linear control strategies for proton exchange membrane fuel cell using a distributed parameter model. J. Power Sour. 2007, 165, 152–170. [Google Scholar] [CrossRef]
  43. Obara, S. Analysis of a fuel cell micro-grid with a small-scale wind turbine generator. Int. J. Hydrogen Energy 2007, 32, 323–336. [Google Scholar] [CrossRef]
  44. Nolte, J.D.; Ertekin, R.C. Wave power calculations for a wave energy conversion device connected to a drogue. J. Renew. Sustain. Energy 2014, 6, 013117. [Google Scholar] [CrossRef]
  45. Hasanien, H.M. Whale optimisation algorithm for automatic generation control of interconnected modern power systems including renewable energy sources. IET Gener. Transm. Distrib. 2018, 12, 607–614. [Google Scholar] [CrossRef]
  46. Lee, D.J.; Wang, L. Small-Signal Stability Analysis of an Autonomous Hybrid Renewable Energy Power Generation/Energy Storage System Part I: Time-Domain Simulations. IEEE Trans. Energy Convers. 2008, 23, 311–320. [Google Scholar] [CrossRef]
  47. Sahu, R.K.; Chandra Sekhar, G.; Panda, S. DE optimized fuzzy PID controller with derivative filter for LFC of multi source power system in deregulated environment. Ain Shams Eng. J. 2015, 6, 511–530. [Google Scholar] [CrossRef]
  48. Sharma, M.; Bansal, R.K.; Prakash, S.; Dhundhara, S. Frequency Regulation in PV integrated Power System using MFO tuned PIDF controller. In Proceedings of the 2018 IEEE 8th Power India International Conference (PIICON), Kurukshetra, India, 10–12 December 2018; pp. 1–6. [Google Scholar] [CrossRef]
  49. Zhao, C.; Jiang, M.; Huang, Y. Formal Verification of Fractional-Order PID Control Systems Using Higher-Order Logic. Fractal Fract. 2022, 6, 485. [Google Scholar] [CrossRef]
  50. Soni, V.; Parmar, G.; Kumar, M.; Panda, S. Hybrid Grey Wolf Optimization-Pattern Search (hGWO-PS) Optimized 2DOF-PID Controllers for Load Frequency Control (LFC) in Interconnected Thermal Power Plants. Int. J. Soft Comput. 2016, 6, 1244–1256. [Google Scholar] [CrossRef]
  51. Sahu, R.K.; Panda, S.; Rout, U.K.; Sahoo, D.K. Teaching learning based optimization algorithm for automatic generation control of power system using 2-DOF PID controller. Int. J. Electr. Power Energy Syst. 2016, 77, 287–301. [Google Scholar] [CrossRef]
  52. Chou, J.S.; Truong, D.N. A novel metaheuristic optimizer inspired by behavior of jellyfish in ocean. Appl. Math. Comput. 2021, 389, 125535. [Google Scholar] [CrossRef]
  53. Alam, A.; Verma, P.; Tariq, M.; Sarwar, A.; Alamri, B.; Zahra, N.; Urooj, S. Jellyfish Search Optimization Algorithm for MPP Tracking of PV System. Sustainability 2021, 13, 11736. [Google Scholar] [CrossRef]
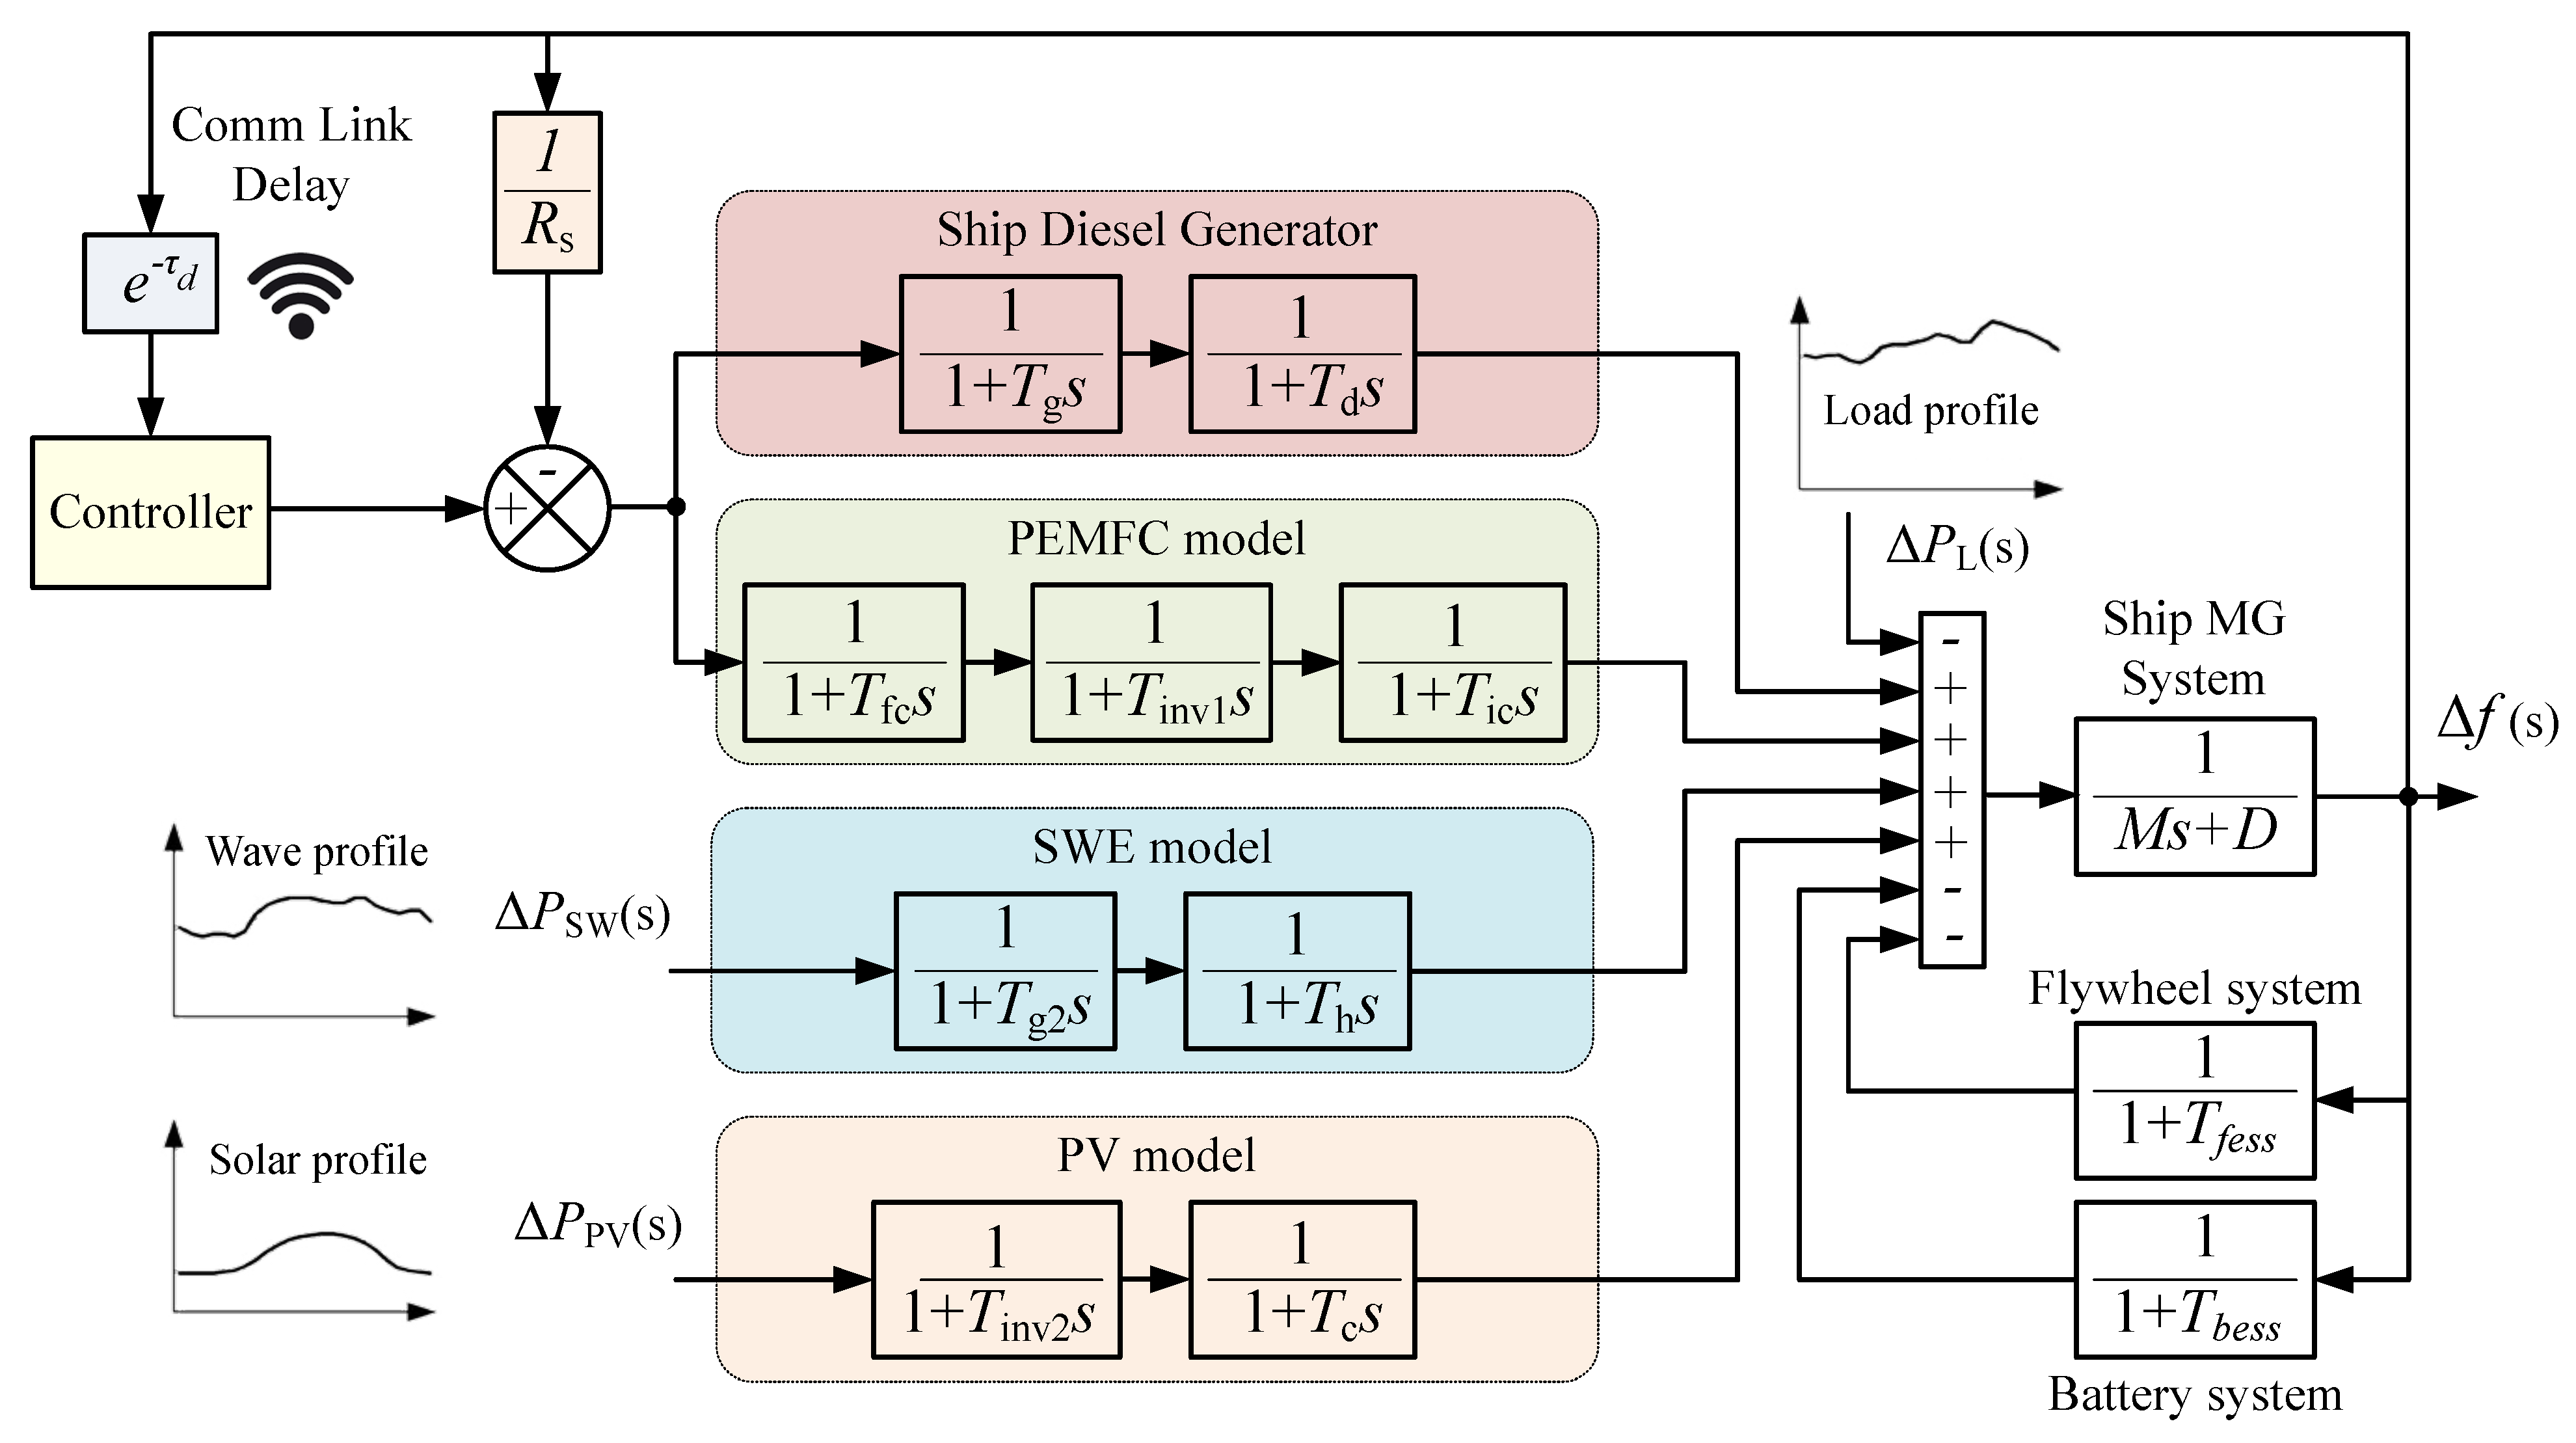
Figure 1. Block diagram of the multi-energy ship microgrid under study.
Applsci 13 06128 g001
Figure 2. Electrical equivalent circuit of a PV cell [45].
Applsci 13 06128 g002
Figure 3. Structure of the examined controllers: (a) PIDF, (b) FOPID, (c) 2DOF-PID.
Applsci 13 06128 g003
Figure 4. Jellyfish distribution in the ocean.
Applsci 13 06128 g004
Figure 5. Direction of movement in a swarm.
Applsci 13 06128 g005
Figure 6. Flowchart of the jellyfish search algorithm.
Applsci 13 06128 g006
Figure 7. Optimization procedure results: (a) frequency variation with PIDF controller optimized with 6 algorithms (left) and corresponding convergence curves (right), (b) frequency variation with FOPID controller optimized with 6 algorithms (left) and corresponding convergence curves (right), (c) frequency variation with 2DOF-PIDF controller optimized with 6 algorithms (left) and corresponding convergence curves (right).
Applsci 13 06128 g007
Figure 8. Frequency response through best PIDF/FOPID/2DOF-PIDF controllers found (all with the JSO).
Applsci 13 06128 g008
Figure 9. Combination of energy profiles considered, for a 15 min period (top to bottom): ship energy demand (load variation), sea wave energy provided, and photovoltaic source energy provided.
Applsci 13 06128 g009
Figure 10. Frequency response of 2DOF-PIDF controllers according to the profiles of Case 1.
Applsci 13 06128 g010
Figure 11. Real data for energy profiles considered, for a 15 min period (top to bottom): ship energy demand (load variation), sea wave energy provided, and photovoltaic source energy provided.
Applsci 13 06128 g011
Figure 12. Frequency response of 2DOF-PIDF controllers according to the profiles of Case 2 (as in Figure 11).
Applsci 13 06128 g012
Figure 13. Frequency response of the JSO-tuned 2DOF-PIDF controller, under R, D, H parameters’ variation.
Applsci 13 06128 g013
Figure 14. Frequency response of the JSO-tuned 2DOF-PIDF controller, under T f e s s , T b e s s , τ d parameters’ variation.
Applsci 13 06128 g014
Table 1. Range of controllers’ parameters (search space).
ParameterLower LimitUpper LimitParameterLower LimitUpper Limit
K p −3.03.0 λ 0.02.0
K i −3.03.0 μ 0.02.0
K d −3.03.0b0.05.0
N0.05.0c0.05.0
Table 2. Overall comparative designed controller metrics: objective function value (ITAE), corresponding parameter settings, and dynamic performance characteristics (with respect to Figure 7a–c).
ControllerAlgorithmITAE K p K i K d N   U sh
(mHz)
O sh
(mHz)
T s
(s)
 ALO0.2867−0.84000.1743−1.87000.0010  −59.7616.632314.5059
 GOA0.2146−1.27210.20201.10190.5233  −59.7613.807712.3677
PIDFGWO0.2867−0.83720.1741−0.06770.0390  −59.7616.851214.5088
 HHO0.2228−1.21410.19810.92531.0212  −59.7612.428313.8521
 JSO0.1683−1.52360.21162.61510.4902  −59.7610.000012.4524
 WOA0.2081−1.09970.18491.87590.5992  −59.7610.000013.1046
ControllerAlgorithmITAE K p K i K d λ μ   U sh
(mHz)
O sh
(mHz)
T s
(s)
 ALO0.2095−1.62440.15640.82131.08420.1311 −60.1713.112512.1313
 GOA0.1818−0.67850.04370.19981.56840.6036 −60.1710.000017.3533
FOPIDGWO0.2157−0.75830.02800.09801.77950.0645 −60.1711.503718.1233
 HHO0.2418−0.91790.02950.54861.69040.0001 −60.1710.000018.2348
 JSO0.1479−2.12090.08171.66331.34570.1281 −60.1710.000014.3062
 WOA0.2156−3.00000.05402.62081.41690.0001 −60.1710.000016.1266
ControllerAlgorithmITAE K p K i K d N b c U sh
(mHz)
O sh
(mHz)
T s
(s)
 ALO0.3194−0.00040.3316−0.01730.25352.13550.6743−50.3610.000015.0948
 GOA0.25090.02500.93570.06941.43051.02241.0163−40.87522.85415.6126
2DOF-PIDFGWO0.04760.31580.65250.07460.26510.99771.0763−51.0740.00007.6739
 HHO0.27480.00020.58620.16830.52330.60581.0170−45.47710.85314.5107
 JSO0.02080.39200.8355−0.22960.00740.99780.0067−49.8630.00003.1547
 WOA0.23700.01511.00740.00053.56491.05432.8871−32.12238.17515.2957
Disclaimer/Publisher’s Note: The statements, opinions and data contained in all publications are solely those of the individual author(s) and contributor(s) and not of MDPI and/or the editor(s). MDPI and/or the editor(s) disclaim responsibility for any injury to people or property resulting from any ideas, methods, instructions or products referred to in the content.