Article

Vacuum Cleaner Noise Annoyance: An Investigation of Psychoacoustic Parameters, Effect of Test Methodology, and Interaction Effect between Loudness and Sharpness

by
Serkan Atamer
* and
Mehmet Ercan Altinsoy
Chair of Acoustics and Haptics, Faculty of Electrical and Computer Engineering, TU Dresden, 01069 Dresden, Germany
*
Author to whom correspondence should be addressed.
Appl. Sci. 2023, 13(10), 6136; https://doi.org/10.3390/app13106136
Submission received: 18 April 2023 / Revised: 11 May 2023 / Accepted: 14 May 2023 / Published: 17 May 2023
(This article belongs to the Special Issue New Advances in Audio Signal Processing)

Abstract

:
The first aim of this paper was to determine the variability in the signal characteristics and psychoacoustic data of canister-type vacuum cleaners. Fifteen vacuum cleaners with different sound power levels, provided by the manufacturers, were selected as test units to calculate their acoustic and psychoacoustic parameters. The selection of the devices was based on an even distribution of the reported sound power levels. The investigated variability in the acoustic and psychoacoustic parameters on different vacuum cleaners was discussed to derive the common characteristics of canister-type vacuum cleaner noise. The derived common characteristics were compared with the those in the available literature on the noise generation mechanisms of vacuum cleaners. Based on these characteristics, prototypical vacuum cleaner noise was defined. The second aim of this paper was to understand the annoyance perception of vacuum cleaner noise. Annoyance assessments were obtained from two sets of listening experiments. The first listening experiment was conducted to find the correlates of annoyance evaluations. Loudness, sharpness and tonal components at lower and higher frequencies were found to be dominant correlates of vacuum cleaner noise annoyance estimations. In the second listening experiment, a possible interaction between loudness and sharpness was investigated in different listening test methods. The selected loudness and sharpness values for this experiment were consistent with the observed ranges in the first part. No significant interaction between loudness and sharpness was observed, although each separately correlated significantly positively with annoyance.

1. Introduction

Among other appliances, vacuum cleaner noise is one of the most annoying household appliance noises in our living environments. For users, vacuum cleaner noise creates an unpleasant feeling, causes fatigue and even causes anger after long usage. For passive listeners, vacuum cleaner noise makes it almost impossible to concentrate on a task or to continue verbal communication. Vacuum cleaner noise in indoor spaces can reach up to 70–80 dB(A), which makes normal speech almost inaudible. Research on vacuum cleaner noise can be divided into two main categories. The first group of studies focuses on the noise generation mechanisms of a vacuum cleaner and possible design changes for noise reduction. In contrast, the second group of studies focuses on the noise annoyance evaluation of vacuum cleaners, trying to understand the dominant correlates and developing sound quality models. At this point, these two group of studies need to be combined: it is important to understand how specific noise components affect annoyance in order to effectively reduce the total annoyance perception.
In their recent publication, Yoshido and Hatta [1] investigated the level of discomfort created by vacuum cleaner noise for active and passive listening conditions. Under active listening conditions, participants used the vacuum cleaners themselves, whereas under passive listening conditions, participants listened to recorded noise from the same vacuum cleaners. The main point of this study was to understand the difference between robot vacuum cleaners and conventional vacuum cleaners. Under the passive listening conditions, no distracting task was given to the participants. The results showed that the levels of uncomfortableness were significantly higher under the passive listening conditions. Kumar et al. [2] focused on experimental assessments of annoyance with noise from three vacuum cleaners and the correlations between psychoacoustic parameters and annoyance evaluations. Annoyance index values for the three vacuum cleaners were calculated based on the model suggested by Altinsoy et al. [3]. They pointed out that loudness has a critical significant effect on vacuum cleaner annoyance. Altinsoy [4] investigated the main signal characteristics of vacuum cleaners, and no difference was observed between annoyance ratings from single microphone recordings and artificial head recordings. Additionally, it was found that loudness, sharpness, roughness, tonality and articulation index values can be used to model the annoyance ratings of participants. In particular, a free interview conducted with participants at the end of the listening experiments showed that most of the subjects claimed vacuum cleaner noise to be highly annoying when it disturbed communication. From this information, the articulation index values were also included in the developed model of vacuum cleaner noise annoyance.
Martin et al. [5] compared the operating noise of two vacuum cleaners (with and without silent technology) in different usage scenarios (different floor coverings and different powers) with regard to the overall user experience (UX). They found that the subjective ratings depended on both the usage scenario and the vacuum cleaner model. The vacuum cleaner without noise reduction was rated significantly worse by users than the vacuum cleaner with noise reduction in UX. Furthermore, the rating of annoyance at low power consumption was different for different floor coverings.
Companies may be reluctant to invest in better sound quality since it is difficult to quantify the profit return from a better sounding device. Takada et al. [6] investigated this issue by measuring the participants’ willingness to purchase a product based on its noise. They suggested that an improvement in sound quality, especially in conditions where participants were able to listen to the product noise, increased the commercial value of the better-sounding device and increased the participants’ willingness to buy the product. In another study by Takada [7], a similar approach was also applied to vehicle-door-closing sounds. In addition, two experiments on customer product selection based on acoustic performance were conducted in the same publication, relating to vacuum cleaners and hair dryers. All these experiments show that a design addressing product sound sufficiently increases the willingness to buy that product.
In another study, Ih et al. [8] focused on the annoyance estimations of vacuum cleaners and derived a prediction model for annoyance. One example of vacuum cleaner noise was recorded, and some frequency ranges were classified in terms of their importance. By increasing and decreasing the levels of these defined frequencies and using the orthogonal array technique, they designed listening tests with the aim of developing an annoyance index for vacuum cleaners. In addition to annoyance, the effects of defined frequency bands on the “performance”, “loudness” and “sharpness” of the vacuum cleaners were also investigated in the listening tests. The study concluded with an artificial neural network model that was developed for the prediction of vacuum cleaner annoyance. Lyon [9] also used vacuum cleaners as an example in his work to explain the main stages of product sound quality analyses. Different components of vacuum cleaner noise were modified, and a listening test was created using a central composite design, so that a smaller number of stimuli could be used, rather than a full factorial design. The sounds of vacuum cleaner components (motor sound, suction fan noise, airflow noise and rotating brush noise) were changed, and it was found that the acceptability function of vacuum cleaner noise was dependent mainly on the airflow noise and motor noise components. It was explained that an equal reduction of 5 dB in both noise sources was required to obtain an optimally acceptable design.
In their study, Rukat et al. [10] presented a comparison of the acoustic parameters of a vacuum cleaner on different surfaces. They performed various measurements of vacuum cleaners in different arrangements, taking into account that vacuum cleaners can be classified as devices with extensive sound sources. They found that the noise emitted by vacuum cleaners depends on the type of surface used and the arrangements of the device (canister and suction nozzle). They also concluded that it is sufficient to parameterize the acoustic performance of the device with single values, where it would be more feasible for the well-being of the end user to report the most unfavorable working conditions.
In addition to perceptual studies, other studies have focused on understanding the noise generation mechanisms of vacuum cleaners. A detailed acoustic characterization of a wet-type vacuum cleaner was conducted in the publication by Buratti et al. [11]. They explained that the total emitted noise is the sum of several contributions, such as aerodynamic noise, and mechanical and electromagnetic components. The mechanical and electromagnetic components generate rotational discrete tonal noise and the aerodynamic noise generates broadband noise.
In a series of three publications [12,13,14], Cudina and Prezelj explained the noise generation mechanisms of a vacuum cleaner in detail. These highly detailed publications showed the complexity of the generated noise and its components. The first publication provided an overview of the noise components that can be found in vacuum cleaner noise and how the mechanical and electromagnetic portions create tonal and broadband noise characteristics. Moreover, the consideration of the performance and noise characteristics at the same time offered insight into the inconsistency between the desired suction power and the noise level. The second publication of this series focused on the aerodynamic portion of the noise and the effect of blower geometry on different flow rates. A conclusion was made that vaned diffusers have more disadvantages than advantages and need to be omitted to reduce noise. The third and final publication of these series explained structure-borne noise. The researchers also suggested possible improvements for manufacturers to decrease structure-borne noise in vacuum cleaners.
Novakovic et al. [15] designed a new centrifugal impeller to improve the noise quality of vacuum cleaners. The aim was to increase the perceived noise quality and not only to reduce the overall noise level. The optimization process was based on two different general noise exposure models. They finalized their propeller design with triangular flow channels. In listening tests, they found that it was possible to make a user-oriented design change based on the psychoacoustic findings.
Brungart and Lauchle [16] performed sound power level measurements on a handheld vacuum cleaner to identify the main components of the noise. After analyzing the noise, they implemented modifications on the fan casing and the blade distribution, which changed the blade pass frequency. They evaluated the modifications in terms of their preference in jury testing, especially considering the magnitude of the tonal components in the overall noise. Brungart et al. [17] investigated the effect of modifications on fans and motors on an upright vacuum cleaner in another publication. They found that prominent tonal noise is created by an interaction between the electric motor cooling fan and the surrounding gussets and posts. They removed these elements in an alternating fashion such that the first blade passing frequency of the electric motor cooling fan was eliminated.
Teoh et al. [18] made modifications to a canister vacuum cleaner to reduce its noise. They pointed out that the noise of a canister vacuum cleaner consists of the blade passing noise generated by motor and the aerodynamically induced airborne noise. Two different noise reduction methods were used: the introduction of sound insulation panels made of porous expanded polypropylene and honeycomb noise filters. After these modifications, the total noise level was reduced by 7.4 dB(A), with a reduction in suction power of only 0.93%.
This study focuses on understanding the general sound characteristics of vacuum cleaners and their annoyance perception. There are many different brands and types of vacuum cleaners with different designs in the market. The differences in design result in differences in noise characteristics: some of the devices are loud, whereas some of them have higher sharpness values. Some of the devices have distinct tonal components, whereas some of the designs are free from tonality. Then, the main question is what kind of canister-type vacuum cleaners should be selected and recorded to investigate, as much as possible, the variability in noise that can be observed, so that the variability in the market can be properly represented? What is the generic vacuum cleaner noise, and how much variability can there be between different models? The goal is to select proper samples from the market such that these selected samples can represent the variability in noise.
To reach this goal, canister-type vacuum cleaners are selected such that the selected samples can represent the variability in noise. The main aim in this study is to select devices such that the selected samples can represent the variability in noise from canister vacuum cleaners.
First, the basic characteristics of vacuum cleaner noise are provided for the selected examples. Then, the ranges of calculated psychoacoustic parameters for selected vacuum cleaners are presented. Variability in the acoustic and psychoacoustic parameters on different vacuum cleaners is discussed to derive common characteristics of canister-type vacuum cleaner noise. This variability is then related to the available information on the noise generation mechanisms of vacuum cleaners in the literature. This observed variability in noise samples in the market is used to set up listening experiments and their ranges.
Afterward, two sets of listening tests are conducted in this study. The first listening test is an explanatory test to understand the main correlates of vacuum cleaner annoyance. Based on the results obtained from this test, a second set of listening tests is conducted to investigate the possible interaction effect on loudness and sharpness using a factorial design in different testing methodologies.

2. Stimuli—Signal Characteristics of Vacuum Cleaners

2.1. Selection of Vacuum Cleaners

To obtain an overview of vacuum cleaner noise, 15 vacuum cleaners were selected from the market and recorded under anechoic conditions. The selection of the vacuum cleaners was performed using the online portals of the two largest consumer electronics retail companies in Germany. Robot vacuum cleaners, upright vacuum cleaners, handheld vacuum cleaners and wet-type vacuum cleaners were not taken into account, and only canister-type vacuum cleaners were selected for this study. For canister-type vacuum cleaners, there were 155 vacuum cleaners available on both websites at the time this study was written [19,20].
For the selection of these vacuum cleaners, the maximum electrical power and sound power levels according to the manufacturers were taken into account. From the available models, the sound power levels ranged from 57 to 82 dB(A). The median value of declared sound power levels was 73.4 dB(A), where the upper and lower quartiles were 78 and 69 dB(A), respectively. The maximum electrical power of the canister-type vacuum cleaners ranged between 130 and 1700 Watts. The median value of the power was 700 Watt, and the upper and lower quartiles were 1000 and 400 Watts, respectively. The 130-Watt, 1400-Watt and 1700-Watt models were outliers. For a comparison with the given range of parameters, the parameter range of the selected 15 devices are listed in Table 1. The sound power levels of the 15 selected devices are also given in Table 2. The sound power levels of the selected devices show a good distribution over the defined market range, and no concentration on a particular sound power level was observed.
The sound power levels according to the manufacturers are provided for the highest working mode of the vacuum cleaners, as stated in [21]. The annoyance evaluations within this study were also conducted using the maximum power mode of the selected devices. However, it might be important to note that lower suction power modes, although quieter, might emit different tonal components depending on the rotational speed of the motor, which might change the annoyance evaluations. This effect was not taken into account in this study and might be a topic of further investigation. Especially for lower broadband levels, the effect of the tonal components on annoyance might be more dominant.

2.2. Recordings

The selected vacuum cleaners were recorded in a fully anechoic environment. There are two main working conditions of a vacuum cleaner: the first one is on hard flooring and the second one is on carpet. Since carpet might affect noise emission, both conditions were taken into account in this study. Vacuum cleaners were positioned directly on a reflective, heavy surface or on a carpet placed on top of this surface. Single microphone recordings were obtained by placing the microphone directly in front of the vacuum cleaner at a distance of 0.75 m and a height of 1.5 m. For the recordings, the vacuum cleaners were positioned on top of the reflective plane, as stated in the standard, for determination of the airborne acoustical noise of vacuum cleaners [21] (Figure 1).

2.3. Signal Characteristics

Vacuum cleaner sounds are usually characterized by band noise with tonal components [12]. Figure 2 and Figure 3 show the FFTs and spectrograms of all recorded vacuum cleaners on hard flooring, respectively. Figure 2 was plotted with 1/24 octave smoothing so that the differences between different vacuum cleaner recordings are easier to observe. For hard flooring, considering the threshold of hearing, the overall frequency range of vacuum cleaner noise is from 70 Hz up to 10 kHz. In most cases, there is a tonal component at 100 Hz, with different intensities for different brands and types. Usually, at approximately 500 Hz and 5000 Hz, vacuum cleaner noise reaches its maximum A-weighted level. On top of the 100 Hz tone, there are usually other tonal components observed with respect to vacuum cleaner sounds. At approximately 500–750 Hz, a single tone component exists for some vacuum cleaners, and some other tonal components are present in the 3000–5000 Hz range. Additionally, for some models, it is possible to observe tones at approximately 10 kHz. Finally, the variation in the levels between 500 Hz and 10 kHz can be up to 15 dB.
Vacuum cleaner sound is stationary. It can be seen in Figure 3 that all of the example vacuum cleaner sounds show no significant fluctuation over time. Tonal components (for example, approximately 500 Hz for the ninth vacuum cleaner) stay constant as the device keeps running.
The range of acoustic parameters for the 15 selected vacuum cleaner sounds for the hard flooring and carpet cases are given in Table 3. The loudness values were calculated according to the ISO 532-1 standard [22]. The DIN 45631 [23] and ISO 532-2 [24] standards were omitted in this paper since, for broadband noises such as vacuum cleaners, the three standards delivered similar values. The sharpness values were calculated according to the publications of Aures and Bismarck, as well as the German Standard DIN 45692 [25,26,27]. It is important to note that the results from these different models differ in one important aspect: the Bismarck and DIN 45692 models do not take into account the influence of intensity of the signal on sharpness perception; hence, these models are usually used for sounds with similar loudness values. The Aures model, on the other hand, takes into account the influence of loudness of the signal on sharpness perception. However, one of the focuses of this paper is to investigate the possible interaction between loudness and sharpness. Hence, these three different sharpness models were taken into account since they have different methods of including the effect of loudness on sharpness perception. Eventually, three different sharpness values were calculated: the first one is Aures sharpness, with the loudness values calculated according to ISO 532-1; the second one is the Bismarck sharpness, with the loudness values calculated according to ISO 532-1; and the last one is DIN 45692 sharpness, with the loudness values calculated according to DIN 45631. Finally, single value tonality values were calculated based on the publications of Aures and Terhard [25,28] and on the hearing model of Sottek [29]. Both models have a psychoacoustic basis, but there are also clear differences. The Aures model starts from Zwicker loudness and extracts the tonal components from a FFT spectrum. The degree of tonality is calculated based on the ratio of tonal to non-tonal loudness as a function of time. Spectral information is not included in this model [30]. On the other hand, the Sottek model includes a hearing model approach in which the signal is first filtered through the outer and middle ear filtering and the partial loudness of tonal to non-tonal content in critical bands is calculated to determine the tonal loudness. In addition, recent studies have found [31,32,33,34,35,36,37,38] that the perception of tonal content is frequency-dependent, so the final decision on the strength of the tonal content takes into account the frequency of the tone. Additionally, the distribution of the aforementioned psychoacoustical parameters over 15 vacuum cleaners can be found in Figure 4, Figure 5 and Figure 6. From the calculated values, it can be observed that the variations over loudness and sharpness show a fine distribution over the defined range. The tonality values also show a degree of distribution for tuHMS values between 0 and 1.3, with one outlier with strong tonality.
The frequency content of the emitted noise strongly depends on the positioning of the vacuum cleaner (hard flooring or carpet). Since it absorbs some of the emitted energy in the mid- to high-frequency range, the carpet condition changes the noise. To illustrate this effect, Figure 7 shows the spectra of all recorded vacuum cleaners with and without a carpet. The left panel shows the spectra for the recordings without a carpet, and the right panel shows those with a carpet. The figure colors were intentionally kept in greyscale so that the differences between the hard flooring and carpet cases could be easily compared. In this figure, it can be seen that the levels can be lowered by up to 10 dB in the regions above 500 Hz. This shows that the variation in the recordings and stimuli pool can be even broader if the carpet case and the hard flooring case are used simultaneously for listening experiments.
Considering the aforementioned observations, typical vacuum cleaner noise can be described and visualized as in Figure 8. The A-weighted level increases up to 500 Hz; then, a slight decrease is observed up to the 5 kHz range. From the 5 kHz range, a steep decrease in the overall A-weighted level can be observed. There are different ranges of these broadband noise characteristics for different vacuum cleaners, as shown by the dotted lines in Figure 8. In addition to these frequencies, a 100 Hz tone is observed for almost all vacuum cleaners. The intensity of this tonal component also varies between different models. Finally, above 500 Hz, tonal components can be observed in various vacuum cleaners, and their frequency, number and intensity change between different brands/models.
Furthermore, in addition to the single value tonality calculations based on the Aures model, tonal components were calculated based on DIN 45681 [39] and the hearing model of Sottek [29]. The calculated tones where the penalty values are equal to or greater than 2 dB, for both the hard flooring and carpet cases, are given in Figure 9 and Figure 10. It can be seen that the penalty values calculated for 100 Hz tones are higher for DIN 45681; however, since the hearing model tonality includes the frequency-dependent perceptual characteristics of tonal components, the calculated tonality values for higher frequencies dominate in Figure 10. For both figures, tonal content was divided into three main regions shown in different colors: blue color represent the tonality around 100 Hz (Tonality LOW), orange color represent the tonality around 200–800 (Tonality MID) and lastly, yellow color represent the tonality around 1000–10,000 Hz (Tonality HIGH).

3. Listening Test 1

The first listening test was conducted to understand the main correlates of annoyance due to vacuum cleaner noise. Participants were asked to rate their perceived annoyance on a rating scale with verbal anchors in the form of a slider. Twenty-one people participated in the listening test, which was conducted in a soundproof audiometric booth. The listening test was performed with both original and synthesized recordings. These additional vacuum cleaner samples were created to increase the variation in the data. The correlation between psychoacoustical parameters and the annoyance estimations was calculated at the end of the listening test.

3.1. Stimuli, Subjects and Test Method

For the first listening test, in addition to the original recordings, new synthesized recordings were obtained by parameterizing the main signal characteristics to increase the variability in the data. Finally, 92 stationary 5 s stimuli were obtained from 15 different vacuum cleaners. The following methods were used to modify the original signals and to obtain new stimuli for the listening tests:
-
Original stimulus (hard flooring and carpet conditions);
-
Recording of only the housing of the vacuum cleaners (without brushes or the suction hose);
-
Increasing/decreasing the overall level;
-
Filtering out the dominant tonal components (depending on the frequency of the existing tonal component);
-
Low-pass filtering at 2 kHz and 4 kHz to increase the variability in the bass–treble ratio.
These new stimuli were created to increase the possible variation and coverage. Although the vacuum cleaner selection was carried out with justification (using maximum electrical power and sound power levels as descriptors), it is still a sample and might not fully represent every vacuum cleaner in the market. With these additional stimuli, we aimed to cover any other vacuum cleaner in the market not directly included in the first selection and any possible future developments that might be introduced in vacuum cleaner design with technological developments.
An example signal manipulation is shown in Figure 11: The original signal was found to have tonal components at 200 Hz, 300 Hz and 500 Hz. In the second step, the 200 and 300 Hz components were taken out, and in another step, the 500 Hz component was taken out. Afterwards, the overall signal levels were changed by +6 dB, −6 dB and −12 dB. Other signals were also manipulated in this way to obtain more variation in the data. The calculated acoustical and psychoacoustical parameters and the standard deviations after the signal manipulations are shown in Table 4.
Twenty-one subjects participated in the test, which was conducted in a soundproof audiometric booth. Eight participants were female, and thirteen participants were male. The age of the participants ranged from 23 to 63 years, with a mean of 37.7 and a standard deviation of 12.7. None of the participants reported having a known hearing problem, rather than age-related hearing loss. The overall variability in the loudness, sharpness and tonality values were assessed before the test, and 20 stimuli were selected for training. The training stimuli were selected to contain a representative range of sound levels and loudness, sharpness and tonality values. All subjects voluntarily participated in the experiment. At the beginning of the test, participants were informed about the contents of the test (vacuum cleaner noise assessments) and the test procedure. The training session and the test session were described. Participants were told that they had to familiarize themselves with the training session information for the real test. The graphical user interface was explained to the participants together in the experiment room. The first signal playback was conducted together with the participant to ensure that the sound reproduction system was working properly and that the participants were comfortable with the signals and the headphones. For the listening experiment, a slider scale was used, where the participants were asked to evaluate the annoyance of the sounds (“How do you evaluate the annoyance?”) on a quasi-continuous scale (from 0 to 100 with a step size of 1) with equidistant neighboring categories (not at all, slightly, moderately, very or extremely) (Figure 12). Stimuli were played in a randomized order for each participant.

3.2. Results

The distributions of the mean annoyance evaluations showed that the participants used most of the available surface range for the evaluations. For the first listening test, the minimum and maximum of the mean annoyance evaluations were 5.6 and 96.7, respectively, and the mean average annoyance estimations and the median average annoyance estimations were 49.3 and 52.1, respectively. The quartiles of this distribution were 69.2 and 37.8.
The correlations between the calculated parameters and annoyance estimations can be found in Table 5. The sample size in these calculations was large, with 92 stimuli. Since the significance test for the correlation also depends on the sample size, it was possible to obtain significant or highly significant correlation values, even though the calculated correlation coefficient was only 0.25. At this point, it is important to focus on the interpretation of strong or weak correlations in correlation coefficients. Weak but significant correlations are not meaningful from a psychoacoustic point of view, as this effect is rather small but could be demonstrated due to the large sample.
The first explanatory investigations show that overall levels (dB(A) values, as well as loudness) play a crucial role in annoyance estimations (correlation 0.966 for dB(A) and 0.963 for loudness), which is consistent with many other publications on sound quality, as well as the cited publications for vacuum cleaners. The effect of sharpness was also found to be large with high significance. It is important to note that the correlations change significantly depending on the applied sharpness calculation method. Sharpness calculations based on the method of Aures show higher correlations (0.763 with ISO 532-1 loudness calculations) than the model of Bismarck (0.261 with ISO 532-1 loudness calculations) and DIN 45692 (0.261 with DIN 45631 loudness calculations). This result is rather expected, since the Aures sharpness model includes the effect of loudness variations in comparison with the Bismarck model and the DIN 45692 standard. This effect can be described as a possible multicollinearity between these two parameters.
Finally, single value tonality calculations based on the model of Aures model were not correlated with mean annoyance evaluations (−0.140), whereas the calculations based on the hearing model have significant moderate correlations with mean annoyance evaluations (0.439). On the other hand, there is also an almost equally high correlation between the loudness of the stimuli and the single value tonality calculations based on the hearing model (0.493). The effects of overall loudness of the signals on tonality perception, as well as the frequency-dependent characteristics of tonality perception, are already included within the hearing model of tonality [37]. The expert panel of listeners usually complained about the noise samples after the experiment when there was a dominant salient tonal component. Almost every participant mentioned this tonality problem, although the calculated correlation was moderate. This phenomenon can be better explained in Figure 13. Correlation looks for a linear relationship between the input and output parameters; however, the tonality calculations show a usual stepwise behavior. Some of the stimuli have no or almost negligible tonality, while some of the stimuli have higher tonal components. In particular, the right panel of Figure 13 shows that, whenever a stimulus has a strong tonality based on the hearing model, the mean annoyance evaluations for this stimulus was usually 80 or above.
Since it is known from the recent literature that the effect of single tones in annoyance depends on the frequency of the tone (see, for example, References [34,36,37]), another method was used to calculate the correlations between the tonality and annoyance estimations. The tonal components in the vacuum cleaner noise are mainly clustered in three distinctive regions. These regions can be seen in Figure 9 and Figure 10. The first region includes the tones at approximately 100 Hz, the second region includes the tones between 200 Hz and 1000 Hz, and the last region includes the tones above 1000 Hz. These three regions were defined as Tonality LOW, Tonality MID and Tonality HIGH. Tonality values were calculated for these defined frequency ranges based on DIN 45681 [39] and the hearing model of Sottek [29], and if more than one tonal component was present in these ranges, the maximum tonal penalty value was calculated.
The correlation values were calculated for the newly defined single values and were presented in Table 6. For readability reasons, redundant or repetitive parameters were removed from Table 5. Here, it can be seen that, based on hearing model tonality, the low-frequency region (100 Hz) and the high-frequency region (over 1000 Hz) show moderate correlation between mean annoyance evaluations. Similar observations cannot be made for the DIN 45681 tonality calculations for the low, mid and high regions. Finally, similar investigations can also be found in Figure 14, where the stimuli with higher tonality values in the low and high ranges (hearing model) tend to have higher mean annoyance ratings (lower left and lower right panel of this figure).
Ultimately, it was found that the annoyance estimations of vacuum cleaners depend mainly on the overall loudness of the signal, the degree of higher frequencies (hence sharpness), and the possible tonal components at lower and higher frequencies, mainly above 1 kHz based on the hearing model tonality. The same conclusion cannot be drawn from the use of DIN 45681. The effect of higher frequencies seems to be stronger than that of the low-frequency 100 Hz tone, which is also partly consistent with the results in [8], where the participants responded to the change in level up to 600 Hz with an increase in performance and loudness perception, while this change had no effect on annoyance perception. However, in this listening experiment, low-frequency tonality was moderately correlated with annoyance, although it was only valid for one tonality model.

4. Listening Test 2 (Comparison of Different Test Methods and Loudness vs. Sharpness Factorial Design)

The second listening test was performed to investigate the possible interaction between loudness and sharpness. Stimuli were generated in the form of a factorial design, with selected loudness and sharpness values. One sample of vacuum cleaner noise without tonal components was selected, and its loudness and sharpness values were systematically changed by filtering. Four different sub-tests were conducted to investigate this possible interaction. In addition, three different experimental methods were used in these sub-tests to investigate the possible bias due to the experimental method. Nine participants were asked to rate annoyance of the vacuum cleaner noise signals in these three experiment methods. Finally, the results from the different test methodologies were compared and a repeated measures ANOVA was conducted to investigate the possible loudness sharpness interaction.

4.1. Stimuli, Subjects and Test Methods

Listening test 1 showed that loudness and sharpness have a significant effect on annoyance perception. However, it was not clear from this experiment if there was an interaction effect between these two parameters, i.e., higher-frequency content might influence the annoyance estimations as a function of the overall loudness of the stimulus. Multicollinearity is an important problem in statistical modeling that could lead to redundant input parameters in developed quality models. Moreover, the mathematical definitions of loudness and sharpness have a strong correlation from a purely acoustical point of view [40]. These two facts are particularly critical in sound quality evaluations of vacuum cleaners, where the loudness and sharpness play important roles. First, it can be interpreted from verbal descriptions of the participants that, when the stimuli are louder, the stimuli with stronger high-frequency content are perceived as more annoying. However, we know from the definition that an increase in higher frequencies increases loudness as well as sharpness but at a different rate of change. For this reason, it is necessary to investigate whether there is an interaction effect between these two parameters.
To analyze this possible interaction effect, a series of listening tests was designed, in each of which the loudness and sharpness values were varied in the context of a factorial design. Listening test 2 was divided into four parts. Part 1 included a slider scale experiment with a 3 × 3 factorial experiment design for loudness and sharpness. Part 2 included a magnitude estimation test with a similar 3 × 3 factorial design. Part 3 of the listening test had the same 3 × 3 factorial design, but this time, a random access method was used. In Part 4, the factorial design was changed to 5 × 3 for loudness and sharpness, and the random access method was used.
Moreover, in addition to the possible loudness–sharpness interaction effect, this section also compares the different test methods to discuss the advantages and shortcomings in factorial design experiments. Mainly, for Parts 1, 2 and 3, the slider scale, magnitude estimation and random access methods were applied for the same stimuli under the same reproduction conditions. Finally, in Part 4, the variability in the loudness was extended in both directions so that the possible interaction effects can also be observable in the quieter and louder stimuli.
For Parts 1, 2 and 3, a 3 × 3 factorial design was used for the loudness and sharpness values. For Part 4, a 5 × 3 factorial experimental design was used for loudness and sharpness values. The only difference in Part 4 was that the maximum and minimum values of the loudness values were extended. The values used for each factorial design can be found in Table 7. Here, stimuli 4–12 were used for the 3 × 3 design (numbers with an asterisk), and stimuli 1, 2, 3, 13, 14 and 15 were added for the 5 × 3 design. The loudness values, calculated according to the standard ISO 532-1 [22], were selected to be approximately 16 sone, 20 sone and 25 sone for the 3 × 3 design. These values were selected such that they are in the limits measured for each vacuum cleaner given in Table 3. For the 5 × 3 factorial design, the loudness values were extended to 13, 16, 20, 25 and 30 sone. Meanwhile, the sharpness values, calculated according to the calculation method of Aures ([25] with [22]), were selected as 2.4, 2.9 and 3.3 acum.
To obtain vacuum cleaner noise with different sharpness values, a parametric IIR low-pass filter was applied to a selected vacuum cleaner recording. The cutoff frequency of the low-pass filter was set to 4000 Hz. Around this particular frequency, vacuum cleaner noise decreases, and this decrease is different for different vacuum cleaners. Three different parametric low-pass filters with three different Q values were used, so the slope of each line in the FFT was different. Therefore, it was possible to obtain vacuum cleaner noise with different high-frequency components and thus different sharpness values. Since changing the high-frequency content affects the overall loudness of the sound, the overall level is slightly shifted for each filter case. As a result, the same loudness values are obtained. One example is shown in Figure 15. Here, three stimuli have the same loudness but different sharpness values.
To generate the stimuli in this listening experiment, one original stimulus was taken as the basis. This original sound was selected such that the signal had no tonal components, a loudness of 20 sone (ISO 532-1) and a sharpness of 3.13 acum (Aures). Both loudness and sharpness values lie in the middle of the observed loudness and sharpness ranges. Intentionally, a stimulus without a tonal component was selected to eliminate any possible bias originating from the tonal component in this listening experiment.
Three different test methodologies were compared for factorial design experiments 1, 2 and 3 (Figure 16). For these three experiments, the slider scale, magnitude estimation and random access methods were used. The slider scale experiment (Figure 16, part a) used a quasi-continuous rating slider with verbal anchors (from 0 to 100 with a step size of 1) with equidistant neighboring categories (not at all, slightly, moderately, very or extremely), as in listening test 1. Participants used this slider to rate the annoyance of the given stimuli. The appearance of the stimuli was randomized for each participant, and participants were not allowed to navigate back and to change their evaluations for previous stimuli.
In the magnitude estimation experiments (Figure 16, part b), an anchor stimulus and a defined annoyance value for that particular anchor stimulus were used. Participants were then asked to rate the annoyance of a particular stimulus relative to the anchor stimulus. The reference value for annoyance was set to 100 for the anchor stimulus. Participants could listen to the two given sounds as many times as necessary and they gave their ratings by entering a number in the free space below the play button. The order of the stimuli was also random, as in the slider scale experiment. This random order was different for each participant, and participants could not go back and change their ratings.
Lastly, the random access method (Figure 16, part c) used a user interface where all of the stimuli were presented to the participant simultaneously. At any time, the participant could click the play buttons in any order to listen the stimuli, could compare them in pairs and could change their previously established response. They could drag and drop the playback icons to the field, which contained the same verbal anchors as in slider scale experiment. The position of the playback icon (i.e., stimulus) on the y-axis was taken as the rating of a participant.
The main difference between the random access method and the slider scale method is that, in the random access method, participants can always replay all stimuli, can change their decisions and have a better sense of control over their evaluations. However, the number of stimuli in such experiments is rather limited. Firstly, the user interface does not have enough space for an unlimited number of playback icons, and secondly, participants reported that, as the number of stimuli increased, it became more difficult to make a decision. When the “evaluation field” was filled (when a participant moved all the playback icons to their correct locations), participants clicked “evaluate” to submit the results.
Similar to listening test 1, the question was “How do you evaluate the annoyance?”, and participants were given the categories “not at all”, “slightly”, “moderately”, “very” or “extremely”. For the magnitude estimation test, the question was changed to “How do you evaluate the annoyance of signal A, compared to the signal B?” For the magnitude estimation procedure, stimulus 1 (lowest loudness and sharpness values) was used as the anchor stimulus.
Part 1 used a slider scale evaluation, Part 2 used a magnitude estimation, and Parts 3 and 4 used the random access method. Nine subjects participated in all parts of the experiment. The experiments were conducted in a soundproof audiometric booth. Three participants were female, and six participants were male. The age of the participants ranged from 25 to 38 years, with a mean of 31.6 and a standard deviation of 3.9. None of the participants reported having a known hearing problem. In each of these experiments, participants were given instructions similar to those in listening test 1.

4.2. Results

The results of Parts 1, 2 and 3 can be seen together in Figure 17. For Part 1 and Part 3, the average annoyance evaluations and standard deviations were calculated from the individual ratings of participants. The results of Part 2 are shown on a second axis in the same graph. The main reason for this visualization was because the evaluations from a magnitude estimation are ratio-scaled quantities. The evaluations of each participant were linearized by taking the log10 of each value. Since the first stimulus was an anchor stimulus with a reference value of 100, participants evaluated this signal as 100, which was shown in a linearized way as the number “2” in this figure. Similarly, if a participant rated a stimulus as “200” (two times more annoying than the anchor stimulus), this was represented approximately as 2.30 on this graph.
A similar trend was observed between the three different methodologies, whereas the ‘drops’ between the different loudness levels (stimuli 3 to 4 and stimuli 6 to 7) were more obvious in the magnitude estimation. The slider scale and the random access methods had similar trends. These evaluation methods used the same scale and eventually showed similar standard deviations. In both cases, participants had a limited response scale, where they had to provide answers between the predefined numbers (i.e., 0–100), which reflect the categorizations with verbal anchors. Depending on the number of stimuli used for a listening experiment in annoyance evaluations, both methods can be used interchangeably. However, for an experiment with a large number of stimuli, the random access method can be disadvantageous for a participant, since it might be overwhelming to place many sound samples on the evaluation surface at the same time. From a similar perspective, access to all stimuli encourages a participant to play back every possible pair, which might lead the multiple-stimulus evaluation method to become a pairwise evaluation method. In contrast, in the slide scale method, where participants evaluated a single stimulus in each round, they usually reported that they were not sure at the beginning of the test, so they wanted to change their previous evaluations depending on the newly available stimulus. The slider scale method does not provide participants an opportunity to go “back” and “correct” their response. However, with a proper training session and randomization of the order of the stimuli for each participant, we can eliminate this possible bias, which we call “beginning bias”. Eventually, for the case with nine stimuli, both methods showed similar tendencies.
However, a magnitude estimation has its own advantages and disadvantages. The main disadvantage of using a magnitude estimation in annoyance evaluations is the question itself. The main feedback from the participants was that they could not estimate “what was two/three times more/less annoying”. These estimations are more suitable for evaluating better scalable quantities, for example, “two times longer” or “three times larger surface area”. For a line with a given length, participants can better “estimate” the length of a second line; however, the same approach is not always clear for participants of annoyance evaluations. The second disadvantage can be seen in the selection of the anchor stimulus. Here, stimulus 1, which had the lowest loudness and sharpness values, was selected as the anchor stimulus. Each comparison that depends on this particular stimulus can generate different biases [41]. However, a more detailed investigation of every possible pairwise comparison of the data can be provided using a magnitude estimation. For example, a comparison of pairs 1–3 and 1–4 showed that participants could tolerate a louder tone (stimulus 4) better than a stimulus with the same loudness but relatively high sharpness (stimulus 3). However, the standard deviation of stimulus 3 makes this inference relatively difficult. In contrast, it was not possible to state a similar trend between stimuli 3 and 4 for Part 1 and Part 3.
The individual results for each part are shown in Figure 18, Figure 19, Figure 20 and Figure 21. In these four figures, the annoyance estimations of each loudness level and sharpness level are averaged over the number of subjects, and the error bars represent the 95% confidence intervals. In all four results, curves representing the different sharpness levels were almost parallel to each other, indicating no interaction between these two quantities. The rate of change of annoyance with changing sharpness was not different at each loudness level. In addition, a repeated measures ANOVA was performed for all tests. There was a separate statistically significant effect of loudness for all parts. The same significant effect was observed for sharpness. However, the interaction effect between loudness and sharpness was not significant in all cases. The results of the repeated measures ANOVA can be found in Table 8.
Finally, a comparison between Part 3 and Part 4 is shown in Figure 22. The three panels of this figure show the three sharpness levels used in both experiments. Part 4 has five loudness levels, whereas Part 3 has three loudness levels. In each panel of this figure, it can be seen that the slopes are almost the same in both experiments. This means that changing the loudness at each sharpness level results in an equal change in annoyance for both experiments. In the right panel, it is possible to see that the absolute annoyance evaluations for Part 3 are higher than those for Part 4. It appears that the participants scaled their evaluations for the maximum loudness and sharpness levels to fit within the given evaluation space (from 0 to 100).

5. Summary and Discussion

This study included a wide range of vacuum cleaner recordings selected from the market in a controlled manner. In particular, the sound power levels of the devices according to the manufacturers show a fine distribution among the observed ranges in the market, and the distribution is not stacked or concentrated on specific dB(A) values.
The recordings showed the variability in acoustic and psychoacoustic parameters and their ranges among the selected devices. Based on this observed variability, it was possible to derive the common characteristics of canister-type vacuum cleaner noise. These common characteristics were then compared with those in the literature on vacuum cleaner noise generation mechanisms. The observed variability was comparable with those in the literature. The measured ranges can be considered the limits of acoustic and psychoacoustic values available in the market. Ultimately, it was possible to define prototypical vacuum cleaner noise. This prototypical vacuum cleaner noise provided insight into the possible level ranges: frequency content and tonal content (i.e., frequency and intensity, respectively). Any reader working on vacuum cleaner noise can compare a measurement with the defined ranges in this study to verify that the limits defined in this study are adequate at representing the entire vacuum cleaner population. If new values emerge, either due to a new sampling method (e.g., selection of different vacuum cleaners) or a new technological advancement (e.g., decreasing levels), then it is possible to extend and improve this study to a more inclusionary approach between the vacuum cleaner noise annoyance studies available in the literature. In that manner, it should be possible to obtain reproducible results between different research groups working on the sound quality of vacuum cleaners. Furthermore, the definition of prototypical vacuum cleaner noise can help future studies make parametric modifications of the defined noise and investigate the influence of salient noise characteristics on annoyance ratings.
Recording condition is a static condition of a vacuum cleaner that must be taken into account because normal working conditions can change its emitted sound. However, this effect is rather random, and due to this complexity, it is not possible to generate a comparison baseline for different vacuum cleaners.
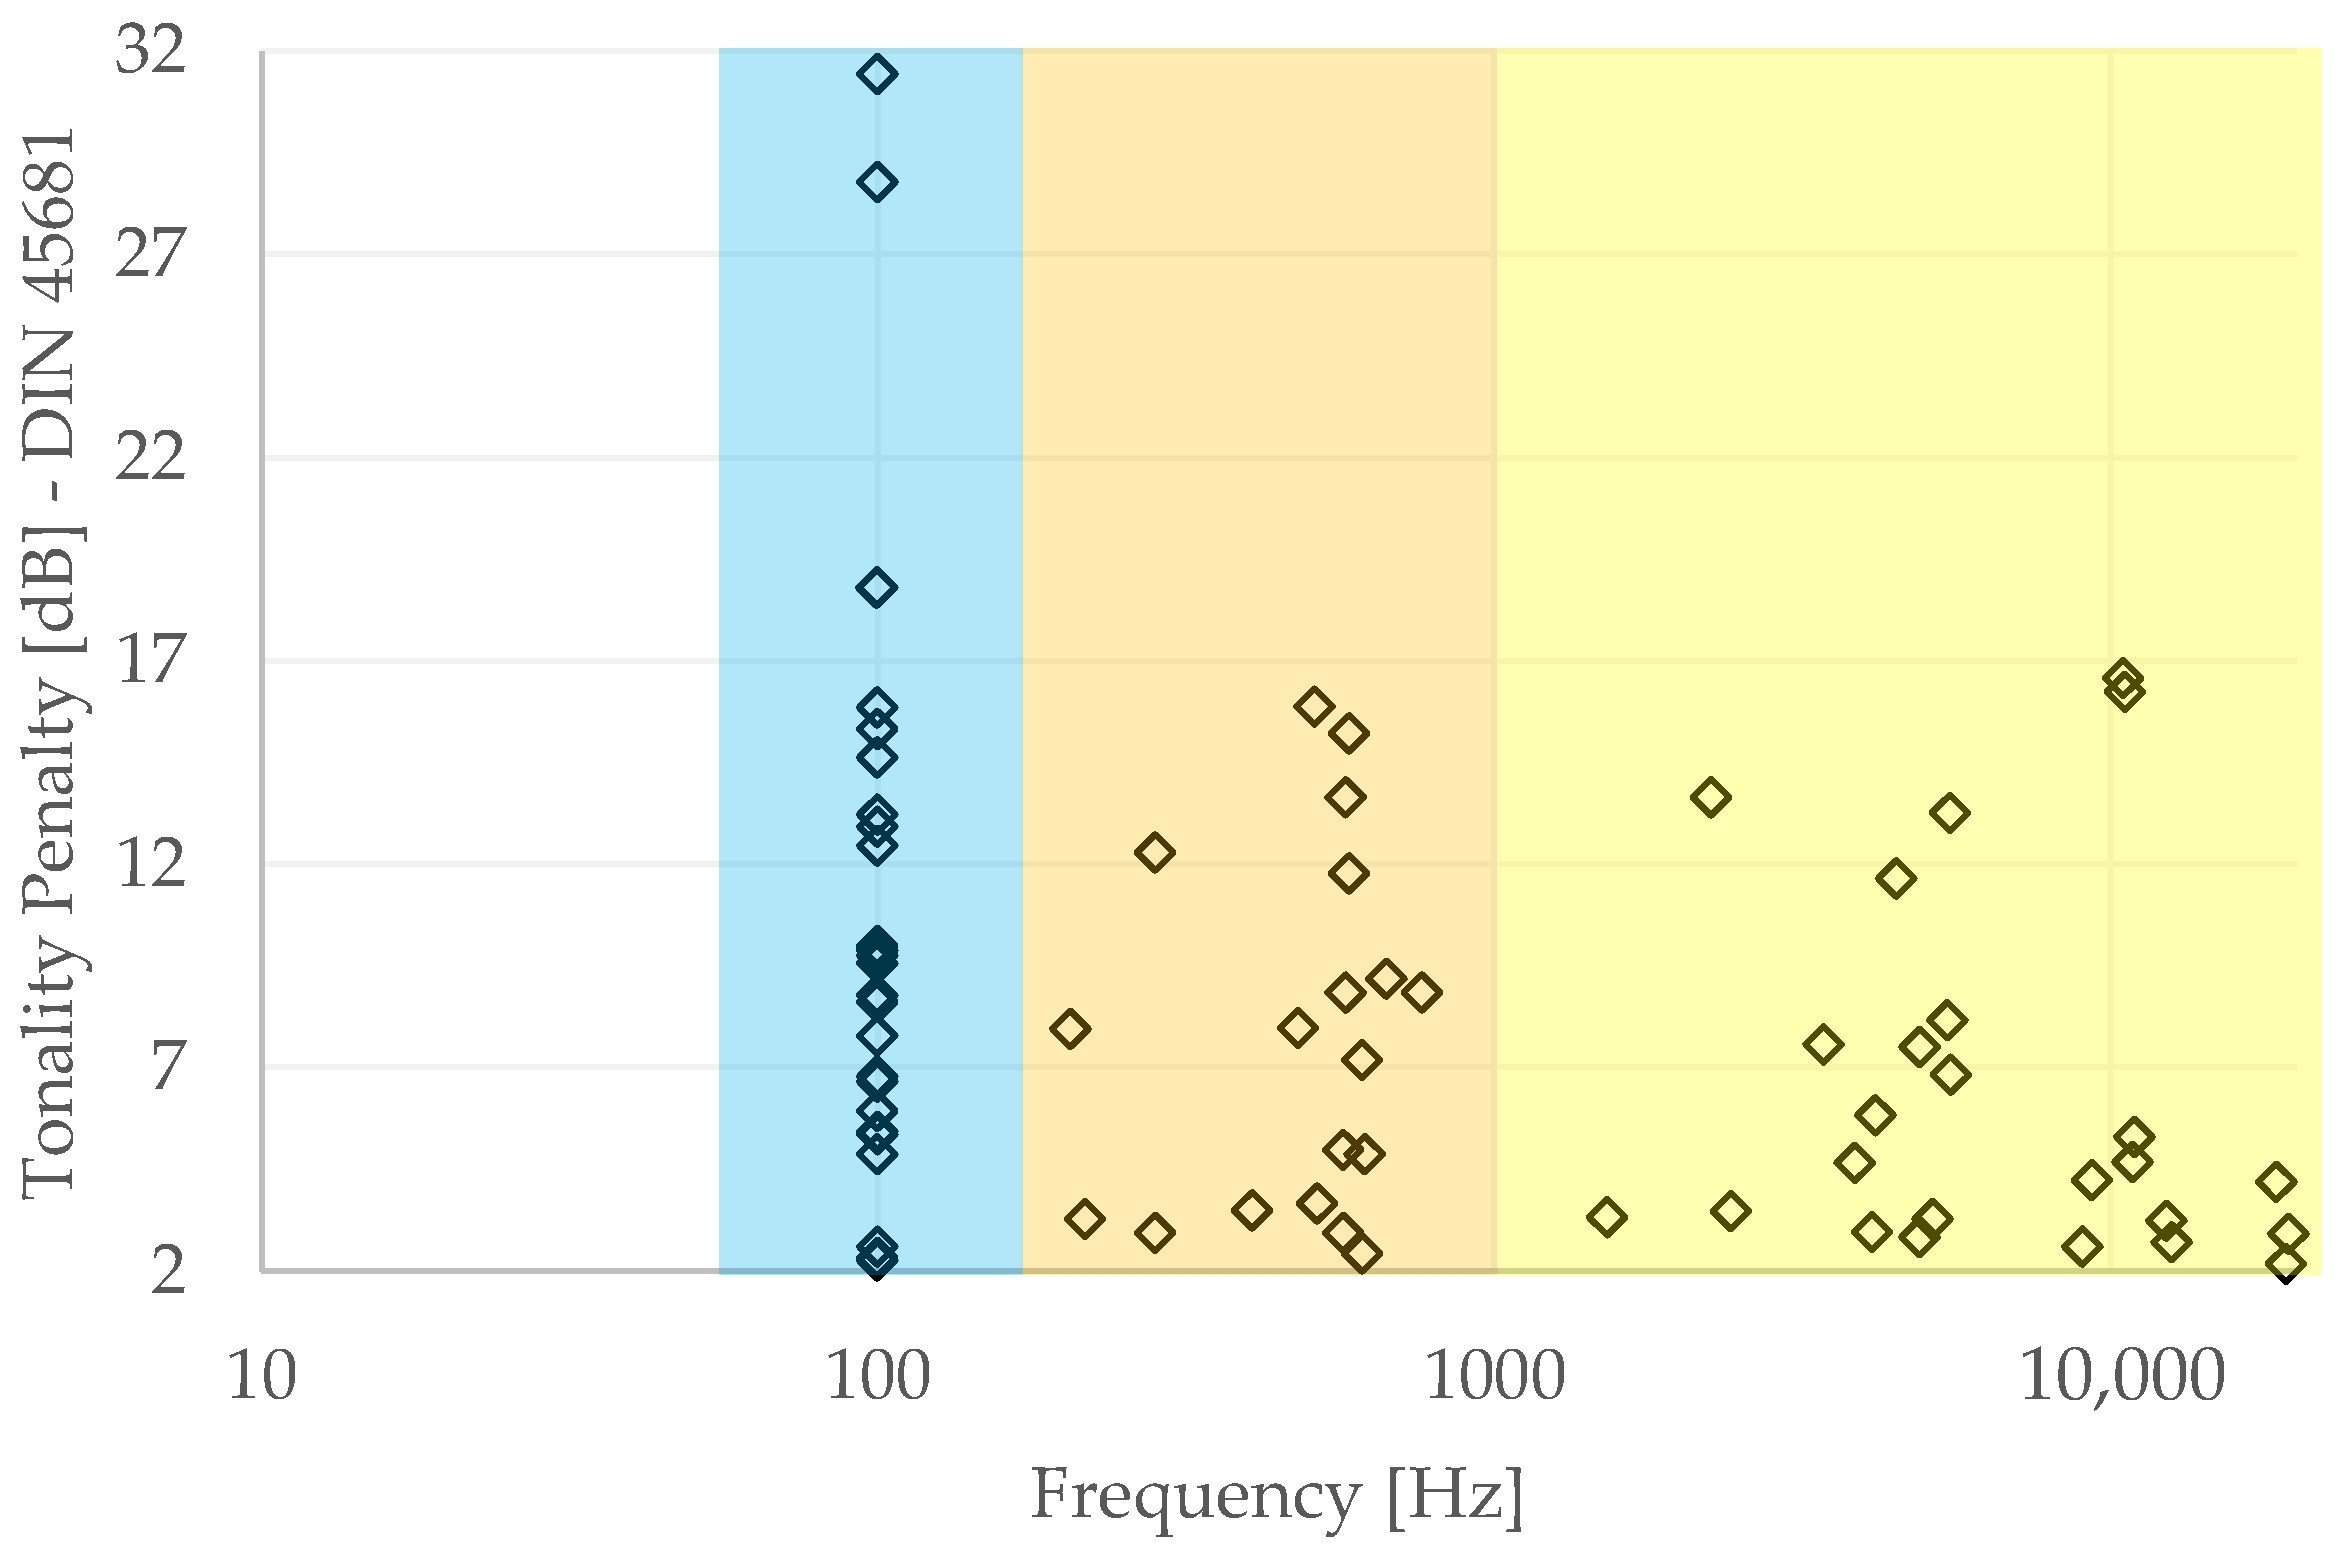
Prototypical vacuum cleaner noise can be explained as follows: vacuum cleaner noise is quasi-stationary and has an increasing A-weighted level of about 500 Hz, where the highest level is mostly reached. In this range, most vacuum cleaners have a tone of approximately at 100 Hz, which varies in amplitude depending on the device. At frequencies higher than 500 Hz, A-weighted vacuum cleaner noise tends to decrease, with the range changing depending on whether hard flooring or carpet is used. After 5 kHz, the rate of decrease in the A-weighted levels usually increases. The noise levels reach a value below a threshold of about 10 kHz. In this defined range, different vacuum cleaners show different levels, although the main structure remains essentially the same. Among the defined frequency ranges and their intensities, vacuum cleaners have many tonal components lying in different frequencies. However, it can be roughly categorized that the tones are concentrated in three regions: the first region is around 100 Hz, the second region is approximately 200–800 Hz, and the last region is approximately 1000–10,000 Hz. These values are calculated based on the tonality standard DIN 45681 [39] and the hearing model of Sottek [29]. Additionally, the ranges of the psychoacoustical metrics calculated in this study are given in Table 3, so any further study of vacuum cleaner sound quality can verify the reliability of these values, based on whether a new recording’s values are inside or outside of these defined ranges, keeping the recording conditions in mind.
In the second part of this study, the main correlates of the annoyance evaluations of vacuum cleaner noise were obtained in two listening tests. The first listening test included original and modified vacuum cleaner noise samples. The main correlates of the annoyance evaluations were found in this listening experiment. The second listening experiment was divided into four parts, and each part was designed in a full factorial experiment (between loudness and sharpness) with different experimental methods and ranges. The possible interaction between loudness and sharpness was investigated in these experiments.
The first listening test showed that the overall loudness, sharpness and especially tonal components at lower and higher frequencies play crucial roles in annoyance perception. The correlations between these three parameters and annoyance were found to be significant. The coefficients for the three correlations were found to be 0.963 for loudness, 0.763 for sharpness, 0.354 for tonality at low frequencies and 0.454 for tonality at high frequencies.
However, there is a relatively strong correlation between loudness and sharpness (0.778) and a moderate correlation between loudness and hearing model tonality (0.493). Although there is a strong correlation between loudness and sharpness, which might hint at a degree of multi-collinearity, sharpness was taken into account due to two reasons: Firstly, based on the range of differences with high frequencies, observed in Figure 8, it makes sense to include sharpness as a parameter due to the variation. It is possible to have the same loudness values and different sharpness values. Secondly, the broadband noise-like nature of vacuum cleaner sounds changes its color significantly by changing the high-frequency content. An expert listening to the recordings can directly relate the mentioned characteristics: different vacuum cleaners have different band-noise characteristics with different amounts of high-frequency content. Moreover, changing the high-frequency content of vacuum cleaner noise is achievable by applying sound-absorbing materials at the air exit and other slits, as observable in some of the “low noise” vacuum cleaners on the market. Eventually, variation in the sharpness can be achieved by means of noise reduction techniques, as mentioned in different pieces of literature referred to in this study.
In the first three parts of the second experiment (Part 1, Part 2 and Part 3), a 3 × 3 factorial design was used in different experimental methods, and the significance of the loudness–sharpness interaction was tested using a repeated measures ANOVA. In the last part, the loudness range was extended in the 5 × 3 factorial design experiments so that the investigated range of loudness was close to the range observed from market research and the interaction could be investigated in louder and quieter stimuli. For all four parts, no significant interaction between loudness and sharpness was found.
In Parts 1, 2 and 3, three different experimental methods were compared with each other using the same stimuli, same subjects and same playback conditions. The investigated methods were slider scale (Part 1), magnitude estimation (Part 2) and random access (Part 3). As expected, the slider scale and random access methods showed quite high similarity, whereas the magnitude estimation method showed clear distinctions for loudness level changes, although statistical significance was not observed when the entire database was considered.
This different behavior from the magnitude estimation test can be the reason for the logarithmic bias [41] since the stimulus with the lowest loudness and sharpness values was used as the anchor stimulus. In future studies, this effect could be further investigated using another anchor stimulus, such as the other extreme of the stimulus pool (the loudest and sharpest stimulus) or a stimulus right in the middle. In addition, after the magnitude estimation tests, participants usually commented that evaluations such as “two times more annoying” were rather complicated for them, compared with using the available scale with verbal anchors.
The results found in this study are similar to those of the cited studies on this topic [2,4,8]. It was found that loudness and sharpness were strongly correlated with annoyance. In addition to these two terms, high correlations were found between roughness and fluctuation strength, and ratings of annoyance in the cited studies. Furthermore, tone-to-noise ratio was strongly correlated with the annoyance ratings. However, the cited studies do not include the correlations among the input parameters, so it is difficult to say whether the reported high correlations have direct psychoacoustic significance or whether the dominant effect of loudness is reflected in other input parameters due to multicollinearity. Apart from that, a direct comparison with the other cited papers is not possible because they differ in content and methodology. Yoshida’s [1] work is a special case for a listening attitude (active and passive listening), and since they have used only upright cordless vacuum cleaners, a direct comparison was not feasible. Additionally, Lyon [9] used a different approach, where the variation in signal characteristics was obtained via real mechanical modification of the device. Hence, the results were given based on these mechanical modifications but were not dependent on the psychoacoustic parameters. Hence, a direct comparison was not possible.
Finally, it is important to point out the potential limitations of this study: Although the selection of vacuum cleaners using maximum power and sound power levels was justified, each sampling is inherently subject to error. As with any other study of sound quality, a different selection of stimuli could lead to different results in the correlations. However, this limitation was minimized by including additional synthetic stimuli. Sound recordings were made under anechoic conditions. It is reasonable to assume that the actual auditory effect might be different if the same devices were operated under normal room conditions. However, room acoustic conditions are completely arbitrary and cannot be a reasonable basis for comparing different devices. The correlations obtained in the first listening test are only valid for the applied test method. As can be seen from the results of listening experiment 2, different test methods can also lead to different results. Finally, the significance and effect size obtained in listening experiment 2 could be different in an experiment with more participants.
As future work, the effect of tonality should also be investigated in a factorial design, allowing for a full-factorial design between all the major correlates of annoyance found in listening test 1. However, this could involve many input parameters with many levels, resulting in too many stimuli, which is not feasible for use in a single experiment. There, an experiment method should be defined that allows for separate experiments and their combined evaluations with as little biases or errors as possible.

Author Contributions

Conceptualization, S.A.; data curation, S.A.; formal analysis, S.A.; funding acquisition, S.A. and M.E.A.; investigation, S.A.; methodology, S.A.; project administration, S.A. and M.E.A.; resources, S.A.; supervision, M.E.A.; validation, S.A.; visualization, S.A.; writing—original draft, S.A.; writing—review and editing, M.E.A. All authors have read and agreed to the published version of the manuscript.

Funding

This research was funded by the Federal Ministry of Economic Affairs and Climate Action (BMWK) based on a decision by the German Bundestag, grant number KK5049502LB0.

Institutional Review Board Statement

The study was conducted in accordance with the Declaration of Helsinki and approved by the Ethics Committee of TU Dresden (protocol code SR-EK-474102021, by 06.12.2021).

Informed Consent Statement

Informed consent was obtained from all subjects involved in the study.

Data Availability Statement

Not applicable.

Conflicts of Interest

The authors declare no conflict of interest. The funders had no role in the design of the study; in the collection, analyses or interpretation of data; in the writing of the manuscript; or in the decision to publish the results.

References

  1. Yoshida, J.; Hatta, I. Influence of hearing attitude difference on sound quality evaluation of vacuum cleaner sound. Acoust. Sci. Technol. 2021, 42, 46–49. [Google Scholar] [CrossRef]
  2. Kumar, S.; Wing, W.S.; Lee, H.P. Psychoacoustic Analysis of Vacuum Cleaner Noise. Acoustics 2021, 3, 545–559. [Google Scholar] [CrossRef]
  3. Altinsoy, E.; Kanca, G.; Belek, H.T. A Comperative Study on the Sound Quality of Wet and Dry-Type Vacuum Cleaners. In Proceedings of the Sixth International Congress on Sound and Vibration, Copenhagen, Denmark, 5–8 July 1999; p. 8. [Google Scholar]
  4. Altinsoy, M.E. Towards an European sound label for household appliances: Psychoacoustical aspects and challenges. In Proceedings of the 4th International Workshop on Perceptual Quality of Systems, Vienna, Austria, 2–4 September 2013. [Google Scholar]
  5. Martin, N.; Lehmann, J.; Wadle, L.-M. Relationship between acoustic perception and overall user experience in vacuum cleaners. In Proceedings of the EuroNoise, Madeira, Portugal, 25–27 October 2021. [Google Scholar]
  6. Takada, M.; Arase, S.; Tanaka, K.; Iwamiya, S. Economic valuation of the sound quality of noise emitted from vacuum cleaners and hairdryers by conjoint analysis. Noise Control Eng. J. 2009, 57, 263. [Google Scholar] [CrossRef]
  7. Takada, M. Design and value of product sound. In Proceedings of the InterNoise, Madrid, Spain, 16–19 June 2019. [Google Scholar]
  8. Ih, J.-G.; Lim, D.-H.; Shin, S.-H.; Park, Y. Experimental design and assessment of product sound quality: Application to a vacuum cleaner. Noise Control Eng. J. 2003, 51, 244. [Google Scholar] [CrossRef]
  9. Lyon, R. Designing for Product Sound Quality, 1st ed.; CRC Press: New York, NY, USA, 2000. [Google Scholar]
  10. Rukat, W. The Noise Emitted by a Vacuum Cleaner Treated as a Device with Extensive Sound Sources. Vib. Phys. Syst. 2018, 29, 2018015. [Google Scholar]
  11. Buratti, C.; Moretti, E.; Urbani, M. Experimental Acoustics Characterization of a Wet Vacuum Cleaner. In Proceedings of the Sixteenth International Congress on Sound and Vibration, Krakow, Poland, 5–9 July 2009; p. 8. [Google Scholar]
  12. Čudina, M.; Prezelj, J. Noise generation by vacuum cleaner suction units Part I: Noise generating mechanisms—An overview. Appl. Acoust. 2007, 68, 491–502. [Google Scholar] [CrossRef]
  13. Čudina, M.; Prezelj, J. Noise generation by vacuum cleaner suction units Part II. Effect of vaned diffuser on noise characteristics. Appl. Acoust. 2007, 68, 503–520. [Google Scholar] [CrossRef]
  14. Čudina, M.; Prezelj, J. Noise generation by vacuum cleaner suction units. Part III. Contribution of structure-borne noise to total sound pressure level. Appl. Acoust. 2007, 68, 521–537. [Google Scholar] [CrossRef]
  15. Novaković, T.; Ogris, M.; Prezelj, J. Validating impeller geometry optimization for sound quality based on psychoacoustics metrics. Appl. Acoust. 2020, 157, 107013. [Google Scholar] [CrossRef]
  16. Brungart, T.A.; Lauchle, G.C. Modifications of a handheld vacuum cleaner for noise control. Noise Control Eng. J. 2001, 49, 73. [Google Scholar] [CrossRef]
  17. Brungart, T.A.; Lauchle, G.C.; Ramanujam, R.K. Installation effects on fan acoustic and aerodynamic performance. Noise Control Eng. J. 1999, 47, 3. [Google Scholar] [CrossRef]
  18. Teoh, C.-Y.; Lim, J.; Hamid, M.N.A.; Ooi, L.E.; Tan, W.H. Suppression of Flow-Induced Noise of a Canister Vacuum Cleaner. Int. J. Integr. Eng. 2023, 15, 180–190. [Google Scholar]
  19. Staubsaugern-Mit und Ohne Beutel, Saturn. Available online: https://www.saturn.de/de/category/staubsauger-1581.html (accessed on 20 February 2023).
  20. Bodenstaubsaugern-mit und ohne Beutel, Mediamarkt. Available online: https://www.mediamarkt.de/de/category/bodenstaubsauger-830.html (accessed on 20 February 2023).
  21. IEC 60704-2-1:2020; Household and Similar Electrical Appliances—Test Code for the Determination of Airborne Acoustical Noise—Part 2-1: Particular Requirements for Dry Vacuum Cleaners. International Electrotechnical Commission: Geneva, Switzerland, 2020.
  22. ISO 532-1; Acoustics—Methods For Calculating Loudness—Part 1: Zwicker Method. International Organization for Standardization: Geneva, Switzerland, 2017.
  23. DIN 45631/A1; Berechnung des Lautstärke-pegels und der Lautheit aus dem Geräuschspektrum–Verfahren nach E. Zwicker. German Institute for Standardization: Berlin, Germany, 2010.
  24. ISO 532-2; Acoustics—Methods for Calculating Loudness—Part 2: Moore-Glasberg Method. International Organization for Standardization: Geneva, Switzerland, 2017.
  25. Aures, W. Berechnungsverfahren für den sensorischen Wohlklang beliebiger Schallsignale. Acta Acust. United Acust. 1985, 59, 130–141. [Google Scholar]
  26. von Bismarck, G. Sharpness as an Attribute of the Timbre of Steady Sounds. Acta Acust. United Acust. 1974, 30, 159–172. [Google Scholar]
  27. DIN 45692; Messtechnische Simulation der Hörempfindung Schärfe. German Institute for Standardisation: Berlin, Germany, 2009.
  28. Terhardt, E.; Stoll, G.; Seewann, M. Algorithm for extraction of pitch and pitch salience from complex tonal signals. J. Acoust. Soc. Am. 1982, 71, 679–688. [Google Scholar] [CrossRef]
  29. ECMA International. ECMA-74 15th Edition/July 2018, D.7, Tone-to- Noise Ratio Method; ECMA International: Geneva, Switzerland, 2018. [Google Scholar]
  30. Bray, W.R. A New Psychoacoustic Method for Reliable Measurement of Tonalities According to Perception. In INTER-NOISE and NOISE-CON Congress and Conference Proceedings; Institute of Noise Control Engineering: Reston, VA, USA, 2018. [Google Scholar]
  31. Hots, J.; Verhey, J. Experimentelle Erfassung von Tonzuschlagen. In Proceedings of the DAGA 2015, Nürnberg, Germany, 16–19 March 2015. [Google Scholar]
  32. Oliva, D.; Hongisto, V.; Haapakangas, A. Annoyance of low-level tonal sounds—Factors affecting the penalty. Build. Environ. 2017, 123, 404–414. [Google Scholar] [CrossRef]
  33. Becker, J.; Sottek, R.; Lobato, T. Progress in Tonality Calculation; Universitätsbibliothek der RWTH Aachen: Aachen, Germany, 2019; p. 8. [Google Scholar]
  34. Hongisto, V.; Saarinen, P.; Oliva, D. Annoyance of low-level tonal sounds—A penalty model. Appl. Acoust. 2019, 145, 358–361. [Google Scholar] [CrossRef]
  35. Melian, A.G.; Nykänen, D.A. Perception of Tones below 1 kHz in Electric Vehicles. In INTER-NOISE and NOISE-CON Congress and Conference Proceedings; Institute of Noise Control Engineering: Reston, VA, USA, 2019; p. 11. [Google Scholar]
  36. Pietila, G.; Seldon, W.; Roggenkamp, T.; Bohn, T. Tonal Annoyance Metric Development for Automotive Electric Vehicles. In Proceedings of the Noise and Vibration Conference & Exhibition, Grand Rapids, MI, USA, 10–13 June 2019. [Google Scholar] [CrossRef]
  37. Sottek, R.; Becker, J. Tonal Annoyance vs Tonal Loudness and Tonality. In Proceedings of the InterNoise, Madrid, Spain, 16–19 June 2019. [Google Scholar]
  38. Becker, J.; Sottek, R. Application of Psychoacoustic Tonality for Product Sound Development. In Proceedings of the DAGA 2020, Hannover, Germany, 16–19 March 2020. [Google Scholar]
  39. DIN 45681; Bestimmung der Tonhaltigkeit von Geräuschen und Ermittlung Eines Tonzuschlages für die Beurteilung von Geräuschimmissionen. German Institute for Standardisation: Berlin, Germany, 2005.
  40. Zwicker, E.; Fastl, H. Psychoacoustics: Facts and Models; Springer Science & Business Media: Berlin/Heidelberg, Germany, 2013; Volume 22. [Google Scholar]
  41. Poulton, E.C. Models for Biases in Judging Sensory Magnitude. Psychol. Bull. 1979, 86, 777–803. [Google Scholar] [CrossRef] [PubMed]
Figure 1. Positioning of the vacuum cleaner, as described in [21].
Applsci 13 06136 g001
Figure 2. FFTs of all 15 vacuum cleaner noise for hard flooring case (1/24 octave intensity averaging smoothing, A-weighted; spectrum size: 4096).
Applsci 13 06136 g002
Figure 3. Spectrograms of 15 selected vacuum cleaner noise recordings on hard flooring (A-weighted, spectrum size: 4096).
Applsci 13 06136 g003
Figure 4. Calculated loudness values for all 15 vacuum cleaners based on ISO 532-1 (recordings on hard flooring).
Applsci 13 06136 g004
Figure 5. Calculated sharpness values for all 15 vacuum cleaners based on three different sharpness models (recordings on hard flooring).
Applsci 13 06136 g005
Figure 6. Calculated tonality values for all 15 vacuum cleaners based on two different tonality models (recordings on hard flooring).
Applsci 13 06136 g006
Figure 7. Frequency content of every vacuum cleaner recorded: (a) hard flooring; (b) carpet (A-weighted, spectrum size: 4096).
Applsci 13 06136 g007
Figure 8. Average vacuum cleaner noise and possible variations. The dotted lines show the variation between different brands and models. Possible tones were also represented (for spectrum size: 4096).
Applsci 13 06136 g008
Figure 9. Calculated tonal components of which the penalty value is more than 2 dB according to DIN 45681, for both the hard flooring and carpet cases. These components are grouped into LOW–MID–HIGH regions.
Applsci 13 06136 g009
Figure 10. Calculated specific tonality based on hearing model of Sottek, for both the hard flooring and carpet cases. Calculated values are grouped into LOW–MID–HIGH regions.
Applsci 13 06136 g010
Figure 11. Synthesizing new stimuli: one example case, from left to right: original case, bandstop 200 Hz and 300 Hz, bandstop 500 Hz, 6 dB increase, 6 dB decrease, and 12 dB decrease (spectrum size: 4096).
Applsci 13 06136 g011
Figure 12. Graphical user interface used for slider scale experiment.
Applsci 13 06136 g012
Figure 13. Mean annoyance evaluations vs. single value tonality calculations, based on (a) Aures model; (b) hearing model.
Applsci 13 06136 g013
Figure 14. Mean annoyance evaluations vs. single value tonality calculations, based on (a) DIN 45681—Low; (b) DIN 45681—Mid; (c) DIN 45681—High; (d) Hearing Model—Low; (e) Hearing Model—Mid; (f) Hearing Model—High.
Applsci 13 06136 g014
Figure 15. Frequency content of example stimuli 1, 2 and 3, which have the same loudness but different sharpness values (spec size: 4096).
Applsci 13 06136 g015
Figure 16. GUIs of the three different test methodologies used in Parts 1, 2 and 3: (a) slider scale; (b) magnitude estimation; (c) random access method.
Applsci 13 06136 g016
Figure 17. Results of Parts 1, 2 and 3 with the same stimuli and three different testing methods (slider scale, magnitude estimation and random access method, respectively). Results of Part 1 and Part 3 were gathered by calculating the arithmetic mean values of the results, as well as standard deviations. For Part 2, on the other hand, since the magnitude estimation test provides ratio-scaled data, results are linearized by taking the log10 of the values and given in the second y-axis. Averages and standard deviations were calculated after the linearization.
Applsci 13 06136 g017
Figure 18. Average annoyance evaluations for each loudness and sharpness level for Part 1 (bars 95% CI).
Applsci 13 06136 g018
Figure 19. Geometric average annoyance evaluations for each loudness and sharpness level for Part 2 (bars 95% CI).
Applsci 13 06136 g019
Figure 20. Average annoyance evaluations for each loudness and sharpness level for Part 3 (bars 95% CI).
Applsci 13 06136 g020
Figure 21. Average annoyance evaluations for each loudness and sharpness level for Part 4 (5N × 3S) (bars 95% CI).
Applsci 13 06136 g021
Figure 22. Comparison of Part 3 and Part 4: random access method with different loudness ranges (bars 95% CI).
Applsci 13 06136 g022
Table 1. Market ranges of vacuum cleaners and the corresponding ranges selected for this study.
Available in the MarketSelected
MinimumMaximumMinimumMaximum
Sound Power Level (dB(A))57825982
Maximum Power (Watt)13017006001400
Table 2. Sound power levels for the selected vacuum cleaners according to their manufacturers (in dB(A)).
Device NumberSound Power Level (dB(A))Device NumberSound Power Level (dB(A))Device NumberSound Power Level (dB(A))
1716791163
2717821279
3708661359
4619741472
58010771568
Table 3. Calculated minimum and maximum acoustic and psychoacoustic measures among different vacuum cleaners for the hard flooring and carpet cases.
CaseParameterMinMaxUnit
Hard FlooringLevel64.376.7dB
A-weighted level61.476.4dB(A)
Loudness (ISO 532)15.538.5sone
Sharpness (DIN 45631 and ISO 532 + Aures)2.824.5acum
Sharpness (DIN 45692 − DIN 45631)1.762.15acum
Sharpness (DIN 45631 and ISO 532 + Bismarck)1.621.95acum
Tonality (Aures)0.05050.2470tu
Tonality (Hearing Model)0.062.51tuHMS
CarpetLevel59.776.1dB
A-weighted level52.175.4dB(A)
Loudness (ISO 532)8.636.4sone
Sharpness (DIN 45631 and ISO 532 + Aures)2.474.43acum
Sharpness (DIN 45692 − DIN 45631)1.632.15acum
Sharpness (DIN 45631 and ISO 532 + Bismarck)1.51.97acum
Tonality (Aures)0.05980.3230tu
Tonality (Hearing Model)0.051.95tuHMS
Table 4. Calculated minimum and maximum acoustic and psychoacoustic measures, as well as standard deviations after modification of the stimuli.
ParameterMinMaxSTDUnit
Level44.176.76.1dB
A-weighted level40.176.47.7dB(A)
Loudness (ISO 532)3.338.58.5sone
Sharpness (ISO 532 + Aures)1.544.490.65acum
Sharpness (DIN 45692 − DIN 45631)1.163.270.28acum
Sharpness (ISO 532 + Bismarck)1.122.930.24acum
Tonality (Aures)0.04330.32300.0536tu
Tonality (Hearing Model)0.042.510.42tuHMS
Table 5. Correlations between annoyance estimations and psychoacoustic parameters.
AnnoyancedB (A)Loudness
(ISO)
Sharpness
(ISO + Aures)
Sharpness
(ISO + Bismarck)
Sharpness
(DIN)
Tonality
(Aures)
Tonality
(HMS)
Annoyance10.966 **0.963 **0.763 **0.257 *0.261 *−0.1400.439 **
dB (A) 10.962 **0.689 **0.1480.149−0.1870.408 **
Loudness (ISO) 10.778 **0.244 *0.245 *−0.0560.493 **
Sharpness (ISO + Aures) 10.794 **0.793 **−0.860.439 **
Sharpness (ISO + Bismarck) 10.999 *−0.1050.157
Sharpness (DIN) 1−0.0960.157
Tonality (Aures) 10.512 **
Tonality (HMS) 1
* Correlation is significant at the 0.05 level (2-tailed) ** Correlation is significant at the 0.01 level (2-tailed).
Table 6. Correlations between annoyance estimations and selected psychoacoustic parameters with defined tonality regions.
Pearson Correlation—Listening Test 1 (Tonality)
AnnoyanceLoudness
(ISO)
Sharpness
(ISO + Aures)
Tonality LOW
(DIN)
Tonality MID
(DIN)
Tonality HIGH
(DIN)
Tonality LOW (HMS)Tonality MID (HMS)Tonality HIGH
(HMS)
Annoyance10.963 **0.763 **−0.200−0.260 *0.249 *0.354 **0.225 *0.454 **
Loudness (ISO) 10.778 **−0.133−0.1550.247 *0.386 **0.324 **0.469 **
Sharpness (ISO + Aures) 1−0.0910.0310.0460.272 **0.247 *0.439 **
Tonality LOW (DIN) 10.349 **−0.0190.692 **0.321 **0.018
Tonality MID (DIN) 1−0.2380.1840.6960.034
Tonality HIGH (DIN) 10.342 **0.0470.572 **
Tonality LOW (HMS) 10.543 **0.539 **
Tonality MID (HMS) 10.322 **
Tonality HIGH (HMS) 1
* Correlation is significant at the 0.05 level (2-tailed) ** Correlation is significant at the 0.01 level (2-tailed).
Table 7. The 5 × 3 and 3 × 3 factorial designs (loudness vs. sharpness).
The 5 × 3 and 3 × 3 Factorial Designs on Loudness and Sharpness
Stimulus #Experiment DesignLoudness (sone)Sharpness (acum)
15 × 313.12.4
25 × 313.32.97
35 × 313.43.47
43 × 3 & 5 × 316.42.42
53 × 3 & 5 × 316.22.9
63 × 3 & 5 × 3163.34
73 × 3 & 5 × 320.82.48
83 × 3 & 5 × 320.22.87
93 × 3 & 5 × 3203.34
103 × 3 & 5 × 3252.57
113 × 3 & 5 × 3252.93
123 × 3 & 5 × 3253.34
135 × 3302.65
145 × 3302.91
155 × 3303.29
Table 8. Results of the repeated measures ANOVA for loudness, sharpness and loudness–sharpness interaction.
PartLoudnessSharpnessLoudness × Sharpness
1F(1.15, 9.37) = 44.73
p < 0.001, partial η2 = 0.85
F(2, 16) = 11.46
p < 0.001, partial η2 = 0.59
F(4, 32) = 2.13
p = 0.100, partial η2 = 0.21
2F(1.15, 9.18) = 46.26
p < 0.001, partial η2 = 0.86
F(1.14, 9.13) = 20.15
p < 0.001, partial η2 = 0.72
F(1.88, 15) = 1.27
p = 0.308, partial η2 = 0.14
3F(2, 16) = 36.05
p < 0.001, partial η2 = 0.82
F(1.2, 9.57) = 16.32
p = 0.002, partial η2 = 0.67
F(4, 32) = 1.36
p = 0.270, partial η2 = 0.15
4F(1.31, 10.47) = 53.77
p < 0.001, partial η2 = 0.87
F(1.13, 9) = 24.56
p < 0.001, partial η2 = 0.75
F(8, 64) = 1.92
p = 0.072, partial η2 = 0.19
Disclaimer/Publisher’s Note: The statements, opinions and data contained in all publications are solely those of the individual author(s) and contributor(s) and not of MDPI and/or the editor(s). MDPI and/or the editor(s) disclaim responsibility for any injury to people or property resulting from any ideas, methods, instructions or products referred to in the content.

