


Blind Spot Detection Radar System Design for Safe Driving of Smart Vehicles

Abstract
:1. Introduction
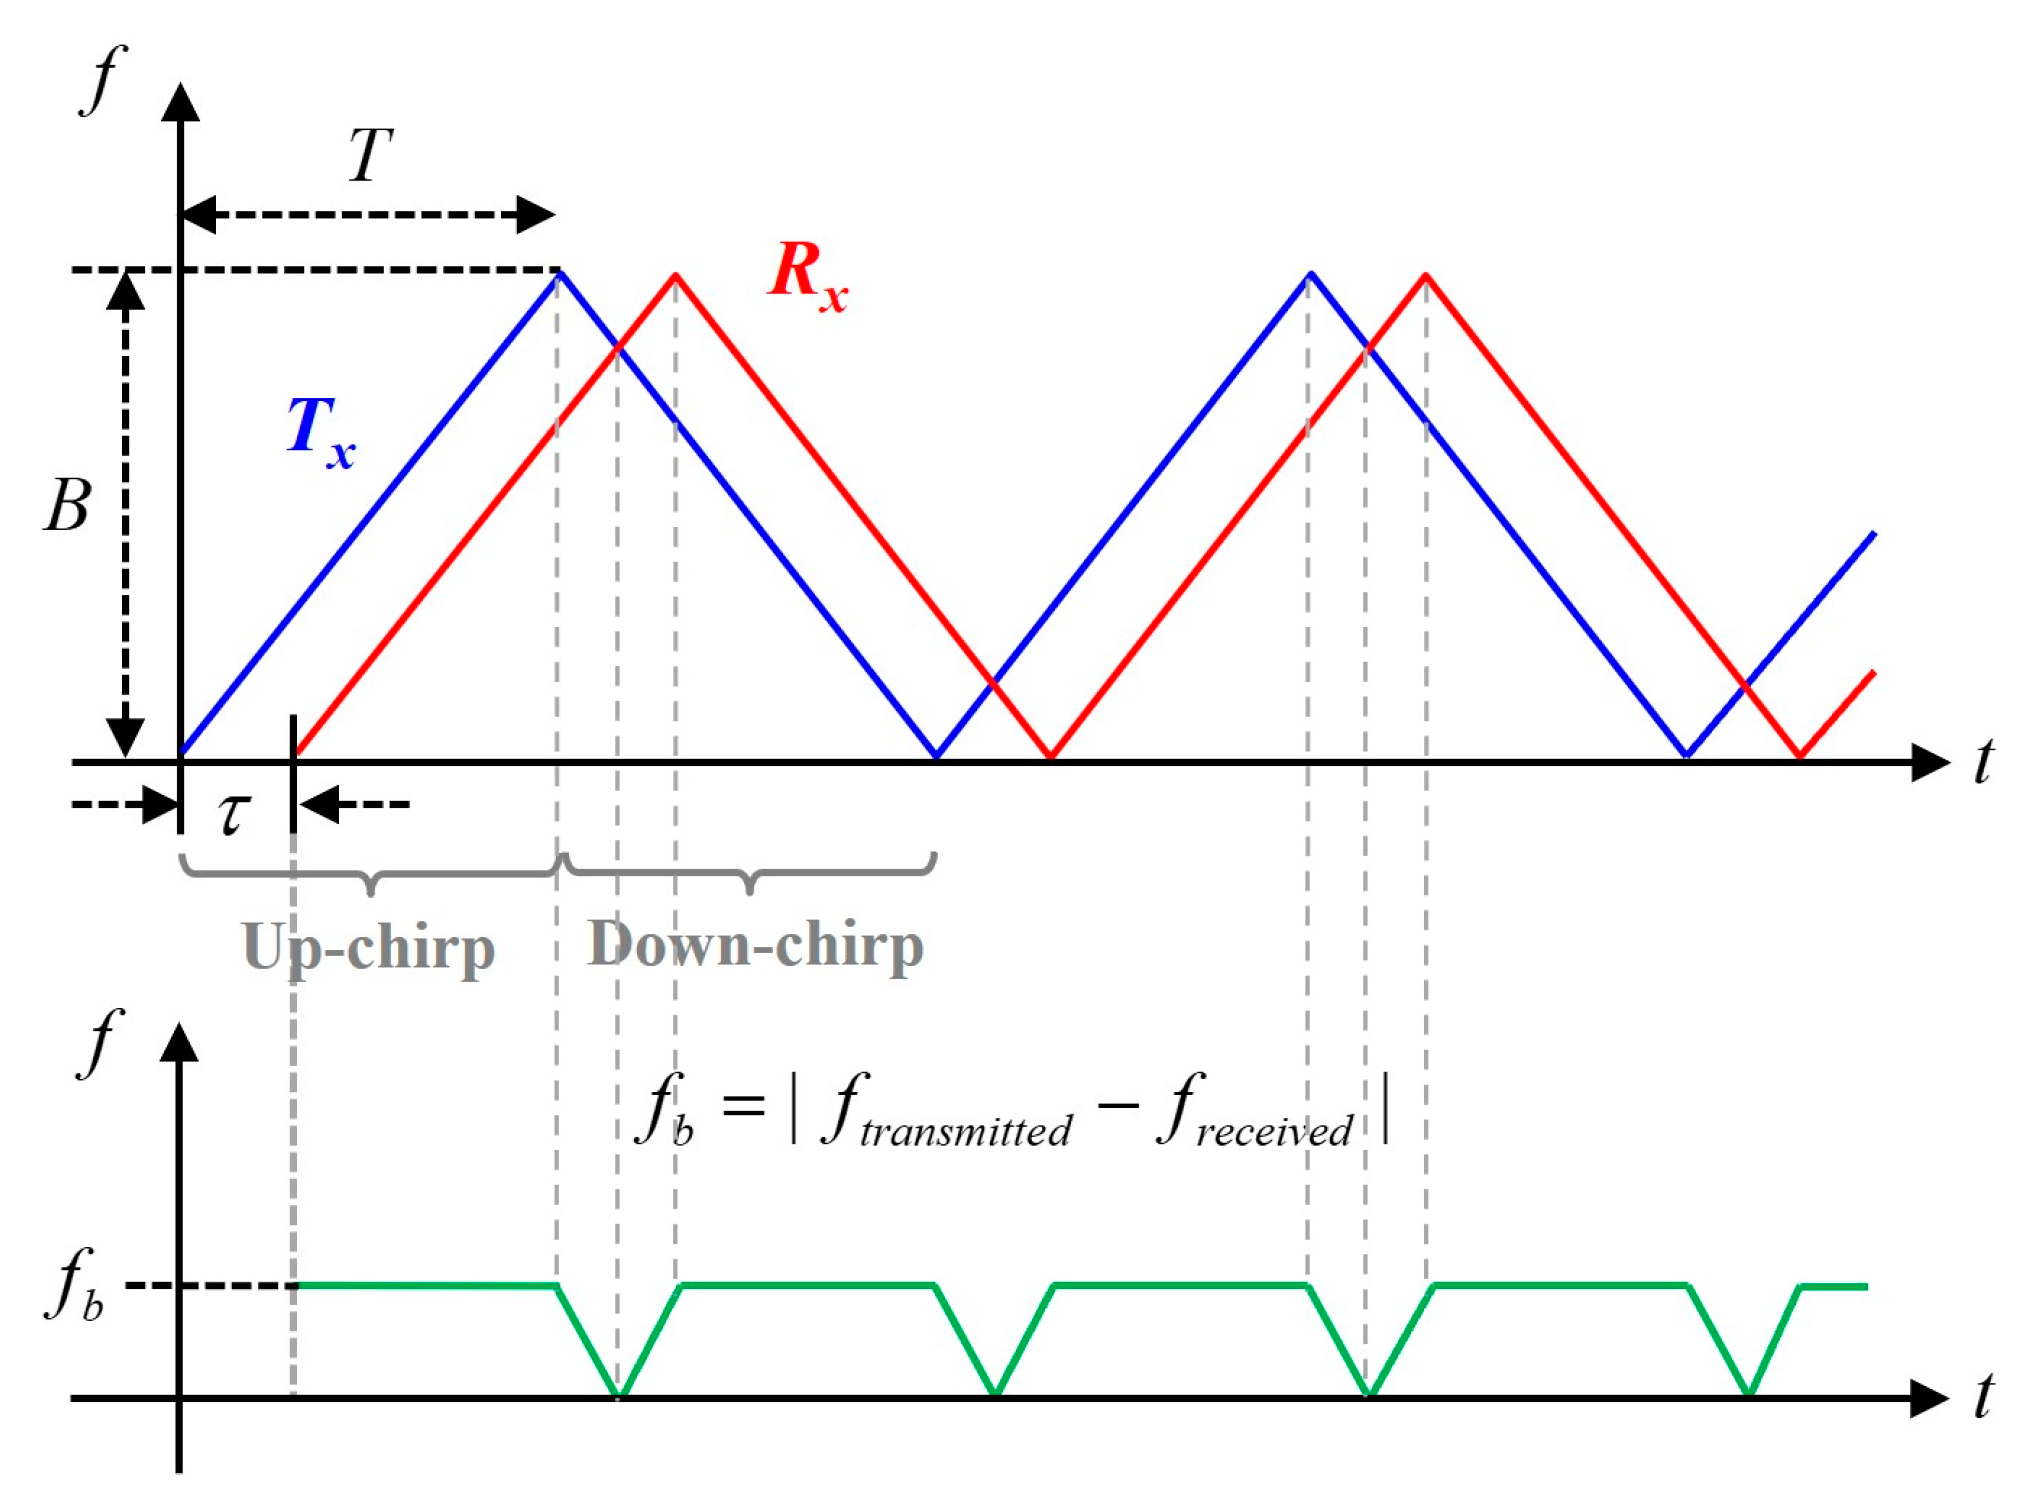
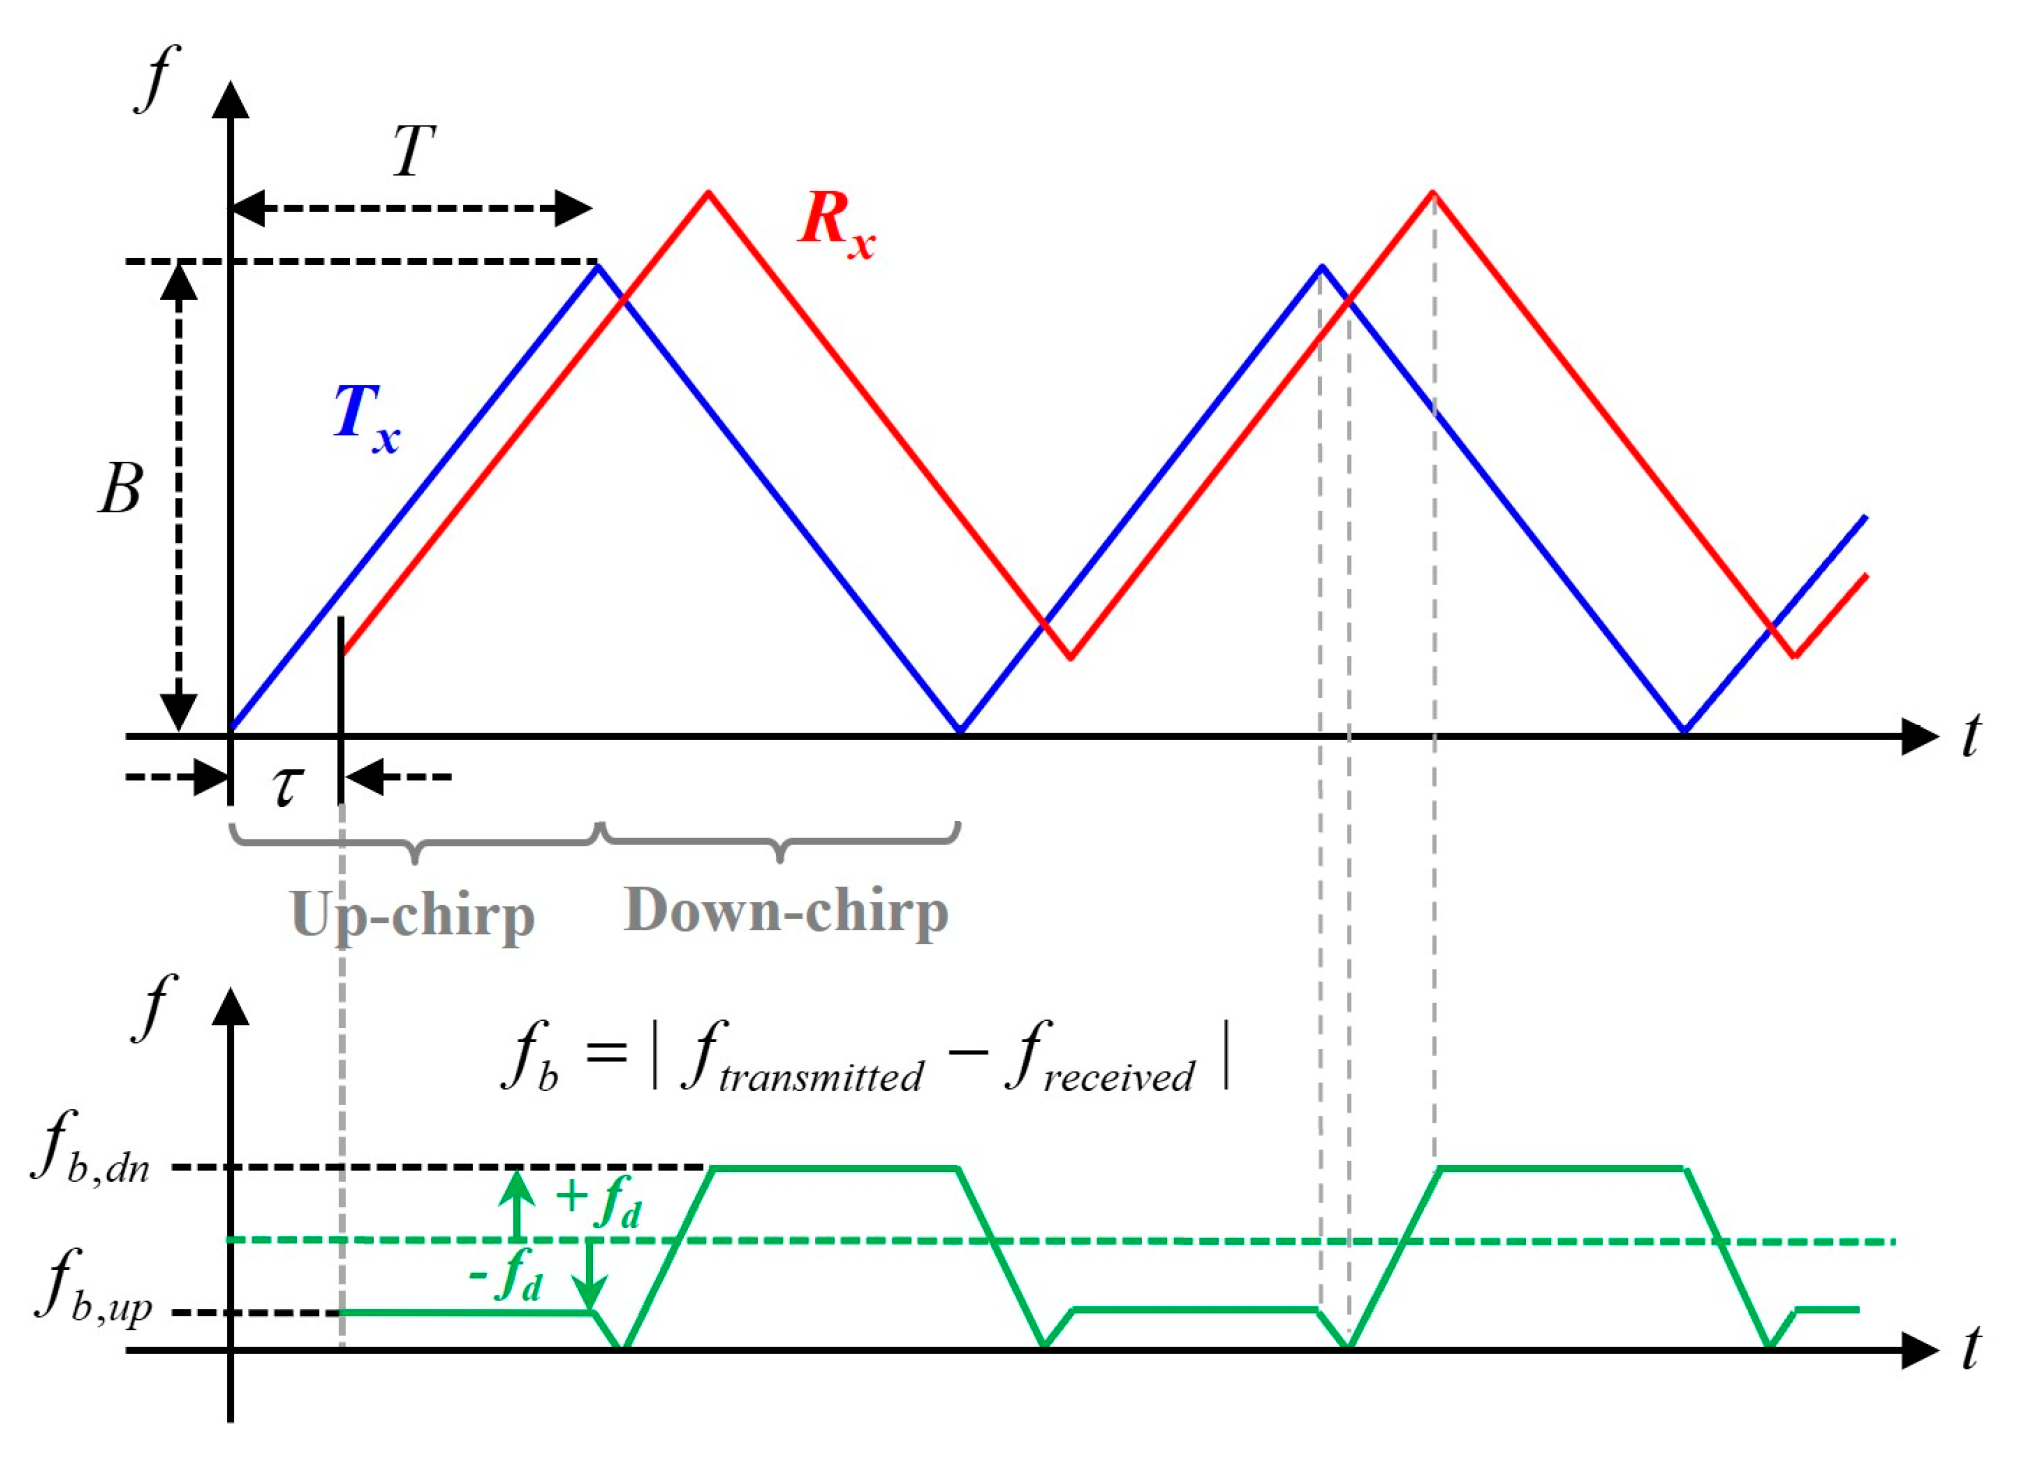
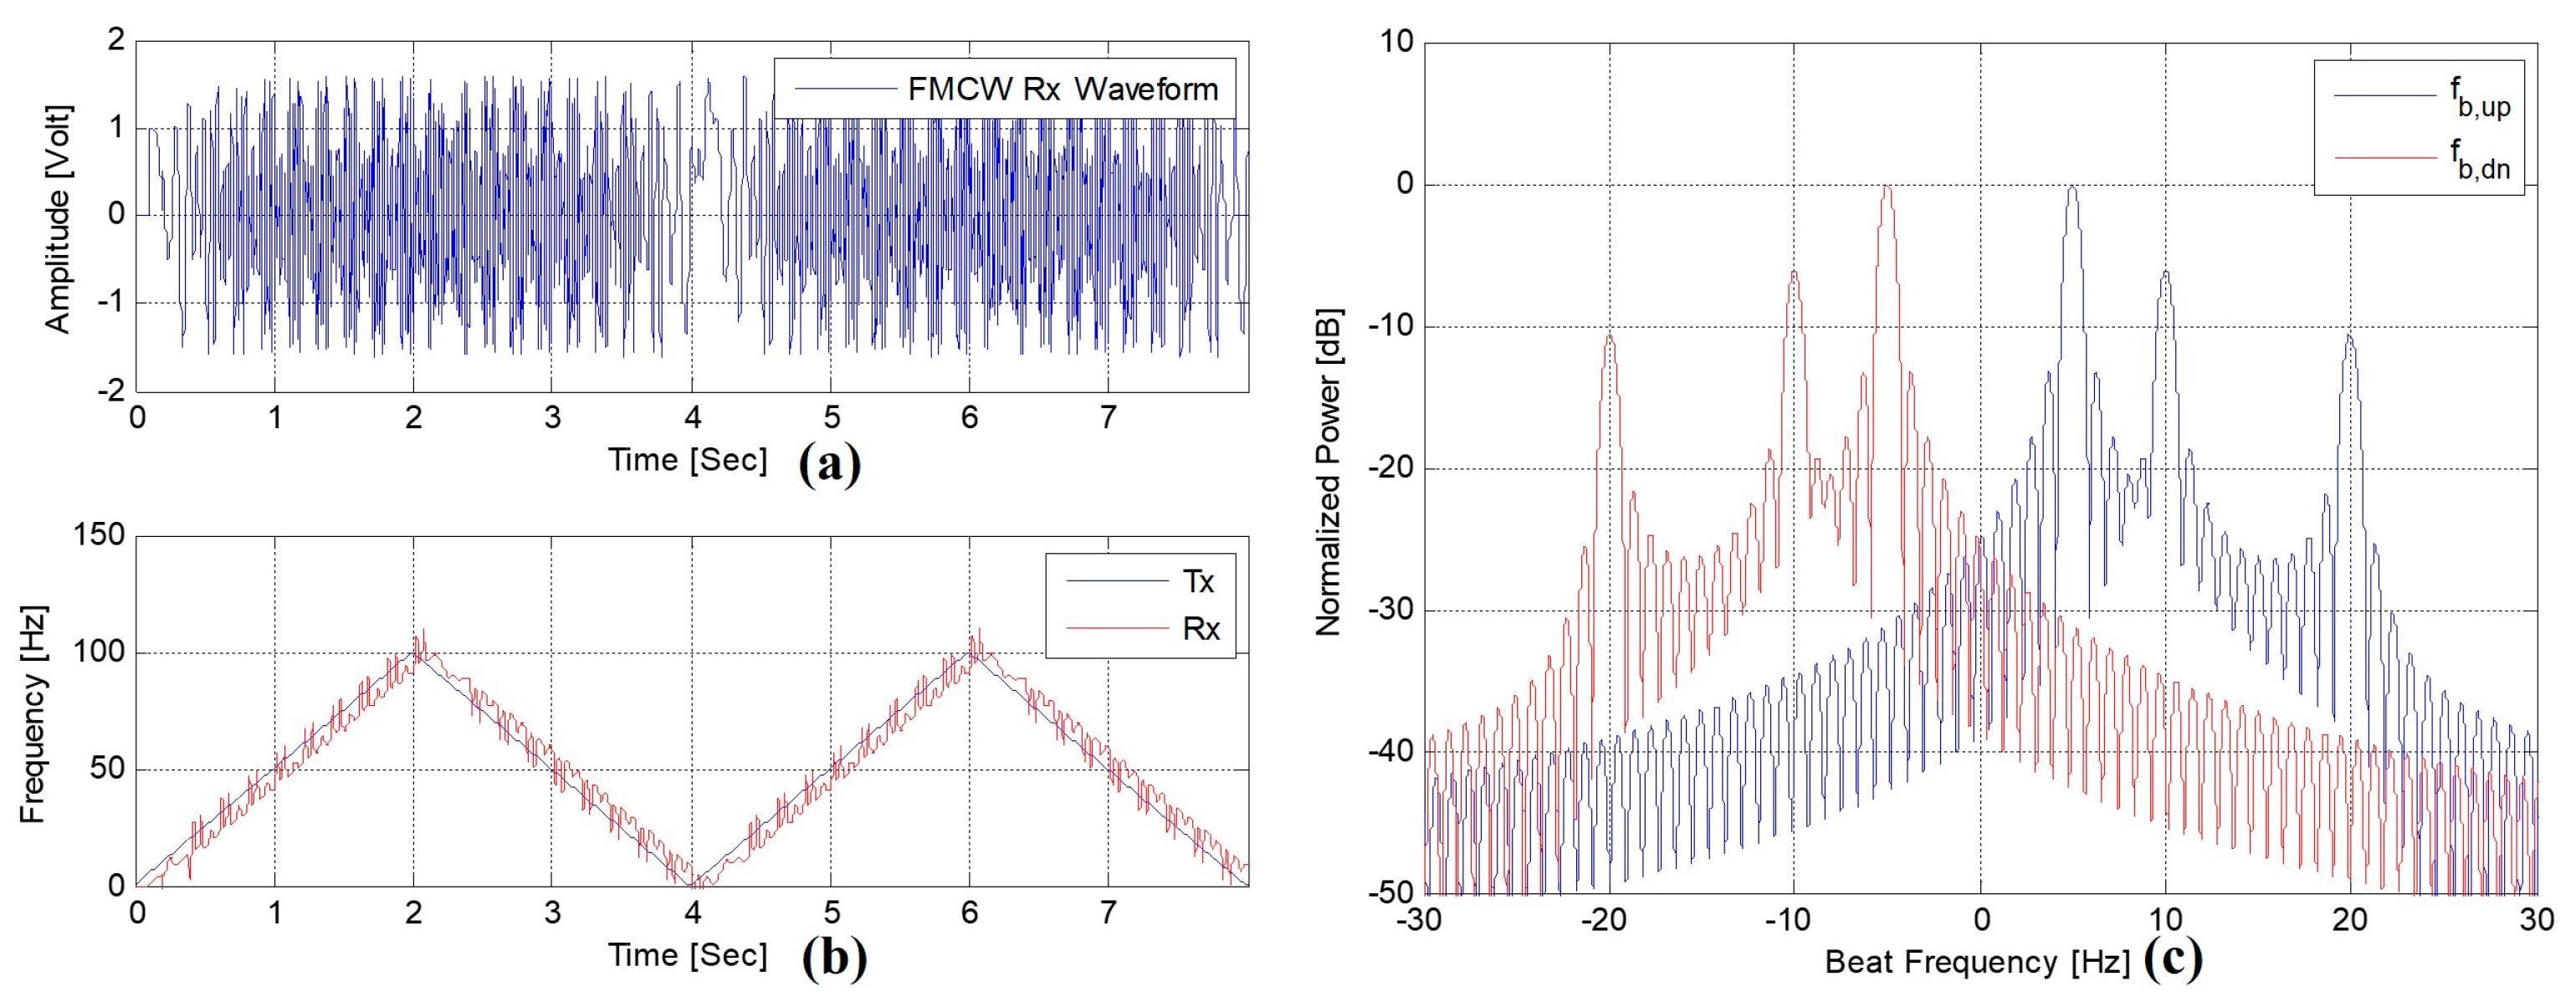
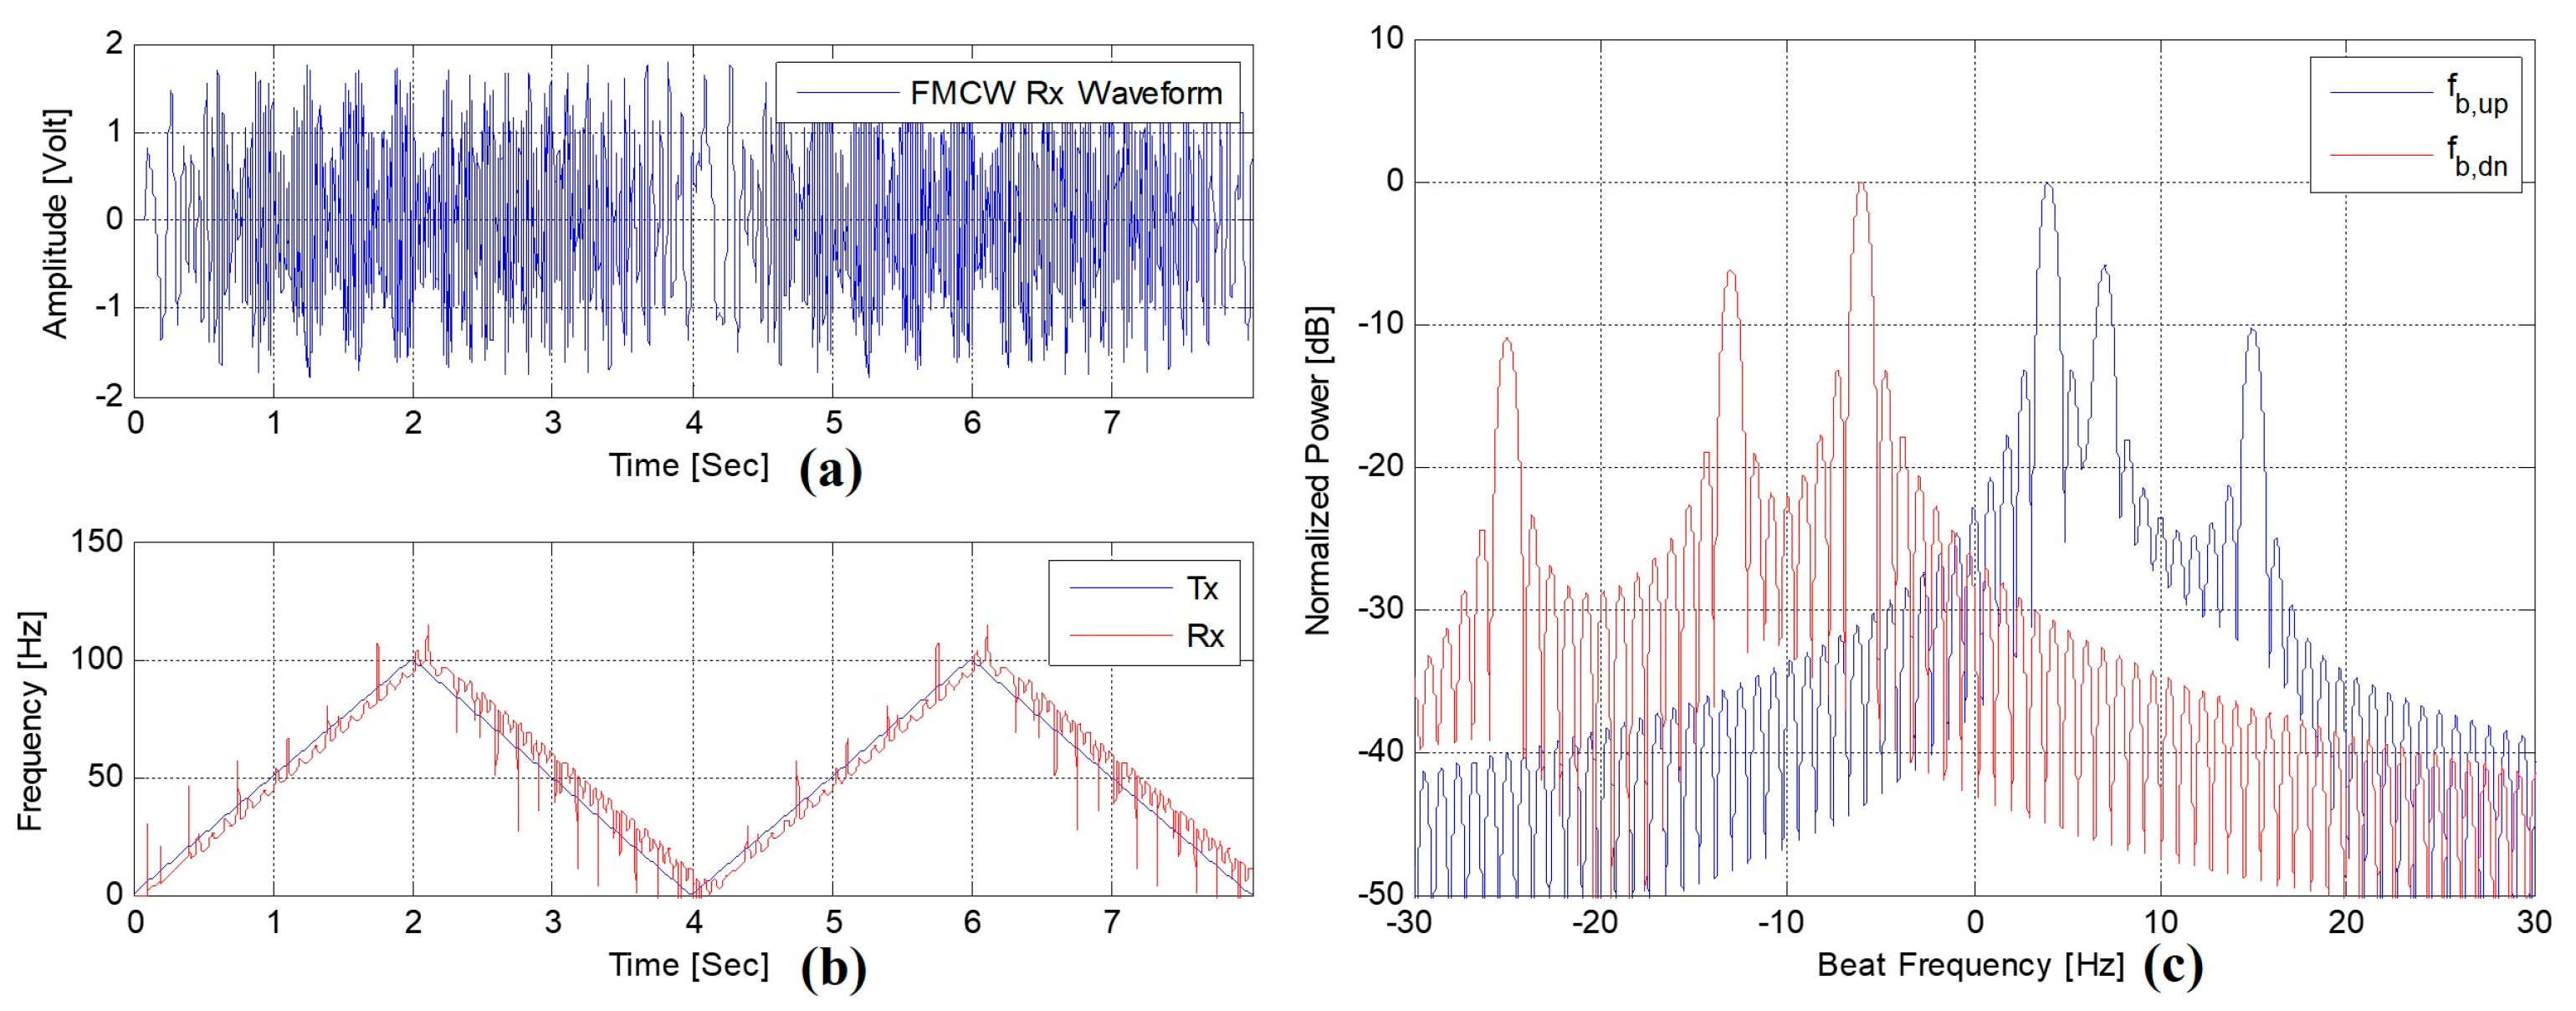
2. FMCW Radar Principle
3. Tracking System Algorithm
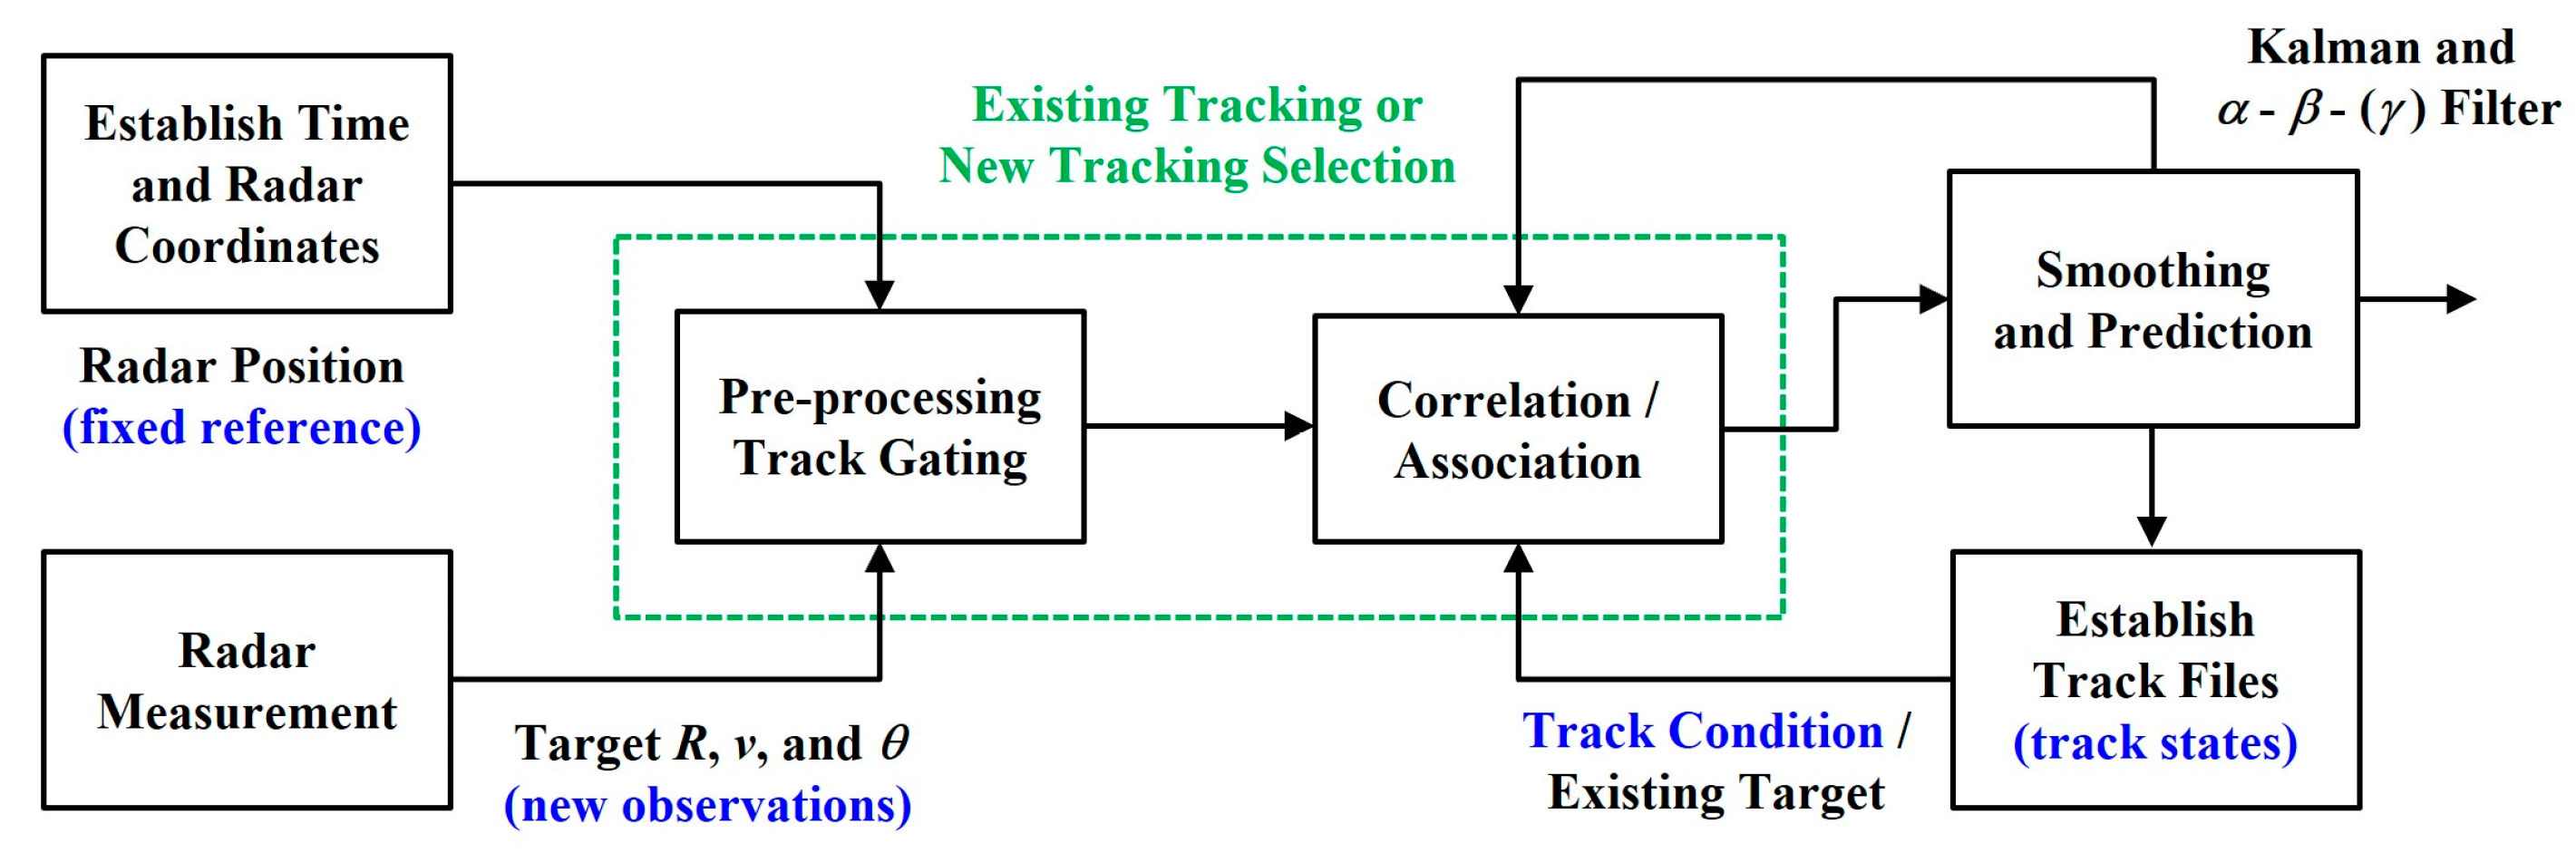
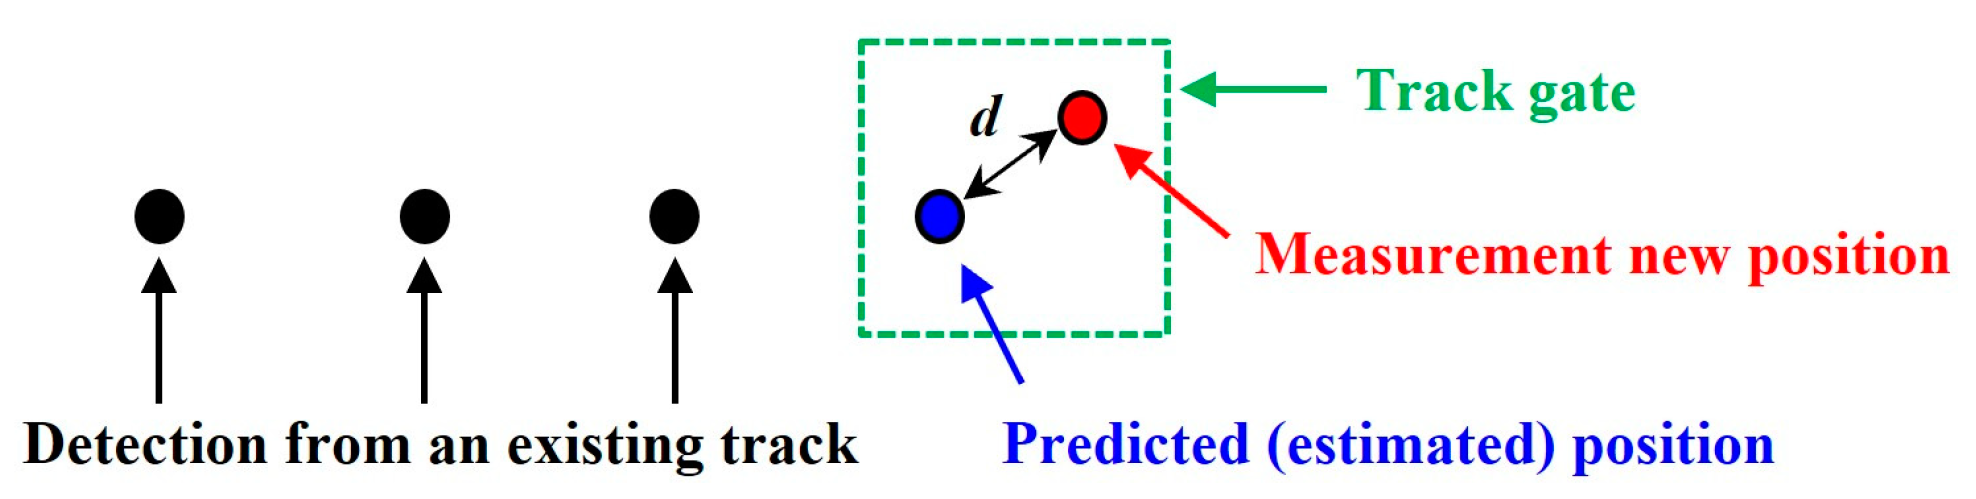
3.1. Target Tracking Procedure
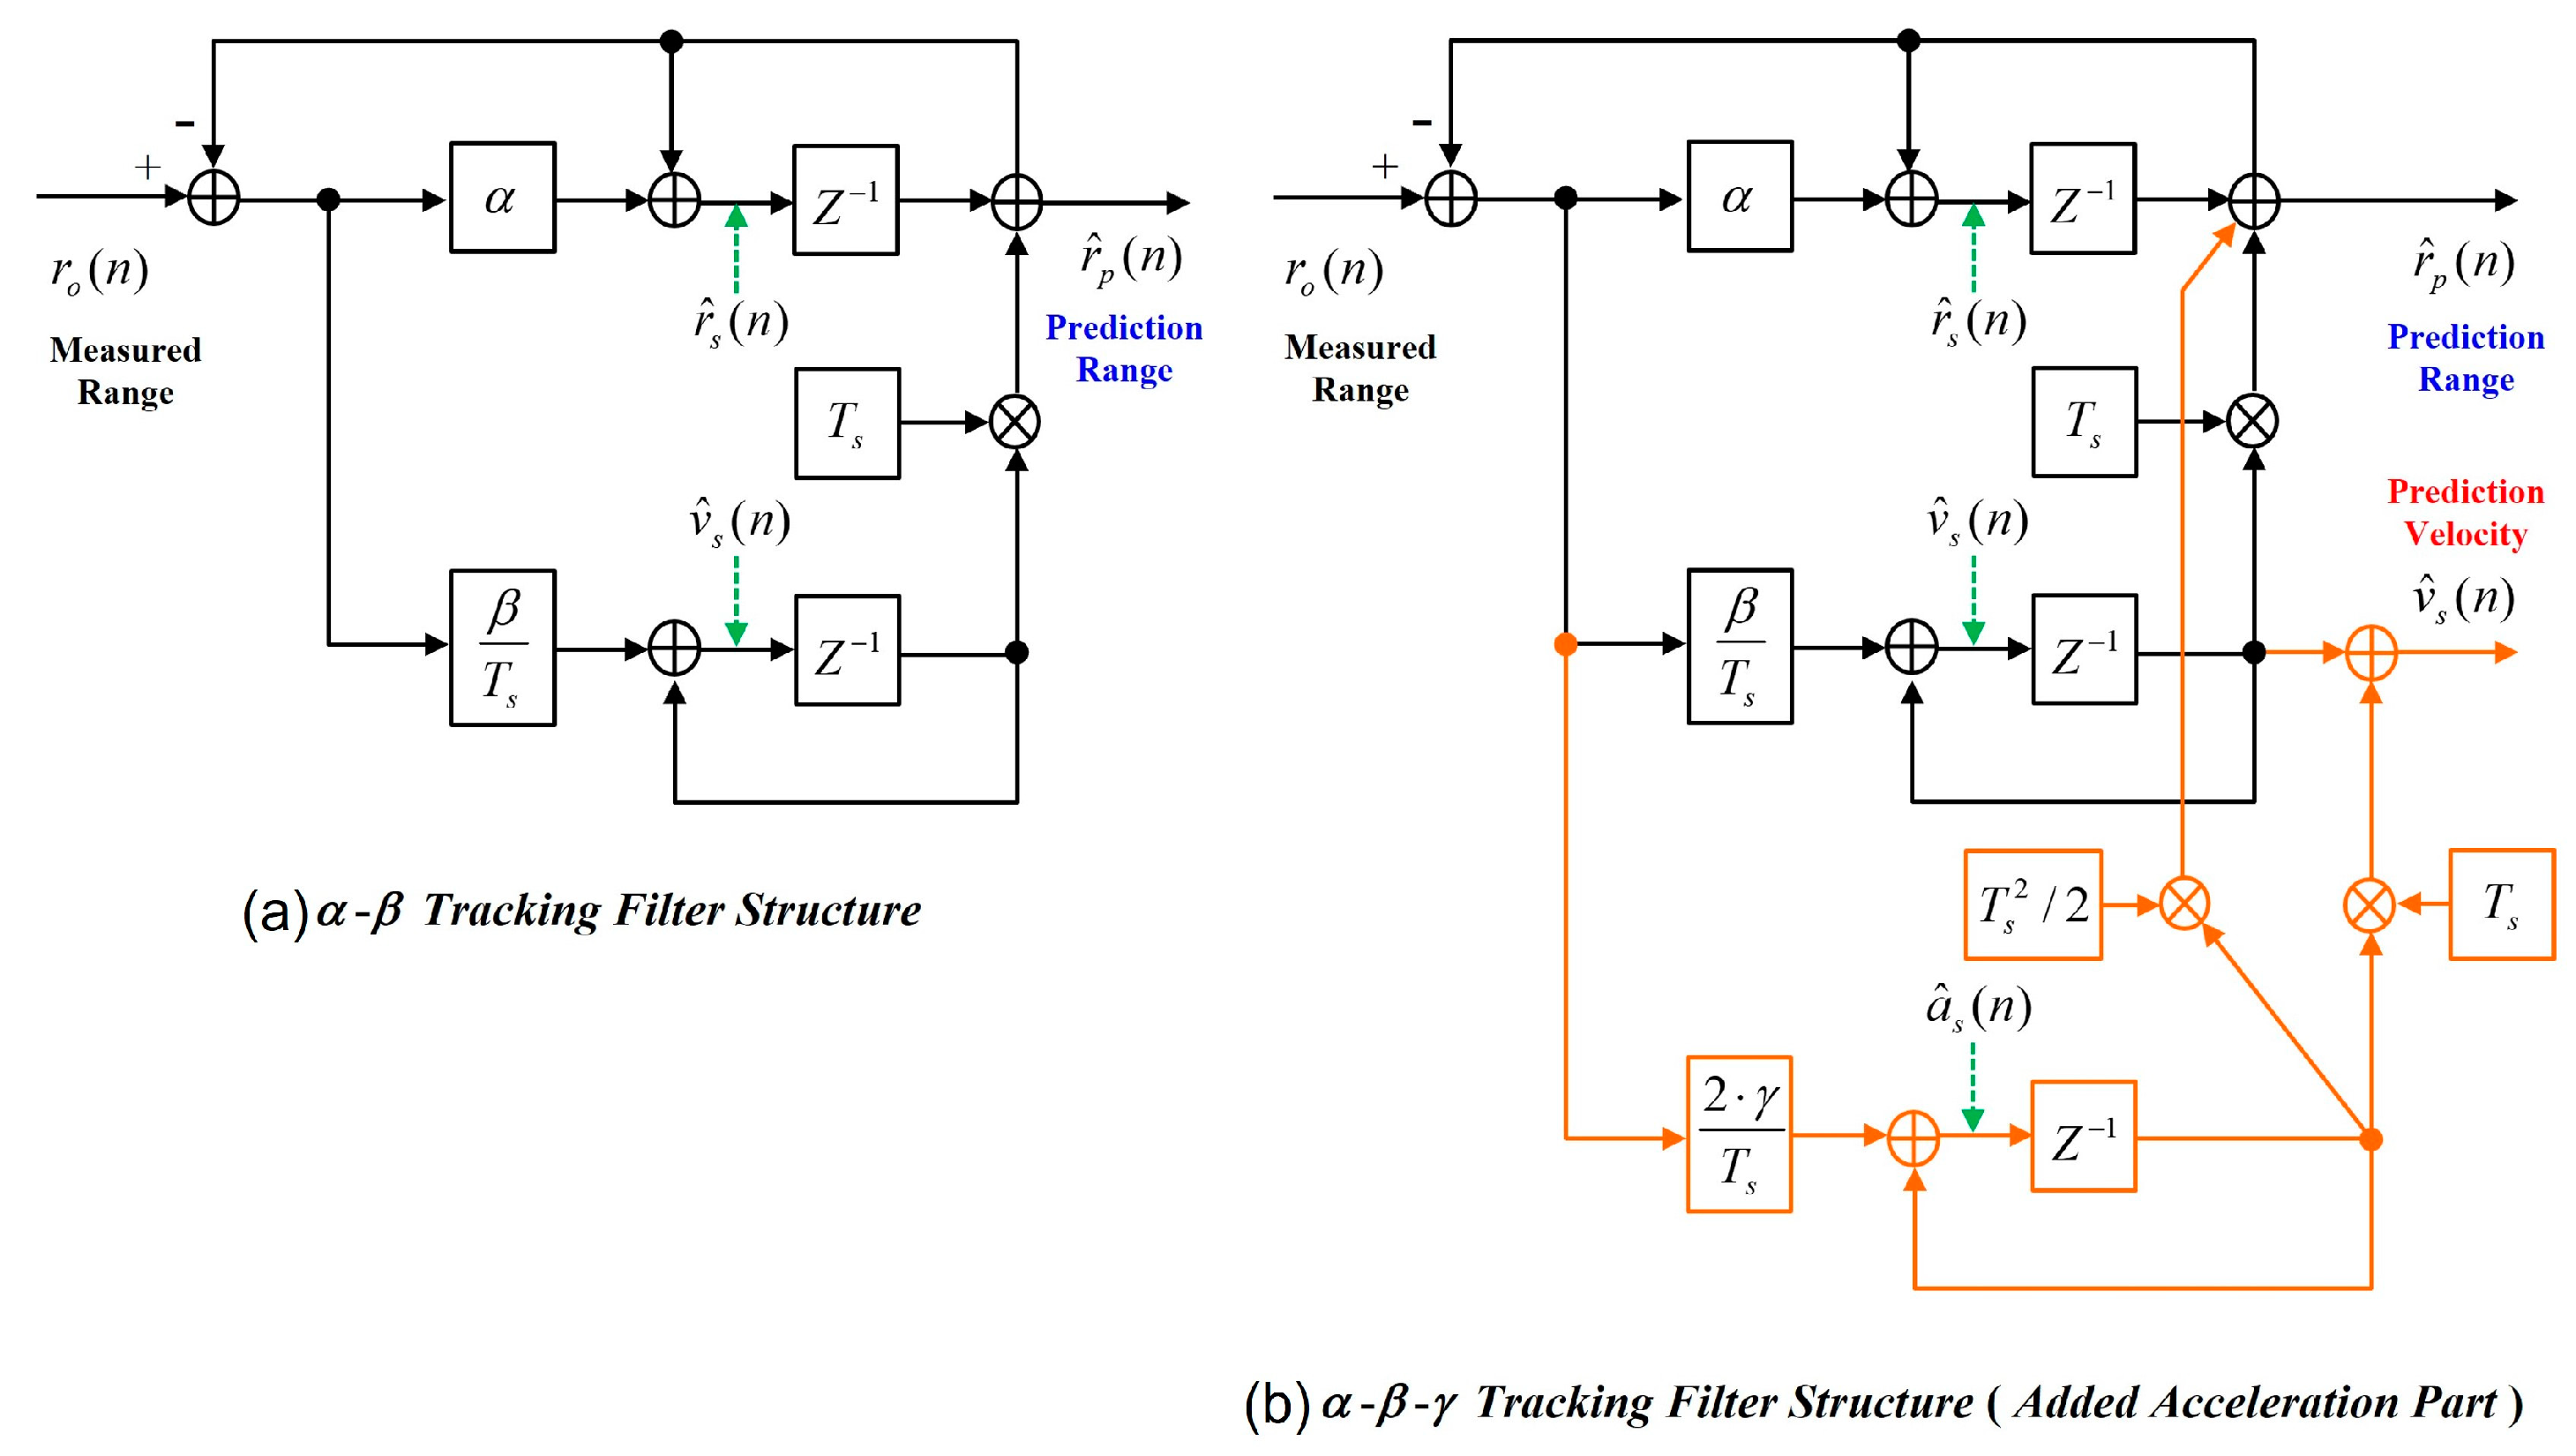
3.2. Target Filter
4. BSD Radar System Design
4.1. System Architecture
4.2. System Specification
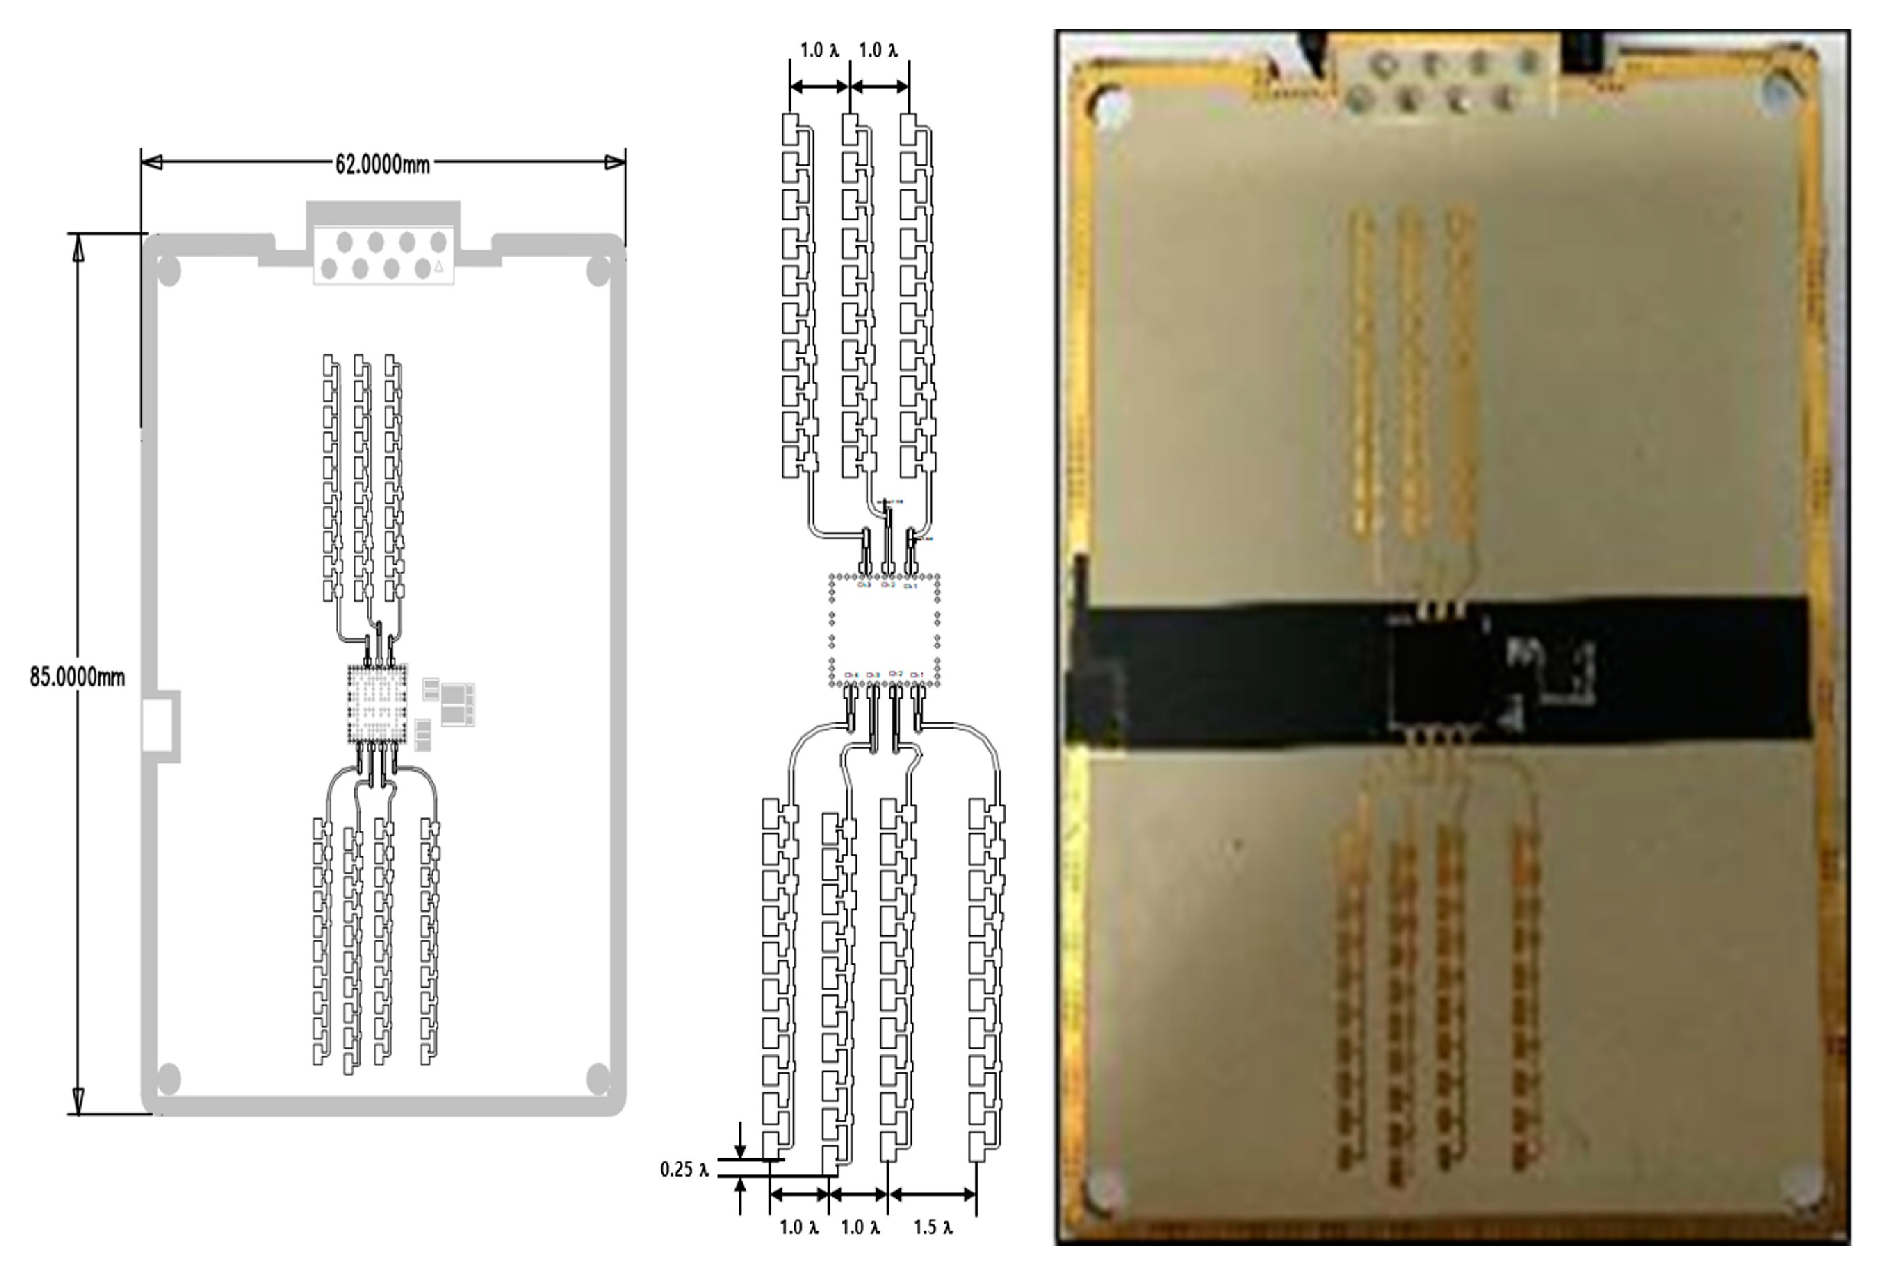
4.3. System Design
5. BSD Radar System Performance Test
5.1. Performance Test Configuration
5.2. Designed BSD Radar Performance
- a.
- Maximum detection range: The simulator was set up at distances of 50 m, 52 m, and 55 m to simulate the distance of a forward vehicle. A passenger car size of 10 m2 was assumed as the target size. The results were compared with the simulation distance to verify whether the detection accuracy was within ±0.5 mm.
- b.
- Maximum detection speed: The target simulator was set up with a forward vehicle at a distance of 50 m, driving at speeds of 130 km/h, 140 km/h, and 150 km/h. The target size was assumed to be a passenger car with a size of 10 m2. The results were compared with the simulation speed to verify whether the detection accuracy was within ±1 km/h.
- c.
- Response time: The target simulator was set up with a forward vehicle at a distance of 50 m, driving at a speed of 100 km/h. The target size was assumed to be a passenger car with a size of 10 m2. The results were compared with the target detection response time to verify whether the detection occurred within 50 ms.
- d.
- Maximum detection angle: A 10 m2 corner reflector for vehicle modeling was installed at points corresponding to ±75° in the left and right directions. The results were compared with the sensor detection angle to verify whether the detection accuracy was within ±5°.
- e.
- Distance resolution: Two 10 m2 corner reflectors for vehicle modeling were installed at a distance of 1.5 m apart in the forward and backward directions. The results were compared with the sensor detection distance to confirm the distance resolution (1.5 m).
5.3. Performance Test Requirements
- a.
- Target vehicle overtaking test vehicle
- The warning should not be activated while the target vehicle is behind Line A.
- The warning display should be activated within 500 ms after the front of the target vehicle passes Line B.
- The warning display should be maintained from the moment the front of the target vehicle passes Line B until the rear of the target vehicle completely exits Line ⑥.
- The warning display should be deactivated within 1 s after the rear of the target vehicle completely exits Line ⑥.
- b.
- Test vehicle overtaking target vehicle
- The warning should not be activated while the target vehicle is behind Line E.
- The warning display should be activated within 500 ms after the front of the target vehicle passes Line D.
- The warning display should be maintained from the moment the front of the target vehicle passes Line D until the rear of the target vehicle completely exits Line ⑤.
- a.
- Target vehicle driving from left to right
- The warning should not be activated until the target vehicle is completely positioned to the left of Line M.
- The left warning display should be activated within 500 ms after the right end of the target vehicle passes Line L.
- The warning display should be maintained from the moment the right end of the target vehicle passes Line L until the left end of the target vehicle completely passes Line ③.
- The left warning display should be deactivated within 1 s after the left end of the target vehicle completely passes Line ③.
- When the warning is deactivated, the system should not issue a warning while the target vehicle is positioned between Line K and Line G.
- The warning display should be maintained from the moment the right end of the target vehicle passes Line G until the left end of the target vehicle completely passes Line ②.
- The right warning display should be deactivated within 1 s after the left end of the target vehicle completely passes Line ②.
- b.
- Target vehicle driving from right to left
- The warning should not be activated until the target vehicle is completely to the right of Line I.
- The right warning display should be activated within 500 ms after the left end of the target vehicle passes Line H.
- The warning display should be maintained from the moment the left end of the target vehicle passes Line H until the right end of the target vehicle completely passes Line ①.
- The left warning display should be deactivated within 1 s after the right end of the target vehicle completely passes Line ①.
- When the warning is deactivated, the system should not issue a warning while the target vehicle is positioned between Line K and Line G.
- The left warning display should be activated within 500 ms after the left end of the target vehicle passes Line K.
- The warning display should be maintained from the moment the left end of the target vehicle passes Line K until the right end of the target vehicle completely passes Line ④.
- The left warning display should be deactivated within 1 s after the right end of the target vehicle completely passes Line ④.
5.4. Performance Evaluation
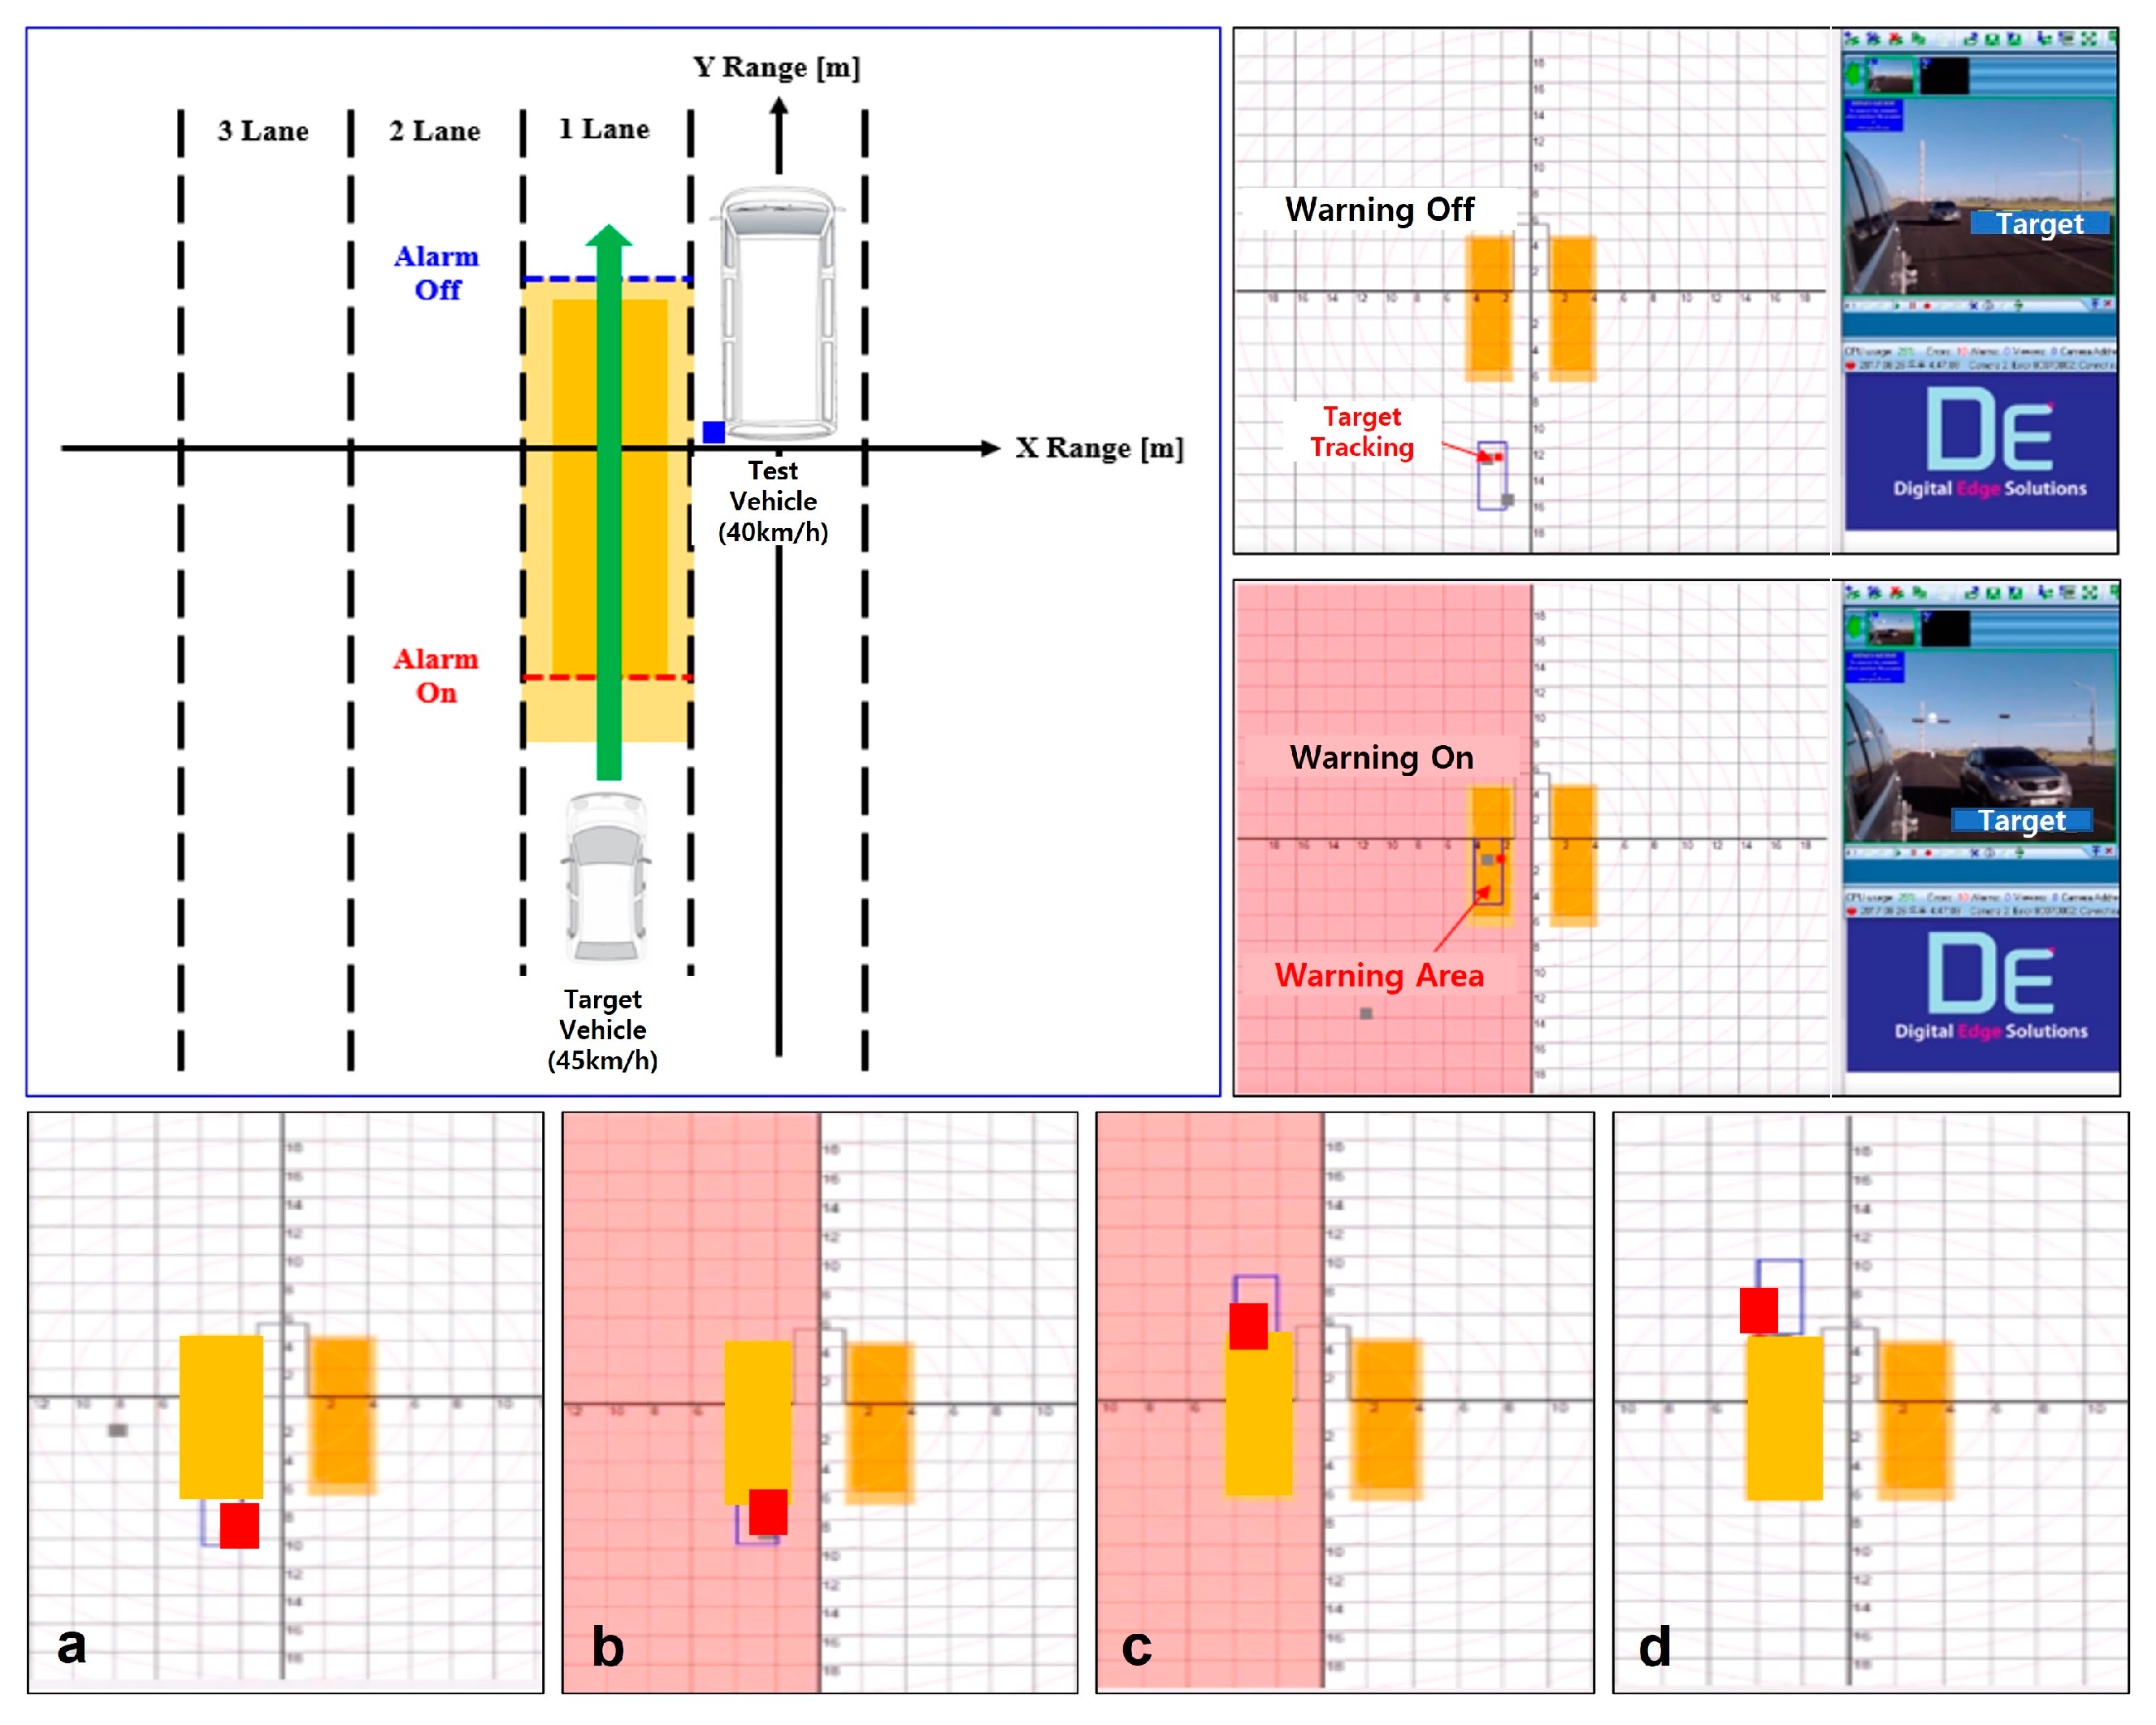
- The test vehicle drives at a constant speed of 40 kph, while the target vehicle approaches from behind at a constant speed of 45 kph and overtakes the test vehicle. The longitudinal distance of the target vehicle is measured based on the timing of when the warning was turned ON or OFF.
- Warning ON: The moment when the front of the target vehicle enters the BSD area.
- Warning OFF: The moment when the rear of the target vehicle exits the BSD area.
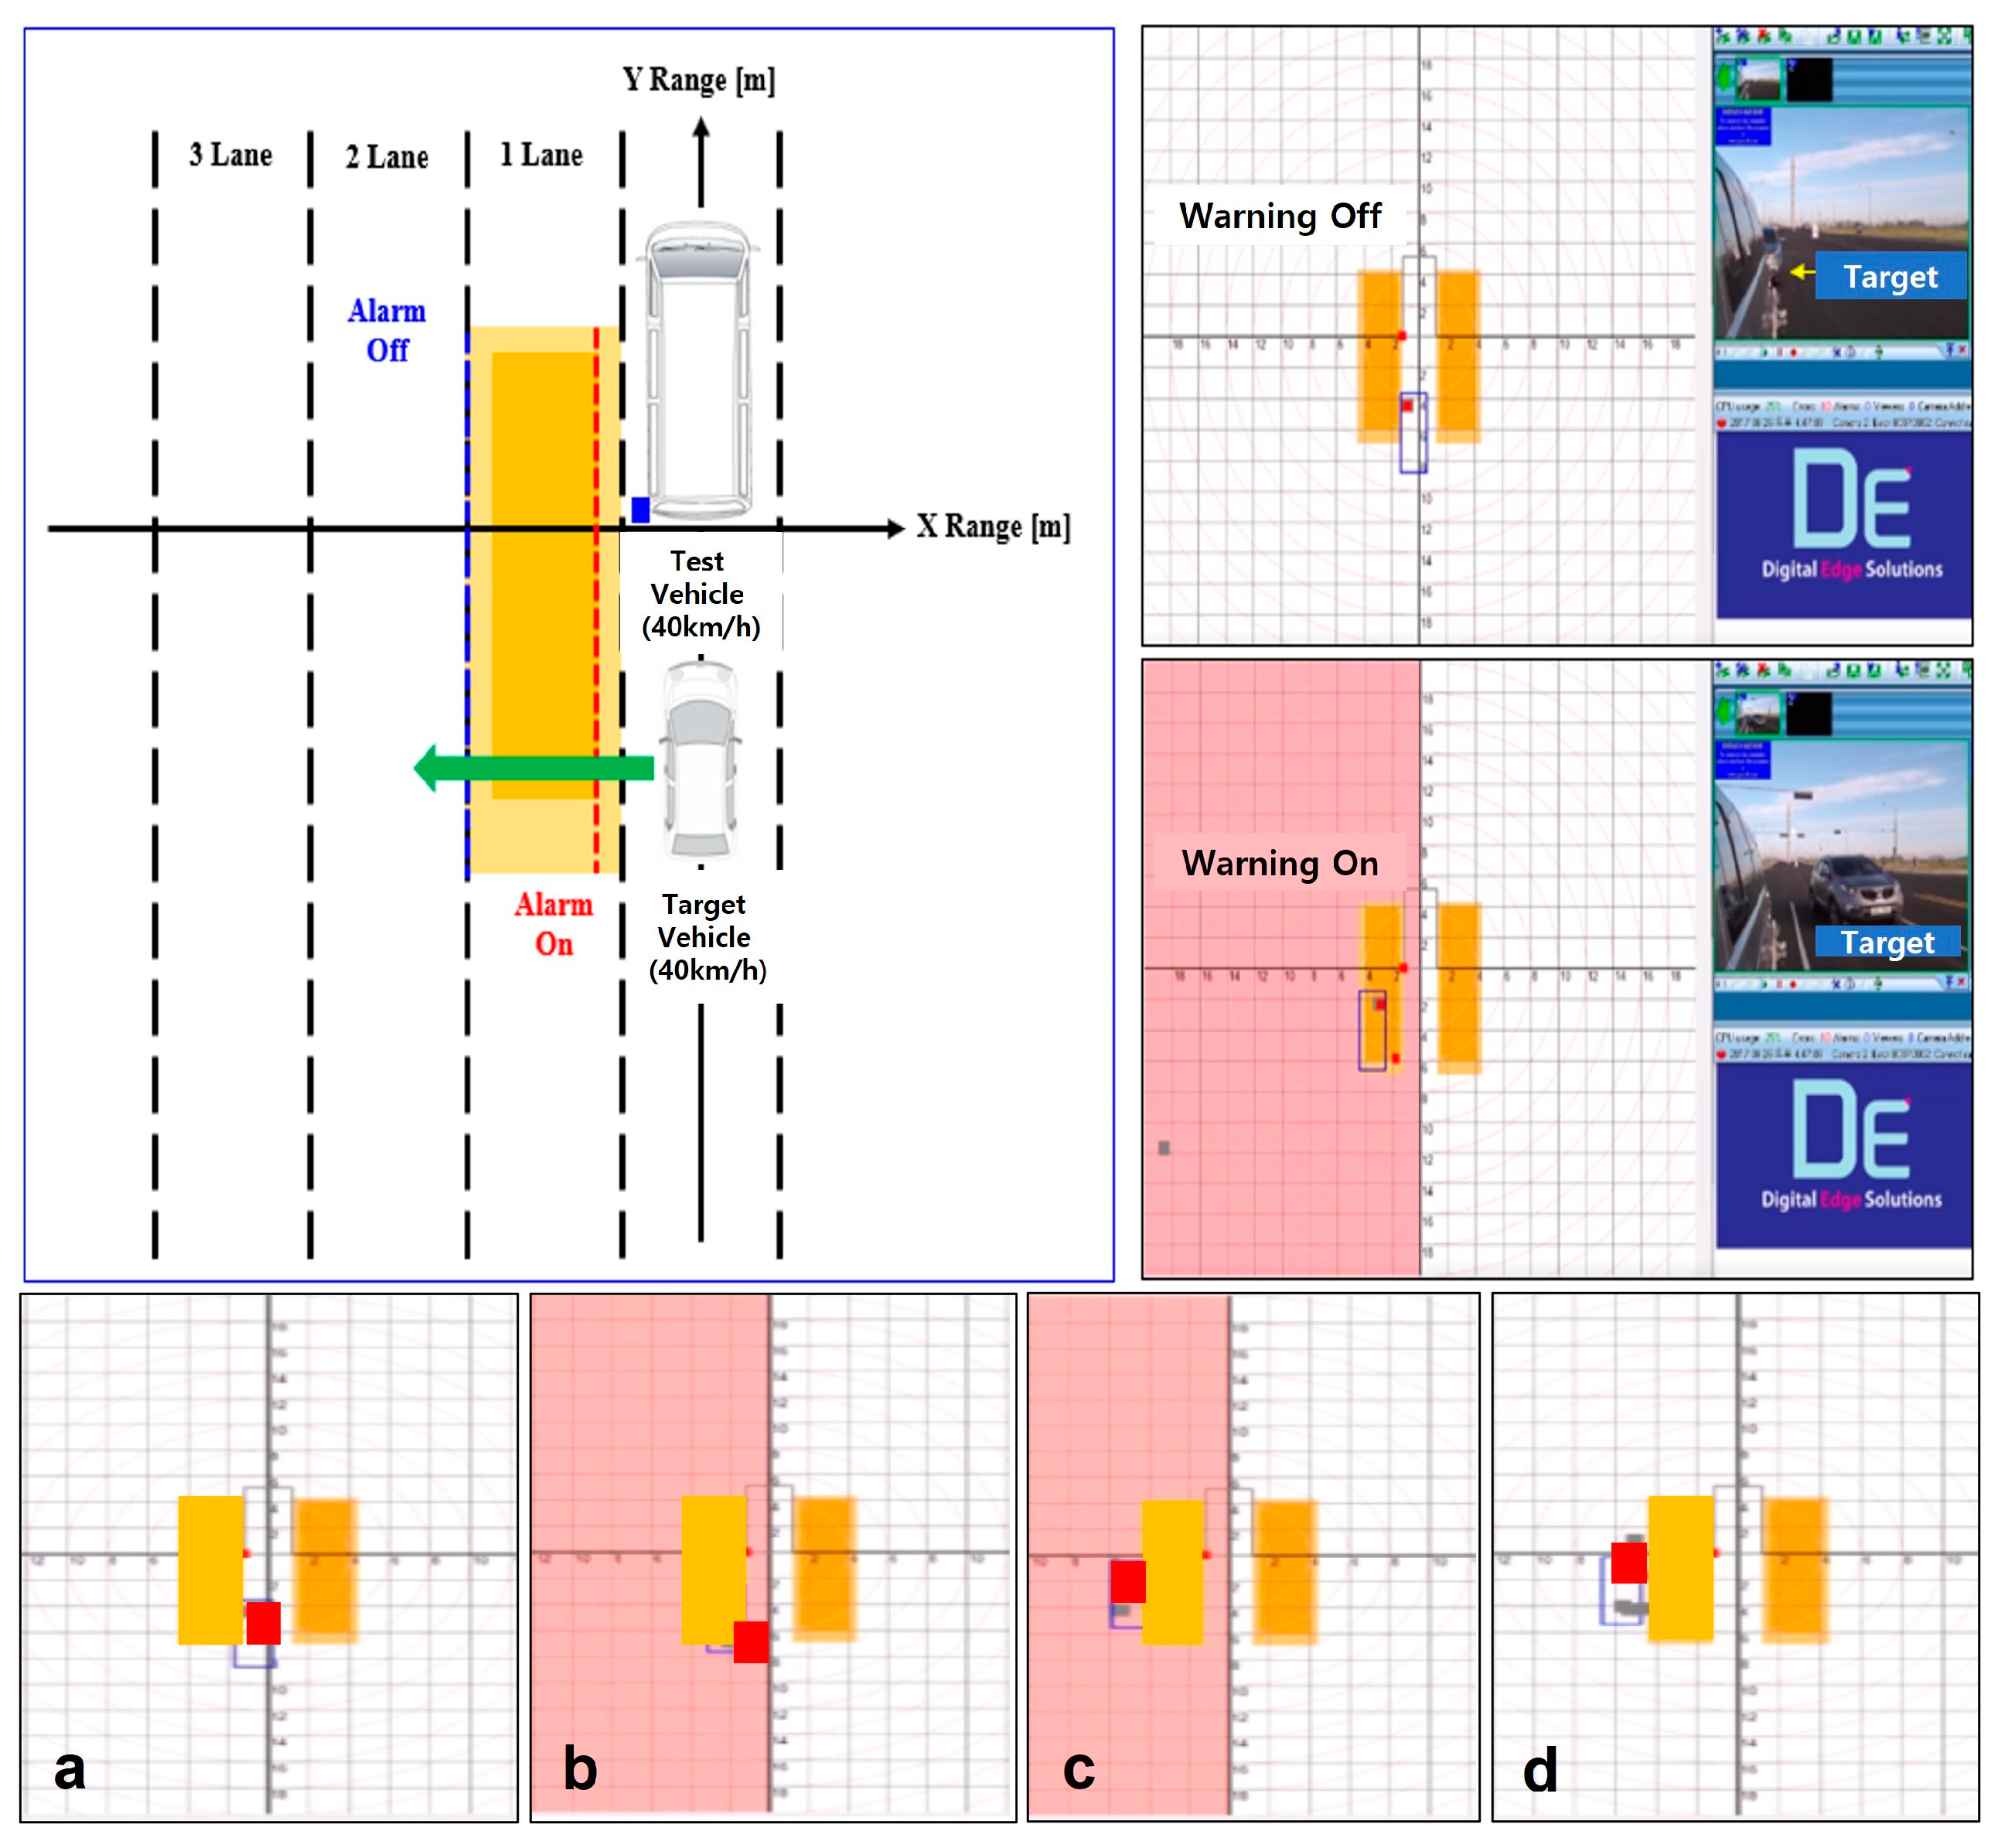
- The target vehicle drives at a constant speed of 35 kph, while the test vehicle approaches from behind at a constant speed of 40 kph and overtakes the target vehicle. The longitudinal distance of the target vehicle is measured based on the timing of when the warning is turned ON or OFF.
- Warning ON: The moment when the rear of the target vehicle enters the BSD area.
- Warning OFF: The moment when the front of the target vehicle exits the BSD area.
- The test vehicle drives at a constant speed of 40 kph, while the target vehicle changes lanes from the adjacent lane to the next lane at the same speed. The distance of the target vehicle is measured based on the timing of when the warning is turned ON or OFF.
- Warning ON: The moment when the inner side of the target vehicle relative to the test vehicle enters the BSD area.
- Warning OFF: The moment when the inner side of the target vehicle relative to the test vehicle exits the BSD area.
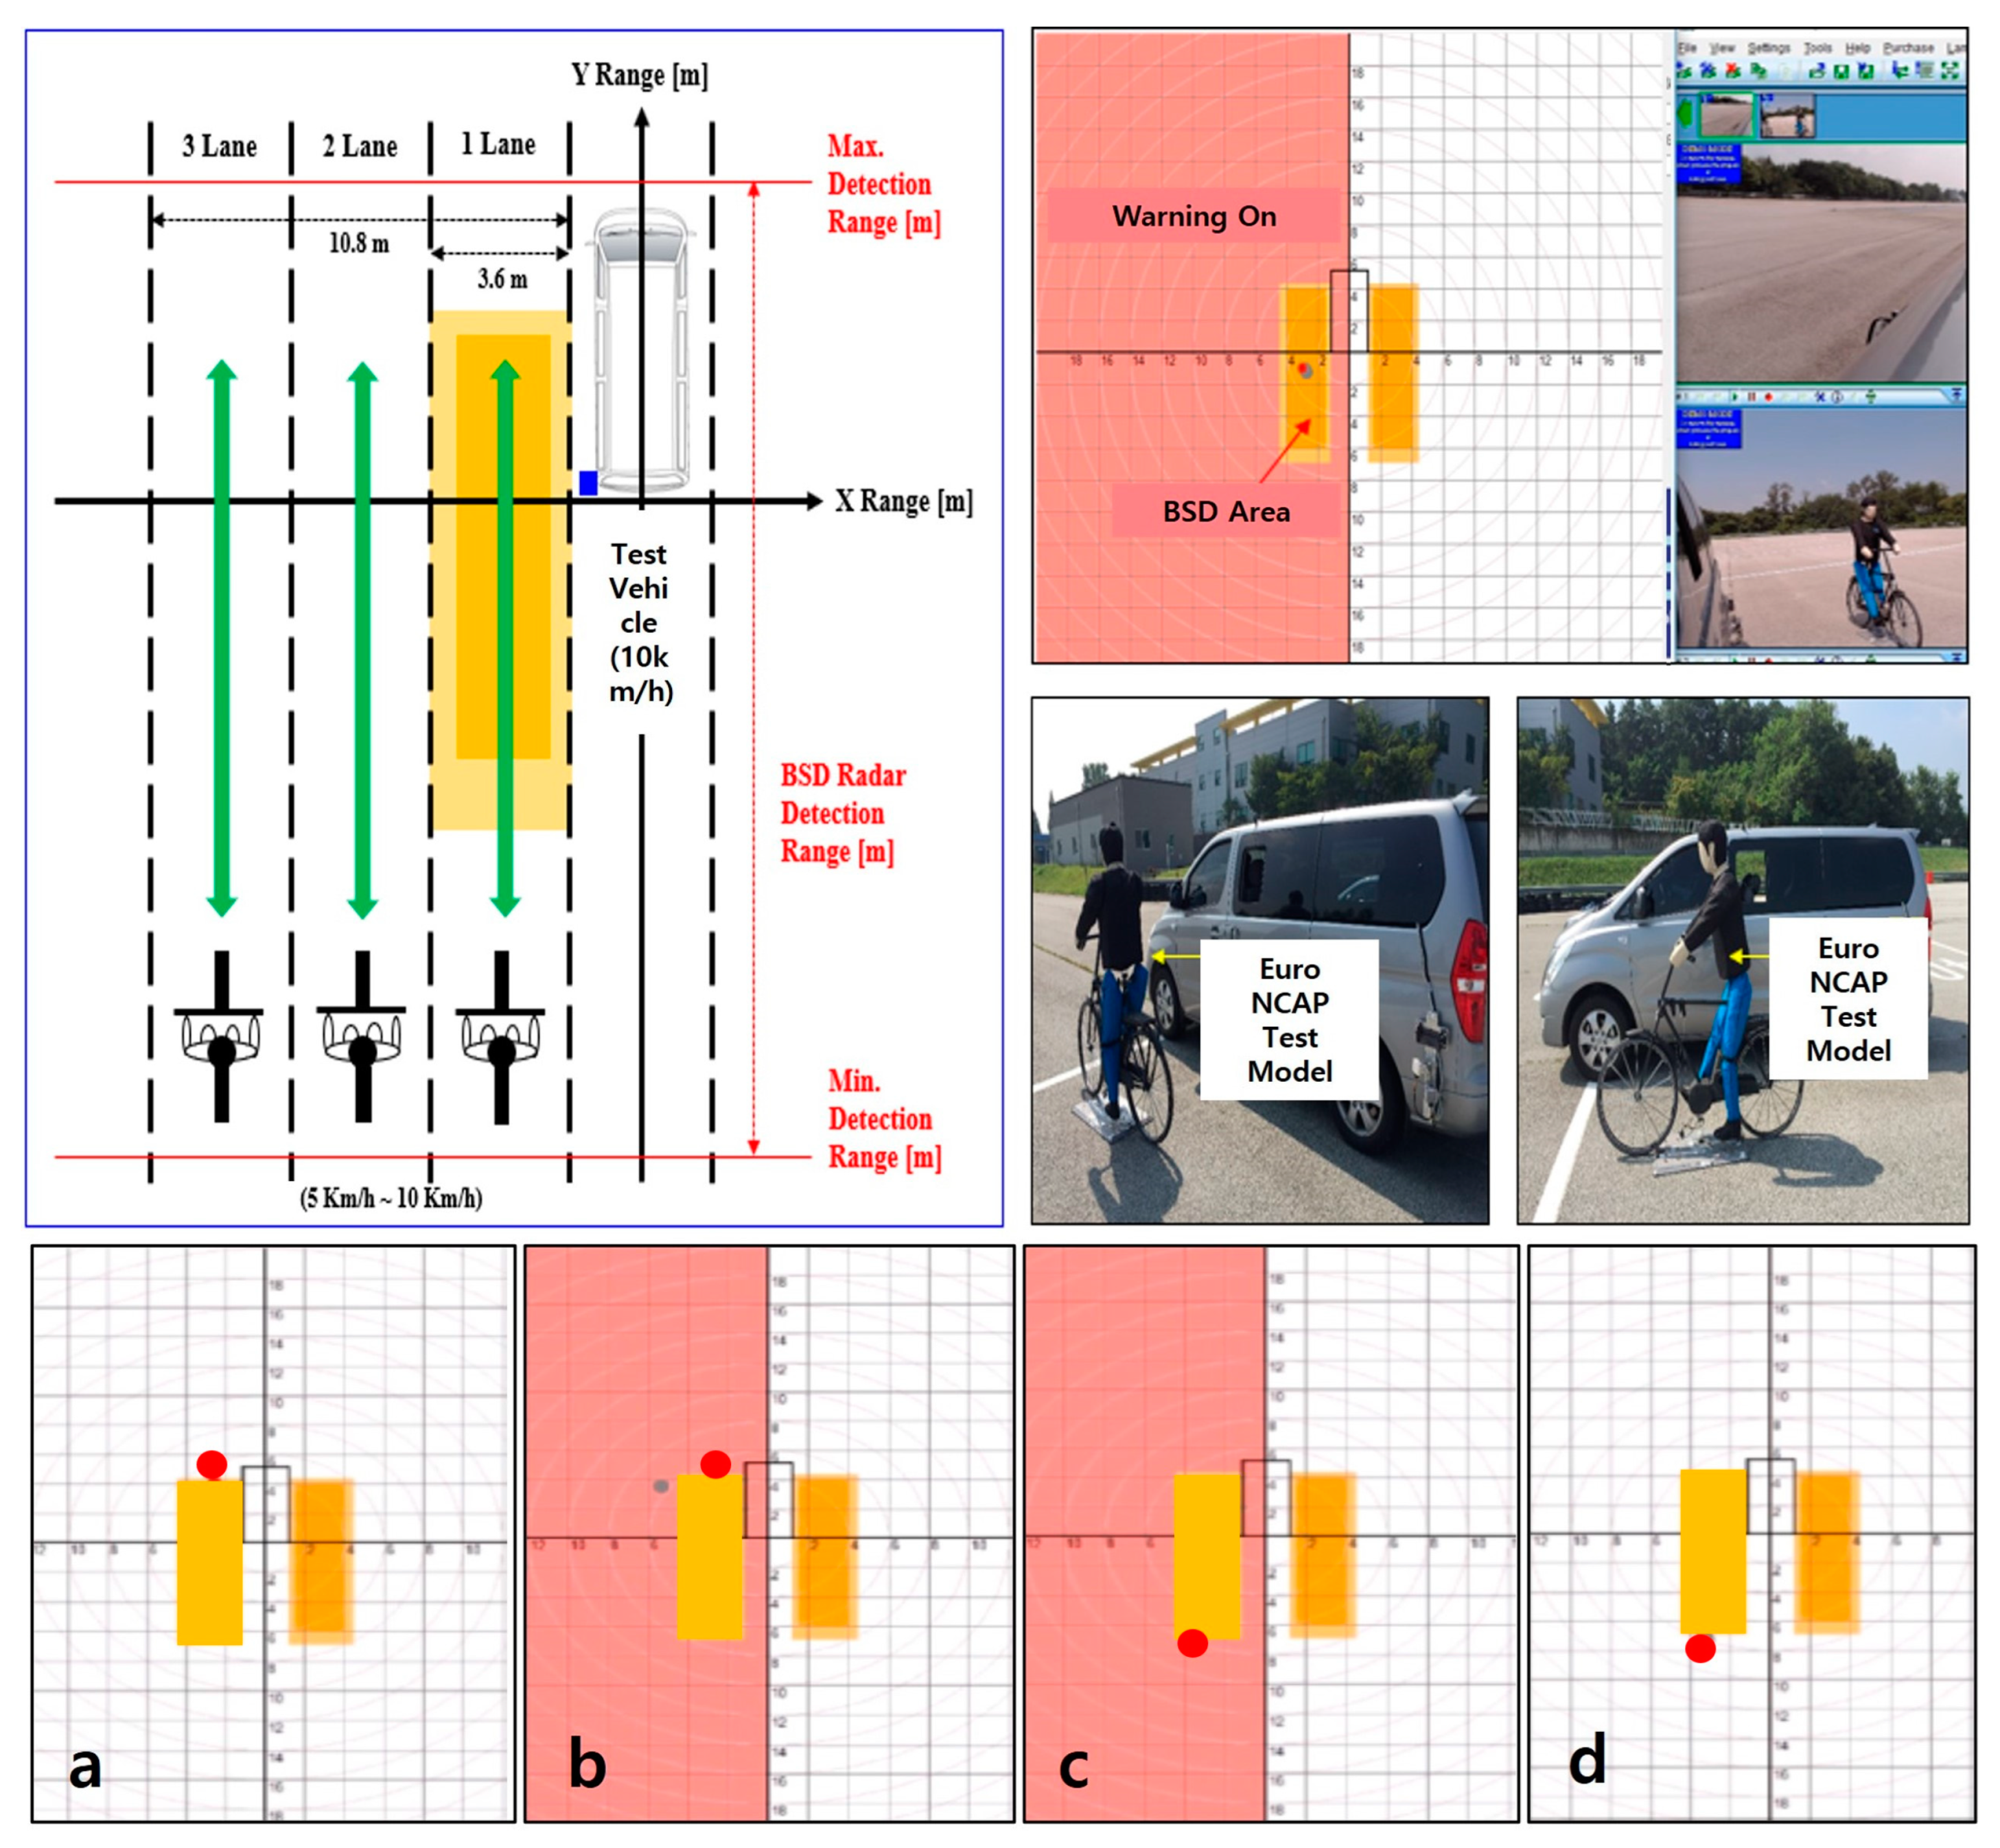
- The test vehicle drives at a constant speed of 10 kph and the distance is measured when a cyclist approaches the BSD area of the test vehicle.
- Warning ON: The moment when the cyclist enters the BSD area.
- Warning OFF: The moment when the cyclist exits the BSD area.
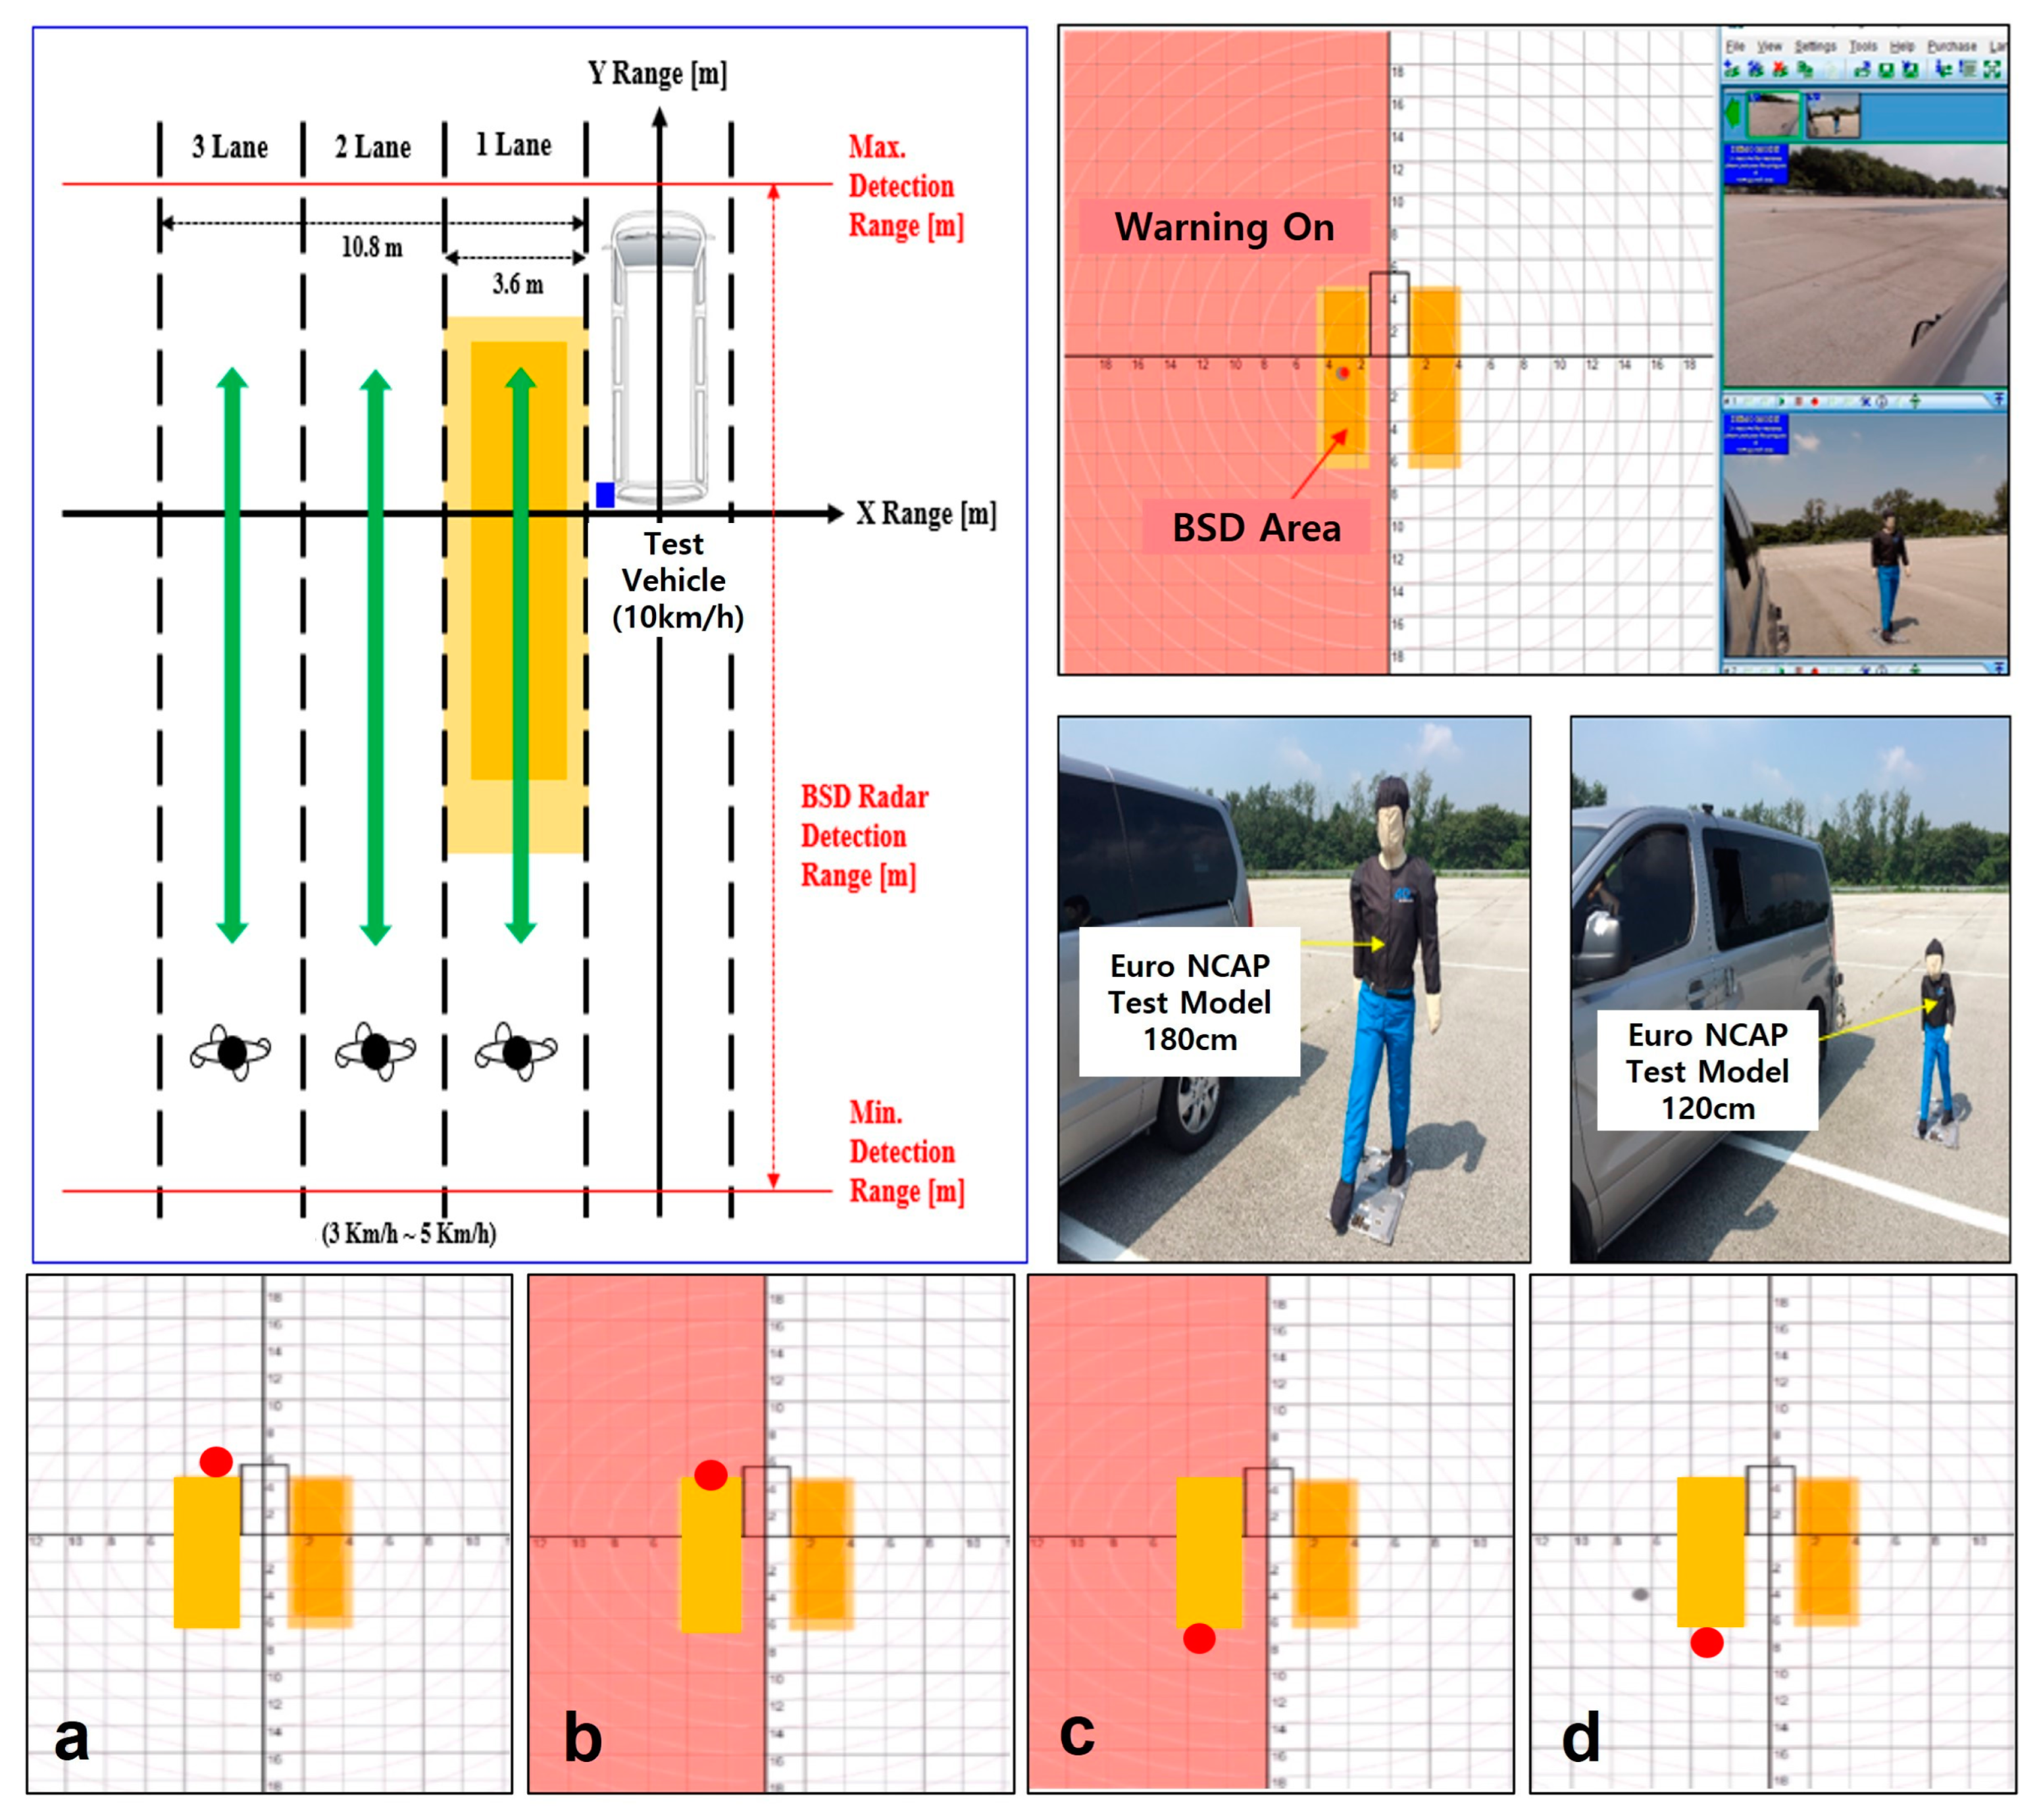
- The test vehicle drives at a constant speed of 10 kph and the distance is measured when a pedestrian approaches the BSD area of the test vehicle.
- Warning ON: The moment when the pedestrian enters the BSD area.
- Warning OFF: The moment when the pedestrian exits the BSD area.
5.5. Results
6. Discussion
Author Contributions
Funding
Institutional Review Board Statement
Informed Consent Statement
Data Availability Statement
Conflicts of Interest
References
- Rindone, C. Sustainable Mobility as a Service: Supply Analysis and Test Cases. Information 2022, 13, 351. [Google Scholar] [CrossRef]
- Musolino, G.; Rindone, C.; Vitetta, A. Models for Supporting Mobility as a Service (MaaS) Design. Smart Cities 2022, 5, 206–222. [Google Scholar] [CrossRef]
- Battaglia, G.; Musolino, G.; Vitetta, A. Freight Demand Distribution in a Suburban Area: Calibration of an Acquisition Model with Floating Car Data. J. Adv. Transp. 2022, 2022, 1535090. [Google Scholar] [CrossRef]
- Mouftah, H.T.; Erol-Kantarci, M.; Sorour, S. (Eds.) Connected and Autonomous Vehicles in Smart Cities; CRC Press: Boca Raton, FL, USA, 2020. [Google Scholar]
- Cafiso, S.; Pappalardo, G. Safety effectiveness and performance of lane support systems for driving assistance and automation—Experimental test and logistic regression for rare events. Accid. Anal. Prev. 2020, 148, 105791. [Google Scholar] [CrossRef] [PubMed]
- Dai, W.; Pan, Y.; Min, C.; Zhang, S.P.; Zhao, J. Real-Time Modeling of Vehicle’s Longitudinal-Vertical Dynamics in ADAS Applications. Actuators 2022, 11, 378. [Google Scholar] [CrossRef]
- Pak, J.M. Hybrid Interacting Multiple Model Filtering for Improving the Reliability of Radar-Based Forward Collision Warning Systems. Sensors 2022, 22, 875. [Google Scholar] [CrossRef] [PubMed]
- Andrei, M.A.; Boiangiu, C.A.; Tarbă, N.; Voncilă, M.L. Robust Lane Detection and Tracking Algorithm for Steering Assist Systems. Machines 2022, 10, 10. [Google Scholar] [CrossRef]
- Lee, Y.W.; Kim, T.W.; Kim, J.G.; Kang, Y. Vehicle and Pedestrian Classification Using 24 GHz Radar for Vehicle Rear Cross-Traffic Alert Systems. J. Inst. Control. Robot. Syst. 2018, 3, 247–255. [Google Scholar] [CrossRef]
- Yang, J.; Jiang, D.; Tao, J.; Gao, Y.; Lu, X.; Han, Y.; Liu, M. A Sector-Matching Probability Hypothesis Density Filter for Radar Multiple Target Tracking. Appl. Sci. 2023, 13, 2834. [Google Scholar] [CrossRef]
- Richards, M.A. Fundementals of Radar Signal Processing; Tata McGraw-Hill Education: New York, NY, USA, 2005. [Google Scholar]
- Stove, A.G. Linear FMCW radar techniques. IEE Proc. Rad. Sig. Process. 1992, 139, 343–350. [Google Scholar] [CrossRef]
- Kim, B.; Kim, S.; Jin, Y.; Lee, J. High-Efficiency Super-Resolution FMCW Radar Algorithm Based on FFT Estimation. Sensors 2021, 12, 4018. [Google Scholar] [CrossRef] [PubMed]
- Rohling, H. Radar CFAR Thresholding in Clutter and Multiple Target Situations. IEEE Trans. Aerosp. Electron. Syst. 1983, AES-19, 608–621. [Google Scholar] [CrossRef]
- Barniv, Y. Dynamic programming solution for detecting dim moving targets. IEEE Trans. Aerosp. Electron. Syst. 1985, 21, 144–156. [Google Scholar] [CrossRef]
- MATLAB Phased Array System Toolbox Documentation. Available online: https://www.mathworks.com/help/phased (accessed on 7 April 2021).
- Mahafza, B.R. Radar Systems Analysis and Design Using MATLAB; Chapman and Hall/CRC: Boca Raton, FL, USA, 2005. [Google Scholar]
- Zhang, H.; Yang, Z.; Xiong, H.; Zhu, T.; Long, Z.; Wu, W. Transformer Aided Adaptive Extended Kalman Filter for Autonomous Vehicle Mass Estimation. Processes 2023, 11, 887. [Google Scholar] [CrossRef]
- Hyun, E.; Jin, Y.; Lee, J. A pedestrian detection scheme using a coherent phase difference method based on 2D range-Doppler FMCW radar. Sensors 2016, 16, 124. [Google Scholar] [CrossRef] [PubMed]
- Feng, X.; Zhao, Z.; Li, F.; Cui, W.; Zhao, Y. Radar Phase-Coded Waveform Design with Local Low Range Sidelobes Based on Particle Swarm-Assisted Projection Optimization. Remote Sens. 2022, 14, 4186. [Google Scholar] [CrossRef]
- Saponara, S.; Neri, B. Radar sensor signal acquisition and multidimensional FFT processing for surveillance applications in transport systems. IEEE Trans. Instrum. Meas. 2017, 66, 604–615. [Google Scholar] [CrossRef]
- KS X ISO 17387:2012; Intelligent Transport Systems-Lane Change Decision Aid Systems (LCDAS)—Performance Requirements and Test Procedures. KATS: Maengdong-myeon, Republic of Korea, 2012.
- BS ISO 17387:2008; Intelligent Transport Systems-Lane Change Decision Aid Systems (LCDAS)—Performance Requirements and Test Procedures. ISO: Geneva, Switzerland, 2008.
- Yildiz, R.; Barut, M.; Zerdali, E. A comprehensive comparison of extended and unscented kalman filters for speed-sensorless control applications of induction motors. IEEE Trans. Ind. Inform. 2020, 16, 6423–6432. [Google Scholar] [CrossRef]


| Target | Parameter | Value | Unit | Beat Frequency (Cal.) |
|---|---|---|---|---|
| Target 1 | Time Delay (τ) | 0.1 | Sec | fb,up = |τ (B/T) + fd | = 5 [Hz] fb,dn = |τ (B/T) − fd | = 5 [Hz] |
| Doppler Freq. () | 0 | Hz | ||
| Amplitude | 1 | Volt | ||
| Target 2 | Time Delay (τ) | 0.2 | Sec | fb,up = |τ (B/T) + fd | = 10 [Hz] fb,dn = |τ (B/T) − fd | = 10 [Hz] |
| Doppler Freq. () | 0 | Hz | ||
| Amplitude | 0.5 | Volt | ||
| Target 3 | Time Delay (τ) | 0.4 | Sec | fb,up = |τ (B/T) + fd | = 20 [Hz] fb,dn = |τ (B/T) − fd | = 20 [Hz] |
| Doppler Freq. () | 0 | Hz | ||
| Amplitude | 0.3 | Volt |
| Target | Parameter | Value | Unit | Beat Frequency (Cal.) |
|---|---|---|---|---|
| Target 1 | Time Delay (τ) | 0.1 | Sec | fb,up = |τ (B/T) + fd | = 4 [Hz] fb,dn = |τ (B/T) − fd | = 6 [Hz] |
| Doppler Freq. () | 1 | Hz | ||
| Amplitude | 1 | Volt | ||
| Target 2 | Time Delay (τ) | 0.2 | Sec | fb,up = |τ (B/T) + fd | = 7 [Hz] fb,dn = |τ (B/T) − fd | = 13 [Hz] |
| Doppler Freq. () | 3 | Hz | ||
| Amplitude | 0.5 | Volt | ||
| Target 3 | Time Delay (τ) | 0.4 | Sec | fb,up = |τ (B/T) + fd | = 15 [Hz] fb,dn = |τ (B/T) − fd | = 25 [Hz] |
| Doppler Freq. () | 5 | Hz | ||
| Amplitude | 0.3 | Volt |
| Parameter | Value | Remark |
|---|---|---|
| Operation Frequency | 76.5 GHz | Center Frequency |
| Tx Power () | 10 dBm | |
| Tx Antenna Gain () | 7 dBi | Antenna Peak Gain (Az.) |
| Rx Antenna Gain () | 12 dBi | Antenna Peak Gain (Az.) |
| Target RCS (σ) | CAR Average RCS | |
| 1D FFT Point (N) | 256 | |
| 2D FFT Point (M) | 256 | |
| System Gain () | 3 dB | LNA, LO Gain, etc. |
| Detection Range (R) | 1 m~6 m | |
| Noise Figure (NF) | 15 dB | |
| System Loss () | 3 dB | Feedline, Mismatch, etc. |
| System Noise Offset () | 6 dB | System Noise Level Offset |
| Processing Loss () | 6 dB | Window, Straddle, etc. |
| Parameter | Value | Unit | Remark | |
|---|---|---|---|---|
| Tx | Center Frequency | 76.5 | GHz | |
| Start Frequency | 76.31 | GHz | ||
| Stop Frequency | 76.69 | GHz | ||
| Tx Power | 13 | dBm |
| |
| Rx | Rx Gain | 45 | dB |
|
| High Pass Filter | 400 | KHz |
| |
| Low Pass Filter | 10 | MHz |
| |
| Parameter | Value | Unit | Remark |
|---|---|---|---|
| Range Detection | 64.34 | m | Min~Max Range |
| Range Accuracy | 0.5 | m | |
| Range Resolution | 0.5 | m | |
| Velocity Detection | ±187 | Km/h | Min~Max Range (±) |
| Velocity Accuracy | 1.46 | Km/h | |
| Velocity Resolution | 1.46 | Km/h | |
| Azimuth Angle (FOV) | ±75 | Deg. | Min~Max Range (±) |
| Update Time | 25 | msec |
| Antenna Type | Parameter | Value | Remark |
|---|---|---|---|
| Tx Antenna | Signal Bandwidth | 300 MHz | |
| Antenna Beamwidth (3 dB) | |||
| Antenna Gain (3 dB) | 15 dBi | ||
| Sidelobe Level | 20 dBc | ||
| Rx Antenna | Antenna Beamwidth (3 dB) | ||
| Antenna Gain (3 dB) | 15 dBi | ||
| Sidelobe Level | 20 dBc | ||
| Antenna Distance Ratio | = 1.0:2.5 | ||
| VSWR | 2.5:1 |
Disclaimer/Publisher’s Note: The statements, opinions and data contained in all publications are solely those of the individual author(s) and contributor(s) and not of MDPI and/or the editor(s). MDPI and/or the editor(s) disclaim responsibility for any injury to people or property resulting from any ideas, methods, instructions or products referred to in the content. |
© 2023 by the authors. Licensee MDPI, Basel, Switzerland. This article is an open access article distributed under the terms and conditions of the Creative Commons Attribution (CC BY) license (https://creativecommons.org/licenses/by/4.0/).
Share and Cite
Kim, W.; Yang, H.; Kim, J. Blind Spot Detection Radar System Design for Safe Driving of Smart Vehicles. Appl. Sci. 2023, 13, 6147. https://doi.org/10.3390/app13106147
Kim W, Yang H, Kim J. Blind Spot Detection Radar System Design for Safe Driving of Smart Vehicles. Applied Sciences. 2023; 13(10):6147. https://doi.org/10.3390/app13106147
Chicago/Turabian StyleKim, Wantae, Heejin Yang, and Jinhong Kim. 2023. "Blind Spot Detection Radar System Design for Safe Driving of Smart Vehicles" Applied Sciences 13, no. 10: 6147. https://doi.org/10.3390/app13106147
APA StyleKim, W., Yang, H., & Kim, J. (2023). Blind Spot Detection Radar System Design for Safe Driving of Smart Vehicles. Applied Sciences, 13(10), 6147. https://doi.org/10.3390/app13106147