Assessment of Bone Mineral Density from Lumbosacral MRI: A Retrospective Study with Texture Analysis Radiomics
Abstract
1. Introduction
2. Materials and Methods
2.1. Study Design
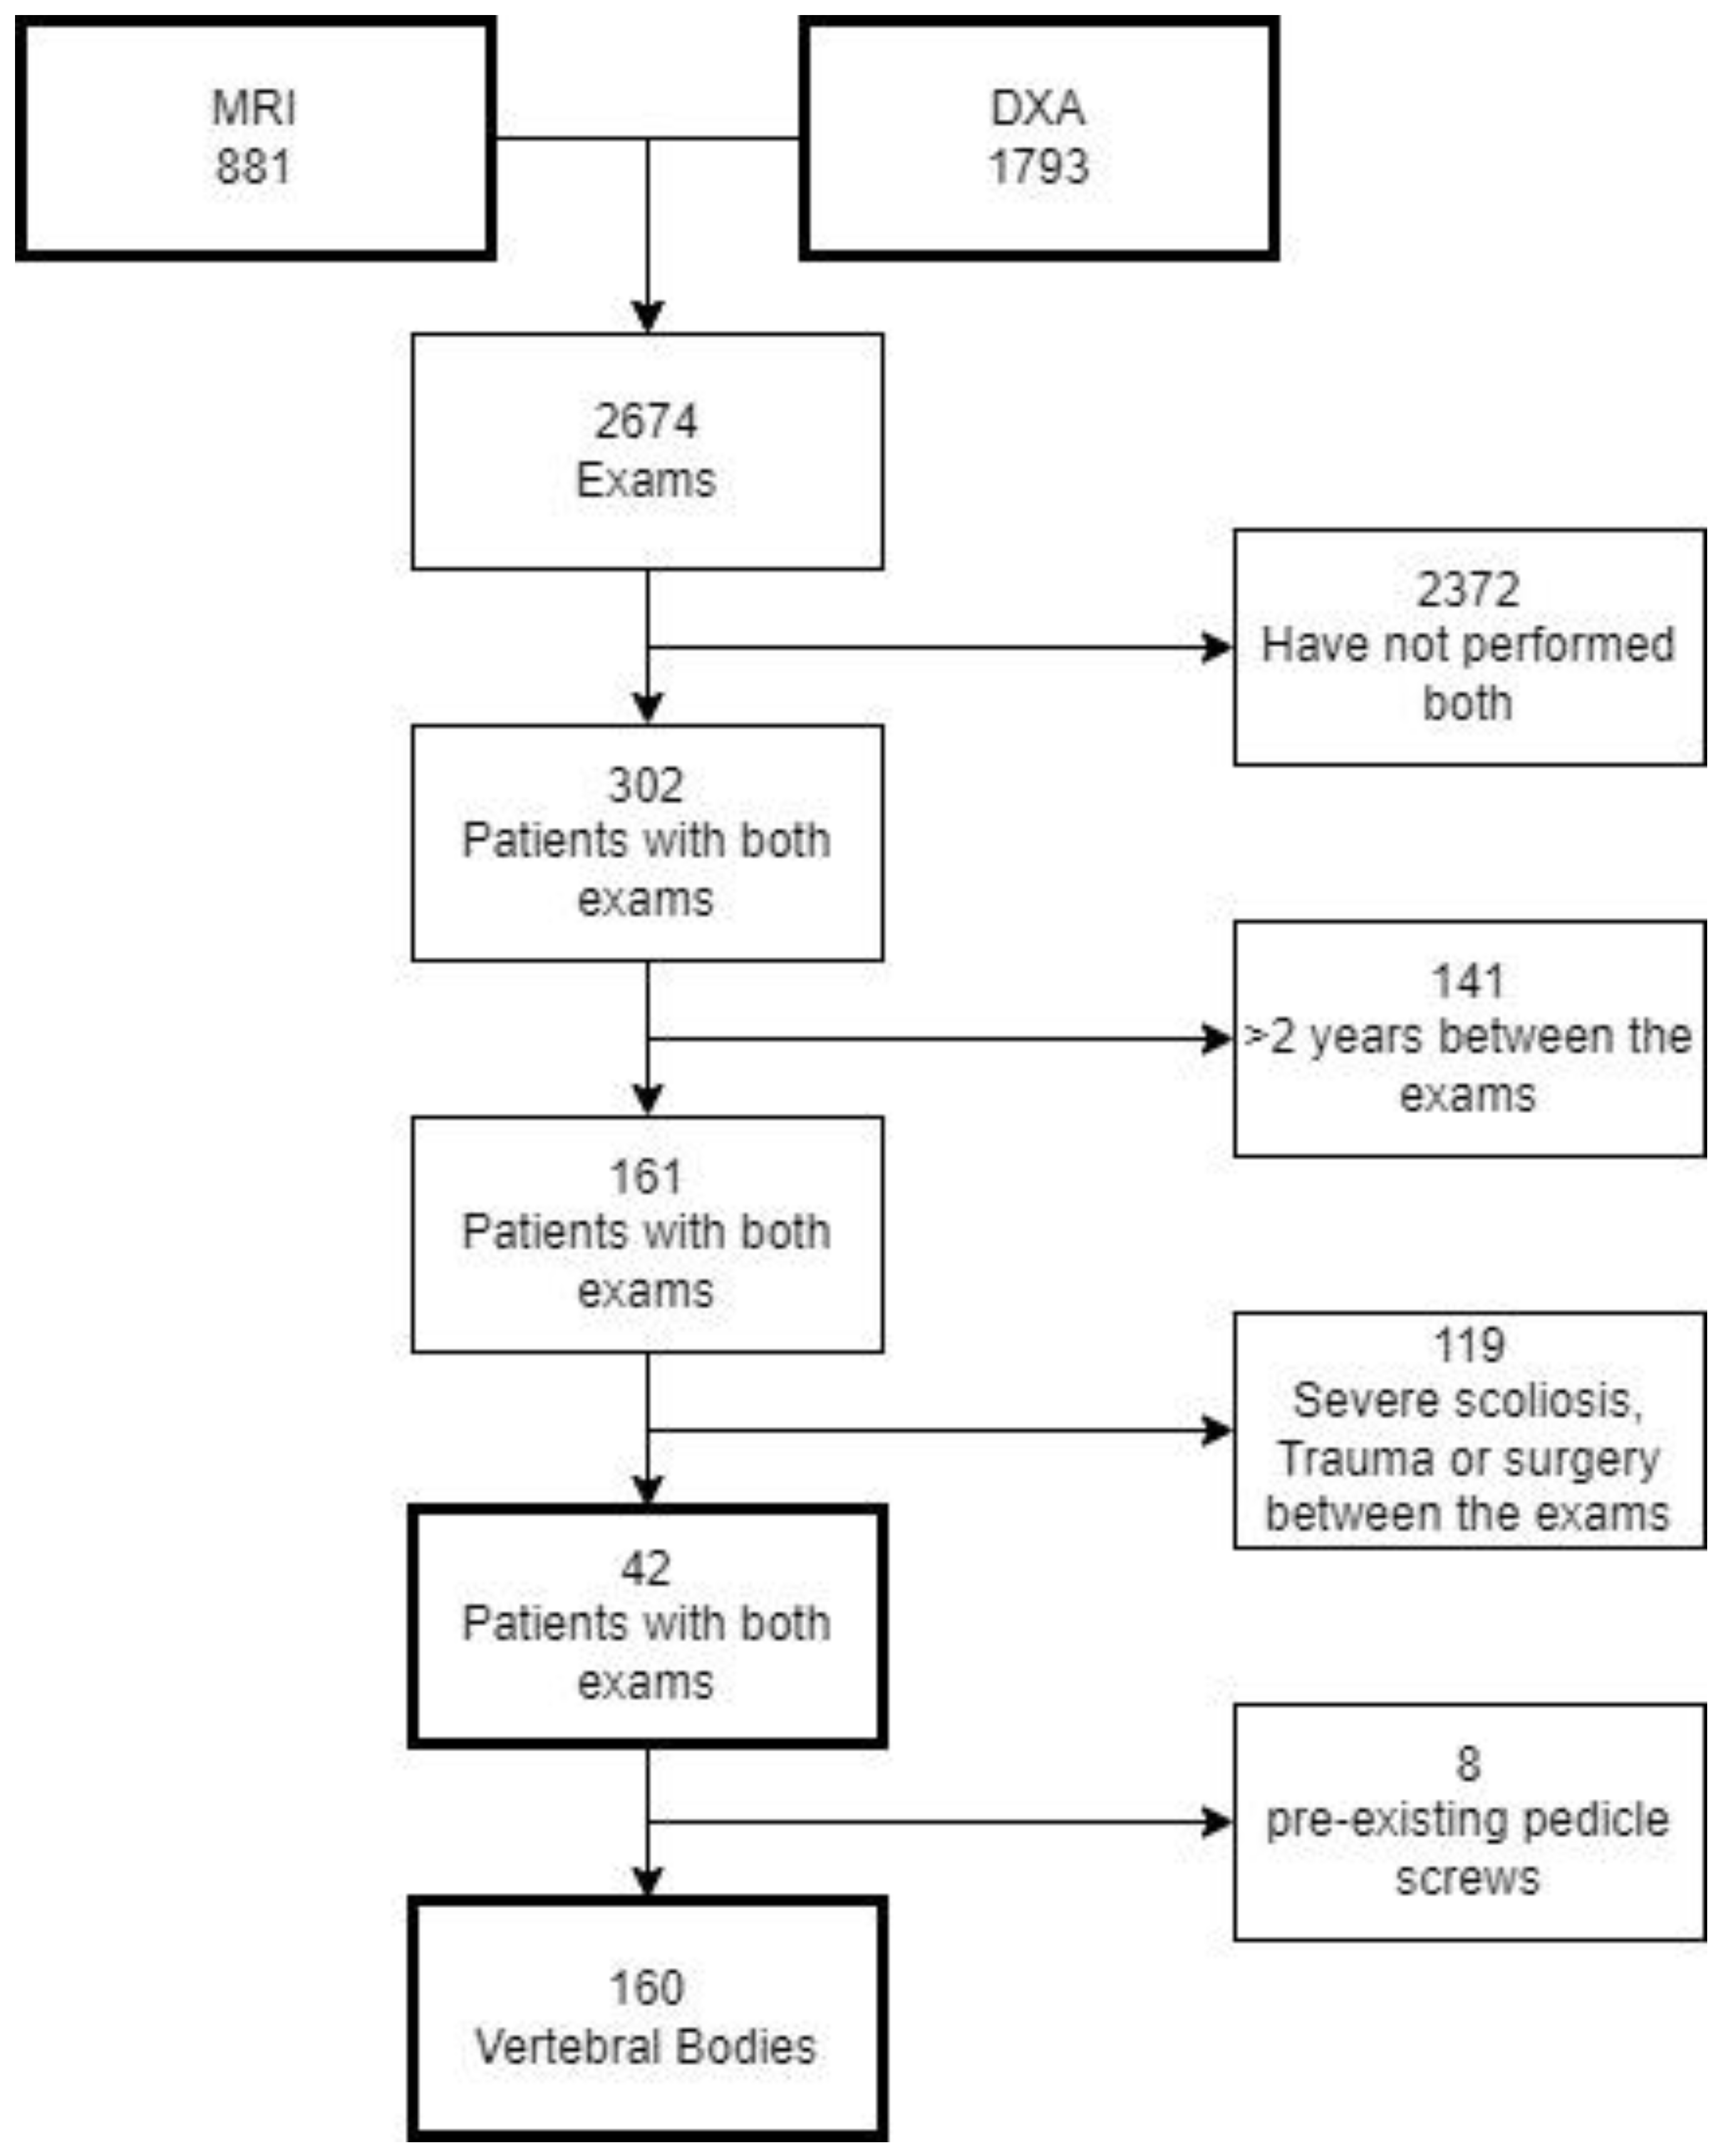
2.2. Study Population
2.3. DXA
2.4. MRI
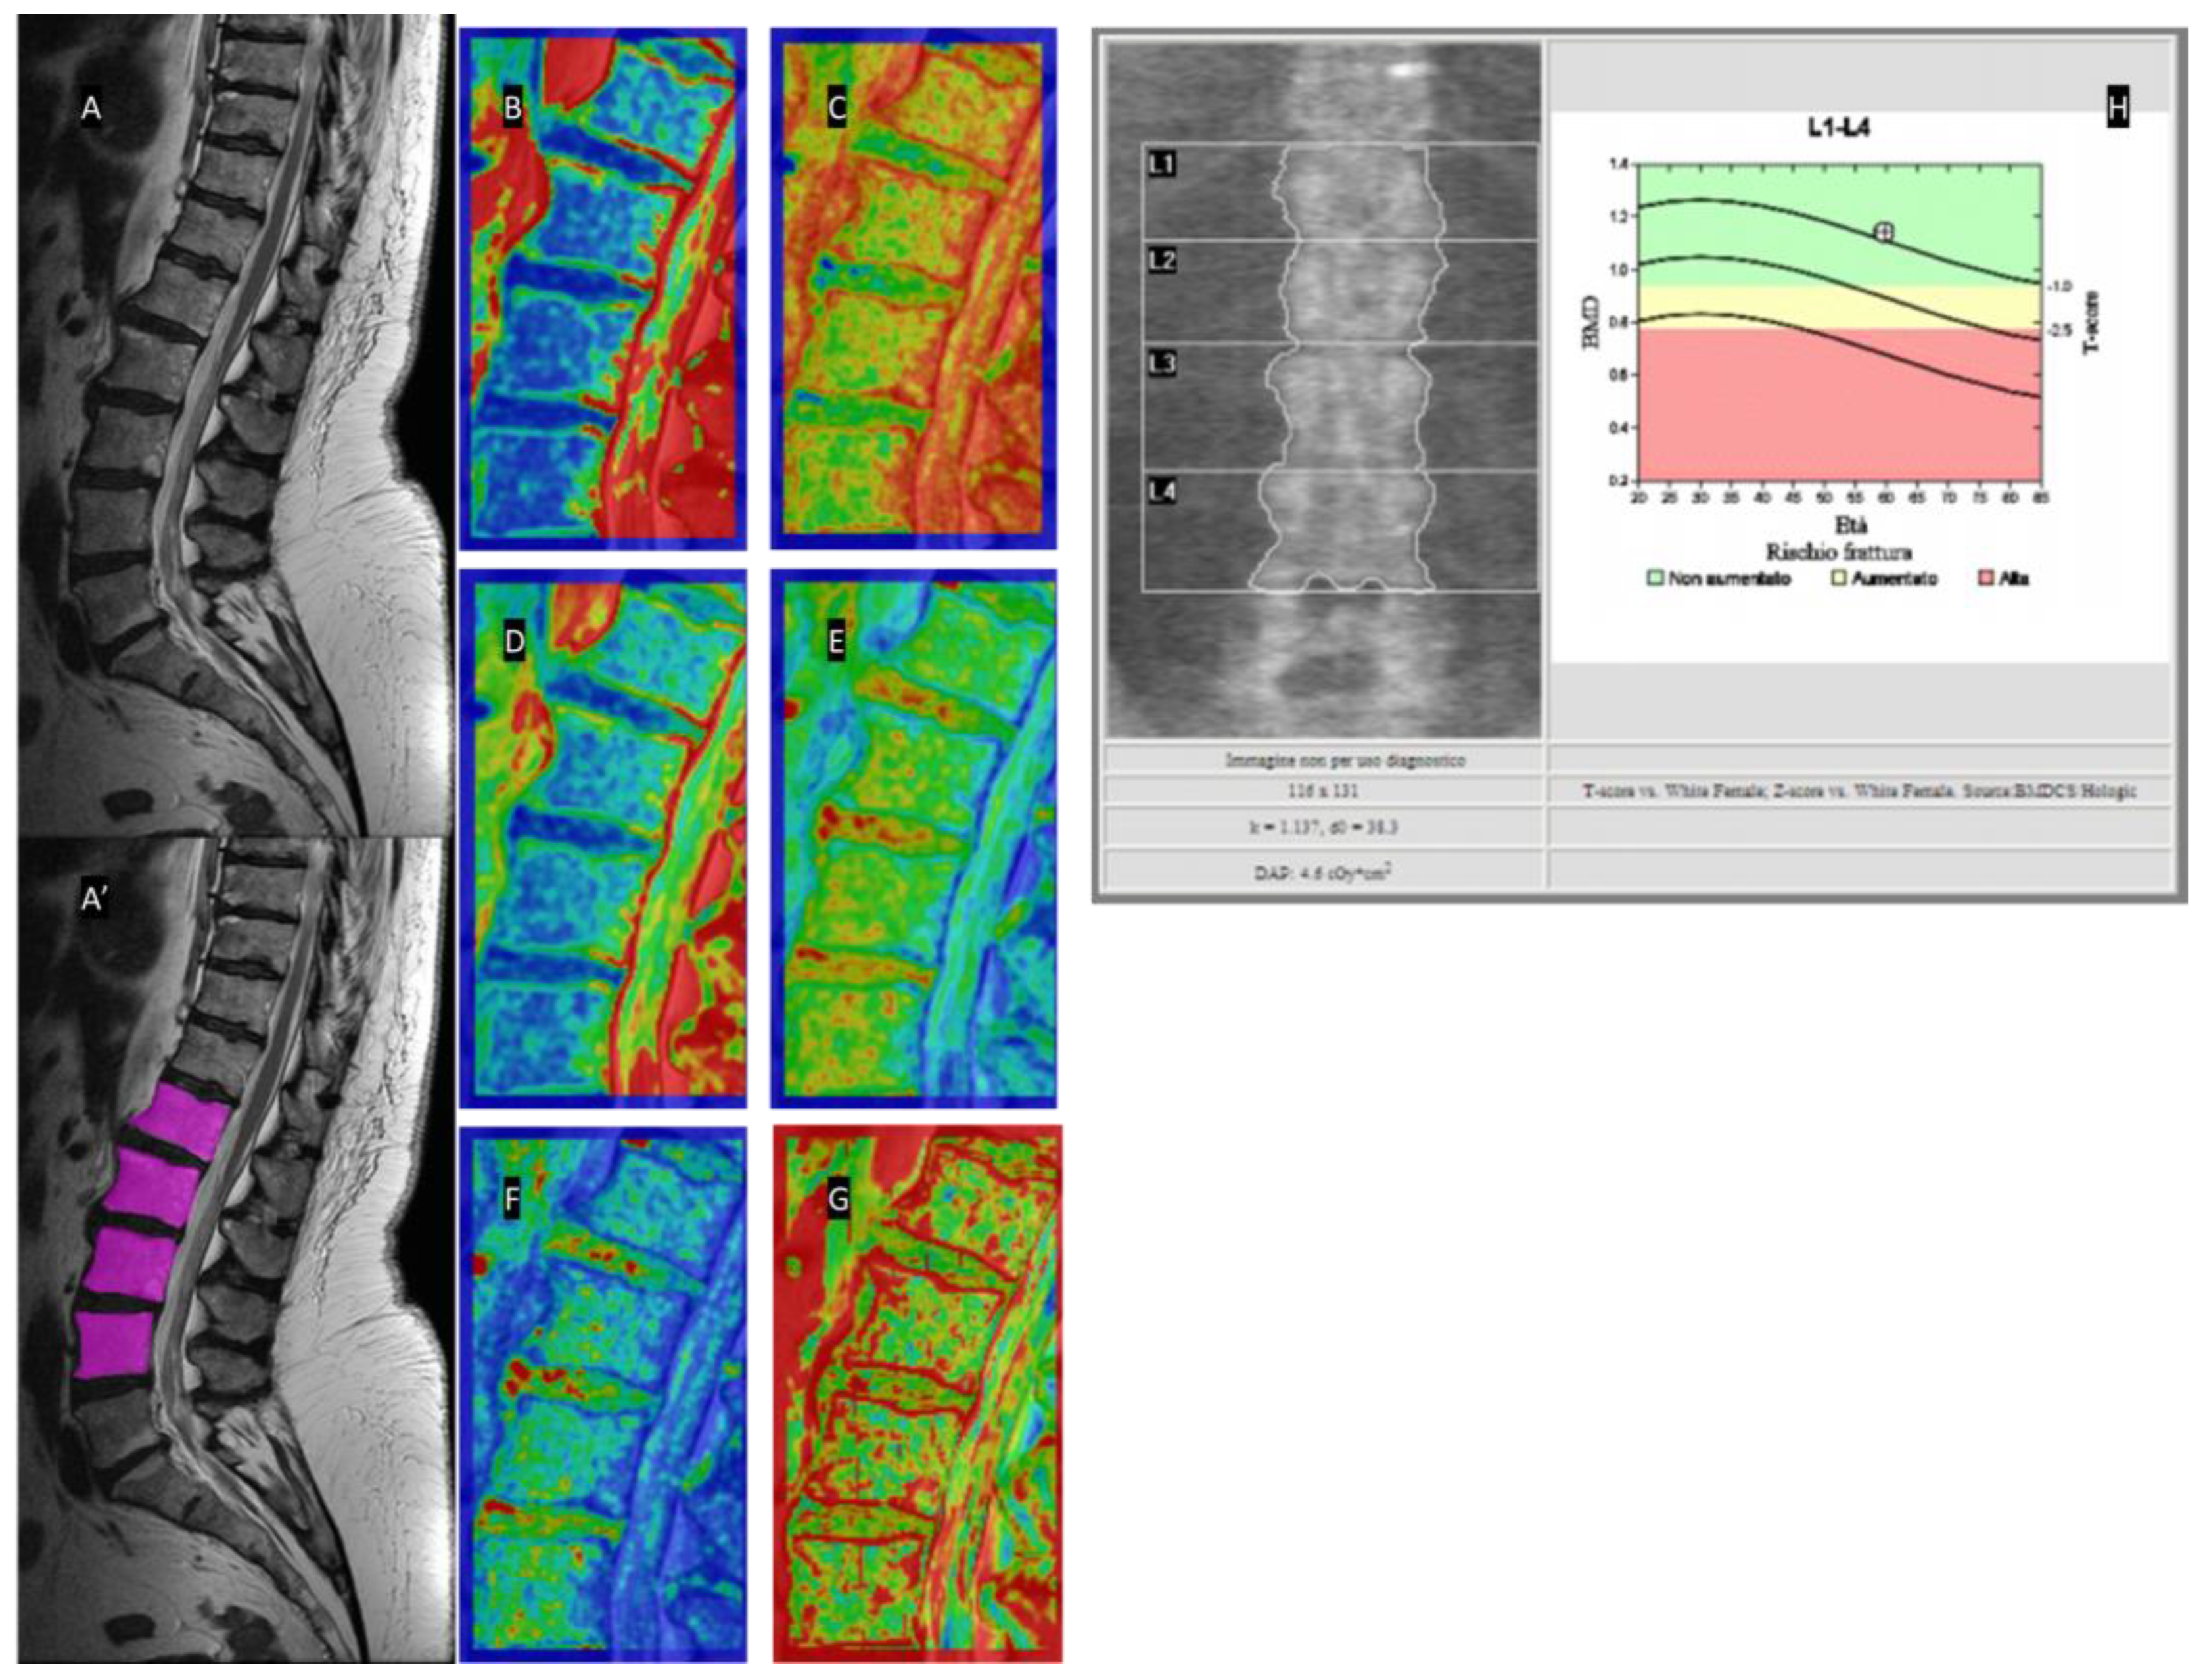
2.5. Texture Analysis
2.6. Statistical Analysis
3. Results
3.1. Correlations between Radiomics MRI Features and BMD
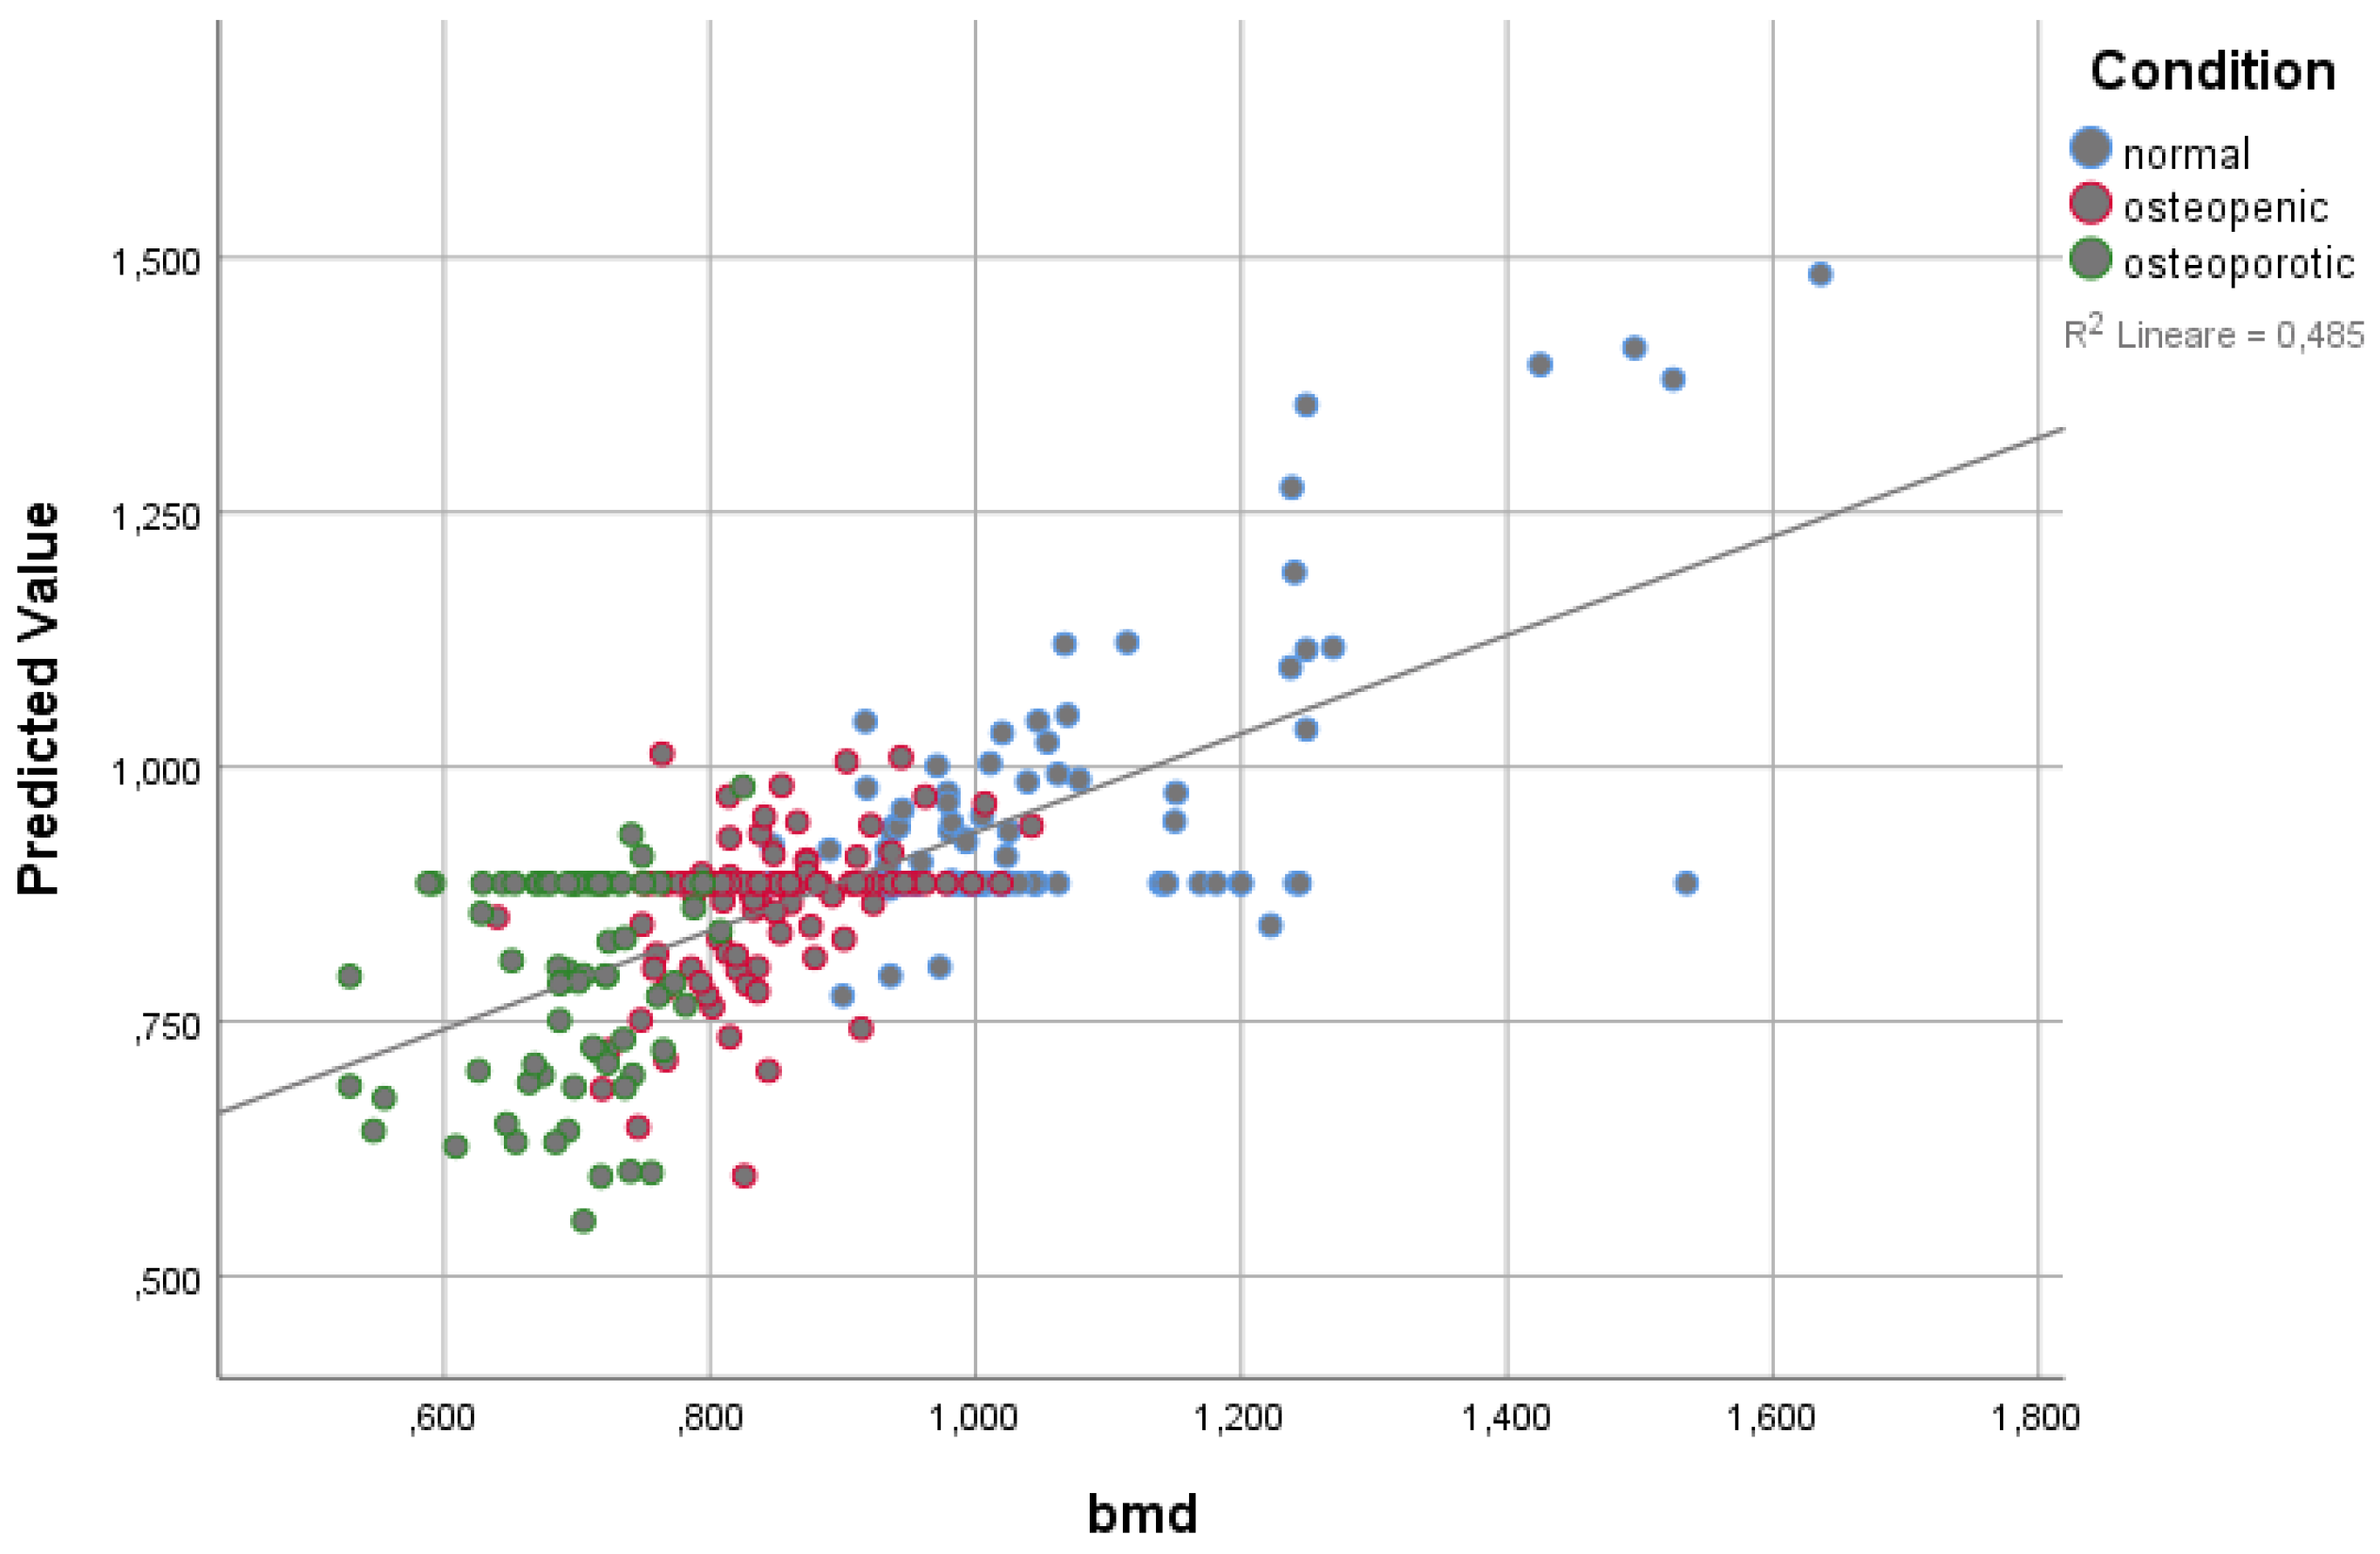
3.2. Linear Regression Modeling on BMD
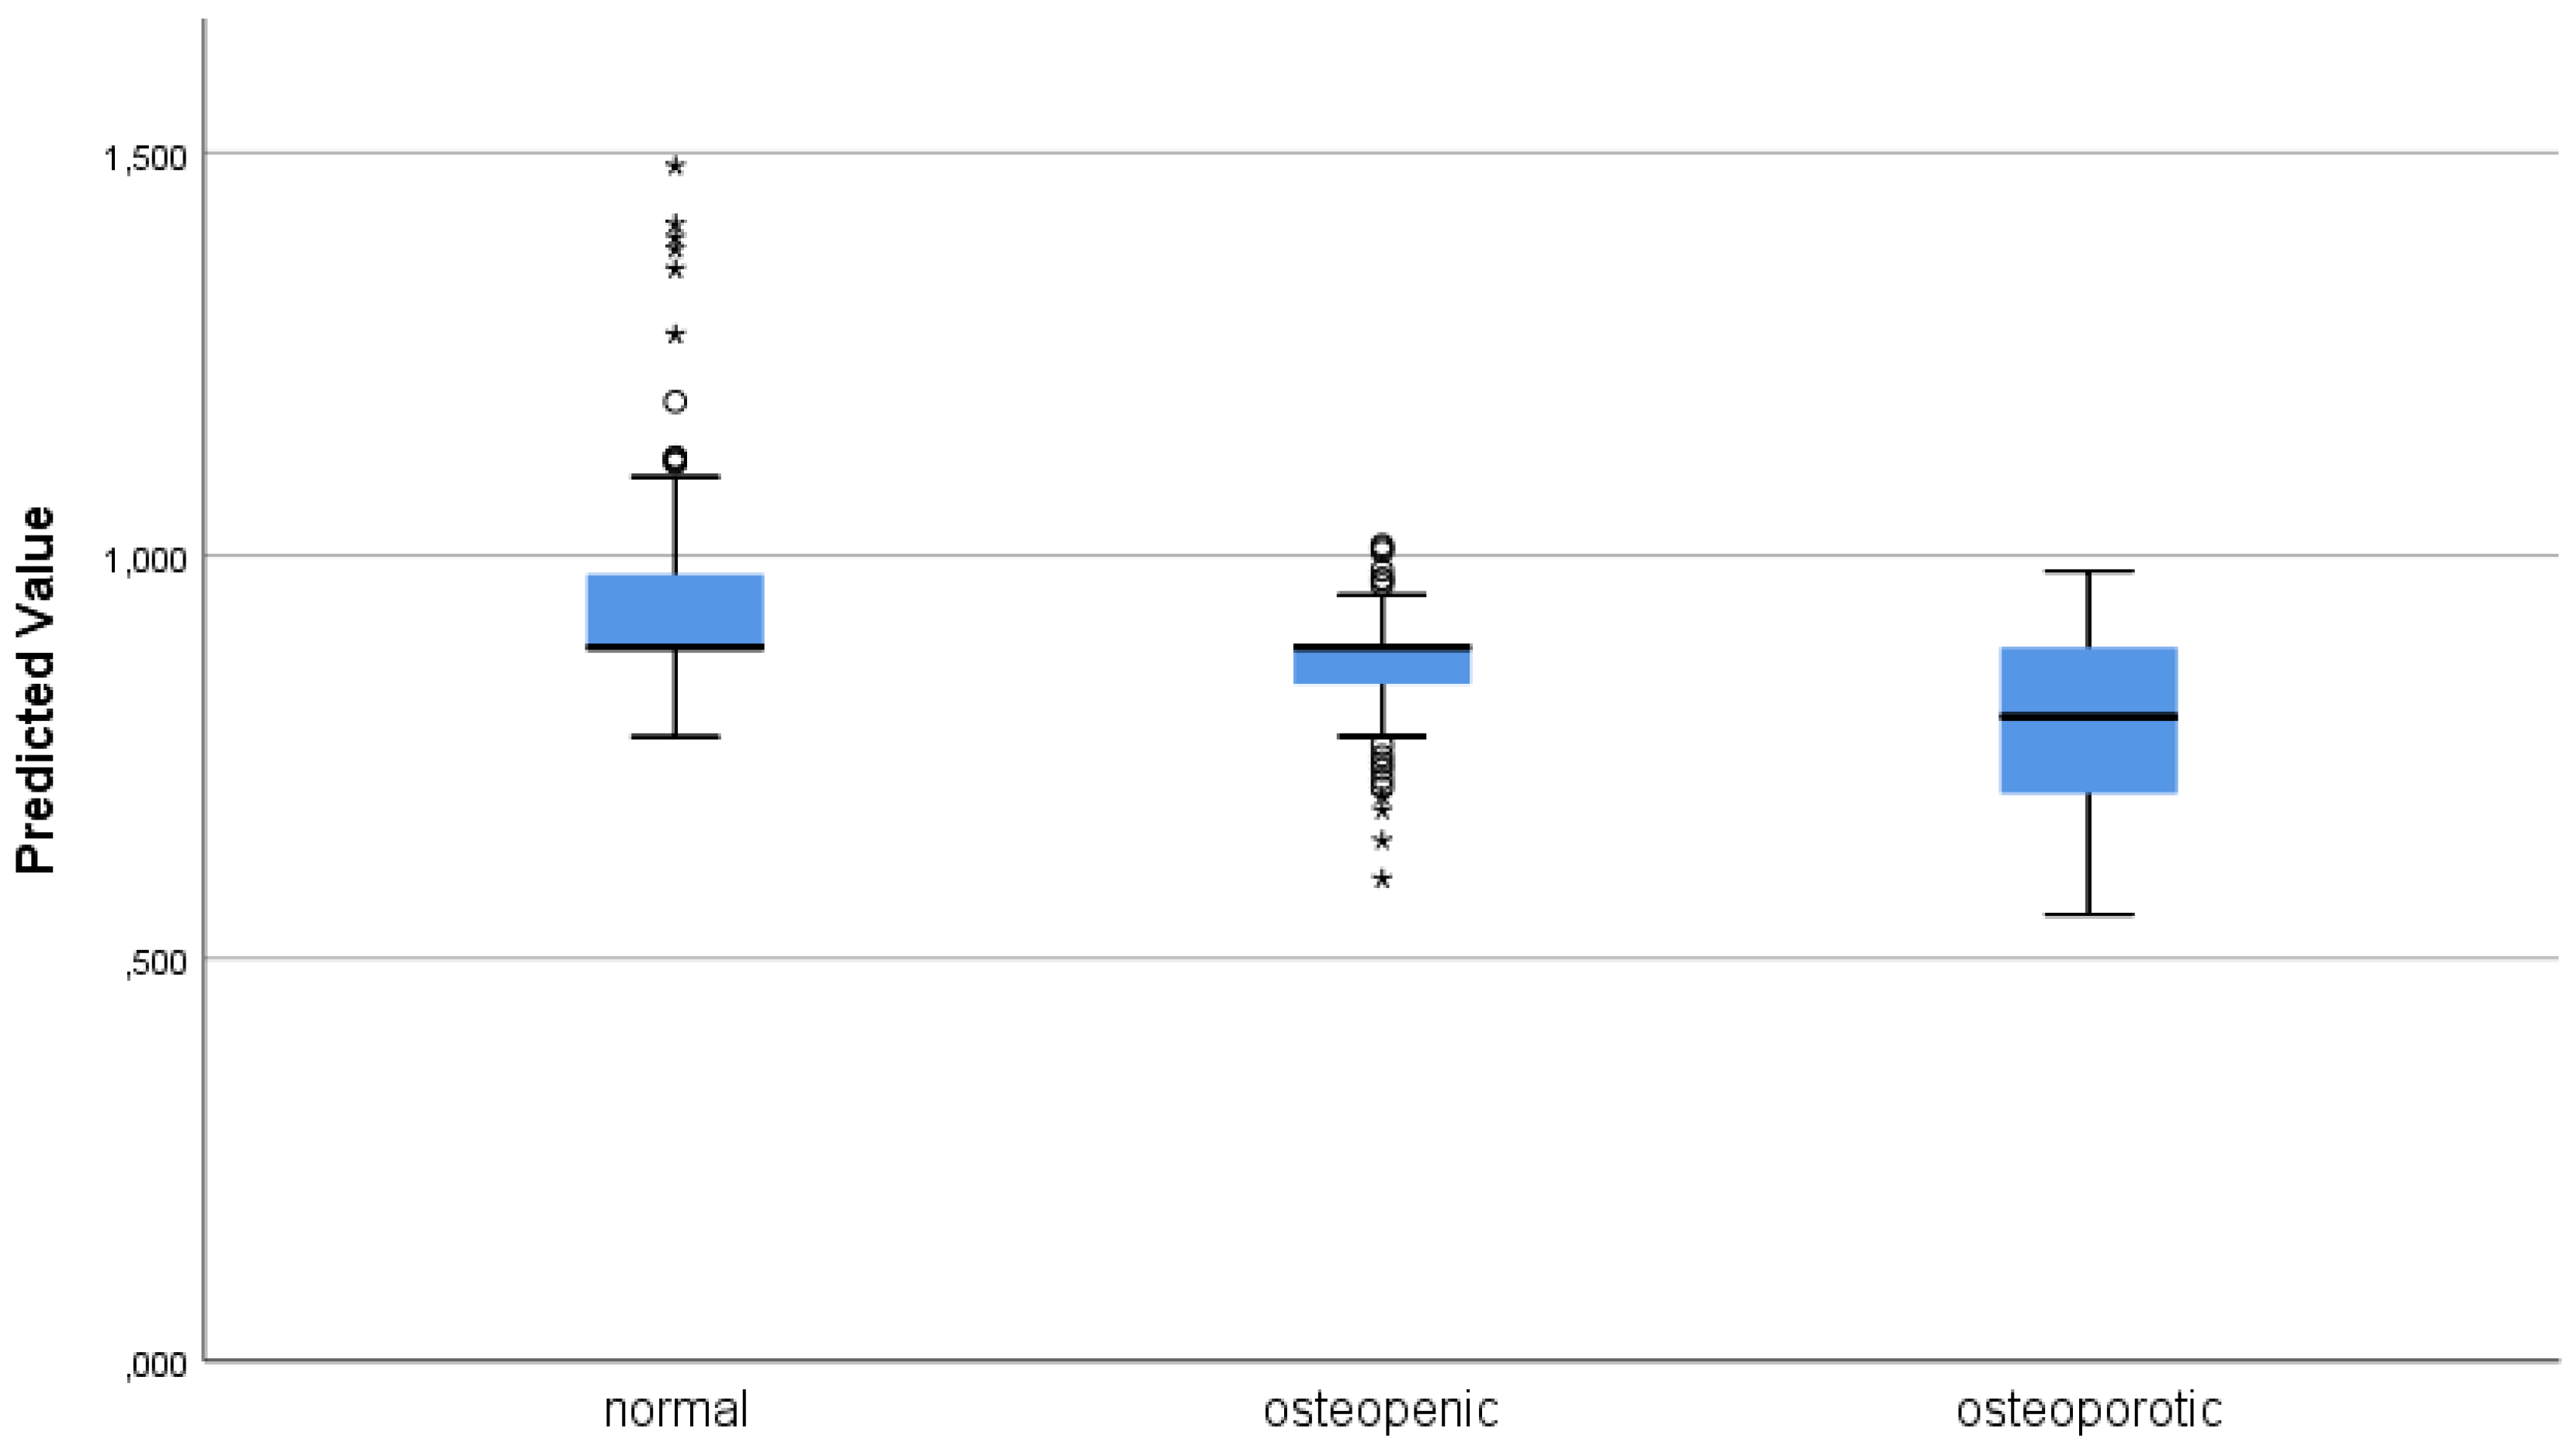
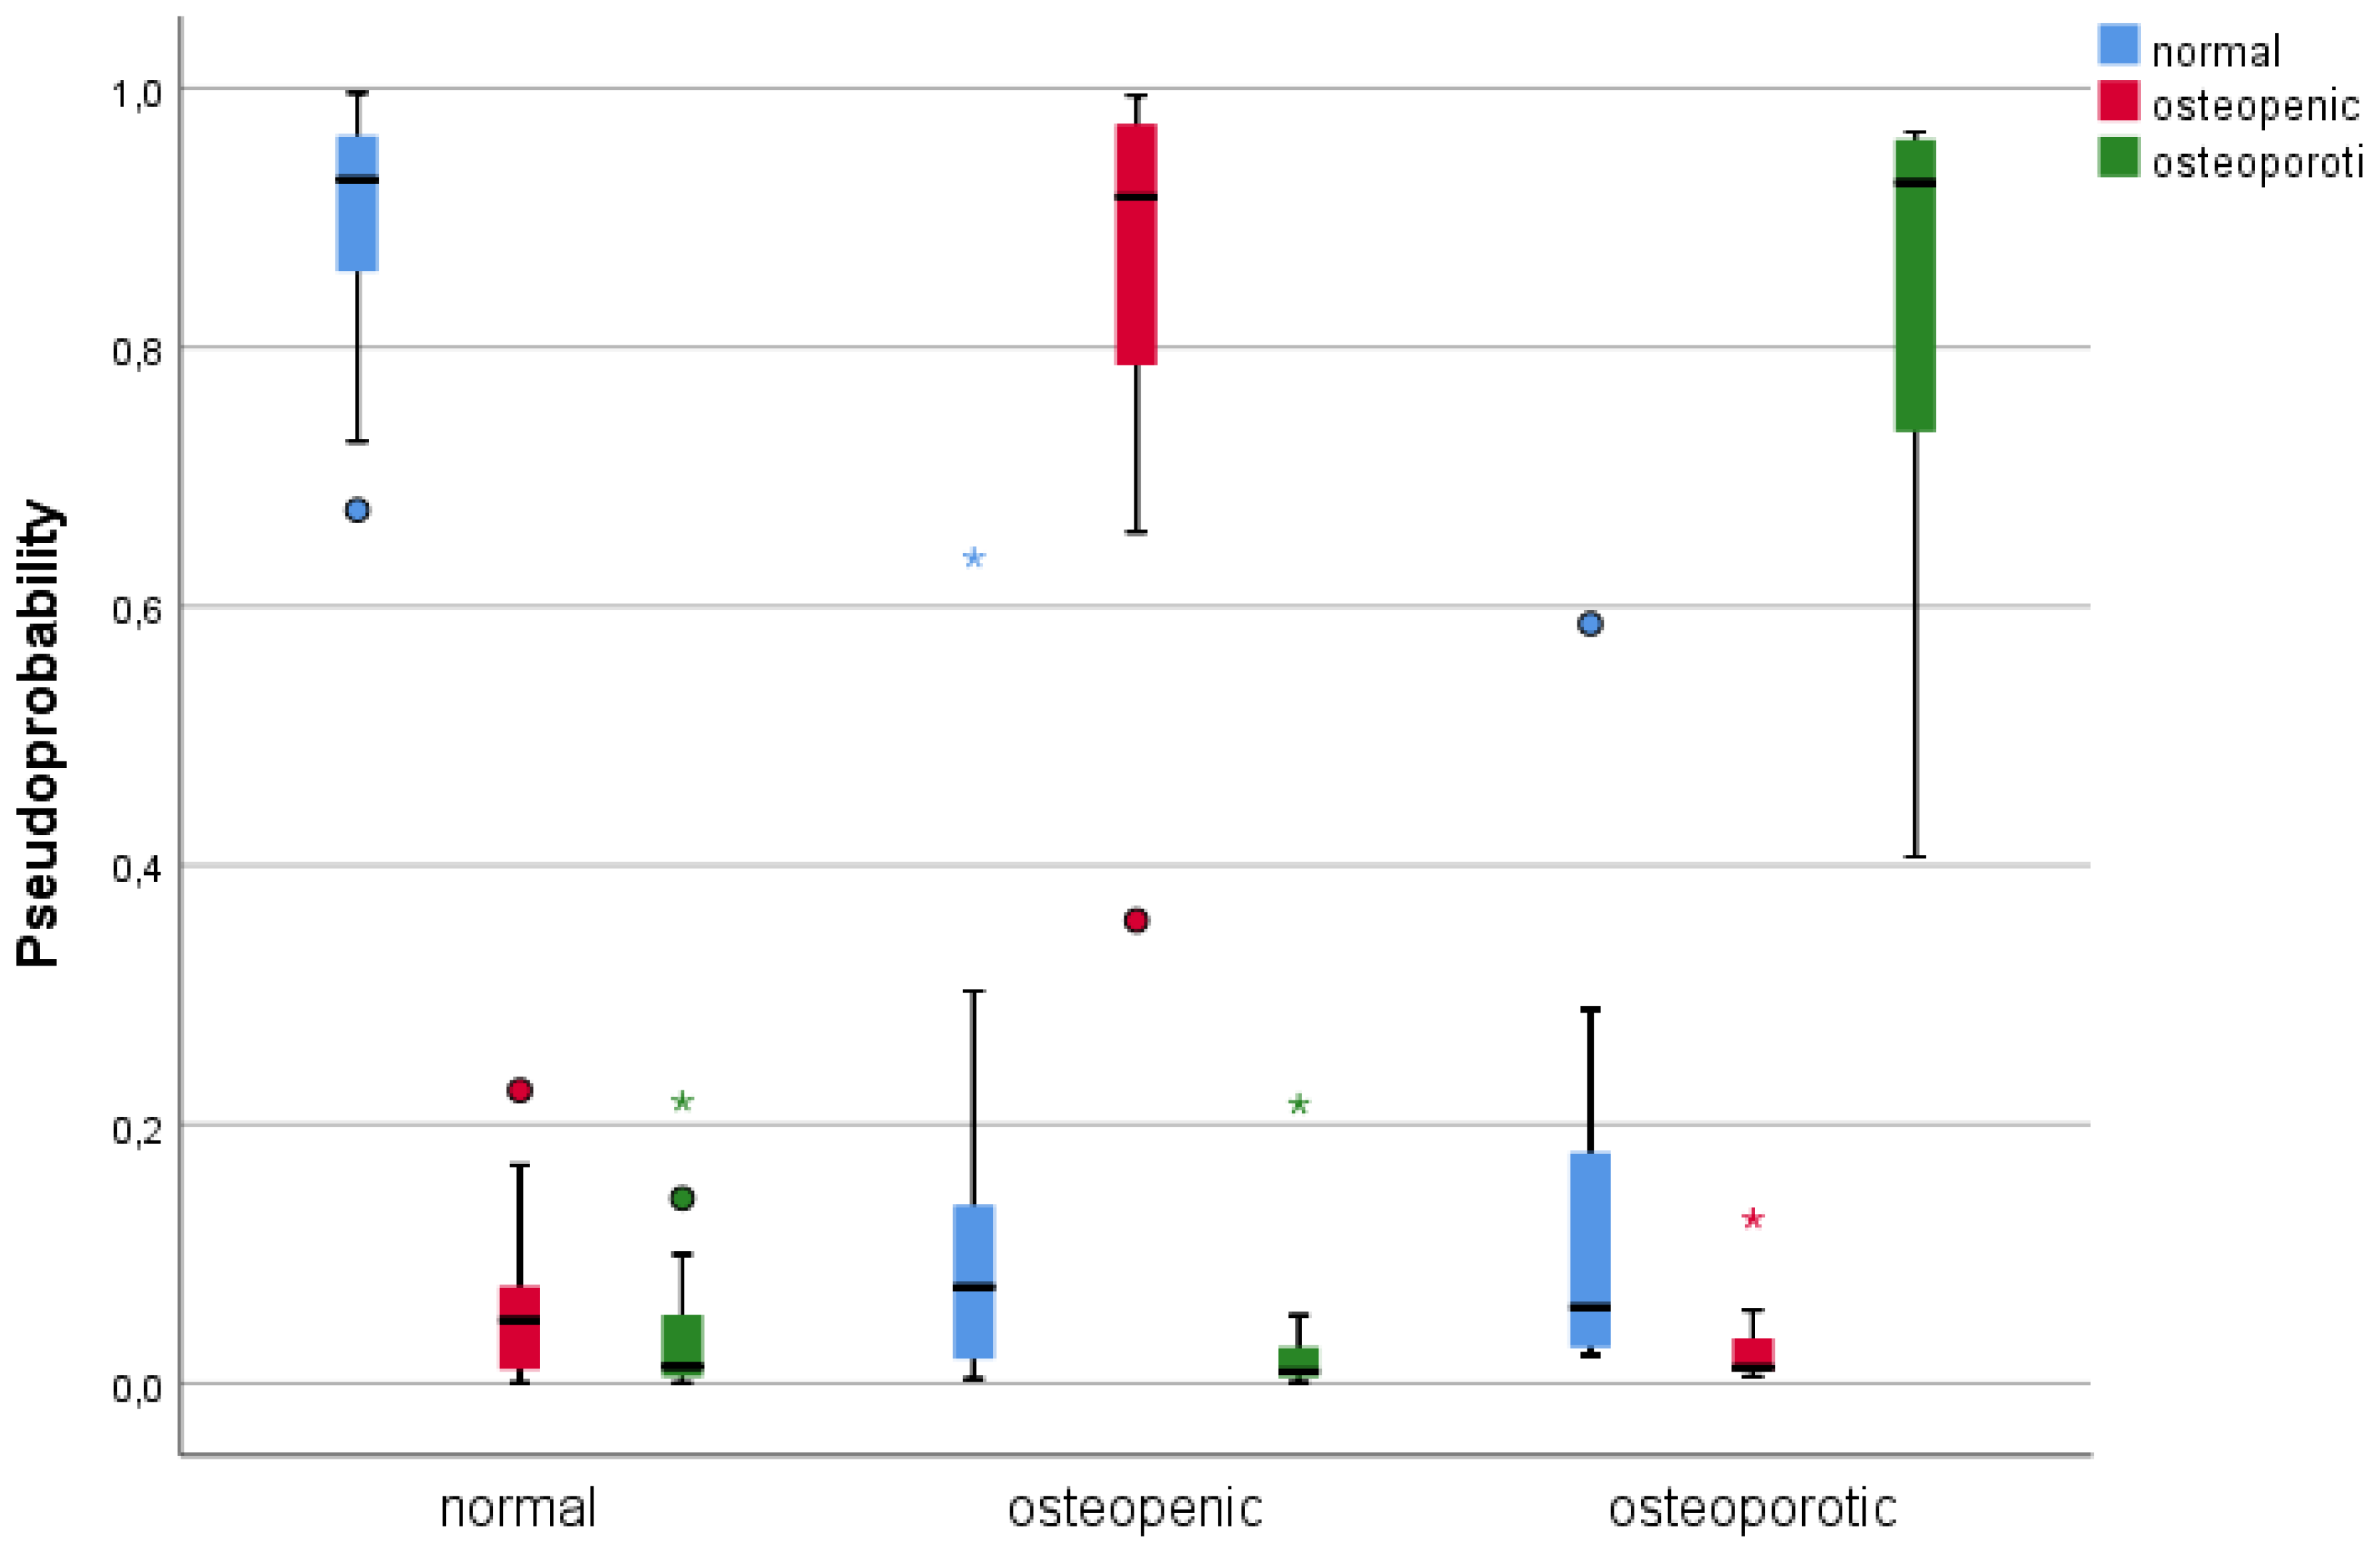
3.3. Single Layer Perceptron
4. Discussion
- Image quality control: It is important to ensure that the MRI images used for TA analysis are of high quality and free of artifacts such as motion or susceptibility artifacts. This can be achieved by implementing quality control measures such as visual inspection, automated motion correction algorithms, and coil sensitivity correction.
- Reproducible image acquisition: Reproducibility of MRI acquisition is critical for reliable TA analysis. To achieve this, it is essential to use standardized protocols for MRI acquisition, including imaging parameters, patient positioning, and scanner calibration.
- Automated segmentation: Accurate segmentation of bone and bone marrow regions in MRI images is essential for reliable TA analysis. Manual segmentation is subject to inter- and intra-observer variability, which can affect the reproducibility of TA features. Automated segmentation algorithms, such as thresholding or machine learning-based methods, can improve the accuracy and reproducibility of segmentation.
- Standardized TA parameters: There are many different TA features that can be derived from MRI images, and the choice of features can affect the reliability and reproducibility of BMD assessment. To address this issue, it is important to use standardized TA parameters that have been validated in previous studies.
- Calibration phantoms: Calibration phantoms can be used to ensure that the MRI images are consistent across different scanners and imaging protocols. These phantoms contain known concentrations of water and/or oil, and their signal intensity can be used to calibrate the MRI images.
- Multi-site studies: Multi-site studies involving different MRI scanners and patient populations can help to validate the reliability and reproducibility of TA features. By comparing the results from different scanners and patient cohorts, the robustness and generalizability of TA features can be evaluated.
Author Contributions
Funding
Institutional Review Board Statement
Informed Consent Statement
Data Availability Statement
Conflicts of Interest
References
- Guerri, S.; Mercatelli, D.; Aparisi Gómez, M.P.; Napoli, A.; Battista, G.; Guglielmi, G.; Bazzocchi, A. Quantitative Imaging Techniques for the Assessment of Osteoporosis and Sarcopenia. Quant. Imaging Med. Surg. 2018, 8, 60–85. [Google Scholar] [CrossRef] [PubMed]
- Shur, J.D.; Doran, S.J.; Kumar, S.; Ap Dafydd, D.; Downey, K.; O’Connor, J.P.B.; Papanikolaou, N.; Messiou, C.; Koh, D.-M.; Orton, M.R. Radiomics in Oncology: A Practical Guide. Radiographics 2021, 41, 1717–1732. [Google Scholar] [CrossRef] [PubMed]
- Knoepflin, P.; Pithioux, M.; Bendahan, D.; Poullain, F.; Le Corroller, T.; Fabre, C.; Pauly, V.; Creze, M.; Soldati, E.; Champsaur, P.; et al. Texture Parameters Measured by UHF-MRI and CT Scan Provide Information on Bone Quality in Addition to BMD: A Biomechanical Ex Vivo Study. Diagnostics 2022, 12, 3143. [Google Scholar] [CrossRef] [PubMed]
- Poullain, F.; Champsaur, P.; Pauly, V.; Knoepflin, P.; Le Corroller, T.; Creze, M.; Pithioux, M.; Bendahan, D.; Guenoun, D. Vertebral Trabecular Bone Texture Analysis in Opportunistic MRI and CT Scan Can Distinguish Patients with and without Osteoporotic Vertebral Fracture: A Preliminary Study. Eur. J. Radiol. 2023, 158, 110642. [Google Scholar] [CrossRef] [PubMed]
- Tuceryan, M.; Jain, A.K. Texture Analysis. In Handbook of Pattern Recognition and Computer Vision; World Scientific: Singapore, 1993; pp. 235–276. ISBN 978-981-02-1136-3. [Google Scholar]
- Benhamou, C.L.; Poupon, S.; Lespessailles, E.; Loiseau, S.; Jennane, R.; Siroux, V.; Ohley, W.; Pothuaud, L. Fractal Analysis of Radiographic Trabecular Bone Texture and Bone Mineral Density: Two Complementary Parameters Related to Osteoporotic Fractures. J. Bone Miner Res. 2001, 16, 697–704. [Google Scholar] [CrossRef] [PubMed]
- Bazzocchi, A.; Ponti, F.; Albisinni, U.; Battista, G.; Guglielmi, G. DXA: Technical Aspects and Application. Eur. J. Radiol. 2016, 85, 1481–1492. [Google Scholar] [CrossRef] [PubMed]
- Ballane, G.; Cauley, J.A.; Luckey, M.M.; El-Hajj Fuleihan, G. Worldwide Prevalence and Incidence of Osteoporotic Vertebral Fractures. Osteoporos. Int. 2017, 28, 1531–1542. [Google Scholar] [CrossRef]
- Varghese, B.A.; Cen, S.Y.; Hwang, D.H.; Duddalwar, V.A. Texture Analysis of Imaging: What Radiologists Need to Know. Am. J. Roentgenol. 2019, 212, 520–528. [Google Scholar] [CrossRef]
- Park, J.E.; Park, S.Y.; Kim, H.J.; Kim, H.S. Reproducibility and Generalizability in Radiomics Modeling: Possible Strategies in Radiologic and Statistical Perspectives. Korean J. Radiol. 2019, 20, 1124–1137. [Google Scholar] [CrossRef] [PubMed]
- Orlhac, F.; Eertink, J.J.; Cottereau, A.-S.; Zijlstra, J.M.; Thieblemont, C.; Meignan, M.; Boellaard, R.; Buvat, I. A Guide to ComBat Harmonization of Imaging Biomarkers in Multicenter Studies. J. Nucl. Med. 2022, 63, 172–179. [Google Scholar] [CrossRef] [PubMed]
- Maciel, J.G.; Araújo, I.M.D.; Trazzi, L.C.; Azevedo-Marques, P.M.D.; Salmon, C.E.G.; Paula, F.J.A.D.; Nogueira-Barbosa, M.H. Association of Bone Mineral Density with Bone Texture Attributes Extracted Using Routine Magnetic Resonance Imaging. Clinics 2020, 75, e1766. [Google Scholar] [CrossRef] [PubMed]
- Spagnoli, L.; Morrone, M.F.; Giampieri, E.; Paolani, G.; Santoro, M.; Curti, N.; Coppola, F.; Ciccarese, F.; Vara, G.; Brandi, N.; et al. Outcome Prediction for SARS-CoV-2 Patients Using Machine Learning Modeling of Clinical, Radiological, and Radiomic Features Derived from Chest CT Images. Appl. Sci. 2022, 12, 4493. [Google Scholar] [CrossRef]
- Moutarde, H.; Sznajder, P.; Wagner, J. Unbiased Determination of DVCS Compton Form Factors. Eur. Phys. J. C 2019, 79, 614. [Google Scholar] [CrossRef]
- Crombé, A.; Périer, C.; Kind, M.; De Senneville, B.D.; Le Loarer, F.; Italiano, A.; Buy, X.; Saut, O. T2 -based MRI Delta-radiomics improve response prediction in soft-tissue sarcomas treated by neoadjuvant chemotherapy. J. Magn. Reson Imaging 2019, 50, 497–510. [Google Scholar] [CrossRef] [PubMed]


| DXA DESCRIPTIVE STATISTICS | ||||
|---|---|---|---|---|
| Minimum | Maximum | Mean | Dev. Std. | |
| AREA | 0.485 | 18.710 | 14.12411 | 2.331933 |
| BMC | 6.680 | 20.850 | 12.07048 | 3.296413 |
| BMD | 0.529 | 1.636 | 0.85173 | 0.219239 |
| T-SCORE | −5.000 | 5.200 | −1.64048 | 2.043687 |
| PR | 49.000 | 154.000 | 81.85714 | 20.961320 |
| Z-SCORE | −3.800 | 8.100 | 0.22840 | 2.273391 |
| Feature | T1 | T2 | T2 Fat-Sat |
|---|---|---|---|
| First Order | |||
| Volume | 0.226 (0.005) | N.A. | N.A. |
| Surface | 0.228 (0.004) | N.A. | N.A. |
| Compacity | 0.179 (0.026) | N.A. | N.A. |
| Conv. Min. | −0.173 (0.032) | N.S. | N.S. |
| Conv. Max | N.S. | −0.166 (0.039) | N.S. |
| Conv. Kurtosis | −0.261 (0.001) | −0.265 (0.001) | N.S. |
| Conv. Excess Kurt. | −0.340 (<0.001) | −0.265 (0.001) | N.S. |
| Disc. Standard Dev. | N.S. | 0.224 (0.005) | 0.344 (<0.001) |
| Disc. Q2 | N.S. | 0.183 (0.022) | 0.169 (0.014) |
| Disc. Q3 | N.S. | 0.224 (0.005) | 0.253 (0.001) |
| Histogram Energy | −0.205 (0.010) | −0.260 (0.001) | −0.247 (0.002) |
| Histogram Entropy | N.S. | 0.199 (0.013) | 0.265 (0.001) |
| GLCM | |||
| Homogeneity | −0.205 (0.011) | −0.289 (<0.001) | −0.212 (0.008) |
| Contrast | N.S. | 0.169 (0.036) | 0.187 (0.020) |
| Entropy | 0.250 (0.002) | 0.280 (<0.001) | 0.258 (0.001) |
| Dissimilarity | N.S. | 0.231 (0.004) | 0.227 (0.005) |
| GLRLM | |||
| SRE | 0.167 (0.038) | 0.239 (0.003) | 0.173 (0.031) |
| LRE | −0.169 (0.035) | −0.241 (0.003) | −0.170 (0.034) |
| HGRE | N.S | 0.176 (0.028) | 0.247 (0.001) |
| SRHGE | N.S | 0.177 (0.028) | 0.275 (0.001) |
| LRHGE | N.S | 0.174 (0.031) | 0.272 (0.001) |
| GLNU | N.S | N.S | −0.160 (0.047) |
| RP | 0.168 (0.037) | 0.240 (0.003) | 0.172 (0.032) |
| GLZLM | |||
| SZE | −0.176 (0.028) | 0.216 (0.007) | 0.159 (0.048) |
| HGZE | N.S | 0.169 (0.036) | 0.271 (0.001) |
| SZHGE | N.S | 0.170 (0.034) | 0.270 (0.001) |
| ZLNU | N.S | N.S | 0.171 (0.033) |
| ZP | 0.160 (0.046) | 0.233 (0.004) | 0.173 (0.032) |
| NGLDM | |||
| Contrast | 0.237 (0.003) | 0.282 (<0.001) | 0.228 (0.004) |
| PET/CT | |||
| Agatston | N.S | N.S | −0.358 (0.013) |
| Peak Sphere 0.5 mL | N.S | N.S | 0.266 (0.001) |
| Peak Sphere 1.0 mL | N.S | N.S | 0.298 (<0.001) |
| LINEAR REGRESSION FOR BMD | ||||||
|---|---|---|---|---|---|---|
| FEATURE | B | Std. Err. | t | Sign. | 95% C.I. | Importance |
| CONSTANT | 29.560 | 11.620 | 2.544 | 0.012 | 6.675–52.445 | |
| T2 DISC. HISTO. ENTR. | −6.516 | 0.898 | −7.260 | <0.001 | −8.284–−4.749 | 0.169 |
| T2 NGLDM CONTRAST | 0.986 | 0.137 | 7.192 | <0.001 | 0.716–1.256 | 0.165 |
| T2 FS GLNU | −0.002 | 0.000 | −5.813 | <0.001 | −0.001–0.108 | 0.108 |
| T1 HISTO. ENERGY | −144.307 | 25.540 | −5.650 | <0.001 | −194.607–−94.007 | 0.102 |
| T1 MIN. | −0.001 | 0.001 | −4.443 | <0.001 | −0.002–−0.001 | 0.063 |
| T2 ZLNU | <0.001 | <0.001 | 4.133 | <0.001 | 0.000–0.000 | 0.055 |
| T2 LZLGE | >−0.001 | <0.001 | −3.023 | 0.003 | −0.000–−0.000 | 0.029 |
| T2 FS DISSI. | −0.024 | 0.008 | −2.834 | 0.003 | −0.040–−0.008 | 0.028 |
| T1 LZHGE | >−0.001 | <0.001 | −2.834 | 0.005 | −0.000–−0.000 | 0.026 |
| SLP | |||||
|---|---|---|---|---|---|
| Sample | Predicted | ||||
| Normal | Osteopenic | Osteoporotic | Correct | ||
| Training | normal | 21 | 0 | 0 | 100.0% |
| osteopenic | 1 | 10 | 0 | 90.9% | |
| osteoporotic | 1 | 0 | 5 | 83.3% | |
| global perc. | 60.5% | 26.3% | 13.2% | 94.7% | |
| Test | normal | 2 | 0 | 0 | 100.0% |
| osteopenic | 0 | 5 | 0 | 100.0% | |
| osteoporotic | 0 | 0 | 1 | 100.0% | |
| global perc. | 25.0% | 62.5% | 12.5% | 100.0% | |
| Feature | T1 | T2 | T2FS | Shape | % |
|---|---|---|---|---|---|
| CONVENTIONAL_min | 38.3% | 36.8% | 68.2% | SHAPE_Volume (mL) | 31.2% |
| CONVENTIONAL_mean | 32.9% | 40.4% | 29.3% | SHAPE_Volume (vx) | 43.7% |
| CONVENTIONAL_std | 46.8% | 27.7% | 28.6% | SHAPE_Sphericity | 31.5% |
| CONVENTIONAL_max | 28.0% | 23.4% | 43.7% | SHAPE_Surface (mm2) | 52.5% |
| CONVENTIONAL_Q1 | 27.9% | 24.9% | 40.0% | SHAPE_Compacity | 23.1% |
| CONVENTIONAL_Q2 | 35.3% | 30.9% | 42.8% | ||
| CONVENTIONAL_Q3 | 35.9% | 35.2% | 31.0% | ||
| CONVENTIONAL_Skewness | 43.3% | 65.7% | 69.5% | ||
| CONVENTIONAL_Kurtosis | 38.6% | 58.8% | 27.2% | ||
| CONVENTIONAL_ExcessKurtosis | 56.0% | 52.9% | 41.2% | ||
| CONVENTIONAL_peakSphere0.5mL:discretized volume sought | 34.1% | 26.5% | 27.1% | ||
| CONVENTIONAL_peakSphere0.5mL(value only for PET or NM) | 23.8% | 35.7% | 54.4% | ||
| CONVENTIONAL_peakSphere1mL:discretized volume sought | 28.9% | 16.2% | 46.8% | ||
| CONVENTIONAL_peakSphere1mL(value only for PET or NM) | 45.5% | 18.3% | 32.4% | ||
| CONVENTIONAL_calciumAgatstonScore[onlyForCT] | 58.8% | 30.8% | 44.4% | ||
| CONVENTIONAL_TLG (mL)[onlyForPETorNM] | 35.2% | 33.9% | 19.4% | ||
| DISCRETIZED_mean | 47.9% | 46.4% | 67.2% | ||
| DISCRETIZED_std | 47.3% | 59.4% | 52.7% | ||
| DISCRETIZED_Q1 | 48.2% | 49.0% | 53.5% | ||
| DISCRETIZED_Q2 | 40.7% | 39.0% | 54.9% | ||
| DISCRETIZED_Q3 | 25.2% | 40.8% | 59.8% | ||
| DISCRETIZED_Skewness | 31.5% | 53.2% | 55.5% | ||
| DISCRETIZED_Kurtosis | 43.4% | 75.6% | 64.0% | ||
| DISCRETIZED_ExcessKurtosis | 51.7% | 43.4% | 43.9% | ||
| DISCRETIZED_peakSphere0.5mL:discretized volume sought | 23.8% | 40.5% | 19.5% | ||
| DISCRETIZED_peakSphere0.5mL (value only for PET or NM) | 63.8% | 43.0% | 50.8% | ||
| DISCRETIZED_peakSphere1mL:discretized volume sought | 19.4% | 30.1% | 21.4% | ||
| DISCRETIZED_peakSphere1mL (value only for PET or NM) | 46.6% | 36.4% | 43.2% | ||
| DISCRETIZED_TLG (mL) [onlyForPETorNM] | 67.0% | 60.8% | 46.2% | ||
| DISCRETIZED_HISTO_Entropy_log10 | 64.0% | 50.4% | 40.4% | ||
| DISCRETIZED_HISTO_Entropy_log2 | 39.1% | 40.3% | 46.6% | ||
| DISCRETIZED_HISTO_Energy [=Uniformity] | 41.6% | 51.9% | 32.9% | ||
| GLCM_Homogeneity [=InverseDifference] | 46.6% | 26.4% | 26.4% | ||
| GLCM_Energy [=AngularSecondMoment] | 30.7% | 18.9% | 18.9% | ||
| GLCM_Contrast [=Variance] | 53.6% | 39.9% | 39.9% | ||
| GLCM_Correlation | 39.5% | 49.1% | 49.1% | ||
| GLCM_Entropy_log10 | 39.0% | 34.4% | 34.4% | ||
| GLCM_Entropy_log2 [=JointEntropy] | 38.2% | 38.7% | 38.7% | ||
| GLCM_Dissimilarity | 47.5% | 71.0% | 71.0% | ||
| GLRLM_SRE | 32.7% | 48.4% | 48.4% | ||
| GLRLM_LRE | 44.8% | 40.3% | 40.3% | ||
| GLRLM_LGRE | 27.9% | 36.1% | 36.1% | ||
| GLRLM_HGRE | 34.4% | 29.9% | 29.9% | ||
| GLRLM_SRLGE | 27.8% | 33.6% | 33.6% | ||
| GLRLM_SRHGE | 44.2% | 55.5% | 55.5% | ||
| GLRLM_LRLGE | 67.9% | 33.2% | 33.2% | ||
| GLRLM_LRHGE | 33.7% | 33.6% | 33.6% | ||
| GLRLM_GLNU | 47.4% | 36.5% | 36.5% | ||
| GLRLM_RLNU | 50.3% | 41.8% | 41.8% | ||
| GLRLM_RP | 42.8% | 34.1% | 34.1% | ||
| NGLDM_Coarseness | 61.0% | 45.8% | 45.8% | ||
| NGLDM_Contrast | 63.6% | 40.4% | 40.4% | ||
| NGLDM_Busyness | 100.0% | 32.9% | 32.9% | ||
| GLZLM_SZE | 30.9% | 50.5% | 50.5% | ||
| GLZLM_LZE | 36.8% | 51.8% | 51.8% | ||
| GLZLM_LGZE | 17.3% | 45.5% | 45.5% | ||
| GLZLM_HGZE | 37.3% | 50.9% | 50.9% | ||
| GLZLM_SZLGE | 27.6% | 35.6% | 35.6% | ||
| GLZLM_SZHGE | 48.9% | 32.3% | 32.3% | ||
| GLZLM_LZLGE | 27.4% | 28.8% | 28.8% | ||
| GLZLM_LZHGE | 20.3% | 59.1% | 59.1% | ||
| GLZLM_GLNU | 36.3% | 31.8% | 31.8% | ||
| GLZLM_ZLNU | 47.6% | 54.1% | 54.1% | ||
| GLZLM_ZP | 54.9% | 39.5% | 39.5% |
Disclaimer/Publisher’s Note: The statements, opinions and data contained in all publications are solely those of the individual author(s) and contributor(s) and not of MDPI and/or the editor(s). MDPI and/or the editor(s) disclaim responsibility for any injury to people or property resulting from any ideas, methods, instructions or products referred to in the content. |
© 2023 by the authors. Licensee MDPI, Basel, Switzerland. This article is an open access article distributed under the terms and conditions of the Creative Commons Attribution (CC BY) license (https://creativecommons.org/licenses/by/4.0/).
Share and Cite
Vara, G.; Spinnato, P.; Facchini, G.; Miceli, M.; Ursini, F.; Spinardi, L.; Vornetti, G.; Ratti, S. Assessment of Bone Mineral Density from Lumbosacral MRI: A Retrospective Study with Texture Analysis Radiomics. Appl. Sci. 2023, 13, 6305. https://doi.org/10.3390/app13106305
Vara G, Spinnato P, Facchini G, Miceli M, Ursini F, Spinardi L, Vornetti G, Ratti S. Assessment of Bone Mineral Density from Lumbosacral MRI: A Retrospective Study with Texture Analysis Radiomics. Applied Sciences. 2023; 13(10):6305. https://doi.org/10.3390/app13106305
Chicago/Turabian StyleVara, Giulio, Paolo Spinnato, Giancarlo Facchini, Marco Miceli, Francesco Ursini, Luca Spinardi, Gianfranco Vornetti, and Stefano Ratti. 2023. "Assessment of Bone Mineral Density from Lumbosacral MRI: A Retrospective Study with Texture Analysis Radiomics" Applied Sciences 13, no. 10: 6305. https://doi.org/10.3390/app13106305
APA StyleVara, G., Spinnato, P., Facchini, G., Miceli, M., Ursini, F., Spinardi, L., Vornetti, G., & Ratti, S. (2023). Assessment of Bone Mineral Density from Lumbosacral MRI: A Retrospective Study with Texture Analysis Radiomics. Applied Sciences, 13(10), 6305. https://doi.org/10.3390/app13106305


