Article

Effects of Abrupt Cross-Section Area Change on theMultiparameter Propagation Characteristics of Premixed Methane–Air Explosion in Pipes

1
School of Safety Science and Engineering, Anhui University of Science and Technology, Huainan 232001, China
2
State Key Laboratory of Mining Response and Disaster Prevention and Control in Deep Coal Mines, Anhui University of Science and Technology, Huainan 232001, China
*
Author to whom correspondence should be addressed.
Appl. Sci. 2023, 13(11), 6372; https://doi.org/10.3390/app13116372
Submission received: 12 April 2023 / Revised: 14 May 2023 / Accepted: 19 May 2023 / Published: 23 May 2023
(This article belongs to the Special Issue Advanced Underground Coal Mining and Ground Control Technology)

Abstract

:
This paper explores the effects of an abrupt cross-section area change of gas pipes on the propagation law of explosion. For this, an explosion pipe experimental system was established, and a numerical research was conducted. By experimental and numerical simulation, the evolution of the overpressure, temperature, vorticity, and kinetic energy of shock waves of gas explosion in abrupt pipelines was investigated. This allowed us to obtain expressions for the attenuation coefficient, increase coefficient, and reflection coefficient of gas explosion overpressure. The study indicates that an abrupt increase of the pipeline cross-section area leads to a decrease of shock wave overpressure and vice versa. For a given change of cross-section area, the attenuation coefficient gradually increases as the initial peak overpressure rises, whereas the increase coefficient and reflection coefficient both present a decreasing trend. An abrupt change in the pipe structure can inhibit the propagation of gas explosion flames. The explosive gas is affected by the turbulence effect after passing through the middle large-diameter pipe, and the vorticity curve exhibits a clear peak. In addition, the large eddy motion caused by strong confinement increases the kinetic energy of the gas in pipes. The above research outcomes contribute to further enriching the basic theory of gas explosion for the study of gas explosion propagation in mining laneway.

1. Introduction

Gas accidents are one of five natural disasters in mines, accounting for over 35% of the total, and are known as the “first killer” [1,2,3]. Roadways or pipelines that have an abrupt change in their cross-section areas are widely used in underground engineering tunnels or industrial pipelines. Gas explosions often occur in these local areas, which clearly have an adverse impact on safety [4]. Studying the impact of abrupt cross-section changes on premixed methane air explosions in pipelines can help suppress coal-mine gas explosions and is of great significance for proposing measures to prevent gas explosions.
Numerous scholars have studied the relevant theories of the shock wave propagation in pipes with abrupt changes in their cross-section area. Through theoretical derivation, Jia and Yang [5,6] established a theoretical model of the shock wave propagation in bending and bifurcation tunnels. Liu et al. [7] proposed a method of calculating the pressure drop in circular pipes with different shrinkage and expansion diameters. Gao et al. [8] studied the destroy mode of gas explosions, which was mainly caused by shock wave overpressure and high-speed airflow. The former ignores the influence of mass force and wall friction, which presents a host of disadvantages. By comparison, the latter is mostly used to calculate the hydraulic loss of industrial pipeline fluids but is not applicable to the calculation of gases.
Through experiments and numerical simulations, a large number of scholars have conducted extensive research on the propagation law of gas explosions in pipelines with different structures and obstacles [9,10]. Salzano et al. [11] found that the blocking rate and cross-section area change in pipes would result in turbulence. Lin et al. [12,13,14] carried out numerous studies on the effects of bifurcated pipes, obstacles, bending pipes, and continuous bending pipes on gas explosion shock and flame waves in confined spaces. Fang et al. [15,16,17,18] studied the propagations law of blast waves, which were influenced by the dimensions, arrangements, and shapes of obstacles. Sun and Zheng [19,20] used AutoGas software to study the effect of structure pipes on the combustion and explosion of premixed gas. Yin et al. [21] studied the propagation characteristics, eddy current generation, and quenching performance of detonation waves in variable structure pipelines. Jia et al. [22] obtained the attenuation law of pipeline explosion shock waves in bifurcated pipelines. Xue et al. [23,24] obtained the rule of U-shaped pipe structure on wave propagation of gas explosion. Zhu et al. [25,26] found that the branching structure of pipelines can lead to turbulence by studying the flame acceleration process. Obviously, the above studies focused on the blast wave propagation characteristics of internal obstacles in pipelines, bifurcated pipes, bending pipes, and special structured pipelines, with only a few studies exploring the propagation laws in pipes with abrupt cross-section area changes. The influence of abrupt changes in cross-section area on gas explosion propagation is unclear, and the overpressure reflectivity in the regions of abrupt cross-section area changes remains unknown. In particular, the relationships between the ratio of abrupt cross-section areas and explosion parameters has rarely been studied.
Therefore, for this study, a pipe system with an abrupt cross-section area change was established, and gas explosion pipeline experiments were conducted. This experiment investigated the overpressure propagation laws of various premixed methane–air volumes and five pipe diameters with abrupt cross-section area changes. The purpose was to determine the explosion propagation laws of premixed methane–air in various abrupt cross-section pipelines. The research outcomes provide important guidelines for the prevention and treatment of gas explosions in sudden changes in mine cross-section tunnels.

2. Experimental Research on Gas Explosion Shock Wave along Pipes with Abrupt Cross-Section Area Change

2.1. Experimental System

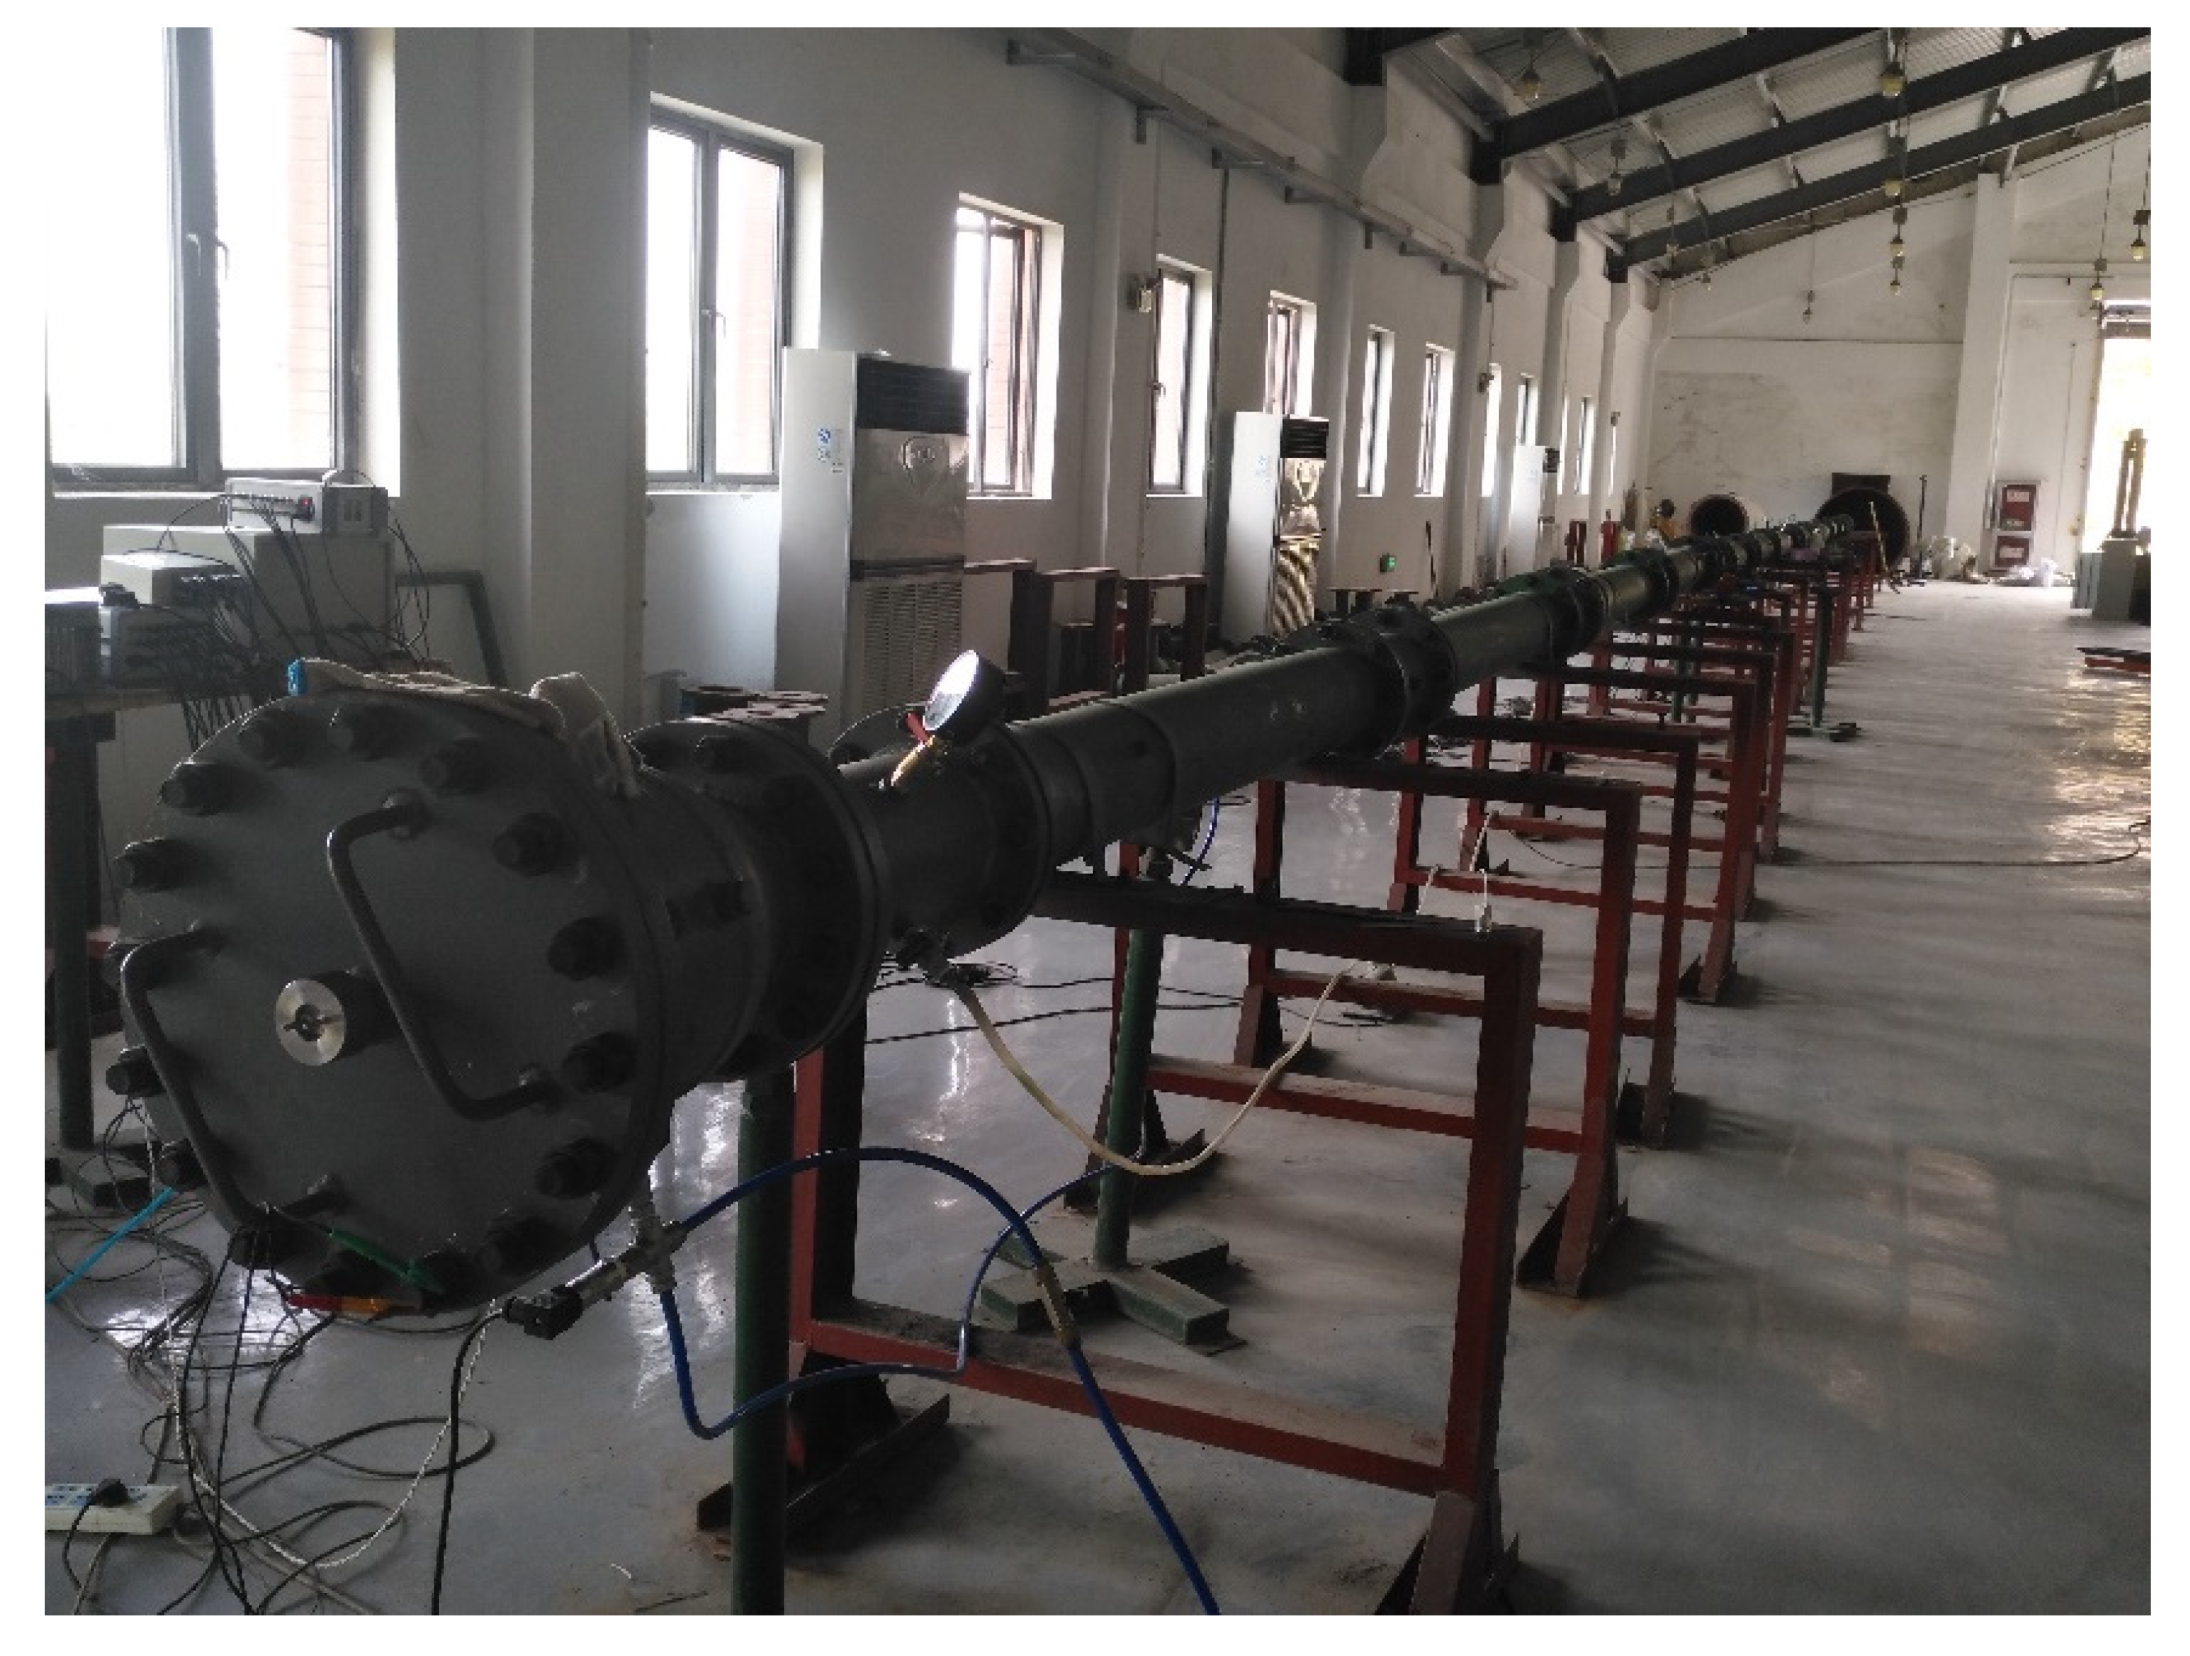
To reveal the propagation law of gas explosion in abrupt cross-section area-change pipes, an experimental system of gas explosion was established. Figure 1 shows the diagram of gas explosion experimental device. The whole system consists of an ignition system, data acquisition system, gas distribution system, and explosion pipeline system. The ignition position is a blasting cavity with 0.18 m3 volume, and the pipes are composed of 16 Mn steel, which is resistant to 20 MPa pressure, and have a diameter of 180 mm. The on-site gas explosion pipeline system is shown in Figure 2. The ignition system uses electric sparks produced by 36-V DC for ignition. The high-speed data acquisition system mainly uses the TST5206 dynamic data collection unit to collect data. The gas-mixing equipment configures a mixture of gas and air with different concentrations, and the method used for gas distribution is Dalton’s partial pressure law.

2.2. Experimental Scheme

The experimental pipeline consists of two parts, i.e., A and B, filled with the methane–air mixture with a concentration of 9.5% and air, respectively.
To investigate the impact of abrupt cross-section area changes on the propagation law of a methane–air mixture in pipes, the middle part of the experimental pipe is set to have different diameters. The pipe has three distinct segments measuring 12 m, 2 m, and 4 m in length, respectively. The diameter of the middle part is set to 0.2 m, 0.24 m, 0.28 m, 0.32 m, or 0.36 m for five different trials, while the diameter of the other segments is fixed at 0.18 m. Ten pressure sensors are evenly spaced on the centerline of the experimental pipeline. The points for the sensor layout are shown in Figure 1. The distance data between monitoring points and explosion source are shown in Table 1. Peak overpressures at the measurement points P1, P2, ⋯, and P10 are represented as Δ p 1 , Δ p 2 , ⋯, and Δ p 10 , separately.
The experimental steps include installation and debugging, air-tight test, inflation and gas distribution, cyclic mixing, ignition, and data collection. The ambient temperature of the experiment was 298 K, and ambient pressure was 101.325 kPa.
Experiments mainly focus on the shock wave attenuation laws under various pipes with abrupt cross-section area changes. Therefore, in the experiments, the methane–air mixture at a volume of 0.18 m3, 0.23 m3, and 0.28 m3 with a 9.5% concentration was added to the pipe. Three experiments were conducted under each operating condition, and we took the average of the three experimental results as the total result. At the same time, pressure sensors and temperature sensors were, respectively, installed in the explosion and combustion chambers to monitor whether the reaction was completed.

2.3. Experimental Results and Analysis

The overpressures at different monitoring points in five different pipe configurations and with three distinct gas volumes were measured in the experiments. The focus of the subsequent analysis was the influence of initial peak overpressure and the ratio of abrupt cross-section areas on the pipe attenuation coefficient. Taking the monitoring data of a middle pipeline with a 0.36 m diameter when the volume of methane air was 0.18 m3 as an example, the variation law of gas explosion shock wave overpressure at abrupt cross-section area change was analyzed.
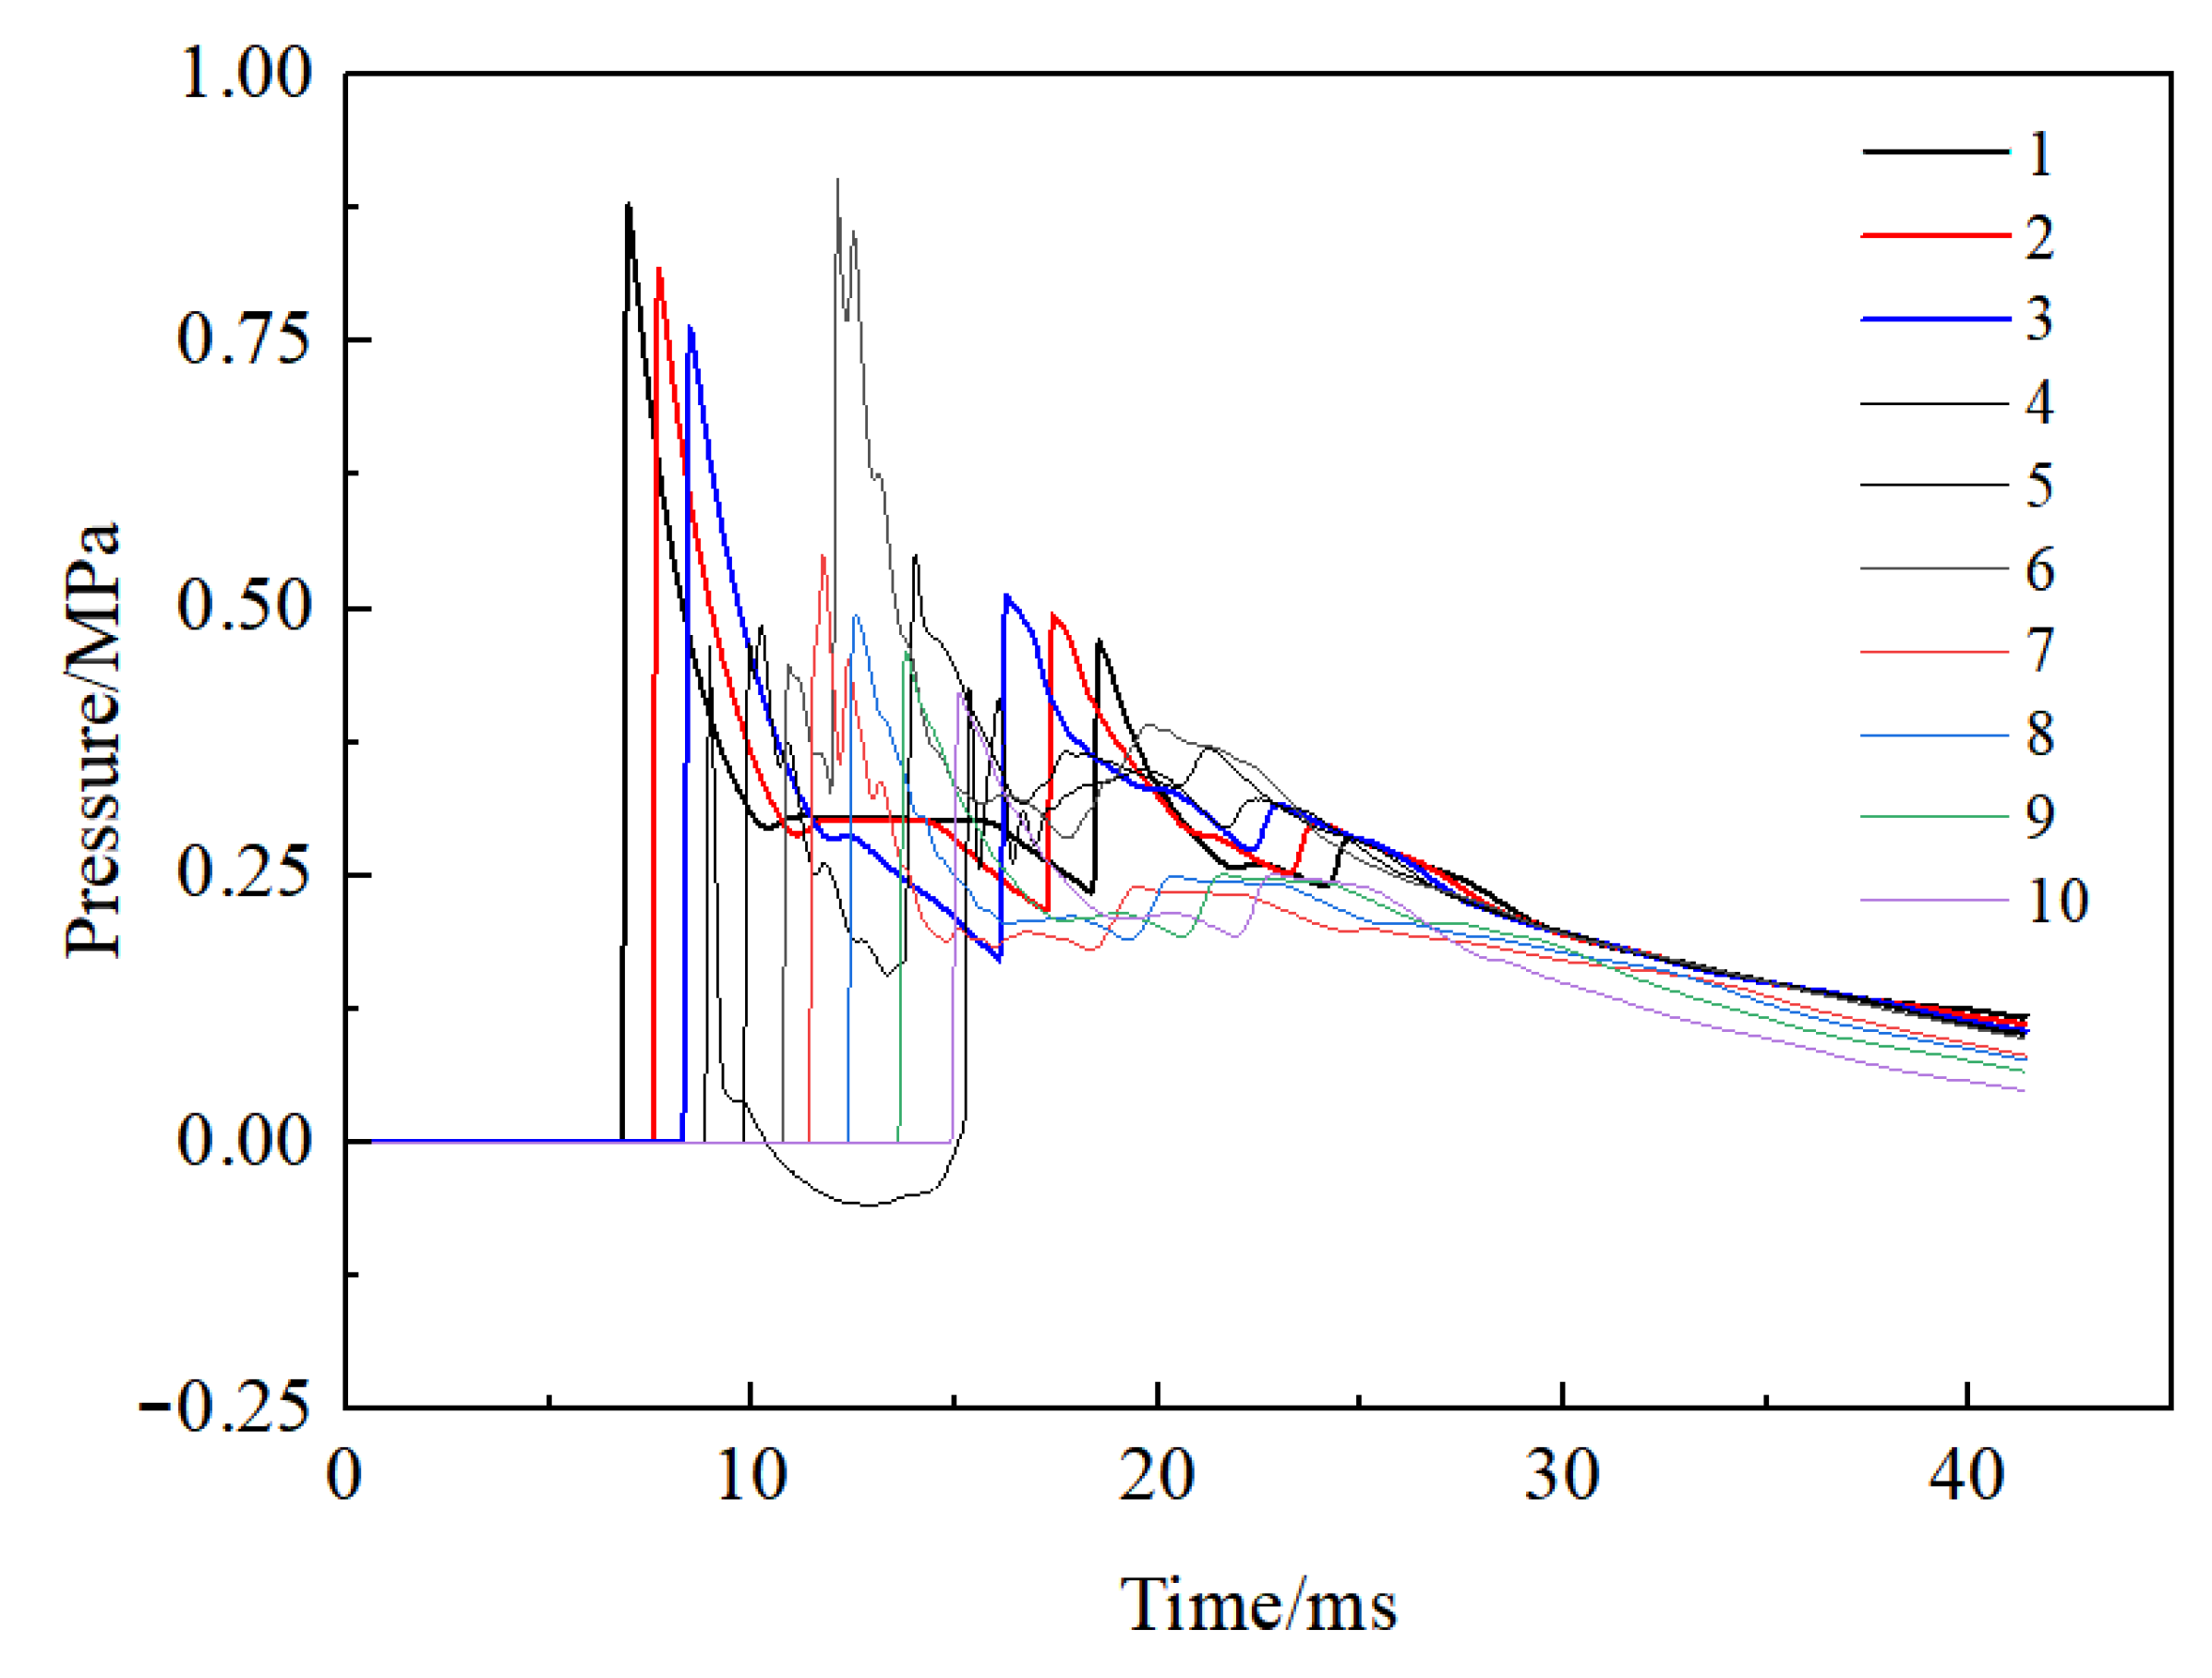
Figure 3 shows the overpressure changes at each measurement point in the pipe for the case of 0.18 m3 combustible gas and the 0.36 m diameter of the middle pipe. The overpressure change curves at measuring points 1, 2, and 3 were basically the same, and two clear peak overpressures occurred. The first peak overpressure was formed by shock wave attenuation from explosive source, while the second peak overpressure was formed by reflection wave from the large cross-section pipe to the small cross-section pipe. At measuring points 4–6, the first peak overpressure measured 0.4646 MPa, 0.4687 MPa, and 0.4475 MPa, respectively, suggesting an increasing and then decreasing trend. However, the second peak overpressure increased from 0.4254 MPa at measuring point 4 to 0.902 MPa at measuring point 6, showing a gradually increasing trend. This indicates that reflected waves appeared at the location where the cross-section area decreases from the large pipe to the small pipe, and these were superimposed onto the incident waves, resulting in the overpressure of reflected waves exceeding that of the incident waves. When the shock wave propagated from the small cross-section pipe to the large cross-section pipe (measuring points 6 and 7), the overpressure changed from 0.7638 MPa to 0.4646 MPa, a decrease of 39.17%. This is mainly because the diffraction intensity of shock wave decreases in this region. However, when the shock wave propagated from the large cross-section pipe to the small cross-section pipe, the peak overpressure changed from 0.4475 MPa to 0.5299 MPa, an increase of 18.41%. It can be concluded that, when the cross-section area of a pipeline changes abruptly from small to large, the peak overpressure decreases. In contrast, when the cross-section area of a pipeline changes abruptly from large to small, the shock wave overpressure increases. The curves of overpressure at measuring points 7–10 were basically the same because they were not disturbed by abrupt change in a cross-section area of the pipeline.
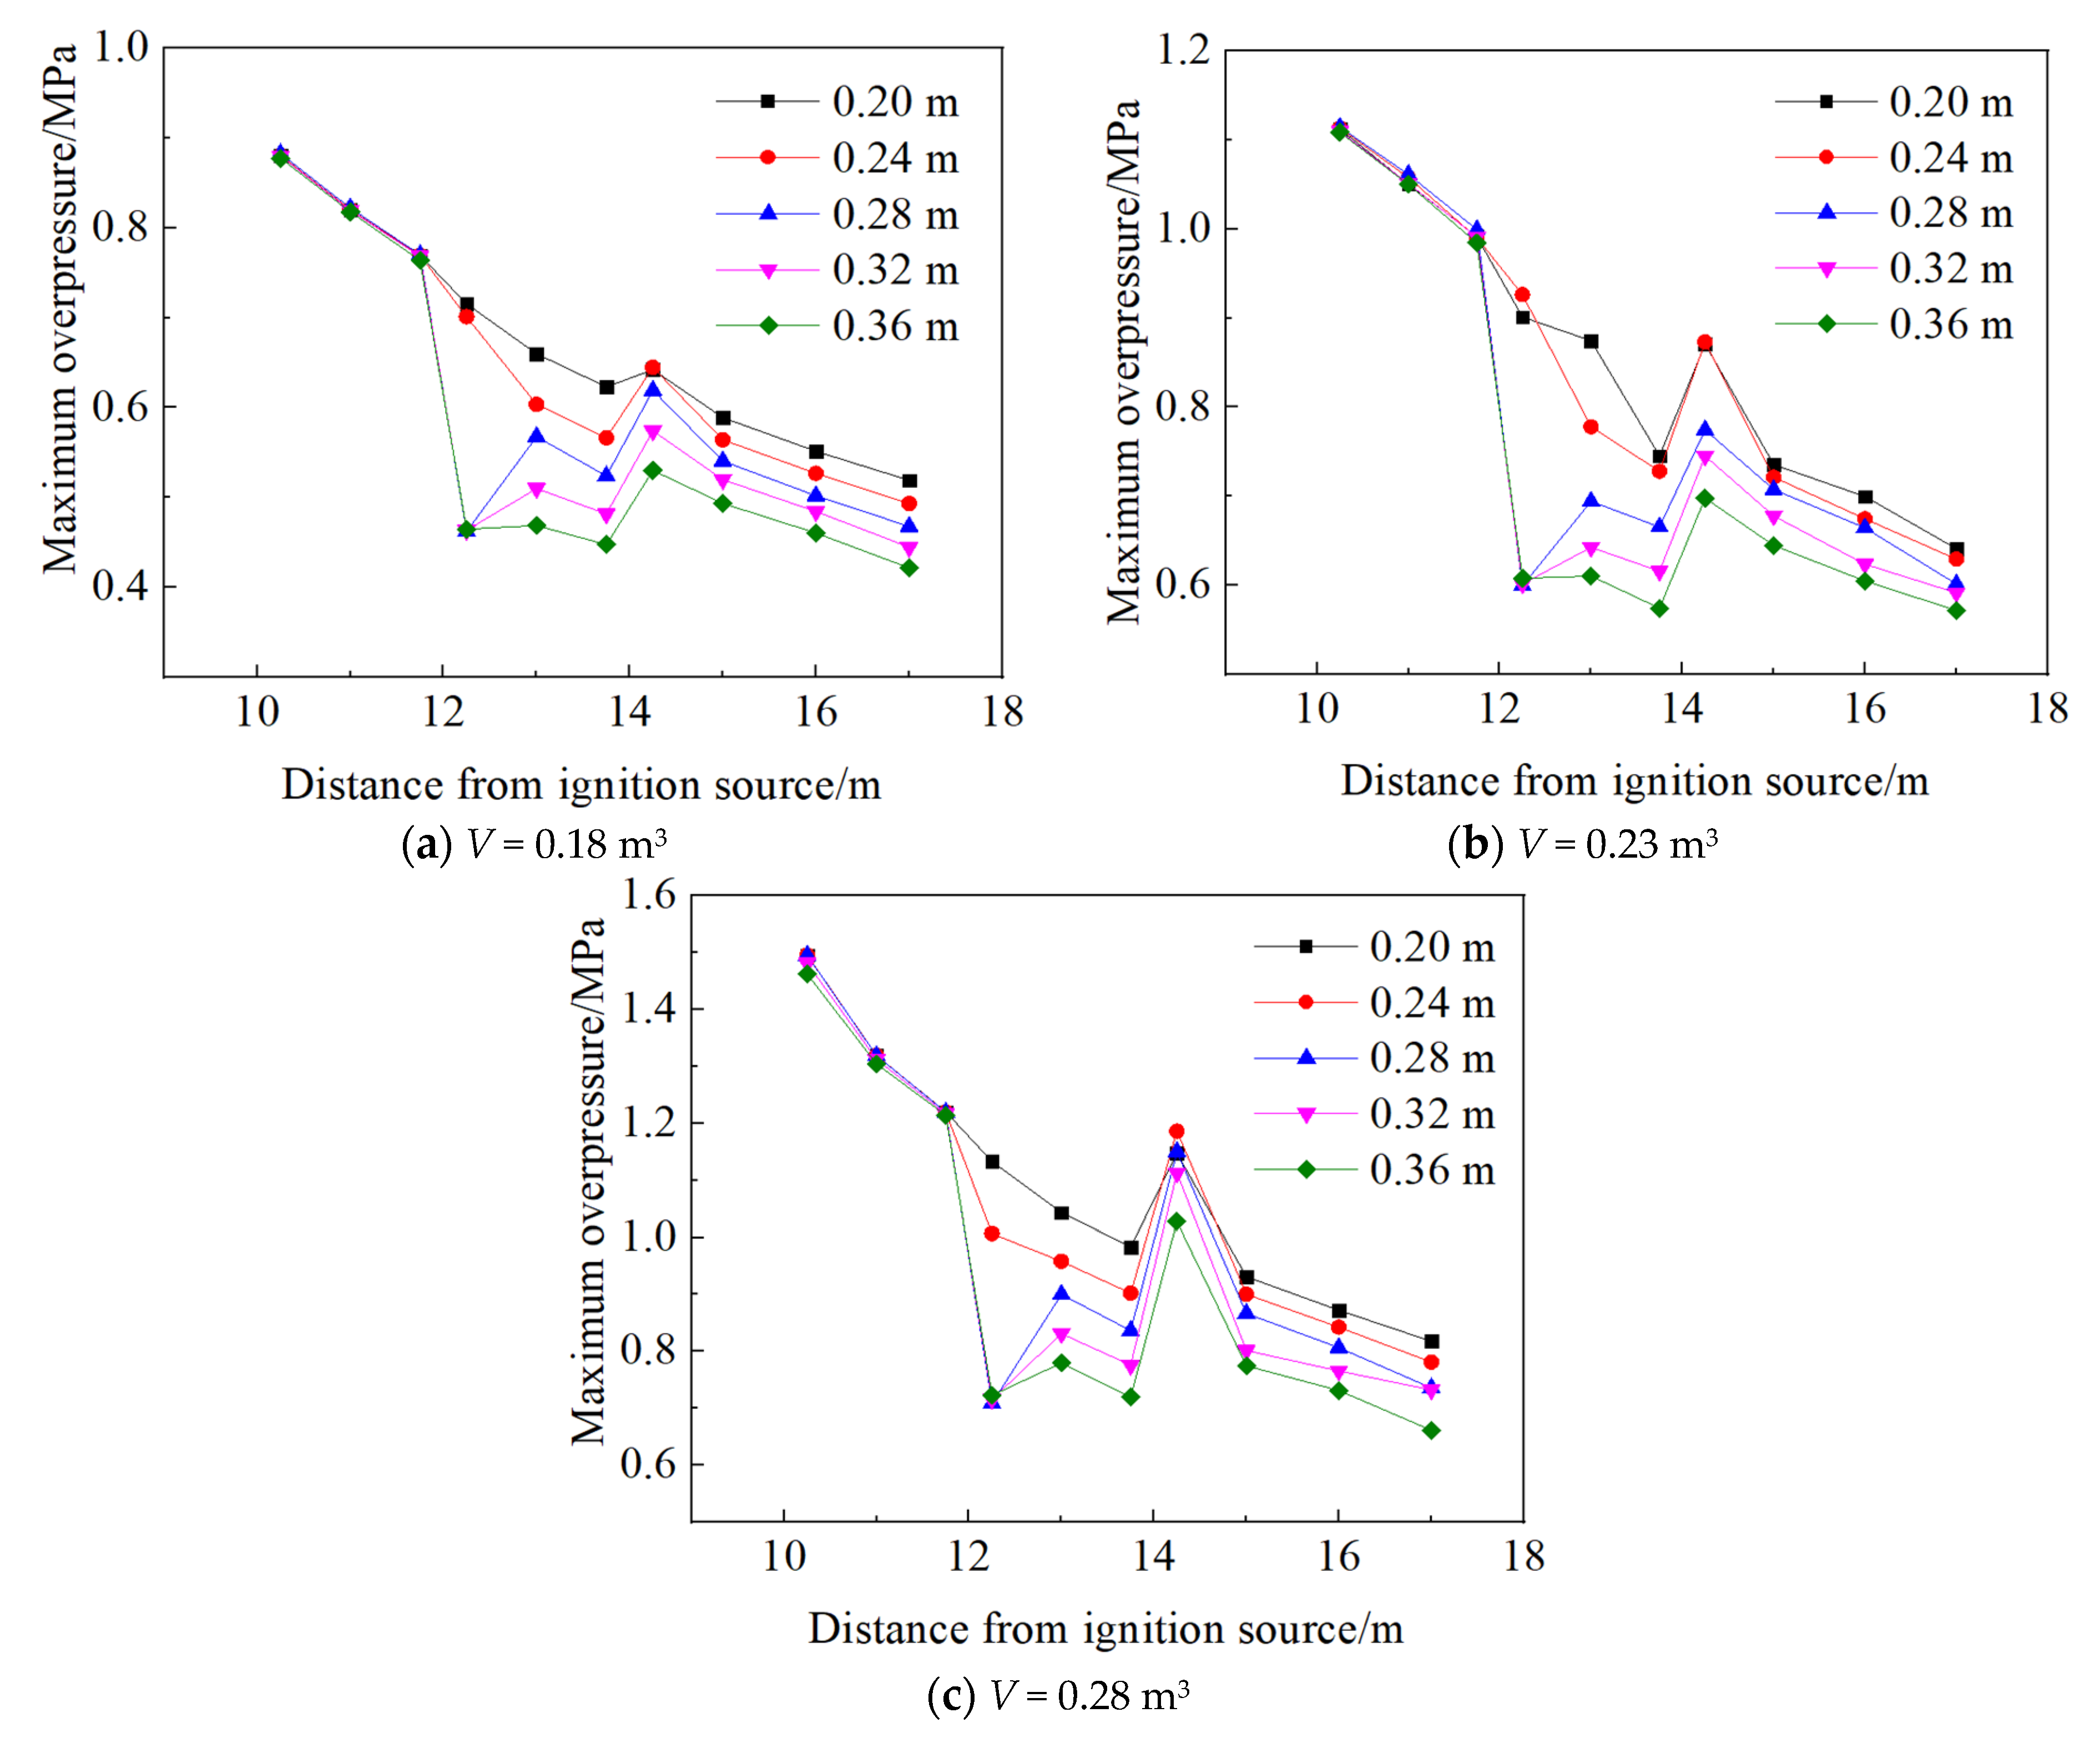
Figure 4 shows the change in peak overpressure with respect to distance for different pipes with fuel volumes of 0.18 m3, 0.23 m3, and 0.28 m3. When the diameter of the middle section of the pipeline is no greater than 0.24 m, the peak overpressure tends to decrease first, then increase, and finally decrease again. However, when the diameter of middle section of the pipeline is greater than 0.24 m, peak overpressure again decreases, increases, and decreases before finally increasing and decreasing once more.
To characterize the variation laws of maximum explosion overpressure in the pipes with abrupt cross-section area change, three concepts are proposed: attenuation coefficient, increase coefficient, and reflection coefficient. Attenuation coefficient (k) refers to the ratio of initial peak overpressure to peak overpressure after an abrupt cross-section increase of the pipe. Increase coefficient (Ω) refers to the ratio of initial peak overpressure to peak overpressure after an abrupt cross-section decrease of the pipe. Reflection coefficient (Ψ) refers to the ratio of reflected wave peak overpressure to initial peak overpressure.
Here, Δ p 3 represents initial peak overpressure before an abrupt cross-section increase, Δ p 4 represents peak overpressure after an abrupt cross-section increase, Δ p 6 represents initial peak overpressure before an abrupt cross-section decrease, Δ p 7 represents peak overpressure after an abrupt cross-section decrease, and Δ p 6 represents reflected wave peak overpressure after an abrupt cross-section decrease. Therefore, k, Ω, and Ψ are calculated as follows:
k = Δ p 3 Δ p 4 ,   Ω = Δ p 6 Δ p 7 ,   Ψ = Δ p 6 Δ p 6
In addition, S1 represents a cross-section area at either end of the pipe, and S2 represents a cross-section area of the middle segment of the pipe. Therefore, S 2 S 1 represents the ratio of abruptly changing cross-section areas.
Table 2 presents the experimental values of initial peak overpressure, reflected wave peak overpressure, and peak overpressure after abrupt cross-section area changes under different fuel volumes. The attenuation coefficient, increase coefficient, and reflection coefficient obtained using Equation (1) are also listed.
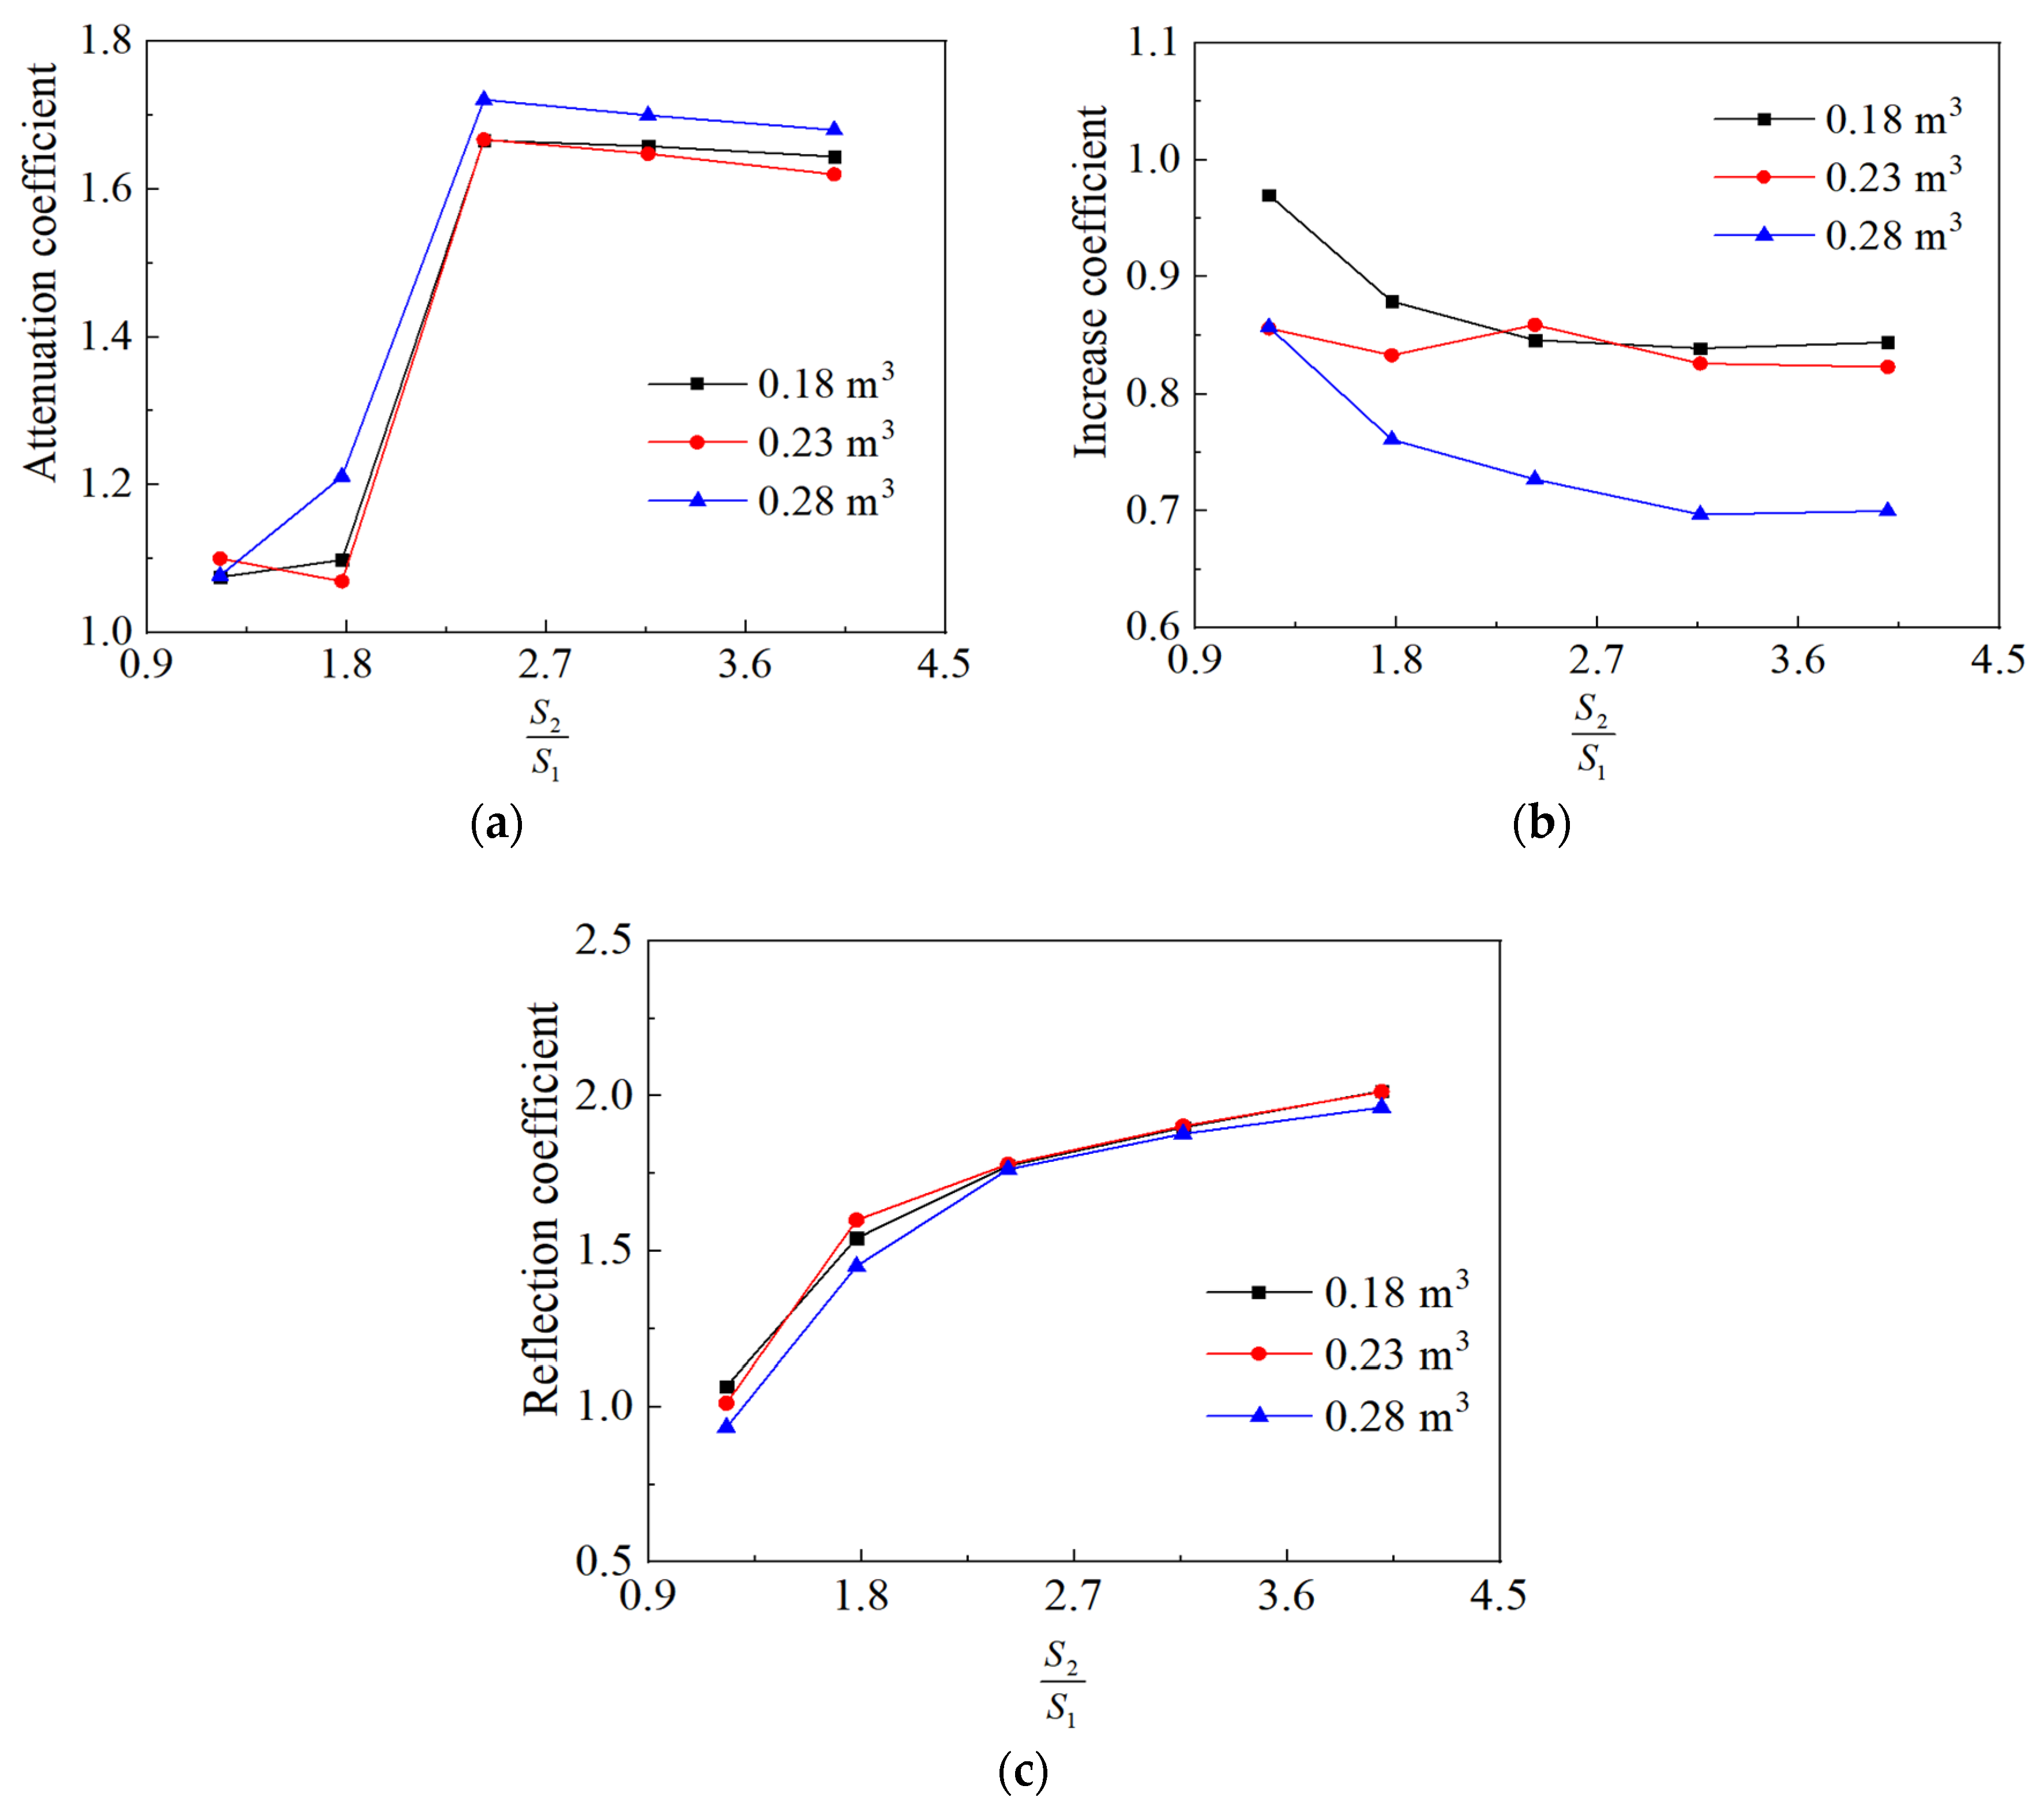
Figure 5 shows the relationships between attenuation coefficient, increase coefficient, reflection coefficient, and the ratio of abrupt cross-section areas. The coefficients are affected by both the ratio of abrupt cross-section area change and initial peak pressure before abrupt cross-section area changes. When the ratio of abrupt cross-section area change is less than 2, the attenuation coefficient ranges from 1.069–1.211; when the ratio of abrupt cross-section area change is greater than 2, the attenuation coefficient ranges from 1.644–1.721. For the same ratio of abrupt cross-section area change, the attenuation coefficient increases with initial peak pressure before the abrupt cross-section area change increases, but the increase is limited. The increase coefficient decreases as the ratio of abrupt cross-section area change increases, but the variation is limited, whereas the reflection coefficient increases with the ratio of abrupt cross-section area change. For a fixed ratio of cross-section areas, the increase coefficient decreases as the initial peak overpressure rises before an abrupt cross-section decrease, whereas the reflection coefficient decreases as the initial peak overpressure rises.
There is a specific relationship between the attenuation coefficient, initial peak overpressure, and the ratio of abrupt cross-section area change. Therefore, when a cross-section area changes abruptly from small to large, it is assumed that the relationship between the attenuation coefficient, initial peak overpressure, and the ratio of abrupt cross-section area change is as follows:
k = A 1 ( Δ p ) B 1 S 2 S 1 C 1
where A1, B1, and C1 are coefficients and exponents of nonlinear model.
According to the data in Table 2, multivariate nonlinear regression of Equation (2) was carried out using Matlab 2018 Student Edition, whichi was is a comprehensive mathematical software launched by MathWorks in the United States. The Curve Fitting App tool in Curve Fitting Toolbox was used to fit functions. The following coupling relationships were computed:
k = 1.063 ( Δ p ) 0.112 S 2 S 1 0.105 1 < S 2 S 1 1.78 1.752 ( Δ p ) 0.055 S 2 S 1 0.043 1.78 < S 2 S 1 4
The fitting degree of the above relationships was found to be R2 = 0.747. Thus, the relationship given by Equation (3) between the attenuation coefficient, initial peak overpressure, and the ratio of abrupt cross-section area change is suitable for practical calculations.
Similarly, when a cross-section area changes abruptly from large to small, the same fitting method gives the coupling relationships between the increase coefficient, reflection coefficient, initial peak overpressure, and the ratio of abrupt cross-section area change:
Ω = 0.84 ( Δ p ) 0.322 S 2 S 1 0.189
ψ = 1.061 ( Δ p ) 0.047 S 2 S 1 0.473
The fitting degrees of the above two relationships were found to be R2 = 0.803 and R2 = 0.875, respectively. Thus, the relationships given by Equations (4) and (5) for the increase coefficient, reflection coefficient, initial peak overpressure, and ratio of cross-section area change are suitable for practical calculations.

3. Numerical Simulations of Gas Explosion along Pipelines with Abrupt Cross-Section Area Changes

The propagation characteristics of gas explosion overpressure along pipelines with abrupt cross-section area changes were studied using numerical simulation methods, and the change laws pertaining to gas explosion temperature, vorticity, and kinetic energy were then studied.

3.1. Numerical Calculation Methods

In the numerical simulation, the premixed gas of gas explosion can be regarded as ideal mixed gas, and gas explosion can be characterized by energy conservation, momentum conservation, mass conservation, and composition balance equation [27]. Usually, the Reynolds-averaged N-S equation is used as governing equation [28,29]. The main equations are as follows:
ρ t + ( ρ u ) x = 0
ρ u t + ( ρ u u ) x = p x + 4 3 μ e u x
ρ h t + x ρ u h μ e σ h h x = D p D t + S h
t ( ρ Y f u ) + x ρ u Y f u μ e σ f u Y f u x = R f u
where P is static pressure; ρ is density; u is particle velocity; μ e is dynamic viscous coefficient; h is enthalpy; Y f u is fuel mass fraction; R f u is volume combustion rate; k is turbulent kinetic energy; and S h is the heat source term.
Turbulence is an important factor characterizing gas explosion or combustion. The turbulence model, turbulent kinetic energy equation, and turbulent flow energy dissipation rate equation are as follows [30]:
t ( ρ k ) + x j ρ u j k μ e σ k k x j = G ρ ε
t ( ρ k ) + x j ρ u j ε μ e σ k ε x j = C 1 G ε k C 2 ρ ε 2 k
where μ e = μ l + μ t is the effective viscous coefficient; μ l is the laminar viscous coefficient; μ t = C μ ρ k 2 / ε is the turbulent viscous coefficient; δ i j is the Kronecker operator; C μ , C 1 , C 2 , σ k , and σ ε are the turbulent model constants, respectively; and G is obtained as follows:
G = u i x j μ e ( u i x j + u j x i ) 2 3 δ i j ( ρ k + μ e u k x k )
Gas explosion is a complex chemical reaction process. Both turbulence effects and chemical reaction kinetics must be considered simultaneously. Therefore, the EBU Arrhenius combustion model is adopted [31]. Usually, turbulent flame velocity is calculated based on flame front model, and turbulent flame velocity U t is given by the following equation:
U t = A u 3 / 4 U l 1 / 2 α 1 / 4 l t 1 / 4 g = A u τ l τ c 1 / 4 g
Turbulence intensity u and turbulence characteristic scale l t are calculated as follows:
u = 2 3 k , l t = C D u 3 ε
where A is model constant, usually 0.52; U l is laminar flame velocity [m/s]; α = k / ρ c p is the heat transfer coefficient of temperature, m2/s; τ l = l t / u is the turbulence time scale; τ c = α / U l 2 is the time scale of the chemical reaction; g is the flame stretching factor (when there is no stretching, g = 1 ); and C D is a constant, usually 0.37.
In the numerical simulations, the SIMPLEC algorithm [32] for pressure–velocity coupling was selected, and the finite volume method [33,34] was adopted.

3.2. Analysis of Pressure Wave Transmission Process in the Pipes

Taking the simulation results for a 0.18 m3 fuel volume and a 0.36 m middle pipe diameter as an example, the whole propagation process of a gas explosion is shown in Figure 6.
It can be seen from Figure 6 that, during the gas explosion process, the changes in explosion pressure are complicated. When the pressure wave propagates from a small cross-section pipe to a large cross-section pipe, the pressure wave is disturbed by n expansion cavity at an abrupt change in diameter, and the pressure wave decreases in intensity. When the pressure wave propagates from a large cross-section pipe to a small cross-section pipe, the air flow turns, and the pressure wave exhibits a reflection phenomenon. Here, the incident wave and reflection wave become superposed, and the reflection wave becomes stronger.
The shock wave overpressure value was calculated for a 0.18 m3 fuel volume and middle pipe diameters of 0.2 m, 0.24 m, 0.28 m, 0.32 m, and 0.36 m. From Figure 7, it is evident that the numerical simulations qualitatively match the experimental results. However, the values from the numerical simulations are typically larger than those from the experiments, leading to larger attenuation coefficients and increase coefficients than those obtained experimentally. The main reasons are as follows:
(1) Due to the lack of consideration of factors such as wall heat loss and wall roughness in simulation results:, the overpressure obtained by numerical simulation is often greater.
(2) In the experiment, the pipeline is not completely sealed, and the propagation of gas explosion propagation to the pipeline connection and ball valve is often blocked, resulting in energy loss, so numerical simulation results will be larger than experimental results.

3.3. Change Laws of Explosion Temperature in the Pipe

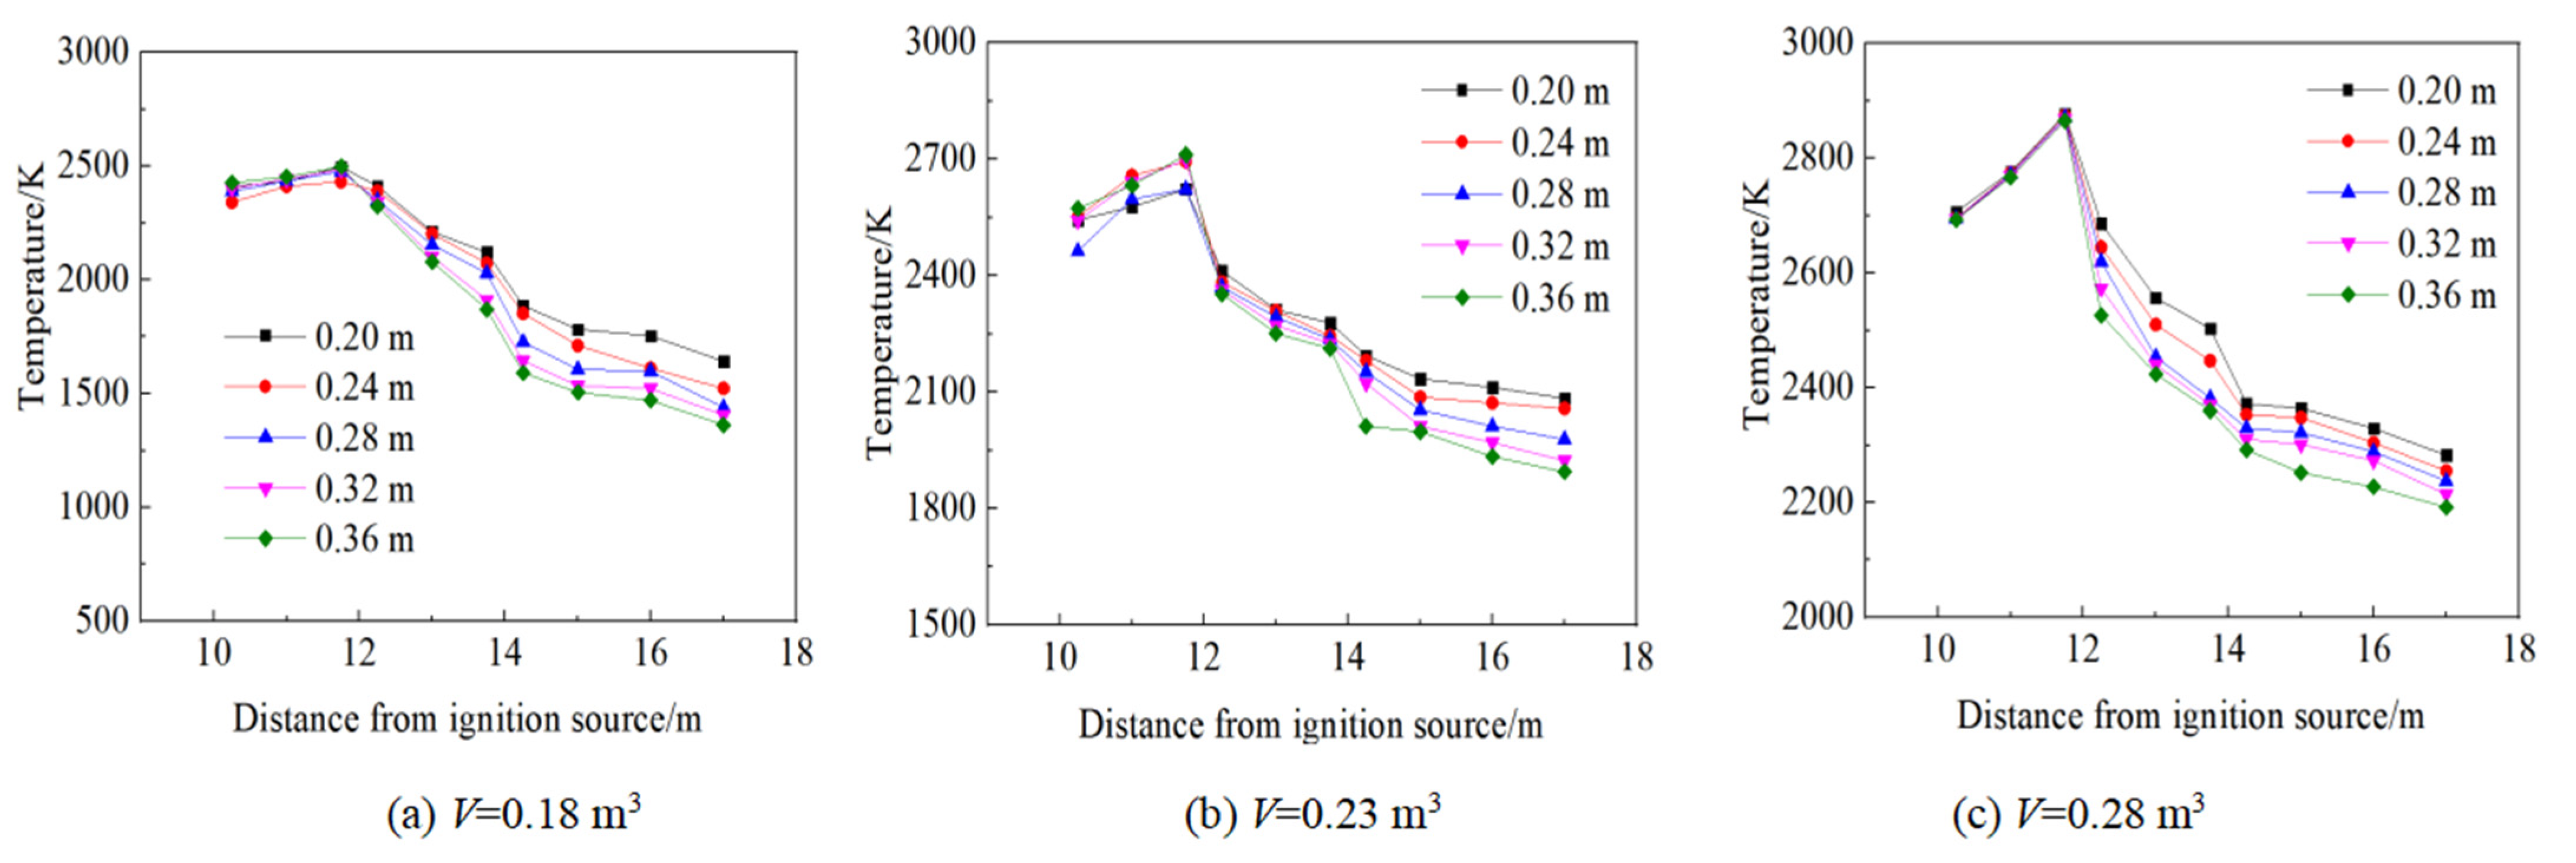
Figure 8 shows the change in peak temperature with respect to the propagation distance from the ignition source for different diameter pipes with fuel volumes of 0.18 m3, 0.23 m3, and 0.28 m3. Taking the simulation results for a 0.18 m3 fuel volume and 0.36 m diameter pipe, before the abrupt cross-section change, the peak temperature at measuring point 1 is 2426 K. As the propagation distance increases, the peak temperature gradually increases to 2499 K. After an abrupt increase in cross-section area (measuring points 3 and 4), the peak temperature decreases sharply. Then, after an abrupt decrease in cross-section area, the peak temperature changes from 1872 K (measuring point 6) to 1591 K (measuring point 7). From measuring points 7–10, the peak temperature decreases from 1591 K to 1363 K. The peak temperature clearly decreases at the two abrupt changes in the cross-section area. This trend demonstrates that the counter-current effect formed by the interaction between pressure wave and reflection wave at these two places restrains the propagation of the flame. This indicates that an abrupt change in cross-section pipe area has a certain influence on flame propagation characteristics [35].
Considering Figure 8a,c, for a constant pipe diameter of 0.36 m, a larger fuel volume results in a greater decrease in peak temperature. For a constant fuel volume of 0.18 m3, a larger ratio of abrupt cross-section area change induces a more obvious decline in peak temperature.

3.4. Change Laws of Vorticity and Kinetic Energy

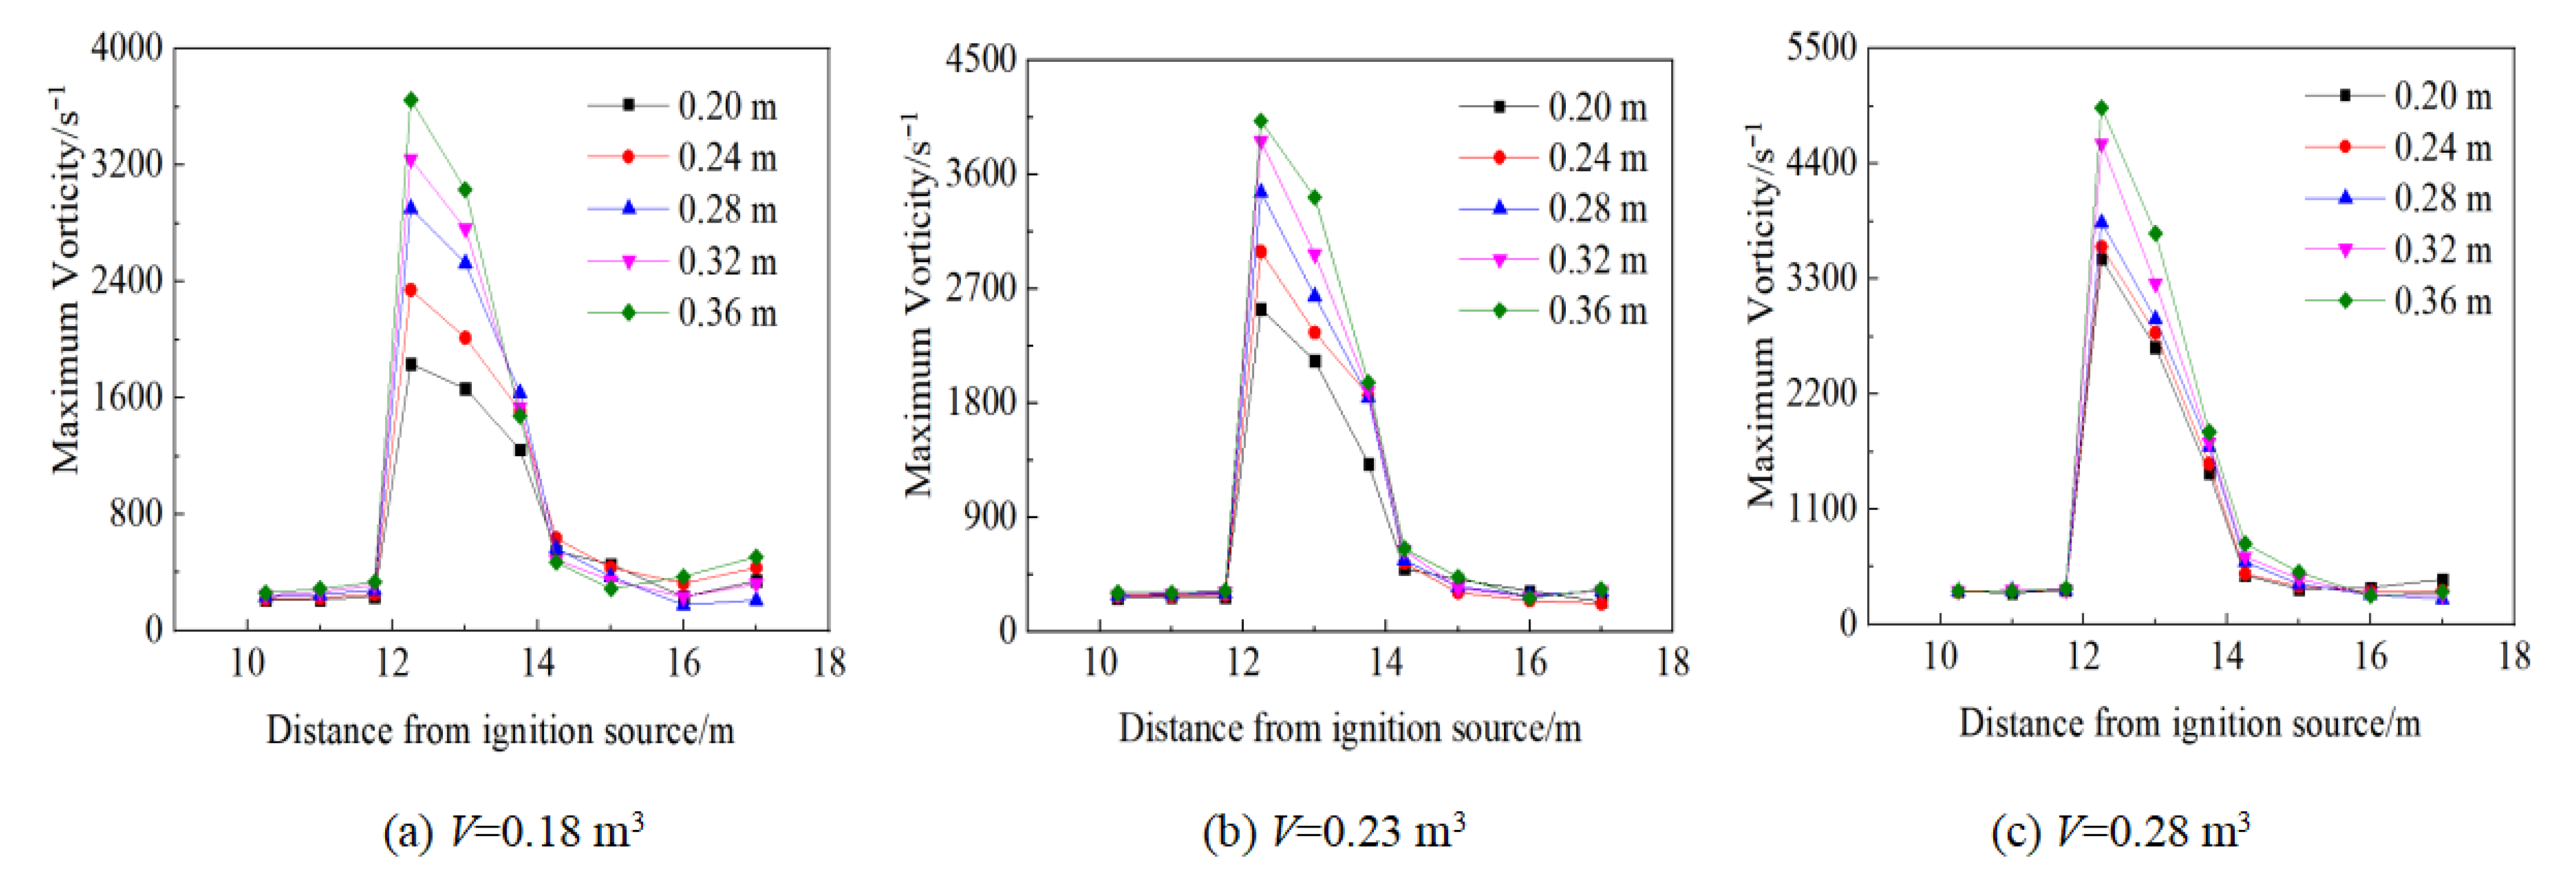
Figure 9 shows the distribution of peak vorticity along the pipe axis for three fuel volumes in different pipe configurations. Vorticity displays an obvious peak and tends to flatten out either side of the peak. This indicates that the turbulent effect of explosive gas is obviously strengthened after it passes through the abrupt cross-section change of the pipe. Taking simulation results with a fuel volume of 0.18 m3 as an example, as the diameter of the middle section of pipe increases from 0.2–0.36 m, the peak vorticity of gas explosion increases from 1834–3650 s−1. Considering Figure 9a,c, if the diameter of the middle section of pipe is held constant, a greater volume of explosive fuel produces a higher peak vorticity.
Figure 10 shows the change in peak kinetic energy with distance from the ignition source for various diameter pipes and fuel volumes of 0.18 m3, 0.23 m3, and 0.28 m3. Taking the simulation results with a 0.18 m3 fuel volume and 0.36 m diameter pipe, before the abrupt cross-section change, the peak kinetic energy increases and then decreases with distance. The maximum kinetic energy occurs at measuring point 2, with a peak value of 1.2386 MPa. Passing into the middle section of pipe (measuring points 3 and 4), the peak kinetic energy decreases sharply to 0.5728 MPa. In contrast, when passing back into the smaller pipe (measuring points 6 and 7), the peak kinetic energy increases from 0.4384 MPa to 0.5922 MPa. From measuring points 7–10, the peak kinetic energy presents a downward trend. As the gas explosion propagates, kinetic energy is converted into static pressure energy and vice versa. Specifically, when the cross-section area of the pipeline abruptly increases, kinetic energy is converted to static pressure energy, and when the cross-section area of the pipeline abruptly decreases, static pressure energy is converted back to kinetic energy.

4. Conclusions

(1)
When the cross-section area of the pipe changes abruptly from small to large, the shock wave overpressure decreases. In contrast, the shock wave overpressure increases when the cross-section of the pipe changes abruptly from large to small. When the diameter of the larger section of pipe is less than 0.24 m, the peak overpressure decreases, then sharply increases, and finally decreases. However, when the diameter is greater than 0.24 m, the peak overpressure exhibits a more complex sequence of decreasing, increasing, decreasing, increasing, and finally decreasing;
(2)
The overpressure changes in pipes along abrupt cross-section changes can be characterized by the attenuation coefficient, increase coefficient, and reflection coefficient. For a fixed ratio of cross-section areas, the attenuation coefficient increases with an increase in initial peak overpressure before the abrupt cross-section change, whereas the increasing coefficient and reflection coefficient both exhibit a decreasing trend. The coupling relationships between attenuation coefficients, increasing coefficients, reflection coefficients, and initial peak pressure and the ratio of cross-section areas were obtained;
(3)
The peak temperature decreases as the cross-section area changes. Moreover, a larger fuel volume creates a greater decrease in peak temperature. This demonstrates that the counter-current effect of the gas explosion pressure wave and reflected wave can inhibit the propagation of the explosion flame under the influence of an abrupt change in cross-section structure;
(4)
The vorticity in pipes with abrupt cross-section area changes presents a clear peak, which indicates that gas explosion propagation is affected by the action of turbulence induced by an abrupt cross-section change. Moreover, a larger fuel volume or ratio of cross-section areas has a more obvious effect on turbulence action. In the propagation process of a gas explosion, when the cross-section area changes abruptly, kinetic energy is converted to static pressure energy and vice versa. This indicates that the large eddy motion formed by strong restraint enhances kinetic energy.

Author Contributions

J.Q., conceptualization, methodology, and writing; B.J., writing—original draft preparation and data curation; M.T., formal analysis and investigation; L.Z., writing—reviewing and editing; Y.Y., visualization. All authors have read and agreed to the published version of the manuscript.

Funding

This research was funded by the National Natural Science Foundation of China (Grant No. 52074012, 51774014).

Institutional Review Board Statement

Not applicable.

Informed Consent Statement

Not applicable.

Data Availability Statement

The data used to support the findings of the study are included in the article.

Conflicts of Interest

The authors declare no conflict of interest.

References

  1. Ding, C.; He, X.; Nie, B. Numerical simulation of airflow distribution in mine tunnels. Int. J. Min. Sci. Technol. 2017, 27, 663–667. [Google Scholar] [CrossRef]
  2. Lolon, S.A.; Brune, J.F.; Bogin, G.E.; Grubb, J.W.; Saki, S.A.; Juganda, A. Computational fluid dynamics simulation on the longwall gob breathing. Int. J. Min. Sci. Technol. 2017, 27, 185–189. [Google Scholar] [CrossRef]
  3. Yueze, L.; Akhtar, S.; Sasmito, A.P.; Kurnia, J.C. Prediction of air flow, methane, and coal dust dispersion in a room and pillar mining face. Int. J. Min. Sci. Technol. 2017, 27, 657–662. [Google Scholar] [CrossRef]
  4. Jeffery, L.K. Looking ahead to significant improvements in mining safety and health through innovative research and effective diffusion into the industry. Int. J. Min. Sci. Technol. 2015, 25, 325–332. [Google Scholar]
  5. Jia, Z.W.; Jing, G.X.; Cheng, L.; Li, M.J. Study on propagation rules about gas explosion shock wave in the laneway with abrupt change of section area. China Saf. Sci. J. 2007, 17, 92–94. [Google Scholar]
  6. Yang, S.Z.; Jing, G.X.; Jia, Z.W. Injury study on impact current of gas explosion in coal mine. J. China Coal Soc. 2009, 34, 1354–1358. [Google Scholar]
  7. Liu, J.B.; Yao, L.M.; Zhang, Y.; Chen, J. The calculation method of local pressure drop on variable cross-section circular tube structure. Mach. Des. Manuf. 2016, 5, 83–87. [Google Scholar]
  8. Gao, K.; Qi, Z.; Jia, J.; Li, S.; Liu, Z.; Liu, Z. Investigation of coupled control of gas accumulation and spontaneous combustion in the goaf of coal mine. AIP Adv. 2020, 10, 045314. [Google Scholar] [CrossRef]
  9. Rong, G.Y.; Cheng, M.; Sheng, Z.H.; Liu, X.; Zhang, Y.; Wang, J. The behavior of the propagating velocity of rotating detonation waves and counter-rotating shock waves in a hollow combustor. Acta Astronaut. 2022, 200, 371–387. [Google Scholar] [CrossRef]
  10. Niu, Y.; Shi, B.; Jiang, B. Experimental study of overpressure evolution laws and flame propagation characteristics after methane explosion in transversal pipe networks. Appl. Therm. Eng. 2019, 154, 18–23. [Google Scholar] [CrossRef]
  11. Salzano, E.; Marra, S.F.; Russo, G.; Lee, J.H.S. Numerical simulation of turbulent gas flames in tube. J. Hazard. Mater. 2019, 95, 233–247. [Google Scholar] [CrossRef] [PubMed]
  12. Lin, B.-Q.; Guo, C.; Sun, Y.-M.; Zhu, C.-J.; Hong, Y.-D.; Yao, H. Effect of bifurcation on premixed methane-air explosion overpressure in pipes. J. Loss Prev. Process Ind. 2016, 43, 464–470. [Google Scholar] [CrossRef]
  13. Wang, M.-M.; Wu, Z.-N. Reflection of rightward moving shocks of the first and second families over a steady oblique shock wave. J. Fluid Mech. 2022, 936, A18. [Google Scholar] [CrossRef]
  14. Jing, G.X.; Guo, S.S.; Wu, Y.L. Investigation on the characteristics of single-phase gas explosion and gas-coal dust coupling explosion in bifurcated tubes. Therm. Sci. 2021, 25, 3595–3605. [Google Scholar] [CrossRef]
  15. Fang, H.; Xue, H.; Tang, W. Blast wave propagation characteristics in FPSO: Effect of cylindrical obstacles. Ocean Eng. 2023, 274, 114066. [Google Scholar] [CrossRef]
  16. Qin, J.; Tan, Y.X.; Wang, Z.Q. Experimental the influence of the shape of obstacles in pipelines on gas explosion. Coal Sci. Technol. 2012, 40, 60–62. [Google Scholar]
  17. Gao, K.; Jia, J.Z.; Liu, Y.H. Study on the characteristics of gas secondary explosion caused by explosion shock wave and high temperature coupling. J. Saf. Sci. Technol. 2016, 12, 35–38. [Google Scholar]
  18. Lin, Z.D.; Li, R.J.; Liu, E.L. Impact of obstacles on shock wave of gas explosion. J. Saf. Sci. Technol. 2014, 10, 28–32. [Google Scholar]
  19. Sun, L.; Jiang, B.; Gu, F. Effects of changes in pipe cross-section on the explosion-proof distance and the propagation characteristics of gas explosions. J. Nat. Gas Sci. Eng. 2015, 25, 236–241. [Google Scholar] [CrossRef]
  20. Zheng, Y.S.; Wang, C. Numerical simulation for the influence of variable cross-section tube on explosion characteristics of methane. Trans. Beijing Inst. Technol. 2009, 29, 947–949. [Google Scholar]
  21. Yin, H.R.; Weng, C.S. Propagation characteristic of detonation wave in variable cross-section sudden expansion pipe. Aero Weapon. 2016, 6, 66–72. [Google Scholar]
  22. Jia, Z.-W.; Li, B.; Xu, S.-M. Research on Gas Exploration Shock Wave Spread Law via One-Way Bifurcation Pipeline. Adv. Civ. Eng. 2018, 2018, 5012393. [Google Scholar] [CrossRef]
  23. Xue, F.; Sun, B.; Jiao, R.; Chen, J. Numerical studies on the acoustic characteristics of the U-shaped corrugated pipes and application investigations. Proc. Inst. Mech. Eng. Part D J. Automob. Eng. 2021, 233, 1136–1149. [Google Scholar] [CrossRef]
  24. Frolov, S.; Aksenov, V.; Shamshin, I. Shock wave and detonation propagation through U-bend tubes. Proc. Combust. Inst. 2007, 31, 2421–2428. [Google Scholar] [CrossRef]
  25. Zhu, C.-J.; Gao, Z.-S.; Lu, X.-M.; Lin, B.-Q.; Guo, C.; Sun, Y.-M. Experimental study on the effect of bifurcations on the flame speed of premixed methane/air explosions in ducts. J. Loss Prev. Process Ind. 2017, 49, 545–550. [Google Scholar] [CrossRef]
  26. Zhu, C.-J.; Gao, Z.-S.; Lin, B.-Q.; Tan, Z.; Sun, Y.-M.; Ye, Q.; Hong, Y.-D.; Guo, C. Flame acceleration in pipes containing bends of different angles. J. Loss Prev. Process Ind. 2016, 43, 273–279. [Google Scholar] [CrossRef]
  27. Zhou, A.; Wang, K.; Wang, L.; Du, F.; Li, Z. Numerical simulation for propagation characteristics of shock wave and gas flow induced by outburst intensity. Int. J. Min. Sci. Technol. 2015, 25, 107–112. [Google Scholar] [CrossRef]
  28. Nicholas, G.; Nicholas, Z. Quantifying model form uncertainty in Reynolds-averaged turbulence models with Bayesian deep neural networks. J. Comput. Phys. 2019, 383, 125–147. [Google Scholar]
  29. Dastbelaraki, A.; Yaghoubi, M.; Tavakol, M.M.; Rahmatmand, A. Numerical analysis of convection heat transfer from an array of perforated fins using the Reynolds averaged Navier–Stokes equations and large-eddy simulation method. Appl. Math. Model. 2018, 63, 660–687. [Google Scholar] [CrossRef]
  30. Ciccarelli, G.; Dorofeev, S. Flame acceleration and transition to detonation in ducts. Prog. Energy Combust. Sci. 2008, 34, 499–550. [Google Scholar] [CrossRef]
  31. Jiang, L.; Liu, H.; Wu, D.; Wang, J.; Xie, M.-Z.; Bai, M. Pore-Scale Simulation of Hydrogen–Air Premixed Combustion Process in Randomly Packed Beds. Energy Fuels 2017, 31, 12791–12803. [Google Scholar] [CrossRef]
  32. Xiao, H.; Wang, J.; Liu, Z.; Liu, W. A consistent SIMPLE algorithm with extra explicit prediction—SIMPLEPC. Int. J. Heat Mass Transf. 2018, 120, 1255–1265. [Google Scholar] [CrossRef]
  33. Yang, W.M. A finite volume method for ferrohydrodynamic problems coupled with microscopic magnetization dynamics. Appl. Math. Comput. 2023, 441, 127704. [Google Scholar] [CrossRef]
  34. Chen, G.F.; Lv, J.L.; Zhang, X.Y. Finite volume element method for nonlinear elliptic equations on quadrilateral meshes. Comput. Math. Appl. 2023, 140, 154–168. [Google Scholar] [CrossRef]
  35. Chen, X.F.; Chen, M.; Zhang, Q.M.; Yi, C. Experimental investigation of gas explosion microstructure and dynamic characteristics in a semi-vented pipe. J. China Coal Soc. 2010, 35, 246–249. [Google Scholar]
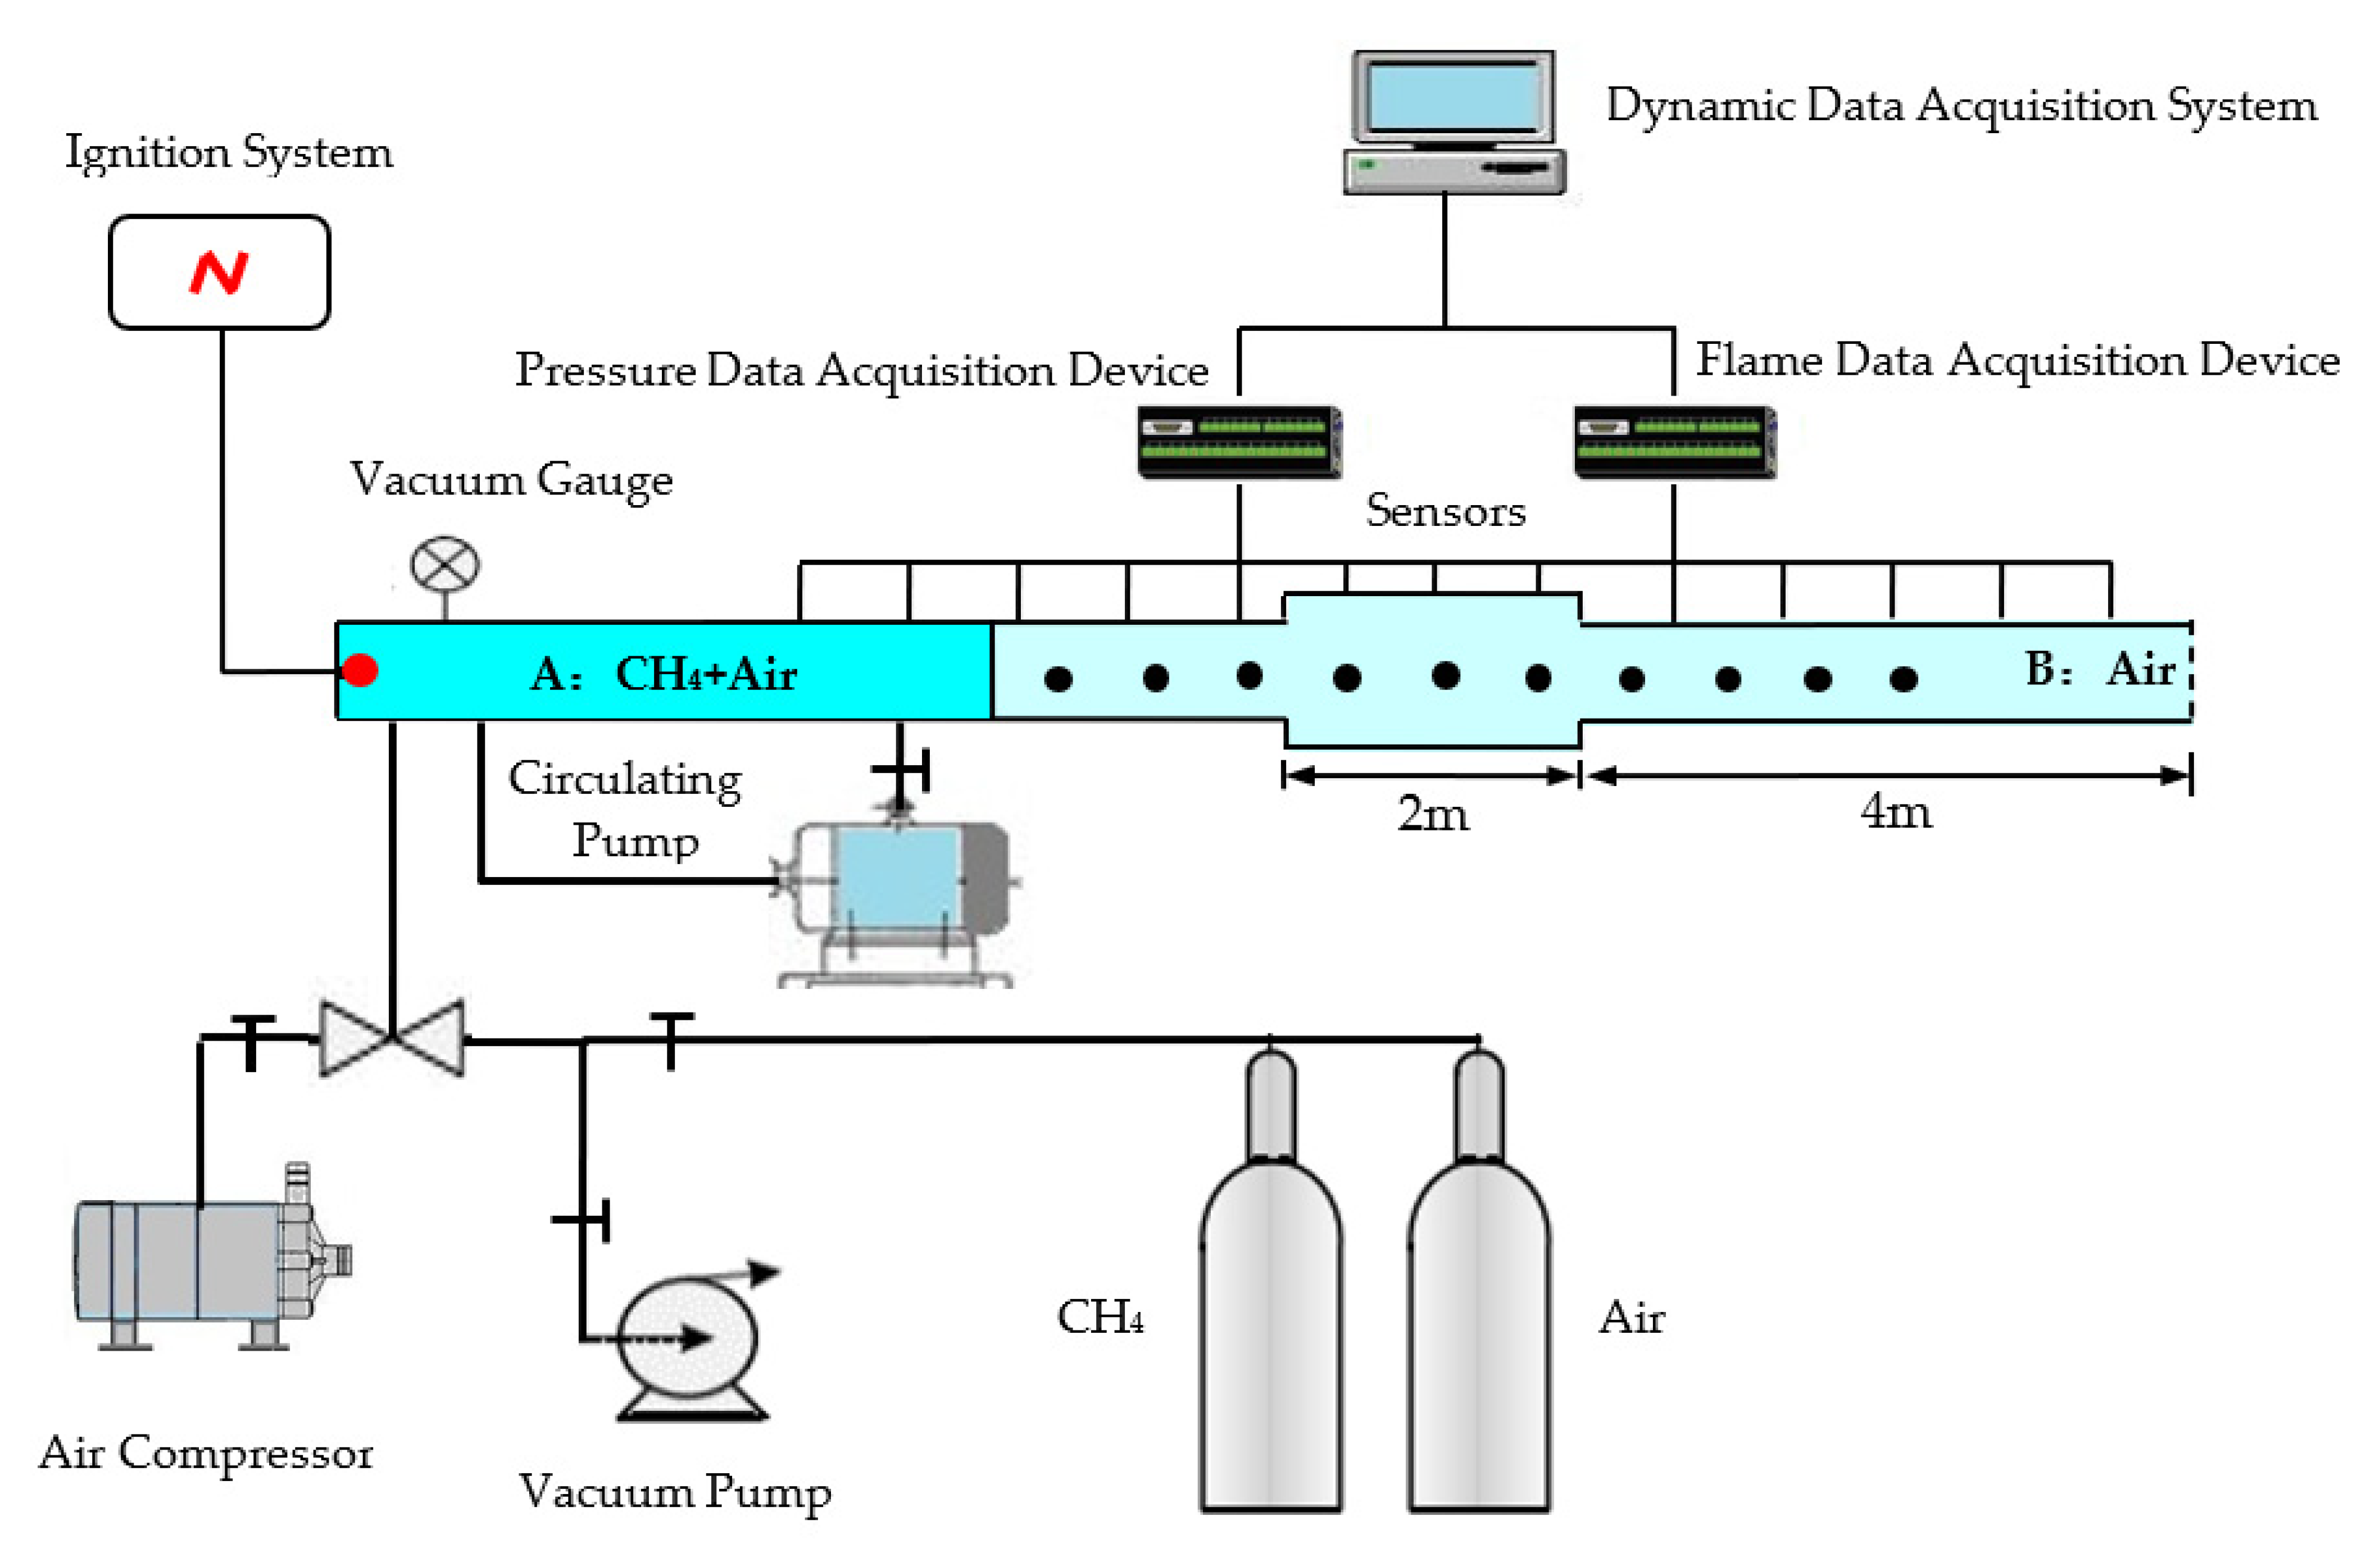
Figure 1. Gas explosion experimental device.
Applsci 13 06372 g001
Figure 2. Gas explosion pipe system.
Applsci 13 06372 g002
Figure 3. Overpressure change of each point in the pipe with an abrupt cross−section change (V = 0.18 m3, d = 0.36 m).
Applsci 13 06372 g003
Figure 4. Maximum explosion overpressure versus propagation distance.
Applsci 13 06372 g004
Figure 5. Relationships between (a) attenuation coefficient, (b) increase coefficient, (c) reflection coefficient, and the ratio of abrupt cross-section area change.
Applsci 13 06372 g005
Figure 6. Diagram of explosion pressure in a pipe with abrupt changes in cross-section area at different times (V = 0.18 m3, d = 0.36 m).
Applsci 13 06372 g006
Figure 7. Comparison of numerical simulations and experimental results.
Applsci 13 06372 g007
Figure 8. Maximum temperature versus propagation distance from ignition source.
Applsci 13 06372 g008
Figure 9. Maximum vorticity versus propagation distance from ignition source.
Applsci 13 06372 g009
Figure 10. Maximum kinetic energy versus propagation distance from ignition source.
Applsci 13 06372 g010
Table 1. Distance of each measurement point from explosion source (m).
Measurement PointP1P2P3P4P5P6P7P8P9P10
Distance10.251111.7512.251313.7514.25151617
Note: P represents pressure sensor.
Table 2. Attenuation coefficient, increase coefficient, and reflection coefficient of shock wave peak overpressure in pipes with abrupt cross-section area changes.
Fuel Volume/m3 S 2 S 1 Cross-Section Change from Small to LargeCross-Section Change from Large to Small
Δ p 3 / MPa Δ p 4 / MPa k Δ p 6 / MPa Δ p 7 / MPa Δ p 6 / MPa ΩΨ
0.181.230.76950.71551.0750.62300.64220.66420.9701.066
1.780.76950.70111.0980.56630.64460.87350.8791.542
2.420.77010.46221.6660.52390.61920.92970.8461.775
3.160.76850.46351.6580.48150.57410.91450.8391.899
4.000.76380.46461.6440.44750.52990.90200.8442.016
0.231.230.99150.90131.1000.74520.87100.75420.8561.012
1.780.99030.92631.0690.72790.87341.16480.8331.600
2.420.99950.59951.6670.66550.77451.18460.8591.780
3.160.99100.60141.6480.61560.74511.17160.8261.903
4.000.98450.60781.6200.57420.69781.15650.8232.014
0.281.231.21971.13281.0770.98311.14730.91770.8570.934
1.781.21961.00671.2110.90221.18591.31020.7611.452
2.421.21940.70851.7210.83611.15011.47480.7271.764
3.161.21660.71561.7000.77551.11231.45660.6971.878
4.001.21400.72261.6800.71971.02751.41250.7001.963
Disclaimer/Publisher’s Note: The statements, opinions and data contained in all publications are solely those of the individual author(s) and contributor(s) and not of MDPI and/or the editor(s). MDPI and/or the editor(s) disclaim responsibility for any injury to people or property resulting from any ideas, methods, instructions or products referred to in the content.