
In Situ Strength vs. Potential Strength of Concrete: Proposal of a New Procedure for the Assessment of Excess Voidage


Abstract
:1. Introduction
- (i)
- Class 1—void absent, presence of spaces measuring less than 0.5 mm;
- (ii)
- Class 2—small void, a void measuring not less than 0.5 mm and not more than 3 mm across in any direction;
- (iii)
- Class 3—medium void, a void having a dimension greater than 3 mm but not greater than 6 mm;
- (iv)
- Class 4—large void, a void having a dimension greater than 6 mm;
- (v)
- Class 5—honeycombing, interconnected voids arising from, for example, inadequate compaction or a lack of mortar.
2. In Situ Strength Assessment
2.1. Concrete Society Technical Report 11
- -
- is the estimated actual strength;
- -
- D is a parameter depending on the direction of perforation (D = 2.5 for the core drilled in a horizontal direction, and D = 2.3 for the core drilled in a vertical direction);
- -
- λ is the core slenderness (ratio between length and diameter);
- -
- fcore is the core strength.
2.2. Pucinotti Method
- -
- depends on the drilling direction ( = 1.15 for drilling perpendicular to the direction of casting concrete, and = 1.05 for perforations parallel to the direction of casting concrete);
- -
- takes into account the diameter of the core: 1.06 for the core diameter with d = 50 mm, 1.00 for d = 100 mm, and 0.98 for d = 150 mm;
- -
- takes into account the disturbance during drilling operations. It presupposes the following equation:where fcore is expressed in MPa;
- -
- takes into account the ratio height/diameter (l/d) of core. It presupposes the following equation:in which d is the core diameter and l is its height.
- -
- takes into account the presence of reinforcing bars. According to the British Standards Institution (1991), for cores containing a single bar, , where ϕr is the diameter of the reinforcement. b is the distance of the axis of the bar from nearer the end of the specimen; d and l are the diameter and the length of the specimen after end-preparation by grinding or capping, respectively. The results should be ignored if the correct strength varies more than 10% [1]. In the case of several bars: . Personally, I believe that, in general, it would be advisable to always discard the cores that incorporate reinforcing bars inside.
- -
- takes into account the moisture condition of the core. According to ACI 214.4R-03 [17], the following values are suggested: (i) as-received, = 1.00; (ii) soaked 48 h, = 1.09; (iii) air dried, = 0.96.
- -
- takes into account the age of the concrete. For young concrete, that is, if the tests are carried out before 28 days of curing, then the value suggested by EN 1992-1-1 [7] could be used: , where s is a coefficient which depends on the type of cement. (i) s = 0.20 for cement of strength classes CEM 42.5 R; CEM 53.5 N; CEM 53.5 R (Class R). (ii) s = 0.25 for cement of strength classes CEM 32.5 R; CEM 42.5 N (Class N). s = 0.38 for cement of strength classes CEM 32.5 N (Class S). This expression allows us to extrapolate the strength measured before 28 days (of young concrete) to that at 28 days. Some authors suggest also using this coefficient for concrete with an age t > 28 days [10] to take into account the greater strength of concrete after 28 days.
3. Potential Strength Assessment
3.1. Concrete Society Technical Report 11
- -
- is the estimated strength;
- -
- D is a parameter depending on the direction of perforation (D = 3.25 for the core drilled in a horizontal direction, and D = 3.00 for the core drilled in a vertical direction);
- -
- λ is the core slenderness (the ratio between length and diameter);
- -
- fcore is the core strength.
- (a)
- From density test results
- (b)
- By visual means
3.2. Pucinotti Method
- -
- takes into account the addition of water to the cement mixer. According to Coppola et al. [10], the following value is suggested: , where Acq is the quantity of water (expressed in N) added to the mix for each m3 of concrete.
- -
- takes into account the influence of excess voidage. It is therefore evident how compaction plays an important role in reducing the strength of in situ concrete when compared to the potential strength.
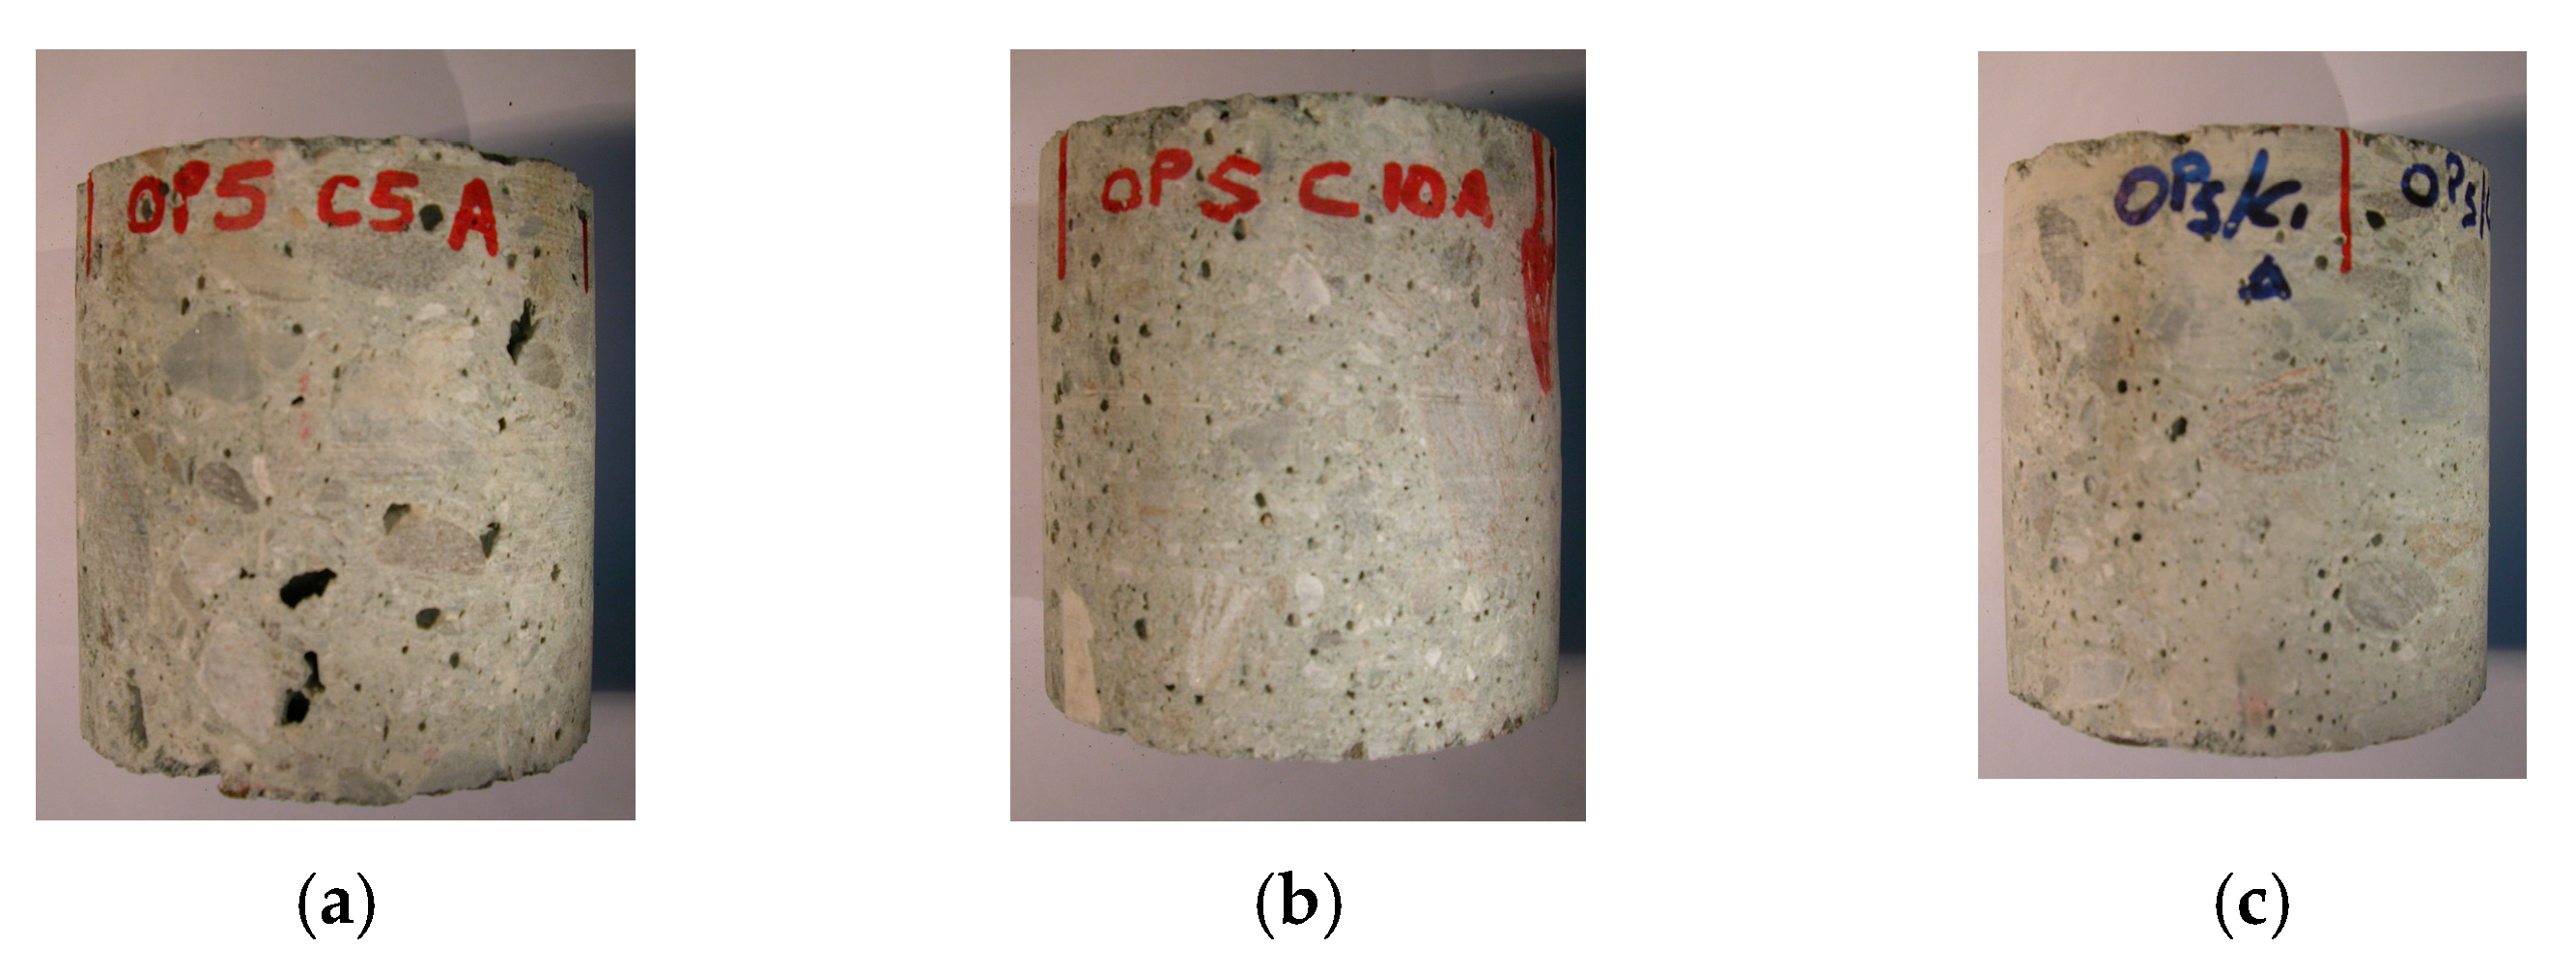
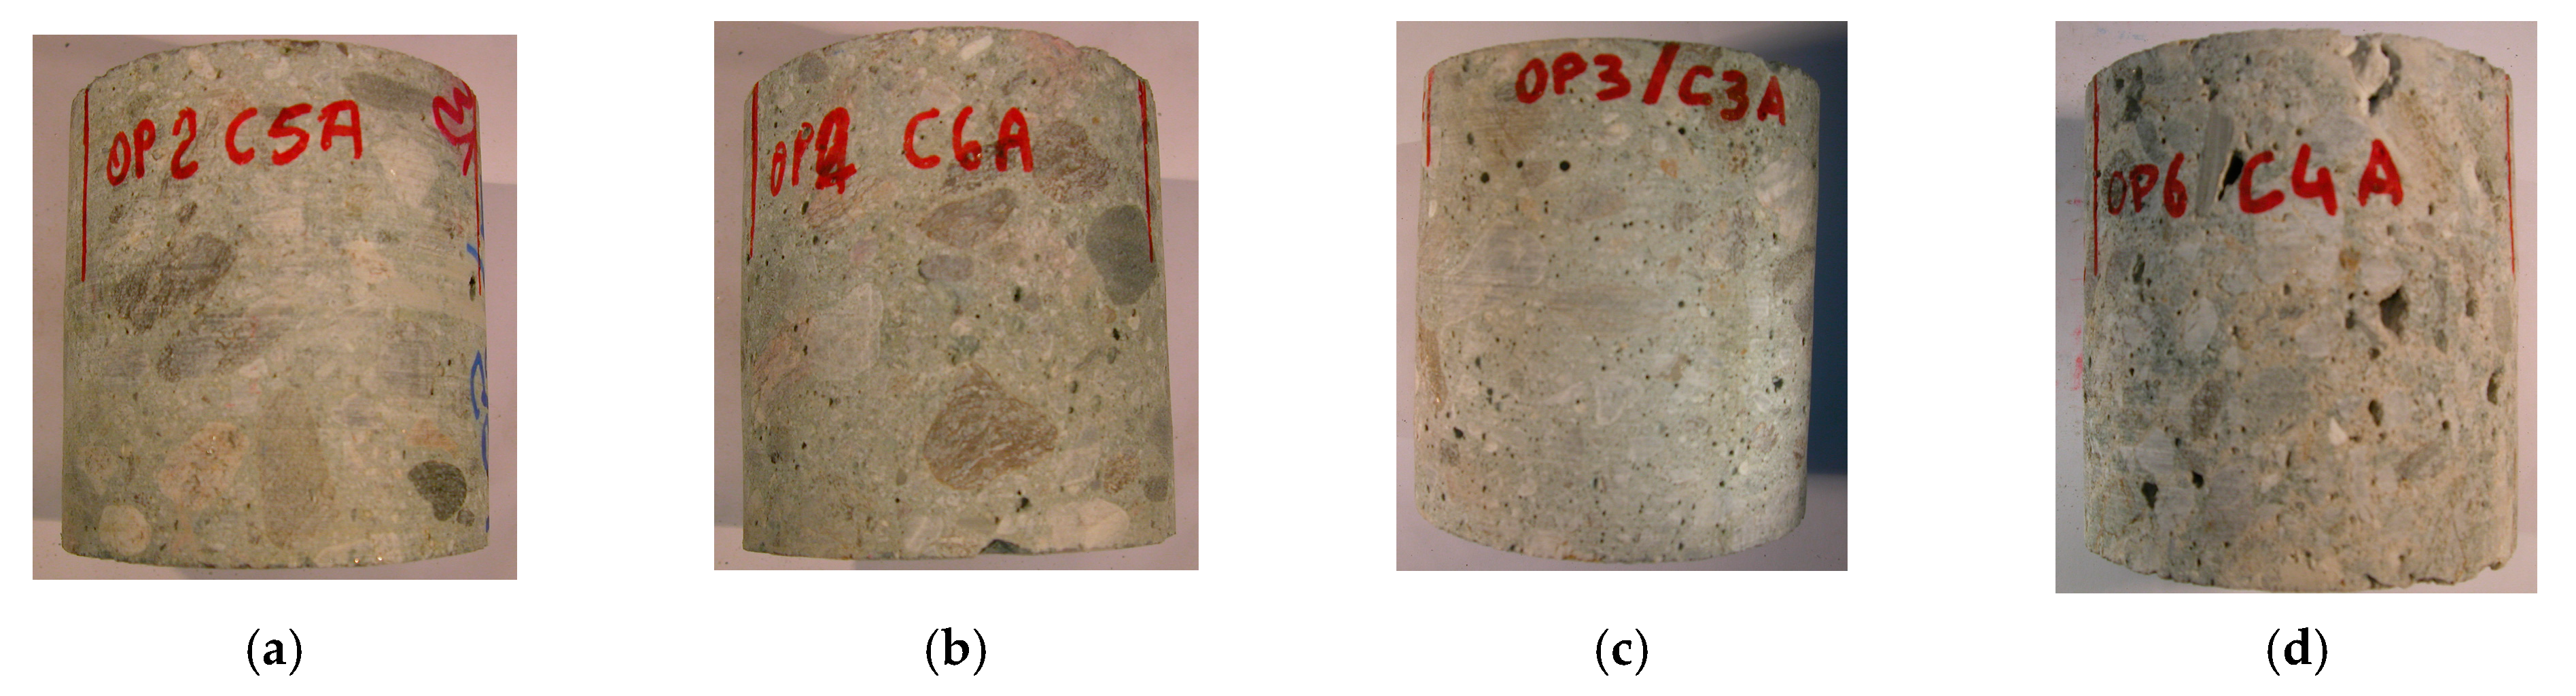
Influence of Excess Voidage
- (a)
- Small void. A void measuring not less than 0.5 mm and not more than 3 mm across in any direction.
- (b)
- Medium void. A void having a dimension greater than 3 mm but not greater than 6 mm.
- (c)
- Large void. A void having a dimension greater than 6 mm.
- (d)
- Honeycombing. Interconnected voids arising from, for example, inadequate compaction or a lack of mortar.
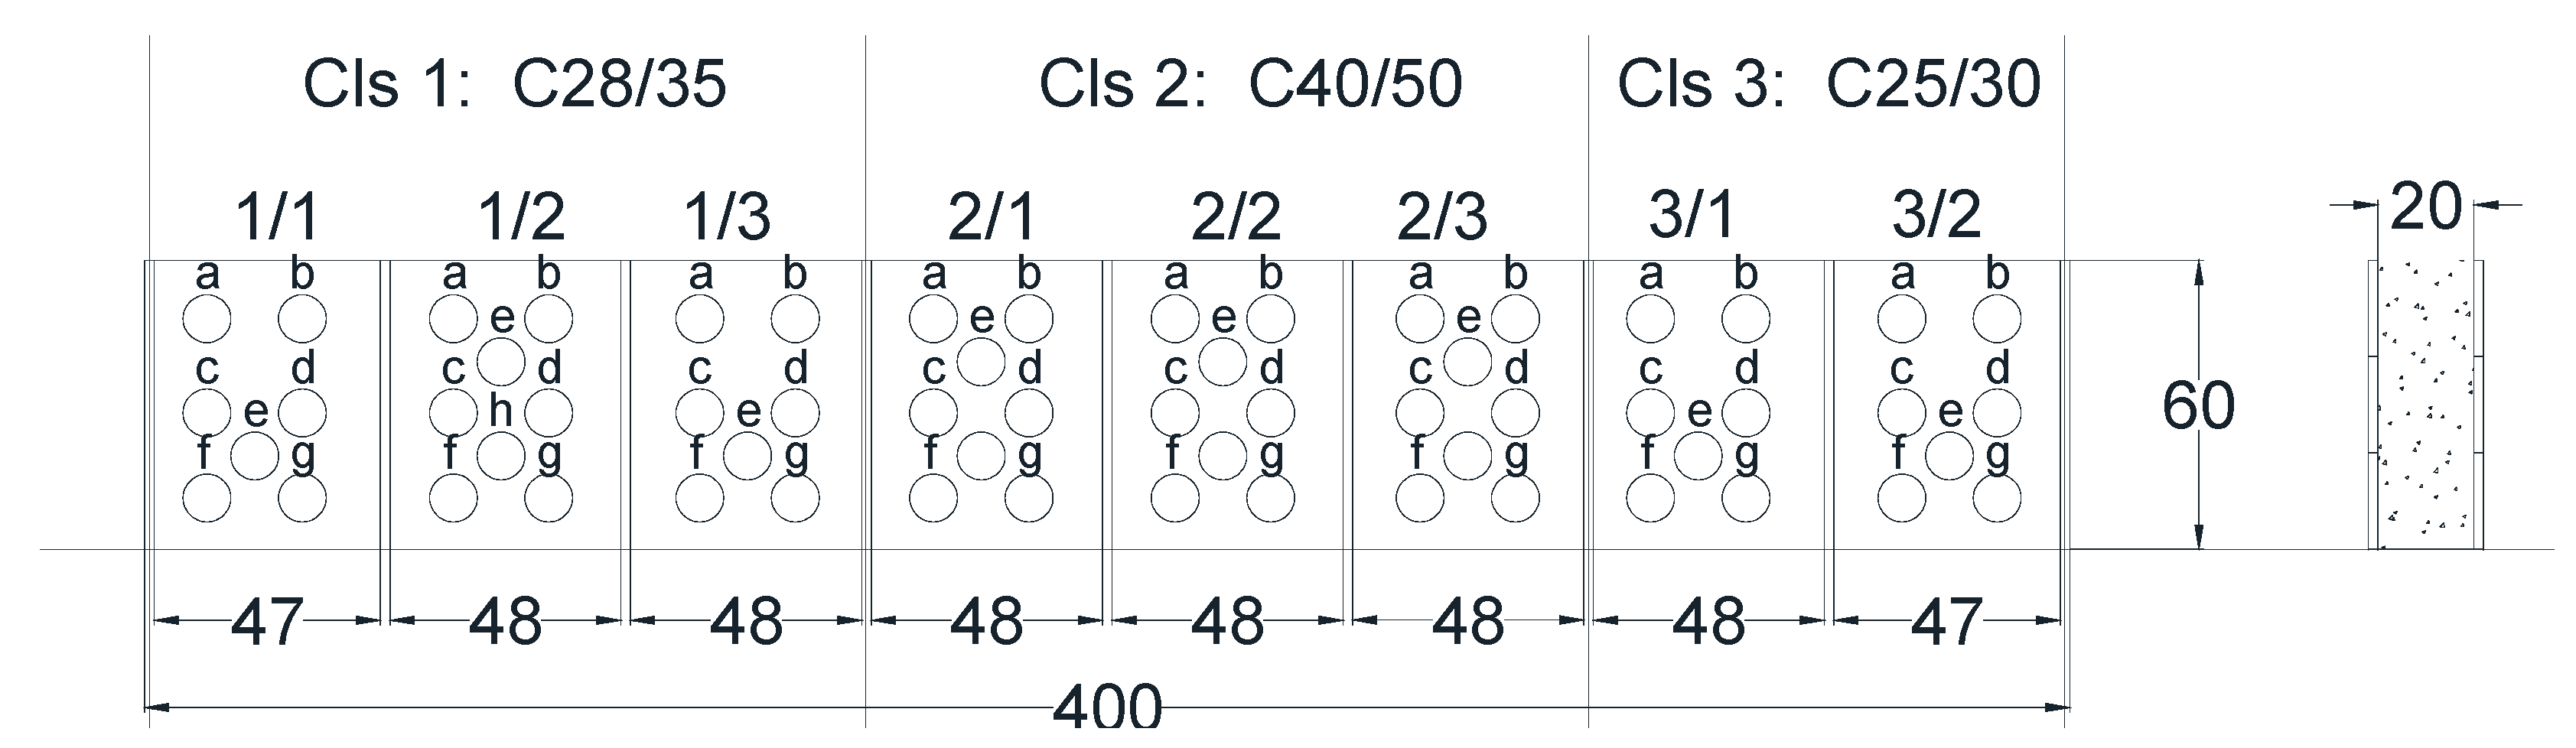
4. Experimental Program
4.1. First Series
- -
- Second group: The percentage difference between two cores obtained from the same drilling varies from 0.05% to more than 18.50%, and the result obtained by varying the extraction point varies from 6.59% to 19.40%;
- -
- Third group: The percentage difference between two cores obtained from the same drilling varies from 3.58% to more than 34.31%, and the result obtained by varying the extraction point varies from 2.42% to 27.65%.
Experimental Results
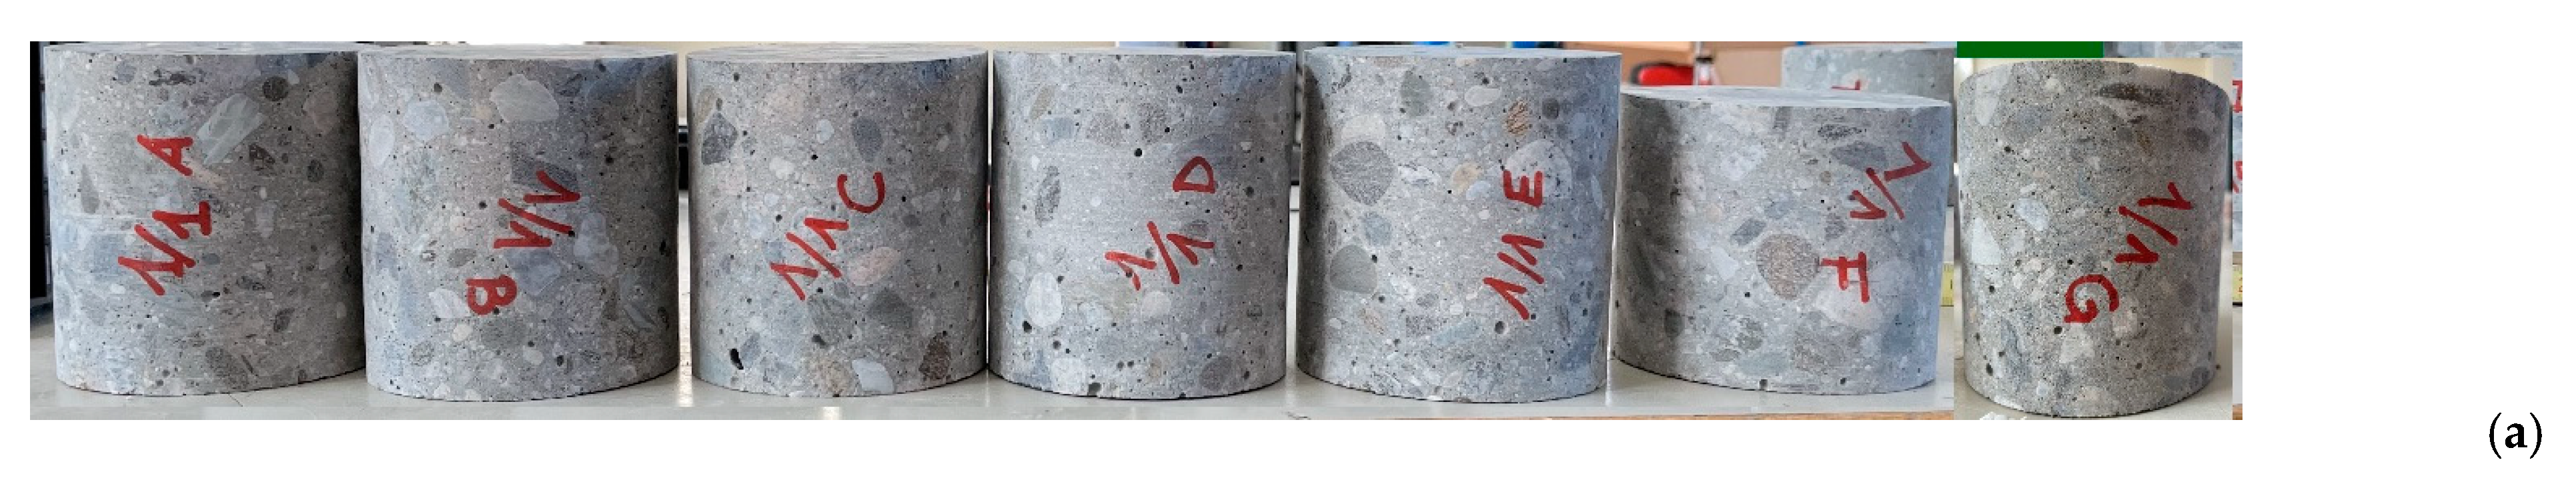
4.2. Second Series
- -
- Type;
- -
- Target Options—Reflection Target, Transmission Target, Multimetal Target;
- -
- Max. Power—225 W;
- -
- Min. Focal Spot—1 μm;
- -
- Max. CT Swept Diameter—280 mm;
- -
- Max. FID—970 mm nominal;
- -
- FID Type—Moveable;
- -
- Max. Sample Weight—15 kg;
- -
- Max. Pixel Matrix—2880 × 2880;
- -
- Min. Pixel Size—150 μm;
- -
- Max. Frame Rate—30 fps;
- -
- Type—ASTM E2597 Flat Panel;
- -
- Length—1830 mm;
- -
- Width—875 mm;
- -
- Height—1987 mm;
- -
- Weight—2400 kg.
Experimental Results
5. Conclusions
Funding
Institutional Review Board Statement
Informed Consent Statement
Data Availability Statement
Conflicts of Interest
References
- Concrete Society. Concrete Core Testing for Strength; Technical Report No. 11; Concrete Society: Surrey, UK, 1987. [Google Scholar]
- BS 6089:1981; Guide to Assessment of Concrete Strength in Existing Structures. British Standard Institute: London, UK, 1981.
- BS 1881-120; Testing Concrete. Part 120: Methods for Determination of the Compressive Strength of Concrete Cores. British Standard Institute: London, UK, 1983.
- FEMA 274; Nehrp Commentary on the Guidelines for the Seismic Rehabilitation of Buildings. Federal Emergency Management Agency: Washington, DC, USA, 1997.
- ACI 214.4R-03; Guide for Obtaining Cores and Interpreting Compressive Strength Results. American Concrete Institute: Farmington Hill, MI, USA, 2003.
- CEN-EN 13791; Assessment of In-Situ Compressive Strength in Structures and Precast Concrete Components. European Standard: Brussels, Belgium, 2007.
- CEN-EN 13791; Assessment of In-Situ Compressive Strength in Structures and Precast Concrete Components. European Standard: Brussels, Belgium, 2019.
- Masi, A. La stima del calcestruzzo in situ mediante prove distruttive e non distruttive. Il G. Delle Prove Non Distruttive Monit. Diagn. 2005, 1. Available online: http://www.crisbasilicata.it/admin/allegatidocumenti/upload/masi_articolo-aipnd_1-06589809539011.pdf (accessed on 21 May 2023).
- Steenbergen, R.; Vervuurt, A. Determining the in situ concrete strength of existing structures for assessing their structural safety. Struct. Concr. 2012, 13, 27–31. [Google Scholar] [CrossRef]
- Coppola, L.; Buoso, A. La Resistenza in Opera del Calcestruzzo: Criteri per la Collaudabilità e l’Accertamento delle Responsabilità in Casi di Contenzioso Legale. 1st Workshop on The New Boundaries of Structural Concrete; Grimaldi, A., Plizzari, G., Realfonzo, R., Eds.; ACI: Salerno, Italy, 2010. [Google Scholar]
- Cristofaro, M.T.; Nudo, R.; Tanganelli, M.; D’Ambrisi, A.; De Stefano, M.; Pucinotti, R. Issues concerning the assessment of concrete compressive strength in existing buildings: Application to a case study. Struct. Concr. 2017, 19, 1–11. [Google Scholar] [CrossRef]
- Pucinotti, R. Compressive Strength Variability of Concrete Cores within the same Drilling. In Proceedings of the 15° Congresso AIPnD, Rome, Italy, 23–26 October 2013; Available online: https://www.ndt.net/article/aipnd2013/papers/idn28.pdf (accessed on 1 September 2014).
- Pucinotti, R. Assessment of in situ Characteristic Concrete Strength. Constr. Build. Mater. 2013, 44, 63–73. [Google Scholar] [CrossRef]
- Pucinotti, R. Patologia, Diagnostica, Indagini Strutturali. Guida Pratica alla Valutazione del Danno e al Monitoraggio Statico e Dinamico Anche Negli Interventi di Miglioramento E/O Adeguamento Sismico; Flaccovio Dario Editore: Palermo, Italy, 2020. [Google Scholar]
- Pucinotti, R.; Tripodo, M. The Fiumarella bridge: Concrete characterisation and deterioration assessment by nondestructive testing. Int. J. Microstruct. Mater. Prop. 2009, 4, 128–139. [Google Scholar] [CrossRef]
- Coppola, L.; Buoso, A.; Coffetti, D.; Crotti, E. Valutazione Collaudabilità delle Strutture in C.A. e C.A.P. e Accertamento delle Responsabilità dell’Impresa e del Fornitore di Calcestruzzo; Dario Flaccovio Editore: Palermo, Italy, 2020. [Google Scholar]
- Cristofaro, M.T.; Pucinotti, R.; Tanganelli, M.; De Stefano, M. The Dispersion of Concrete Compressive Strength of Existing Buildings. In Computational Methods, Seismic Protection, Hybrid Testing and Resilience in Earthquake Engineering. Geotechnical, Geological and Earthquake Engineering; Cimellaro, G., Nagarajaiah, S., Kunnath, S., Eds.; Springer: Berlin/Heidelberg, Germany, 2015; Volume 33, pp. 275–285. [Google Scholar]
- Shimizu, Y.; Hirosawa, M.; Zhou, J. Statistical Analysis of Concrete Strength in Existing Reinforced Concrete Buildings in Japan. In Proceedings of the 12th World Conference on Earthquake Engineering, Auckland, New Zeeland, 30 January–4 February 2000. [Google Scholar]
- Anderson, S.H.; Gantzer, C.J.; Boone, J.M. Rapid non destructive bulk density and soil water content determination by computer tomography. Soil Sci. Soc. Am. J. 1988, 52, 35–40. [Google Scholar] [CrossRef]
- Peters, E.J.; Afzal, N. Characterization of heterogeneities in permeable media with computed tomography imaging. J. Pet. Sci. Eng. 1992, 7, 283–296. [Google Scholar] [CrossRef]
- Johns, R.A.; Steude, J.D.; Castanier, L.M.; Roberts, P.V. Non destructive measurements of fracture aperture in crystalline rock cores using X-ray computed tomography. J. Geophys. Res. 1993, 98, 1889–1900. [Google Scholar] [CrossRef]
- Kamath, J.; Xu, B.; Lee, S.H.; Yortsos, Y.C. Use of pore network models to interpret laboratory experiments on vugular rocks. J. Pet. Sci. Eng. 1998, 20, 109–115. [Google Scholar] [CrossRef]
- Montemagno, C.D.; Pyrak-Nolte, L.J. Fracture network versus single fractures: Measurement of fracture geometry with X-ray tomography. Phys. Chem. Earth Part A Solid Earth Geod. 1999, 24, 575–579. [Google Scholar] [CrossRef]
- Ueta, K.; Tani, K.; Kato, T. Computerized X-ray tomography analysis of three-dimensional fault geometries in basement induced wrench faulting. Eng. Geol. 2000, 56, 197–210. [Google Scholar] [CrossRef]
- Sheppard, A.P.; Sok, R.M.; Averdunk, H. Techniques for image enhancement and segmentation of tomographic images of porous materials. Phys. A 2004, 339, 145–151. [Google Scholar] [CrossRef]
- Akin, S.; Kovscek, A.R. Computed tomography in petroleum engineering research. In Application of X-ray Computed Tomography in the Geosciences; Mees, F., Swennen, R., Van Geet, M., Jacobs, P., Eds.; The Geological Society: London, UK, 2003; Volume 215, pp. 23–38. [Google Scholar]
- Tauda, H.; Martinez-Angelesa, R.; Parrot, J.F.; Hernandez-Escobe, L.H. Porosity estimation method by X-ray computed tomography. J. Pet. Sci. Eng. 2005, 47, 209–217. [Google Scholar] [CrossRef]
- Goldman, L.W. Principles of CT and CT Technology. J. Nucl. Med. Technol. 2007, 35, 115–128. [Google Scholar] [CrossRef] [PubMed]
- Ministero delle Infrastrutture e dei Trasporti. DM 17 Gennaio 2018, Aggiornamento delle «Norme Tecniche per le Costruzioni», G.U. n. 42 del 20 Febbraio 2018; Ministero delle Infrastrutture e dei Trasporti: Rome, Italy, 2018. [Google Scholar]


| Cores | Unit Weight (kN/m3) | d (mm) | l (mm) | l/d | Ac (mm2) | Cor. Dir. | fcore (N/mm2) | fmedcore (N/mm2) | Diff. (%) | DSC | ASC |
|---|---|---|---|---|---|---|---|---|---|---|---|
| MSC 1 a | 22.692 | 103 | 101 | 0.97 | 8397 | v | 27.70 | ||||
| MSC 1 b | 22.741 | 103 | 95 | 0.92 | 8381 | v | 32.48 | 30.09 | 15.89 | ||
| MSC 1 c | 22.814 | 104 | 98 | 0.94 | 8462 | v | 32.38 | ||||
| MSC 1 d | 22.734 | 105 | 95 | 0.91 | 8626 | v | 35.25 | 33.82 | 8.49 | ||
| MSC 1 e | 23.377 | 104 | 101 | 0.97 | 8462 | v | 33.36 | ||||
| MSC 1 f | 22.950 | 104 | 104 | 1.00 | 8446 | v | 36.28 | ||||
| MSC 1 g | 23.513 | 104 | 98 | 0.94 | 8462 | v | 40.13 | 36.59 | 18.50 | C25/30 | C32/40 |
| MSC 2 a | 22.611 | 104 | 98 | 0.95 | 8462 | v | 34.36 | ||||
| MSC 2 b | 22.928 | 104 | 98 | 0.94 | 8446 | v | 32.68 | 33.52 | 5.01 | ||
| MSC 2 c | 23.130 | 104 | 101 | 0.97 | 8462 | v | 38.08 | ||||
| MSC 2 d | 22.725 | 104 | 98 | 0.94 | 8462 | v | 38.10 | 38.09 | 0.05 | C25/30 | C35/45 |
| ARC 1 a | 22.588 | 104 | 97 | 0.94 | 8462 | v | 32.66 | ||||
| ARC 1 b | 22.591 | 104 | 93 | 0.89 | 8462 | v | 30.39 | 31.53 | 7.20 | ||
| ARC 1 c | 22.602 | 104 | 95 | 0.92 | 8462 | v | 29.24 | ||||
| ARC 1 d | 22.534 | 104 | 96 | 0.92 | 8462 | v | 32.66 | 30.95 | 11.05 | ||
| ARC 1 e | 23.056 | 104 | 98 | 0.95 | 8462 | v | 33.47 | ||||
| ARC 1 f | 22.948 | 104 | 98 | 0.94 | 8430 | v | 37.43 | 35.45 | 11.17 | C25/30 | C32/40 |
| CVD a | 23.377 | 104 | 101 | 0.97 | 8462 | h | 31.08 | ||||
| CVD b | 23.310 | 104 | 98 | 0.95 | 8462 | h | 30.54 | 30.81 | 1.75 | ||
| CVD c | 23.613 | 104 | 98 | 0.94 | 8479 | h | 32.52 | ||||
| CVD v | 23.632 | 104 | 98 | 0.94 | 8446 | h | 33.32 | 32.92 | 2.43 | C25/30 | C30/37 |
| Cores | Unit Weight (kN/m3) | d (mm) | l (mm) | l/d | Ac (mm2) | Cor. Dir | fcore (N/mm2) | fmedcore (N/mm2) | Diff. (%) | DSC | ASC |
|---|---|---|---|---|---|---|---|---|---|---|---|
| CVD a | 23.898 | 104 | 93 | 0.89 | 8446 | h | 32.24 | ||||
| CVD b | 24.170 | 104 | 93 | 0.89 | 8462 | h | 36.43 | 34.34 | 12.20 | ||
| CVD c | 24.396 | 104 | 93 | 0.89 | 8446 | h | 35.90 | ||||
| CVD d | 23.157 | 104 | 97 | 0.94 | 8446 | h | 39.51 | ||||
| CVD e | 23.247 | 104 | 98 | 0.94 | 8462 | h | 39.46 | 38.29 | 9.30 | C25/30 | C32/40 |
| CMD a | 22.786 | 104 | 104 | 1.00 | 8413 | h | 23.43 | ||||
| CMD b | 22.941 | 104 | 98 | 0.94 | 8446 | h | 24.66 | 24.05 | 5.12 | ||
| CMD c | 23.647 | 104 | 98 | 0.94 | 8462 | h | 30.98 | ||||
| CMD d | 23.404 | 104 | 98 | 0.94 | 8462 | h | 32.37 | 31.68 | 4.39 | C25/30 | C30/37 |
| MSC 1 a | 22.058 | 104 | 98 | 0.94 | 8446 | v | 33.99 | ||||
| MSC 1 b | 22.789 | 104 | 98 | 0.94 | 8462 | v | 39.75 | 36.87 | 15.62 | ||
| MSC 1 c | 22.896 | 104 | 98 | 0.94 | 8462 | v | 46.61 | ||||
| MSC 1 d | 23.030 | 104 | 98 | 0.94 | 8462 | v | 49.30 | 47.96 | 5.61 | C25/30 | C35/45 |
| MDC 1 a | 23.112 | 104 | 102 | 0.98 | 8446 | v | 42.68 | ||||
| MDC 1 b | 22.800 | 104 | 102 | 0.98 | 8462 | v | 41.18 | 41.93 | 3.58 | ||
| MDC 1 c | 22.310 | 104 | 104 | 1.00 | 8462 | v | 36.14 | ||||
| MDC 1 d | 23.310 | 104 | 98 | 0.95 | 8462 | v | 47.22 | ||||
| MDC 1 e | 22.790 | 104 | 102 | 0.98 | 8462 | v | 39.48 | 40.95 | 8.16 | C25/30 | C35/45 |
| ARC 2 a | 22.428 | 104 | 104 | 1.00 | 8462 | v | 28.05 | ||||
| ARC 2 b | 22.611 | 104 | 98 | 0.95 | 8462 | v | 25.10 | 26.58 | 11.10 | ||
| ARC 2 c | 23.105 | 104 | 93 | 0.89 | 8479 | v | 37.01 | ||||
| ARC 2 d | 22.609 | 104 | 97 | 0.93 | 8462 | v | 29.08 | 33.05 | 24.00 | ||
| ARC 2 e | 22.724 | 104 | 96 | 0.93 | 8462 | v | 39.34 | ||||
| ARC 2 f | 22.489 | 104 | 97 | 0.93 | 8479 | v | 27.82 | 33.58 | 34.31 | C25/30 | C32/40 |
| ARC 3 a | 22.848 | 104 | 98 | 0.95 | 8446 | v | 28.38 | ||||
| ARC 3 b | 22.802 | 104 | 104 | 1.00 | 8462 | v | 29.94 | 29.16 | 5.35 | ||
| ARC 3 c | 22.801 | 104 | 96 | 0.93 | 8462 | v | 29.29 | ||||
| ARC 3 d | 23.121 | 104 | 97 | 0.93 | 8462 | v | 31.84 | 30.57 | 8.34 | C25/30 | C32/40 |
| Cores | D | Rc,a | Rmedc,a | D | Rc,p | CEV | Rmedc,p | ESC |
|---|---|---|---|---|---|---|---|---|
| MSC 1 a | 2.30 | 25.19 | 3.00 | 32.86 | ||||
| MSC 1 b | 2.30 | 28.82 | 3.00 | 37.59 | ||||
| MSC 1 c | 2.30 | 29.10 | 3.00 | 37.96 | ||||
| MSC 1 d | 2.30 | 31.14 | 3.00 | 40.62 | ||||
| MSC 1 e | 2.30 | 30.37 | 3.00 | 39.61 | ||||
| MSC 1 f | 2.30 | 33.39 | 3.00 | 43.55 | ||||
| MSC 1 g | 2.30 | 35.99 | 30.57 | 3.00 | 46.94 | 1.00 | 39.88 | C30/37 |
| MSC 2 a | 2.30 | 30.89 | 3.00 | 40.30 | ||||
| MSC 2 b | 2.30 | 29.33 | 3.00 | 38.26 | ||||
| MSC 2 c | 2.30 | 34.62 | 3.00 | 45.16 | ||||
| MSC 2 d | 2.30 | 34.17 | 32.25 | 3.00 | 44.57 | 1.04 | 43.75 | C32/40 |
| ARC 1 a | 2.30 | 29.24 | 3.00 | 38.14 | ||||
| ARC 1 b | 2.30 | 26.71 | 3.00 | 34.83 | ||||
| ARC 1 c | 2.30 | 25.94 | 3.00 | 33.83 | ||||
| ARC 1 d | 2.30 | 29.05 | 3.00 | 37.89 | ||||
| ARC 1 e | 2.30 | 30.09 | 3.00 | 39.25 | ||||
| ARC 1 f | 2.30 | 33.61 | 29.11 | 3.00 | 43.84 | 1.04 | 39.48 | C30/37 |
| CVD a | 2.50 | 30.75 | 3.25 | 39.98 | ||||
| CVD b | 2.50 | 29.88 | 3.25 | 38.85 | ||||
| CVD c | 2.50 | 31.73 | 3.25 | 41.25 | ||||
| CVD v | 2.50 | 32.53 | 31.22 | 3.25 | 42.30 | 1.04 | 42.22 | C32/40 |
| Cores | D | Rc,a | Rmedc,a | D | Rc,p | CEV | Rmedc,p | ESC |
|---|---|---|---|---|---|---|---|---|
| CVD a | 2.50 | 30.75 | 3.25 | 39.98 | ||||
| CVD b | 2.50 | 34.75 | 3.25 | 45.17 | ||||
| CVD c | 2.50 | 34.26 | 3.25 | 44.53 | ||||
| CVD d | 2.50 | 38.51 | 3.25 | 50.07 | ||||
| CVD e | 2.50 | 38.50 | 35.35 | 3.25 | 50.05 | 1.04 | 47.80 | C35/45 |
| CMD a | 2.50 | 23.45 | 3.25 | 30.48 | ||||
| CMD b | 2.50 | 24.07 | 3.25 | 31.29 | ||||
| CMD c | 2.50 | 30.21 | 3.25 | 39.28 | ||||
| CMD d | 2.50 | 31.57 | 29.56 | 3.25 | 41.04 | 1.13 | 40.14 | C32/40 |
| MSC 1 a | 2.30 | 30.53 | 3.00 | 39.83 | ||||
| MSC 1 b | 2.30 | 35.69 | 3.00 | 46.56 | ||||
| MSC 1 c | 2.30 | 41.82 | 3.00 | 54.55 | ||||
| MSC 1 d | 2.30 | 44.25 | 36.77 | 3.00 | 57.72 | 1.00 | 49.66 | C35/45 |
| MDC 1 a | 2.30 | 39.02 | 3.00 | 50.90 | ||||
| MDC 1 b | 2.30 | 37.62 | 3.00 | 49.07 | ||||
| MDC 1 c | 2.30 | 33.21 | 3.00 | 43.32 | ||||
| MDC 1 d | 2.30 | 42.47 | 3.00 | 55.40 | ||||
| MDC 1 e | 2.30 | 36.08 | 37.68 | 3.00 | 47.06 | 1.00 | 49.15 | C35/45 |
| ARC 2 a | 2.30 | 25.81 | 3.00 | 33.66 | ||||
| ARC 2 b | 2.30 | 22.57 | 3.00 | 29.44 | ||||
| ARC 2 c | 2.30 | 32.48 | 3.00 | 42.36 | ||||
| ARC 2 d | 2.30 | 26.00 | 3.00 | 33.91 | ||||
| ARC 2 e | 2.30 | 35.07 | 3.00 | 45.74 | ||||
| ARC 2 f | 2.30 | 24.83 | 28.19 | 3.00 | 32.39 | 1.04 | 37.70 | C30/37 |
| ARC 3 a | 2.30 | 25.54 | 3.00 | 33.31 | ||||
| ARC 3 b | 2.30 | 27.52 | 3.00 | 35.90 | ||||
| ARC 3 c | 2.30 | 26.14 | 3.00 | 34.10 | ||||
| ARC 3 d | 2.30 | 28.44 | 26.50 | 3.00 | 37.10 | 1.04 | 36.51 | C25/30 |
| Cores | α2 | Cd | Cdia | Cmc | fc,P (MPa) | fcm,P (MPa) | fck,in situ,P (MPa) | Ccom,m | fck,p,P (MPa) | ESC |
|---|---|---|---|---|---|---|---|---|---|---|
| MSC 1 a | 1.15 | 1.09 | 1.21 | 1.00 | 42.05 | |||||
| MSC 1 b | 1.15 | 1.07 | 1.13 | 1.00 | 44.91 | |||||
| MSC 1 c | 1.15 | 1.07 | 1.17 | 1.00 | 46.33 | |||||
| MSC 1 d | 1.15 | 1.05 | 1.12 | 1.00 | 47.45 | |||||
| MSC 1 e | 1.15 | 1.06 | 1.21 | 1.00 | 49.19 | |||||
| MSC 1 f | 1.15 | 1.04 | 1.25 | 1.00 | 54.34 | |||||
| MSC 1 g | 1.15 | 1.02 | 1.16 | 1.00 | 54.60 | 48.41 | 43.41 | 1.00 | 43.41 | C32/40 |
| MSC 2 a | 1.15 | 1.05 | 1.17 | 1.00 | 48.67 | |||||
| MSC 2 b | 1.15 | 1.06 | 1.16 | 1.00 | 46.51 | |||||
| MSC 2 c | 1.15 | 1.03 | 1.21 | 1.00 | 54.46 | |||||
| MSC 2 d | 1.15 | 1.03 | 1.16 | 1.00 | 52.45 | 50.52 | 44.52 | 1.04 | 46.30 | C35/45 |
| ARC 1 a | 1.15 | 1.06 | 1.16 | 1.00 | 46.17 | |||||
| ARC 1 b | 1.15 | 1.08 | 1.10 | 1.00 | 41.48 | |||||
| ARC 1 c | 1.15 | 1.08 | 1.13 | 1.00 | 41.14 | |||||
| ARC 1 d | 1.15 | 1.06 | 1.14 | 1.00 | 45.39 | |||||
| ARC 1 e | 1.15 | 1.06 | 1.17 | 1.00 | 47.65 | |||||
| ARC 1 f | 1.15 | 1.04 | 1.16 | 1.00 | 51.90 | 45.62 | 39.62 | 1.04 | 41.21 | C32/40 |
| CVD a | 1.05 | 1.07 | 1.21 | 1.00 | 42.38 | |||||
| CVD b | 1.05 | 1.08 | 1.17 | 1.00 | 40.49 | |||||
| CVD c | 1.05 | 1.06 | 1.16 | 1.00 | 42.30 | |||||
| CVD v | 1.05 | 1.06 | 1.17 | 1.00 | 43.24 | 42.10 | 36.10 | 1.04 | 37.55 | C30/37 |
| Cores | α2 | Cd | Cdia | Cmc | fc,P (MPa) | fcm,P (MPa) | fck,in situ,P (MPa) | Ccom,m | fck,p,P (MPa) | ESC |
|---|---|---|---|---|---|---|---|---|---|---|
| CVD a | 1.05 | 1.07 | 1.10 | 1.00 | 39.63 | |||||
| CVD b | 1.05 | 1.04 | 1.10 | 1.00 | 43.73 | |||||
| CVD c | 1.05 | 1.04 | 1.10 | 1.00 | 43.27 | |||||
| CVD d | 1.05 | 1.02 | 1.16 | 1.00 | 49.25 | |||||
| CVD e | 1.05 | 1.02 | 1.16 | 1.00 | 49.32 | 45.04 | 40.04 | 1.04 | 41.64 | C32/40 |
| CMD a | 1.05 | 1.12 | 1.25 | 1.00 | 34.45 | |||||
| CMD b | 1.05 | 1.11 | 1.16 | 1.00 | 33.53 | |||||
| CMD c | 1.05 | 1.07 | 1.16 | 1.00 | 40.60 | |||||
| CMD d | 1.05 | 1.07 | 1.16 | 1.00 | 42.09 | 37.67 | 32.67 | 1.13 | 36.92 | C30/37 |
| MSC 1 a | 1.15 | 1.06 | 1.17 | 1.00 | 48.13 | |||||
| MSC 1 b | 1.15 | 1.02 | 1.16 | 1.00 | 54.39 | |||||
| MSC 1 c | 1.15 | 0.98 | 1.16 | 1.00 | 61.06 | |||||
| MSC 1 d | 1.15 | 0.96 | 1.16 | 1.00 | 63.60 | 56.79 | 51.79 | 1.00 | 51.79 | C40/50 |
| MDC 1 a | 1.15 | 1.00 | 1.23 | 1.00 | 60.37 | |||||
| MDC 1 b | 1.15 | 1.01 | 1.22 | 1.00 | 58.63 | |||||
| MDC 1 c | 1.15 | 1.04 | 1.24 | 1.00 | 53.92 | |||||
| MDC 1 d | 1.15 | 0.98 | 1.17 | 1.00 | 62.05 | |||||
| MDC 1 e | 1.15 | 1.02 | 1.22 | 1.00 | 56.84 | 58.36 | 53.36 | 1.00 | 53.36 | C40/50 |
| ARC 2 a | 1.15 | 1.09 | 1.25 | 1.00 | 43.95 | |||||
| ARC 2 b | 1.15 | 1.11 | 1.17 | 1.00 | 37.43 | |||||
| ARC 2 c | 1.15 | 1.04 | 1.10 | 1.00 | 48.50 | |||||
| ARC 2 d | 1.15 | 1.09 | 1.15 | 1.00 | 41.80 | |||||
| ARC 2 e | 1.15 | 1.02 | 1.14 | 1.00 | 52.92 | |||||
| ARC 2 f | 1.15 | 1.09 | 1.15 | 1.00 | 40.09 | 44.11 | 39.11 | 1.04 | 40.68 | C32/40 |
| ARC 3 a | 1.15 | 1.09 | 1.17 | 1.00 | 41.66 | |||||
| ARC 3 b | 1.15 | 1.08 | 1.25 | 1.00 | 46.32 | |||||
| ARC 3 c | 1.15 | 1.08 | 1.15 | 1.00 | 41.86 | |||||
| ARC 3 d | 1.15 | 1.07 | 1.15 | 1.00 | 44.97 | 43.70 | 38.70 | 1.04 | 40.25 | C32/40 |
| Specimen | ASC | CSTR ESC | Pucinotti ESC | Specimen | ASC | CSTR ESC | Pucinotti ESC |
|---|---|---|---|---|---|---|---|
| Second Group | Third Group | ||||||
| MSC 1 a | CVD a | ||||||
| MSC 1 b | CVD b | ||||||
| MSC 1 c | CVD c | ||||||
| MSC 1 d | CVD d | ||||||
| MSC 1 e | CVD e | C32/40 | C35/45 | C32/40 | |||
| MSC 1 f | CMD a | ||||||
| MSC 1 g | C32/40 | C30/37 | C32/40 | CMD b | |||
| MSC 2 a | CMD c | ||||||
| MSC 2 b | CMD d | C30/37 | C32/40 | C30/37 | |||
| MSC 2 c | MSC 1 a | ||||||
| MSC 2 d | C35/45 | C32/40 | C35/45 | MSC 1 b | |||
| ARC 1 a | MSC 1 c | ||||||
| ARC 1 b | MSC 1 d | C35/45 | C35/45 | C40/50 | |||
| ARC 1 c | MDC 1 a | ||||||
| ARC 1 d | MDC 1 b | ||||||
| ARC 1 e | MDC 1 c | ||||||
| ARC 1 f | C32/40 | C30/37 | C32/40 | MDC 1 d | |||
| CVD a | MDC 1 e | C35/45 | C35/45 | C40/50 | |||
| CVD b | ARC 2 a | ||||||
| CVD c | ARC 2 b | ||||||
| CVD v | C30/37 | C32/40 | C30/37 | ARC 2 c | |||
| ARC 2 d | |||||||
| ARC 2 e | |||||||
| ARC 2 f | C32/40 | C30/37 | C32/40 | ||||
| ARC 3 a | |||||||
| ARC 3 b | |||||||
| ARC 3 c | |||||||
| ARC 3 d | C32/40 | C25/30 | C32/40 | ||||
| Type of Cement | Water [l/m3] | Cement Content [kN/m3] | Ratio a/c | Plasticizer [l/m3] | fck [MPa] | Rck [MPa] | Consistency Classes | Sand Size 0–8 mm [Kg/m3] | Aggregate Size 4–16 mm [Kg/m3] | Aggregate Size 10–20 mm [Kg/m3] | Maximum Aggregate Diameter [mm] | Unit Weight [kN/m3] | |
|---|---|---|---|---|---|---|---|---|---|---|---|---|---|
| Cls1 | CEM II/A-LL 42.5 R | 185 | 4.00 | 0.46 | 3.2 | 28 | 35 | S4 | 9.98 | 2.18 | 5.99 | 20 | 24.03 |
| Cls2 | CEM II/A-LL 42.5 R | 185 | 5.30 | 0.35 | 4.2 | 40 | 50 | S4 | 9.31 | 2.03 | 5.59 | 20 | 24.12 |
| Cls3 | CEM II/A-LL 42.5 R | 185 | 3.50 | 0.53 | 2.8 | 25 | 30 | S4 | 10.24 | 2.23 | 6.14 | 20 | 23.99 |
Disclaimer/Publisher’s Note: The statements, opinions and data contained in all publications are solely those of the individual author(s) and contributor(s) and not of MDPI and/or the editor(s). MDPI and/or the editor(s) disclaim responsibility for any injury to people or property resulting from any ideas, methods, instructions or products referred to in the content. |
© 2023 by the author. Licensee MDPI, Basel, Switzerland. This article is an open access article distributed under the terms and conditions of the Creative Commons Attribution (CC BY) license (https://creativecommons.org/licenses/by/4.0/).
Share and Cite
Pucinotti, R. In Situ Strength vs. Potential Strength of Concrete: Proposal of a New Procedure for the Assessment of Excess Voidage. Appl. Sci. 2023, 13, 6403. https://doi.org/10.3390/app13116403
Pucinotti R. In Situ Strength vs. Potential Strength of Concrete: Proposal of a New Procedure for the Assessment of Excess Voidage. Applied Sciences. 2023; 13(11):6403. https://doi.org/10.3390/app13116403
Chicago/Turabian StylePucinotti, Raffaele. 2023. "In Situ Strength vs. Potential Strength of Concrete: Proposal of a New Procedure for the Assessment of Excess Voidage" Applied Sciences 13, no. 11: 6403. https://doi.org/10.3390/app13116403