Article

A Novel Automated Model for Evaluation of the Efficiency of Hole Cleaning Conditions during Drilling Operations

by
Mohammed Al-Rubaii
1,
Mohammed Al-Shargabi
2 and
Dhafer Al-Shehri
1,*
1
Department of Petroleum Engineering, King Fahd University of Petroleum & Minerals, Dhahran 31261, Saudi Arabia
2
School of Earth Sciences & Engineering, Tomsk Polytechnic University, Lenin Avenue, Tomsk 634050, Russia
*
Author to whom correspondence should be addressed.
Appl. Sci. 2023, 13(11), 6464; https://doi.org/10.3390/app13116464
Submission received: 2 May 2023 / Revised: 21 May 2023 / Accepted: 24 May 2023 / Published: 25 May 2023
(This article belongs to the Topic Petroleum and Gas Engineering)

Abstract

:
Hole cleaning for the majority of vertical and directional drilling wells continues to be a substantial difficulty despite improvements in drilling fluids, equipment, field techniques, and academic and industrial research. Poor hole cleaning might cause issues such as stuck pipe incidents, drilling cuttings accumulation, torque and drag, the erratic equivalent circulating density in the annulus, wellbore instability, tight spots, and hole condition issues. In order to enable the real-time and automated evaluation of hole cleaning efficiency for vertical and directional drilling, the article’s objective is to develop a novel model for the cutting transport ratio ( C T R m ) that can be incorporated into drilling operations on a real-time basis. The novel  C T R m  model provides a robust indicator for hole cleaning, which can assess complications and enhance drilling efficiency. Moreover, the novel  C T R m  model was successfully tested and validated in the field for four wells. The results of the real-time evaluation showed that the novel model was capable of identifying the hole cleaning efficiency in a normal drilling performance for Well-C and a stuck pipe issue in Well-D. In addition, the novel  C T R m  improved the rate of penetration by 52% in Well-A in comparison to Well-B.

Graphical Abstract

1. Introduction

Ineffective wellbore cleaning results in the accumulation of cuttings in the wellbore, causing serious problems that can be costly to remedy, many times greater than the cost of preventive measures to improve wellbore cleaning [1,2,3]. One of the most widespread problems, caused by cuttings accumulation which leads to stuck pipes in a wellbore, is a mechanical stuck borehole (about 30% of all stuck boreholes in vertical wells are connected to a hole cleaning problem; in high-angle wells, this rate is more than 80%) [4]. The efficiency of cuttings removal with increasing wellbore length is determined by many parameters, but the quality of wellbore cleaning mainly depends on the combined effect of the technological parameters of the used equipment and in particular the hydraulic parameters of hole cleaning (the rheology of the drilling fluid, pressure losses in different parts of circulation system, the type of flow, etc.). The key function of any drilling fluid is to clean the borehole by continuously transporting cuttings from under the bit to the surface [5,6]. The determinants of cuttings’ transport, in turn, are the drilling fluid itself and the cuttings’ velocity, which depends on the drilling fluid velocity. Mud velocity depends on the rheological parameters of the fluid, its density, pump capacity, and the geometry of the borehole annulus. Mud velocity appears to be a determining factor in wellbore clean-up. It could be possible to create a velocity that removes all the cuttings entering the well, but there are conditions in the well where the window between pore pressure and wellbore wall fracture pressure may be narrow, resulting in the fracturing and absorption of drilling fluid, and the wellbore walls may be subject to abrasive sludging. Such points make wellbore clean-up monitoring difficult [7,8]. The factors affecting wellbore clean-up are divided into three groups. The first group includes the fluid flow rate and the fluid parameters such as the viscosity and density. Furthermore, these parameters are interdependent and can influence the behavior of a moving fluid. For example, the viscosity of a fluid refers to its resistance to flow and can influence its flow rate through a pipe or annulus. Assuming all other parameters remain constant, a fluid with high viscosity will flow more slowly than a fluid with low viscosity. Similarly, a fluid’s density can impact its flow rate. A fluid with a higher density will require greater pumping force to move through a pipe or annulus, resulting in a delayed flow rate [9,10]. The second group consists of the cuttings’ parameters, which include the cutting density, size, and shape as well as the cuttings concentration in the annulus. The third group is operator factors and consists of the characteristics of the drill string with fluid swirl devices and its eccentric position in the wellbore, as well as the inclination of the wellbore itself. More importantly, optimizing the impact of these parameters can help sustain the carrying capacity of drilling fluids, leading to the improved design of wellbores [2,11]. Moreover, in order to understand the factors that determine the effectiveness of hole cleaning, several studies have been carried out over the years. For instance, Allawi et al. proved that the rotation of the drill pipe is one of the most important parameters for cuttings’ removal especially in laminar flow and transition flow [12]. Moreover, over the past few decades, numerous researchers have explored cuttings’ transport and developed various mechanistic and semi-mechanistic models to explain flow characteristics [13,14,15]. Zeidler et al. examined particle settling velocity, flow rate, fluid viscosity, and internal pipe rotation’s influences on transport mechanisms within a 15 foot-long, 3.5 inch inner diameter vertical glass tube laboratory setup [16]. Gavignet et al. developed an early mechanistic model for cuttings’ transport [17]. Saeid et al. used numerical simulations to analyze 3D incompressible non-Newtonian drilling mud flow in a vertical well drilling model under steady flow conditions, focusing on laminar flow with a Reynolds number of 1150 based on the hydraulic diameter of the annular space [18]. Osgouei et al. performed experiments with a multiphase flow loop, varying air and water flow rates and introducing cuttings into the annulus in different quantities. Data were collected under steady-state conditions, including liquid, gas, and cuttings’ injection rates, frictional pressure drop, local pressures, and high-speed digital images to identify the solid, liquid, and gas distribution within the wellbore [19]. Van et al. proposed a new drill pipe design with integrated hydro-mechanical features in each tool joint to address the limitations of mechanical hole cleaning devices (MCDs) in small diameter holes and to extend hydro-clean drill pipe applications to extended reach drilling (ERD) wells [20]. Mohammadsalehi et al. presented a comprehensive combination of Larsen’s model and Moore’s correlation to estimate and determine the minimum flow rate required for cuttings’ removal across all inclination angles, ranging from 0° to 90° [21]. Recently, Mahmoud et al. developed a new parameter, the hole cleaning indicator, which is based on the cutting carrying index (CCI). This innovative model considers various factors such as drilling fluid rheology, density, flow rate, hole size, drill pipe size, hole inclination, and the rate of penetration (ROP) to predict the hole cleaning condition during drilling [11]. The novel model could assist drilling engineers in mitigating issues such as cutting accumulation and drill pipe sticking. Furthermore, the model’s predictability was compared to commercially available software, and the results showed a good match [11]. However, when it comes to hole cleaning in drilling operations, there seems to be a significant gap in real-time evaluation methods to effectively test and optimize performance models.
Therefore, in view of the above, the aim of this study is to present the numerous hole cleaning indicators, which determine the nature and extent of borehole cleaning when drilling vertical wells, deviated wells, and wells with horizontal termination, and to show the existing parameters used to develop a novel cutting transport ratio for enhancing the drilling performance and continuous monitoring and assessment of hole cleaning in real-time during drilling.

2. The Mechanism of Hole Cleaning for Different Well Profiles

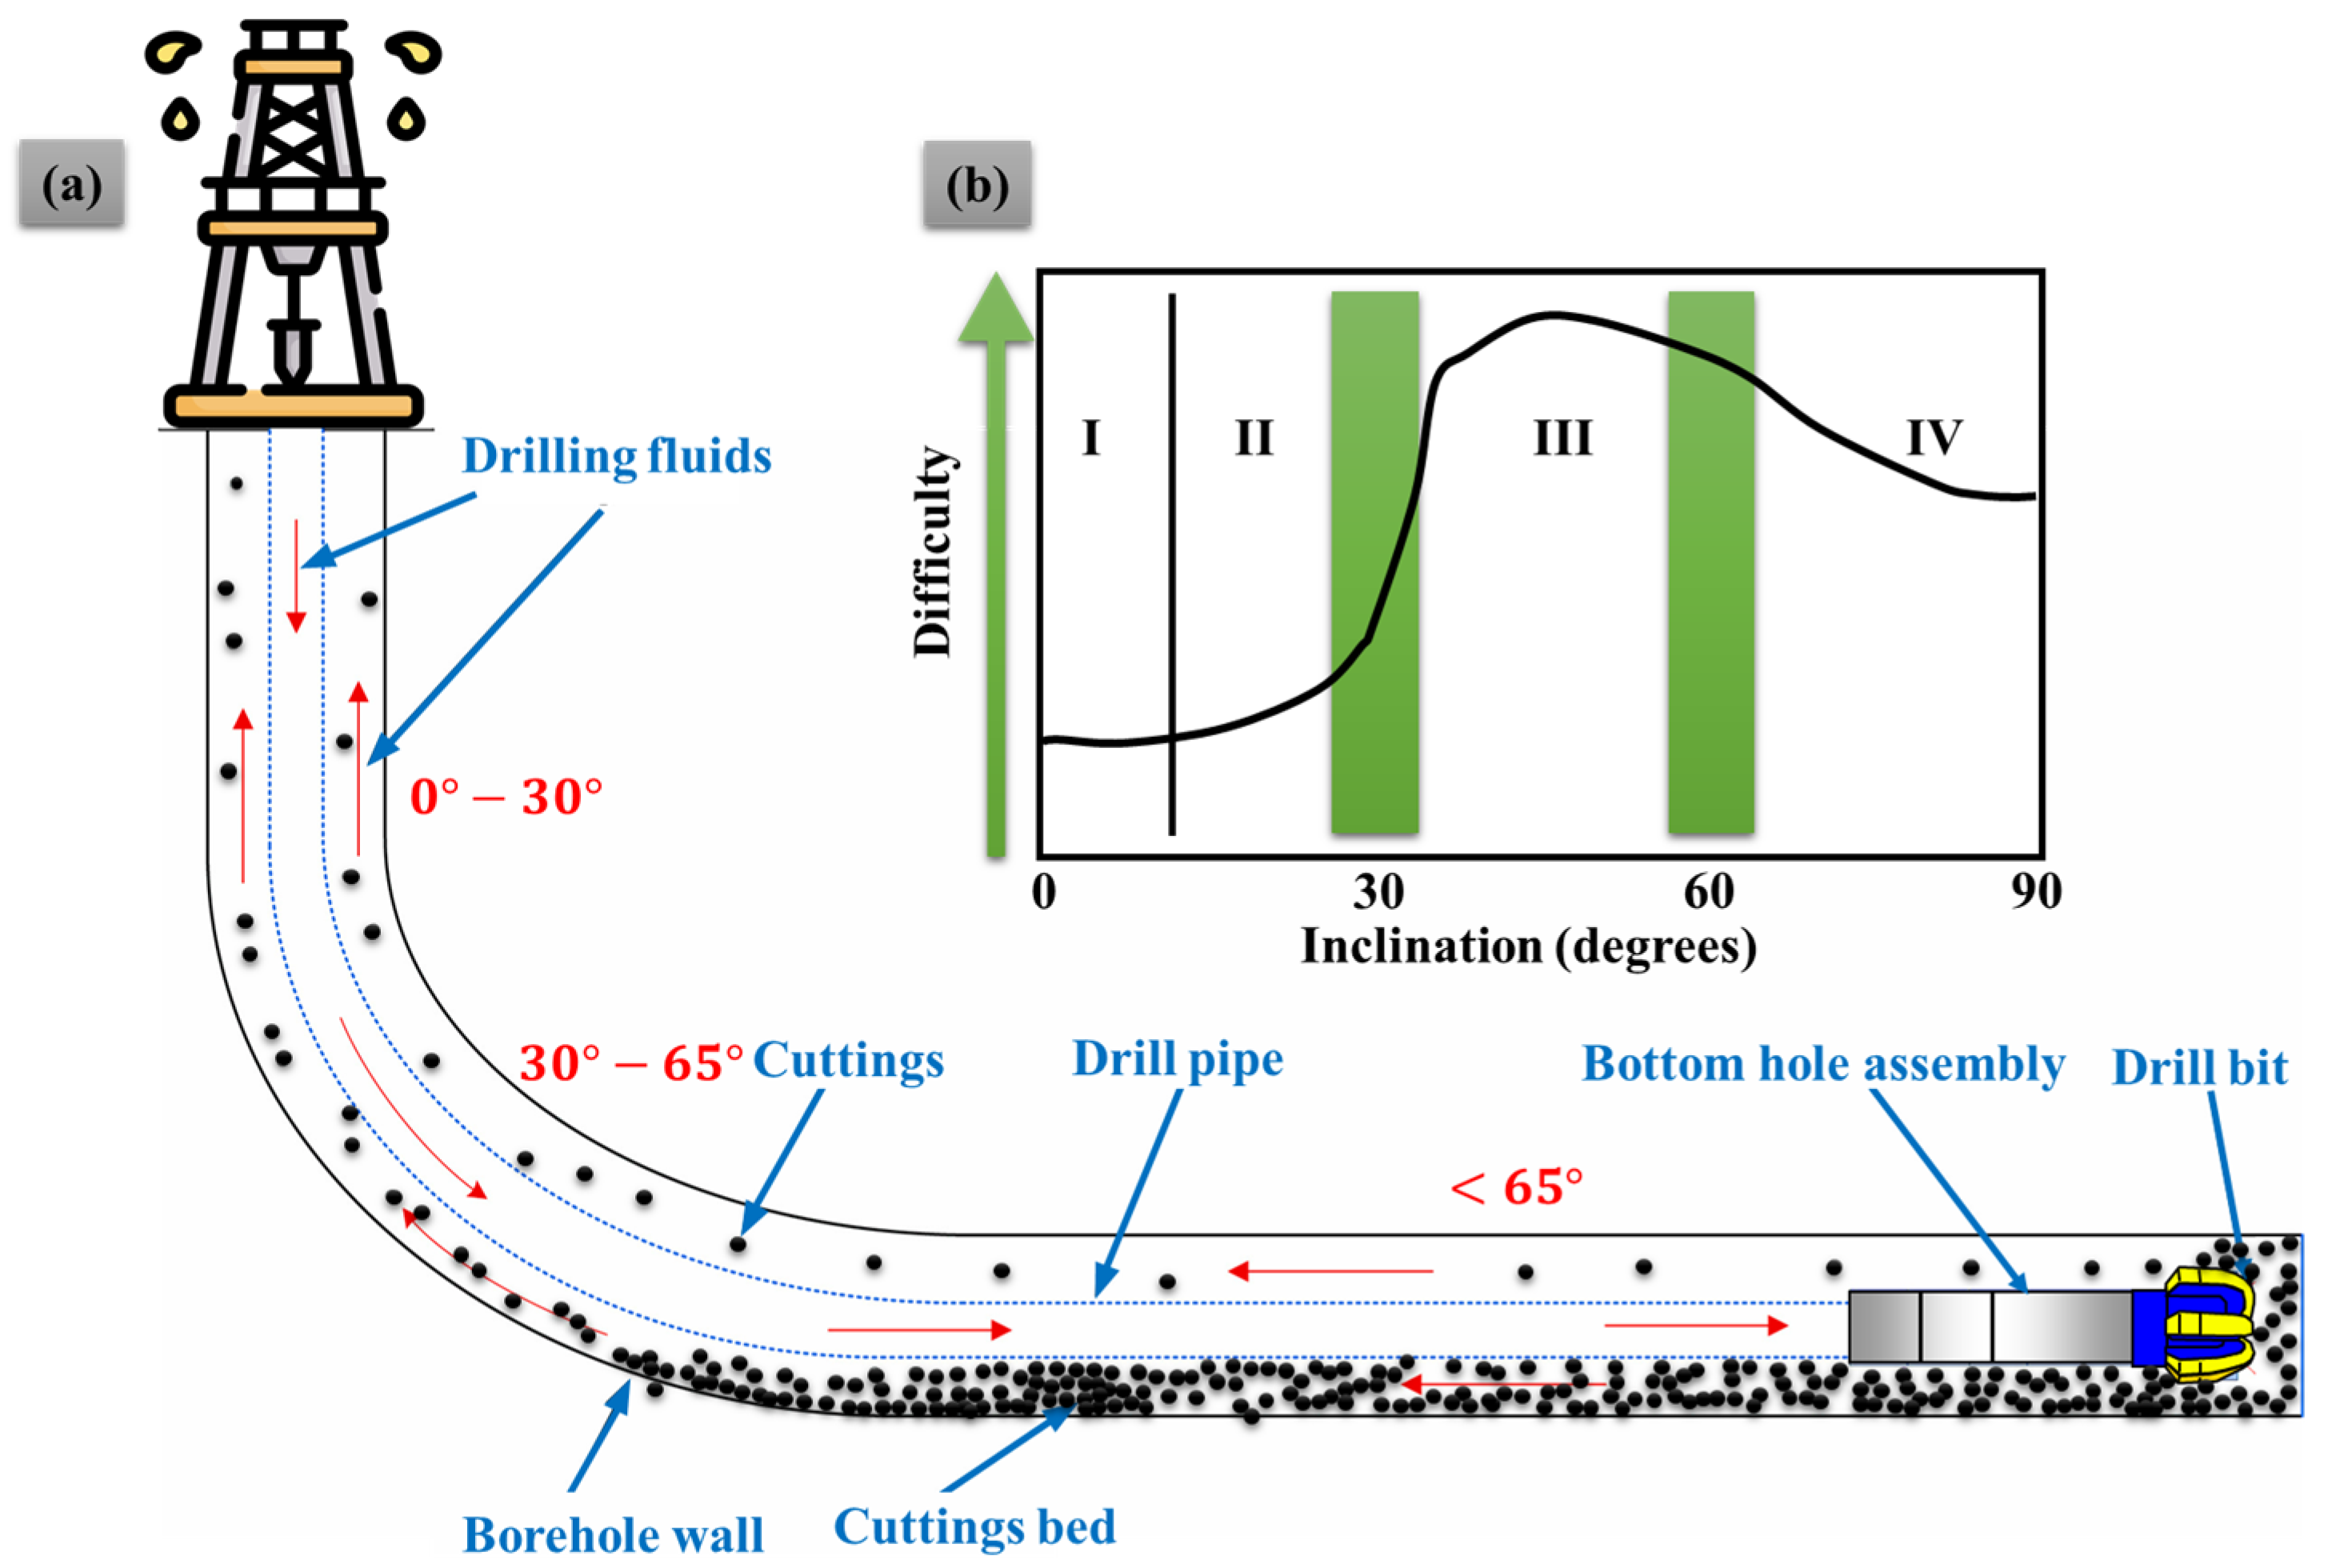
It is possible to improve the cleaning quality of a vertical borehole by reducing the final settling velocity of the cuttings. However, as the zenith angle increases, the reduction in the final settling velocity contributes less and less to the cleaning quality (Figure 1a). The sludge transport efficiency has to be corrected, because only the axial component of the final settling velocity is taken into account. It is therefore more difficult to predict the cleaning quality in such cases [22]. When predicting and controlling well cleaning, the formation of cutting layers has to be taken into account. Because of this, the volumetric concentration of the cuttings increases [23,24]. Moreover, in the process of deviated well drilling, problems often arise with bottom hole cleaning and the removal of broken rock to the surface due to the deposition of rock particles on the bottom hole or the borehole walls under ineffective cleaning modes. The efficiency of borehole cleaning from cuttings depends not only on the main hydrodynamic indicators and technological parameters of the drilling regime but also the geometry of the annular space and the borehole profile. In turn, the geometry of the annular space is often determined by the eccentric position of a drill string in a wellbore, and the borehole profile is determined by the zenith angle [24]. More importantly, the transport of cuttings has a significant influence on extended reach drilling. Cuttings created in horizontal wells often settle on the bottom side of the annular section. A stagnant cuttings bed will develop if the cuttings are not sufficiently cleared. This may result in a number of operating problems, including high torque and drag, low penetration rates, clogged pipes, lost circulation, and well control problems. Drilling activities must thus be halted sometimes for specific hole cleaning procedures, adding to the amount of unproductive time (Figure 1a) [25,26,27]. Figure 1b shows that holes with inclinations between 35 and 60 degrees are more difficult to clean compared to near-vertical sections, which are the easiest to clean.
Moreover, various classifications of borehole zenith angles are known, affecting the degree of clearance of the drilled rock particles. In mechanical cuttings’ removal, the mud behaves differently depending on the zenith angle (Figure 2). In intervals with zenith angles up to 30°, at significantly higher velocities (zone 1), the cuttings are effectively carried away by the mud flow and no sediment is formed on the walls. At lower velocities (zone 3), cuttings are slowly carried away. At zenith angles greater than 30°, the cuttings are deposited on the bottom wall of the borehole. At lower velocities (zone 4), the deposited cuttings are mixed upwards as a single mass, while in turbulent mode (zone 2), they rise on the contact surface of the cutting with the drilling fluid in the form of dunes. Conditions corresponding to zones 1 and 2 are ideal for cleaning the cuttings from the borehole. The conditions corresponding to zone 5 guarantee the occurrence of tool puffs, as there is no cuttings’ outflow at low rates of upward flow. As can be seen, cutting outflow is more difficult with an increasing zenith angle and lower flow velocity in the annulus. The greatest difficulties arise at zenith angles from 30 to 60°, as under these conditions, the deposited cuttings tend to slide down the borehole and form plugs [24,28].

The Hole Cleaning Indicators

In drilling operations, hole cleaning indicators are essential because they track how well the drilling fluid removes drill bits cuttings and keeps the wellbore free. Pump pressure, mud returns, ROP, temperature, torque, and drag are some of these indications. A rapid rise in pump pressure or a drop in mud returns might signal ineffective hole cleaning, and an increase in temperature, torque, and drag can all point to ineffective cuttings removal [29,30,31]. Drilling experts may take remedial action to avoid problems such as clogged pipes, lost circulation, and wellbore instability by keeping an eye on these signs, ensuring the drilling process runs smoothly and effectively. Several works have studied the hole cleaning indicators. For instance, Sanchez et al. showed that when drilling directional wells, the drill pipe’s dynamic behavior significantly contributes to better hole cleaning [32]. Saasen et al. proved that a sufficiently large annular frictional pressure loss is required to obtain proper hole cleaning in deviated wells [33]. Reda et al. proved that the hole cleaning efficiency enhances as the average annular velocity (AV), yield point (YP), plastic viscosity (PV), drill string rotation, and density of drilling fluid increase [34]. Moreover, Abbas et al. proved that the drill string eccentricity and flow rate are the drilling operation characteristics that have the most favorable effects on the cuttings transport procedure [35].
In drilling operations, real-time hole cleaning monitoring is essential for spotting possible problems including cuttings’ build-up and accidents involving trapped pipes. However, the quality of the data provided by the rig sensors has a significant impact on the dependability and accuracy of real-time hole cleaning indicators. Conventional rig sensors may not always be adequate to give the data required to run certain models in real-time, which might restrict drilling teams’ ability to quickly alter course to avoid or reduce hole cleaning issues [22,36]. More importantly, real-time parameters are those that are altered while drilling is taking place. Surface operating characteristics including ROP, flow-in, revolutions per minute (RPM), open hole diameter (OH), weight on bit (WOB), and others are affected by these changes. Depending on how real time is defined, there may or may not be a difference between real-time and non-real-time parameters. Figure 3 illustrates the use of iterative steady-state modelling with real-time parameters as inputs while drilling in real-time. This strategy aided in the development that is detailed below.
Thus, the next section explains a novel model which shows the existing parameters used to develop a novel cutting transport ratio for enhancing the drilling performance and continuous monitoring and assessment of hole cleaning in real-time during drilling.

3. Development of a Novel Model Cutting Transport Ratio

The cutting transport ratio (CTR) of the cuttings created by this study serves as the foundation for the innovative real-time indication of the progress of hole cleaning, which was developed by Tom Sifferman in 1974 and was used to assess how well the drilling fluid removes cuttings from the wellbore and was determined as the fluid transport velocity divided by the average mud annular velocity in a lab experiment [37]. The design of his experiment involved investigating various controlled variables. During his observations, it was discovered that some variables were more significant than others. Specifically, it was found that the average velocity and the rheological properties of the mud were the top two factors that affected the transport ratio, although the size of the simulated chips and the density of the mud also played important roles. Typically, the speed at which the cuttings move upwards differs from the velocity of the mud flowing in the annular space. This disparity indicates a tendency, particularly in turbulent flow, for the cuttings to slide back down the hole [37]. The researcher established a connection between the two speeds, which can be expressed as [37]:
VC = Va − Vs
where the symbol VC refers to the upward velocity of the cuttings, while Va (AV) represents the average velocity of the mud flow. On the other hand, Vs denotes the downward velocity at which the cuttings slip. To calculate the cutting transport ratio (CTR), both sides were divided by Va.
C T R = 1 V s V a
Moreover, Sifferman defined the transport percentage as achieving complete hole cleaning when the cuttings and mud reached the surface at equal speed. If there was any delay in the amount of cuttings that reached the surface or if they arrived later than the mud, the transport percentage would be less than 100%. It is important to note that a CTR of 75% or higher is considered sufficient [37]. Additionally, having an excessively high CTR (above what is required for complete hole cleaning) can be detrimental. It results in reducing the equivalent circulating density (ECD), increasing penetration rates, and, overall, optimizing the efficiency of energy. However, the CTR was only tested in a vertical interval and investigated by the experiment design. Therefore, there is a need to develop a novel model that can be used for real-time evaluations and applied in various profiles, such as deviated and horizontal wells [37,38]. Thus, the novel model transport ratio ( C T R m )  was developed starting from the effective mud weight  ( M W e f f ) calculated using Equation (3) [22,39].
M W e f f = M W · C C A + M W
where  M W  is the static drilling fluid density (lb/cf) and CCA is the cuttings concentration in an annulus as defined by Equation (4) [22,39].
C C A = R O P · O H 2 1471 · G P M · T R
where ROP is the rate of penetration (ft/hr), OH is the hole size diameter (inch), 1471 is the conversion factor,  G P M  is the pump flow rate (gal/min), and  T R  is the transport ratio, which can be replaced with 0.55 according to [39]. Furthermore, the ECD is determined based on the  M W e f f  in real time (ppg). To be precise, Equation (5) can be utilized to calculate the ECD [22,39].
E C D = M W + ( ( 0.085 O H O D p i p e ) · ( Y P + P V V a n n 300 ( O H O D p i p e ) ) ) · 7.481
where  O D  is the outer diameter of the drill pipe (inch),  P V  is the plastic viscosity (CP),  Y P  is the yield point (cP), and  V a n n  is the annular velocity of the drilling fluid (ft/min) as defined by Equation (6).
Equation (6) is used to determine the  V a n n  [40]:
V a n n = 24.5 G P M O H 2 O D p i p e 2 = V c r + V s c
where  V c r  is the is the cutting rise velocity (ft/min), which can be calculated by Equation (7), and  V s c  is the cutting slip velocity with the effect of rate of penetration (ft/min), which can be obtained from Equations (6) and (7)  V s c = V a n n V c r  [41,42].
V c r = 60 ( 1 ( O D p i p e O H ) 2 ) ( 0.64 + 18.16 R O P )
V s c = 24.5 G P M O H 2 O D p i p e 2 60 ( 1 ( O D p i p e O H ) 2 ) ( 0.64 + 18.16 R O P )
In Equation (7),  V c r  represents the rate at which cuttings are produced and elevated with the mud as a result of the ROP. Equation (9) is used to determine the apparent viscosity of the drilling fluid [42]:
M A p p = 2.4 V a n n O H O D ( 2 n + 1 3 n ) n ( 200 K ( O H O D ) V a )
where the drilling fluid’s K is a consistency factor (cP) and the flow behavior index is n, which can be obtained by the Equations (10) and (11), respectively [40,43].
k = ( ( P V + Y P ) ) ( 510 ) 1 n = k m = ( ( P V + Y P ) ( L S Y P ) ) ( 510 ) n m
n = 3.32 log ( ( 2 P V + Y P ) ( P V + Y P ) ) = n m = 3.32 log ( ( 2 P V + Y P ) ( 2 R 3 R 6 ) ( P V + Y P ) ( 2 R 3 R 6 ) )
The  k m  and  n m  factor can be replaced and used in Equation (9).
The drilling fluid’s effective viscosity can be obtained from Equation (12) (cP) [42]:
M e f f = P V + 300 Y P d c V a n n
where  d c  is the cutting diameter (inch) and can be calculated by Equation (13) [40]:
d c = 0.2 · R O P R P M
where  R P M  is the rotary speed of bit (rpm).
In Equation (13), based on [42,44], the maximum cutting diameter is 0.3–0.5 inch. Due to the use of directional drilling tools such as mud motors or the combination of a rotary steerable system (RSS) and a mud motor under a general name, which is referred to in the field as motorized RSS, due to the importance of considering the downhole RPM while drilling using the mud motor or the motorized RSS, Equation (13) was modified to Equation (14) to predict the modified average cutting diameter by including the specifications of the mud motor, such as the revolution per gallon ratio (x) and the GPM of the mud pump flow rate.
Thus, the modified cutting diameter can be obtained as follows:
d c m = 0.2 · R O P R P M + x G P M
As was explained above, the CTR is calculated by dividing the transport velocity by the drilling fluid velocity. However, this method falls short because it overlooks a number of factors that affect the CTR, such as the cuttings density  ( W c )  and the low shear yield point (LSYP). Thus, from Equation (5), the  E C D  can be modified as follows based on PV and YP. Moreover, the Fann viscometer is a tool commonly utilized to measure shear stress readings at various rotational speeds, including 600 RPM, 300 RPM, 200 RPM, 100 RPM, 6 RPM, and 3 RPM. The PV and YP values can be calculated using Equations (15) and (16), with the shear stress readings obtained at 300 RPM and 600 RPM [7,42]:
P V m = ( R 600 L S Y P ) ( R 300 L S Y P )
Y P m = ( 2 R 300 L S Y P ) ( R 600 L S Y P )
where  R 600  and  R 300  are the viscometer reading at 600 RPM and 300 RPM, respectively.
From Equations (5) and (12), the  P V m  and  Y P m  can be replaced, and the following Equation (17) of  E C D m  can be obtained:
E C D m = M W e f f +   ( ( 0.085 O H O D p i p e ) ·   ( ( 2 R 300 L S Y P ) ( R 600 L S Y P ) +   ( R 600 L S Y P ) ( R 300 L S Y P ) V a n n . m 300 ( O H O D p i p e ) ) ) · 7.481
In Equation (6), which represents the original annular mud velocity applied in the vertical hole section alone, Vann is given as a function of GPM, OH, and OD. The modified annular velocity ( V a n n . m ), as defined in Equation (18), depends on the weight and flow rate of the drilling fluid, the size of the drilled hole, the outer diameter of the drill pipe, the rate of penetration, the rotation of the drill string, the plastic viscosity, the yield point, the Fann viscometer readings at 3 and 6 rpm, the wellbore inclination, and the azimuthal directions [7,42].
V a n n . m = ( 24.5 · G P M O H 2 O D p i p e 2 c o s ( α ) + ( 60 ( 1 ( O D p i p e ) 2 ) ( 0.64 + 18.2 R O P ) + R O P ( O H 2 ) 60 ( O H 2 O D p i p e 2 ) ) sin ( β ) ) + 175 ( d c m ) ( 22 M W e f f 7.481 ) 2 n m ( M W e f f / 7.481 ) n m · ( 2.4 · V a n n O H O D p i p e ( 2 n m + 1 3 n m ) n m ( 200 K m ( O H O D p i p e ) V a n n ) ) n m
where  α  is the open hole angle (degrees) and  β  is the open hole azimuth (degrees). Based on worldwide experience, while drilling, there is a recommended pump flow which can be applied while drilling [45]. Table 1 shows the recommended pump flow (GPM) based on the hole size diameters.
In Equation (8),  V s c m  represents the modified slip velocity of the cuttings (ft/min), which takes into account the influence of the mud weight and other factors. The slip velocity of the cuttings, along with the effect of the mud weight, is determined using Equation (19). This equation employs Vs1, Vs2, and  V s t , which are cuttings velocities calculated based on the effective viscosity, the apparent viscosity, the rate of penetration, and the cutting in turbulent flow [40]. Moreover, the  V s c  can be added to the equation to take into account the influence of the cutting rise and the average mud annular velocity to consider the hydraulic velocity influence. To calculate Vs1, Vs2 V s t , and  V s c  Equation (19) can be utilized with the modified  d c m  [46,47,48].
V s c m = V s 1 + V s 2 + V s t + V s c 4
where
V s 1 = 0.45 ( M e f f ( M W e f f d c m ) ) ( ( 36800 M W e f f d c m 3 ( W c M W e f f ) M e f f 2 ) + 1 ) 0.5 1
V s 2 = ( 175 ( d c m ) ( W c M W e f f ) 0.667 M W e f f 0.333 M a p p 0.333 )
V s t = 113.4 · ( d c m ( p p M W e f f ) C D · M W e f f )
where pp is the particle density (lb/cf), CD is the drag coefficient, which can be calculated using Equation (23), and  W c  is the weight cutting (lb/cf), which can be calculated using Equation (24) as follows [36,49]:
C D = 24 R e + ( 1 + R e ) 0.4 + e ( 1 R e 0.39 )
W c = ( M W e f f C C A + M W e f f ) + ( 1 C C A ) M W e f f
where  R e  is the Reynolds number, which can be calculated using Equation (25) as follows [36,49]:
R e = 2.4 · M W e f f · V a n n . m ( O H O D ) μ e f f
where  μ e f f  is the effective viscosity (cP).
Equations (19)–(22) demonstrate that the average slip velocity is determined by averaging the values of the cuttings slip velocities under different flow regime types, each calculated using a respective equation. These equations also consider real-time drilling parameters, including the density of the cuttings, the drilling fluid weight, and the rheology of the drilling fluid. Moreover, based on [50], the original lifting capacity (LC) can be calculated by Equation (26) and can be modified to Equation (27), which can be considered as the  E C D m  [50].
L C = M W W c
L C m = E C D m W c
Thus, the transport ratio in Equation (28) also accounts for these real-time drilling parameters (see Figure 4). Since these parameters significantly impact the actual transport ratio, the obtained Equation (28) modified transport ratio ( C T R m ) is more precise than conventional Equation (2), which is used to calculate the transport ratio for the vertical tubes and is based on experimental work by Sifferman in 1974 [37].
Equation (28) can be used to compute and finalize the modified CTRm as a consequence:
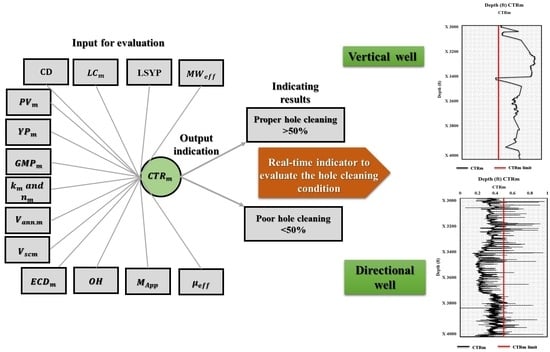
C T R m = ( 1 V s c m V a n n . m L C ) 100
Based on Figure 4, it is apparent that CTRm can be calculated using the initial parameters CCA and MWeff. Additionally, the model incorporates factors such as hydraulic velocities, the rheological properties of drilling fluids, flow regime, drag coefficient, cutting properties, equivalent circulating density, and lifting capacity to generate a novel CTRm model. The novel CTRm model serves as an indicator for the condition of hole cleaning and is evaluated using two criteria. If the CTRm is greater than 50%, this indicates proper hole cleaning. Conversely, a CTRm value less than 50% signifies poor hole cleaning.

4. Field Applications Using the Novel Cutting Transport Ratio

The effectiveness of the novel  C T R m  was confirmed during the directional drilling of the 12.25″ intermediate sections of two offshore wells, which were Well-A and Wells-B (see Figure 5a,b), and onshore Well-C with a 12″-diameter hole section (see Figure 6a), as well as a 8.5″ hole section drilled horizontally (see Figure 6b). These directional drilling sections were highly deviated, with the first two starting at 30 degrees and the third approaching a near-horizontal inclination of 90 degrees at the top of the reservoir in Well-A and Well-B.
Table 2 provides an overview of the essential characteristics of the drilled formations and the cuttings generated during the drilling of these sections. An oil-based drilling fluid was used to drill the two sections, and Table 3 summarizes the drilling fluid properties employed in these sections of Well-A and Well-B. Appendix A shows the input, calculated, and output parameters, and Appendix B shows the methodology of the novel model  C T R m .

4.1. Application of CTRm in Offshore Well-A and Well-B

The effectiveness of the developed CTRm model was evaluated in two wells with proper and poor hole cleaning, and its performance was tested and verified in the actual drilling site. The integration of the CTRm model and its automation has proven to be a beneficial tool in drilling operations, as it helps to prevent issues that may arise from inadequate hole cleaning. The following subsection describes the outcomes of implementing the CTRm model in Well-A and Well-B (see Figure 5). As seen in Figure 5a, a case involving Well-A, CTRm was utilized during drilling to optimize the ROP. At a depth of X3000 ft, the CTRm value was above 0.7, which suggests that the wellbore was clean and free from any cutting accumulation. The drilling crew did not notice any other indications of cuttings’ build-up. However, when the drilling reached a depth of X3800 ft, the CTRm value began to steadily decrease from 0.7 until it eventually dropped to less than 0.5 at X3891 ft. On the other hand, as seen in Figure 5b, the second well studied in this research is referred to as offshore Well-B, where CTRm was utilized to evaluate the performance of hole cleaning in relation to cuttings’ accumulation and to show the performance of ROP.
Table 4 presents a summary of the impact of implementing CTRm on well performance, with a particular focus on the enhanced hole cleaning achieved in Well-A. The results showed that the average CTRm value of over 0.64 resulted in a significant improvement in the ROP in Well-A, which reached 205 ft/hr, compared to the 70 ft/hr of ROP observed in Well-B. These results demonstrate that the successful achievement of proper hole cleaning can lead to a substantial improvement in well performance.
The overall analysis of the results in Table 4 reveals that the average ROP improvement in Well-A can be attributed to the effective hole cleaning achieved through the implementation of CTRm. However, there were some instances where the CTRm values fell below the limit of 0.5, specifically from depth X3000 to X4000 ft, due to poor hole cleaning. This led to cuttings’ accumulation in the wellbore and decreased the ROP to 105 ft/hr. In other words, the drilling process failed to effectively remove the cuttings, which impeded the drilling progress and resulted in a slower-than-expected ROP. These findings underscore the importance of maintaining proper hole cleaning throughout the drilling process to ensure optimal well performance.

4.2. Application of CTRm in Offshore Well-C and Well-D

In Figure 6a, a case involving Well-C which was a vertical gas well, CTRm was utilized during drilling to optimize the ROP. At a depth of 3250ft, the CTRm value was above 0.6, which suggests that the wellbore was approximately clean and free from cutting accumulation. The drilling crew did not notice any other indications of cutting accumulation or issues such as stuck pipes. However, when the drilling reached a depth of X3423 ft, the CTRm value began to steadily decrease from 0.6 until it eventually dropped to less than 0.5 at X3439 ft due to the fact that there had been some complications during the drilling process in formation, which can affect the ability to remove cuttings effectively, leading to a sudden decrease in hole cleaning efficiency. On the other hand, as shown in Figure 6b, Well-D was a horizontal well that was the subject of a particular case. Moreover, the average of the CTRm was 0.45, which indicated inefficient hole cleaning, due to the stuck pipe, which can be noticed at depth X3850–X400 ft (see Figure 6b).
Generally, poor wellbore cleaning can result in the accumulation of cuttings and other debris in the wellbore, leading to reduced drilling efficiency and an increased risk of complications. Similarly, stuck pipe incidents can significantly impede drilling progress and result in costly downtime. By addressing these issues promptly and effectively, drilling operations can maintain optimal performance and avoid potential delays and complications. Employing efficient wellbore cleaning techniques such as the novel CTRm model can help improve drilling efficiency and prevent issues related to stuck pipes. It is essential to continuously monitor and evaluate drilling operations to identify potential issues and take proactive steps to address them in a timely manner.
Table 5 provides a summary of the impact of implementing CTRm on well performance, particularly in relation to the enhanced hole cleaning achieved in the vertical gas well, Well-C. The average CTRm value in Well-C was over 0.57, and the average ROP was 14.3 ft/hr. These results demonstrate the positive impact of effective wellbore cleaning and the successful implementation of the CTRm model on drilling performance. In contrast, the average CTRm value in the horizontal well, Well-D, was 0.45, which is below the limited value due to stuck pipe issues. The average ROP in Well-D was 93.4 ft/hr, which was also affected by inefficient wellbore cleaning and stuck pipe incidents. These results highlight the importance of identifying and addressing issues related to wellbore cleaning and stuck pipe promptly to maintain optimal drilling performance and prevent costly downtime.
Based on the results above, in Well-A, the novel CTRm model improved the rate of penetration by 52% compared to Well-B. These results indicate that the model is an effective solution for enhancing drilling performance, identifying complications, and improving hole cleaning efficiency. Real-time evaluations showed that the model could identify hole cleaning efficiency during normal drilling operations in Well-C, and detect stuck pipe issues in Well-D. Overall, the novel CTRm model has proven to be a valuable tool for optimizing drilling operations and addressing potential issues in real-time.

5. Conclusions

The novel CTRm model takes into account various real-time drilling parameters to evaluate and optimize drilling performance. By utilizing these parameters, the model can provide accurate assessments of hole cleaning efficiency, identify potential issues in real-time, and help to prevent complications such as stuck pipe incidents. The real-time drilling parameters that the CTRm model accounts for may include the drilling fluid flow rate, pump pressure, and drill string rotation speed, among others. By incorporating these parameters into its calculations, the CTRm model provides a comprehensive and reliable assessment of drilling performance, which can help to optimize drilling operations and enhance overall efficiency. The following points can be summarized:
1. The CTRm, a crucial hole cleaning indicator, is monitored in real-time using drilling factors such as cuttings features, drilling mechanical parameters, well trajectory profiles (the well path, which contains the inclinations and the azimuths), and fluid rheological properties, with consideration of the LSYP as it is a signal for hole cleaning effectiveness in directional drilling, along with calculated cuttings slip and annular velocities. This monitoring helps engineers identify well cleaning and ROP issues, leading to improved efficiency through fluid optimization, drilling adjustments, and advanced technology use. The novel CTRm model, instead of commercial software, facilitates real-time optimization and interventions, accounting for wellbore shape changes and spontaneous field data. Connecting CTRm to the driller’s control panel enables immediate evaluation and remedial actions for hole cleaning.
2. The novel CTRm was tested and validated in the field. The obtained results proved that the efficiency of the drilling wells was enhanced. Drilling practices might be greatly improved by utilizing the novel CTRm and its automation, which would reduce any possible issues brought on by insufficient hole cleaning.
3. Real-time evaluation demonstrated that the model could identify hole cleaning efficiency during normal drilling operations in Well-C and detected stuck pipe issues in Well-D. Furthermore, in comparison to Well-B, the novel CTRm model improved the rate of penetration by 52% in Well-A. Overall, the results indicate that the novel CTRm model is an effective solution for enhancing drilling performance, identifying complications, and improving hole cleaning efficiency.

Author Contributions

Conceptualization, M.A.-R. and M.A.-S.; methodology, M.A.-R. and M.A.-S.; validation, M.A.-R. and M.A.-S.; formal analysis, M.A.-R. and M.A.-S.; investigation, M.A.-R. and M.A.-S.; resources, M.A.-R. and M.A.-S.; data curation, M.A.-R. and M.A.-S.; writing—original draft preparation, M.A.-R. and M.A.-S.; writing—review and editing, M.A.-R. and M.A.-S.; visualization, M.A.-R. and M.A.-S.; supervision, D.A.-S.; project administration, D.A.-S. All authors have read and agreed to the published version of the manuscript.

Funding

This research received no external funding.

Institutional Review Board Statement

Not applicable.

Informed Consent Statement

Not applicable.

Data Availability Statement

The data presented in this study are available on request from the corresponding author. The data are not publicly available due to the internal Law of Saudi Aramco “On Export Control”.

Acknowledgments

The College of Petroleum and Geosciences at King Fahd University of Petroleum and Minerals and the School of Earth Sciences and Engineering at Tomsk Polytechnic University are acknowledged for their support and permission to publish this work.

Conflicts of Interest

The authors declare no conflict of interest.

Nomenclature

AV or Vaannular velocity, ft/min
Vannannular velocity, ft/min
M A p p apparent viscosity, cP
CCIcarrying capacity index
CCAconcentration of cuttings in the annulus
K consistency factor, cP
dcmcutting diameter, inch
VCrcutting rise velocity, ft/min
Vsccutting slip velocity, ft/min
CTRcutting transport ratio
R3dial reading at 3 revolutions per minutes, cP
R300dial reading at 300 revolutions per minutes, cP
R6dial reading at 6 revolutions per minutes, cP
R600dial reading at 600 revolutions per minutes, cP
V s downward velocity, ft/min
CDdrag coefficient
M W e f f effective mud weight, pcf
μ e f f effective viscosity, cP
ECDequivalent circulating density, pcf
ERDextended reach drilling
n flow behavior index
OHhole diameter, inch
MCDsmechanical hole cleaning devices
Vann.mmodified annular velocity, ft/min
k m modified consistency factor, cP
ECDmmodified equivalent circulating density, pcf
n m modified flow behavior index
LCmmodified original lifting capacity
PVmmodified plastic viscosity, cP
Vscmmodified slip velocity of the cuttings, ft/min
YPmmodified yield point, cP
MWmud weight, pcf
C T R m novel model transport ratio, % or fraction
α open hole angle, degrees
βopen hole azimuth, degrees
LCoriginal lifting capacity
ODouter diameter of drill pipe, inch
p p   o r   W c particle density or weigh of the cuttings, lb/cf
PVplastic viscosity, cP
GPMpump flow rate, Gal/min
ROPrate of penetration, ft/hr
xrevolution per gallon ratio
RPMrevolution per minute, rev/min
ReReynolds number
RSS rotary steerable system
VCupward velocity of the cuttings, ft/mins
Vs1 and Vs2velocity based on effective viscosity, apparent viscosity, and the weight and diameter of cuttings, ft/min
Vstvelocity based on the cutting in turbulent flow, ft/min
WOBweight on bit, KIb
YPyield point, cP

Appendix A. The Measured, Calculated, and Output Parameters for the Novel Model CTRm

Table A1. The input, calculated, and output parameters for the novel model CTRm.
InputCalculated ParametersOutput
MWCCACTRm
PV   M W e f f
WC
YPVann
R600VCr
R300Vsc
R3Vann.m
R6Vs1
RPMVs2
GPMVst
ROPVscm
OHCD
ODRe
  α LC
xLCm
βdcm
  M A p p
PVm
YPm
ECDm

Appendix B. The Methodology of the Novel Model CTRm

The flow chart presented below demonstrates how the CTRm can be calculated using the initial parameters CCA and MWeff. In addition to these parameters, the novel CTRm model takes into account other various factors such as hydraulic velocities, the rheological properties of the drilling fluids, the flow regime, the drag coefficient, the cuttings properties, the equivalent circulating density, and the lifting capacity.
Figure A1. The Methodology of the Novel Model CTRm.
Applsci 13 06464 g0a1

References

  1. Heshamudin, N.S.; Katende, A.; Rashid, H.A.; Ismail, I.; Sagala, F.; Samsuri, A. Experimental Investigation of the Effect of Drill Pipe Rotation on Improving Hole Cleaning Using Water-Based Mud Enriched with Polypropylene Beads in Vertical and Horizontal Wellbores. J. Pet. Sci. Eng. 2019, 179, 1173–1185. [Google Scholar] [CrossRef]
  2. Deshmukh, V.; Dewangan, S.K. Review on Various Borehole Cleaning Parameters Related to Oil and Gas Well Drilling. J. Braz. Soc. Mech. Sci. Eng. 2022, 44, 1–24. [Google Scholar] [CrossRef]
  3. Wang, G.; Dong, M.; Wang, Z.; Ren, T.; Xu, S. Removing Cuttings from Inclined and Horizontal Wells: Numerical Analysis of the Required Drilling Fluid Rheology and Flow Rate. J. Nat. Gas Sci. Eng. 2022, 102, 104544. [Google Scholar] [CrossRef]
  4. Gaurina-Medjimurec, N.; Pasic, B. Risk Due to Pipe Sticking. In IGI Global; IGI Global: Hershey, PA, USA, 2014; pp. 47–72. ISBN 9781466647787. [Google Scholar]
  5. Ogunrinde, J.O.; Dosunmu, A. Hydraulics Optimization for Efficient Hole Cleaning in Deviated and Horizontal Wells. In Proceedings of the Nigeria Annual International Conference and Exhibition, Lagos, Nigeria, 6–8 August 2012; Volume 1, pp. 100–115. [Google Scholar] [CrossRef]
  6. Mahmoud, H.; Hamza, A.; Nasser, M.S.; Hussein, I.A.; Ahmed, R.; Karami, H. Hole Cleaning and Drilling Fluid Sweeps in Horizontal and Deviated Wells: Comprehensive Review. J. Pet. Sci. Eng. 2020, 186, 106748. [Google Scholar] [CrossRef]
  7. Caenn, R.; Darley, H.C.H.; Gray, G.R. Composition and Properties of Drilling and Completion Fluids: Seventh Edition; Gulf Professional Publishing: Houston, TX, USA, 2016; ISBN 9780128047514. [Google Scholar]
  8. Liu, N.; Zhang, D.; Gao, H.; Hu, Y.; Duan, L. Real-Time Measurement of Drilling Fluid Rheological Properties: A Review. Sensors 2021, 21, 3592. [Google Scholar] [CrossRef]
  9. Bilgesu, H.I.; Mishra, N.; Ameri, S. Understanding the Effects of Drilling Parameters on Hole Cleaning in Horizontal and Deviated Wellbores Using Computational Fluid Dynamics. In Proceedings of the Eastern Regional Meeting, Lexington, KY, USA, 17–18 October 2007; pp. 206–212. [Google Scholar] [CrossRef]
  10. Poon, C. Measuring the Density and Viscosity of Culture Media for Optimized Computational Fluid Dynamics Analysis of in Vitro Devices. J. Mech. Behav. Biomed. Mater. 2022, 126, 105024. [Google Scholar] [CrossRef]
  11. Mahmoud, A.A.; Elzenary, M.; Elkatatny, S. New Hybrid Hole Cleaning Model for Vertical and Deviated Wells. J. Energy Resour. Technol. Trans. ASME 2020, 142, 034501. [Google Scholar] [CrossRef]
  12. Allawi, R.H.; Almahdawi, F.H.M. Better Hole Cleaning in Highly Deviated Wellbores. In Proceedings of the IOP Conference Series: Materials Science and Engineering, Wuhan, China, 10–12 October 2019; Volume 579, p. 012007. [Google Scholar] [CrossRef]
  13. Li, J.; Luft, B. Overview Solids Transport Study and Application in Oil-Gas Industry-Theoretical Work. In Proceedings of the International Petroleum Technology Conference, Kuala Lumpur, Malaysia, 10–12 December 2014; Volume 2, pp. 1224–1258. [Google Scholar] [CrossRef]
  14. Kelin, W.; Tie, Y.; Xiaofeng, S.; Shuai, S.; Shizhu, L. Review and Analysis of Cuttings Transport in Complex Structural Wells. Open Fuels Energy Sci. J. 2013, 6, 9–17. [Google Scholar] [CrossRef]
  15. Nazari, T.; Hareland, G.; Azar, J.J. Review of Cuttings Transport in Directional Well Drilling: Systematic Approach. In Proceedings of the SPE Western Regional Meeting, Anaheim, CA, USA, 27–29 May 2010; Volume 1, pp. 108–122. [Google Scholar] [CrossRef]
  16. Zeidler, U.H. An Experimental Analysis of the Transport of Drilled Particles. Soc. Pet. Eng. J. 1972, 12, 39–48. [Google Scholar] [CrossRef]
  17. Gavignet, A.A.; Sobey, I.J. Model Aids Cuttings Transport Prediction. J. Pet. Technol. 1989, 41, 916–921. [Google Scholar] [CrossRef]
  18. Saeid, N.; Busahmin, B. Bashir Busahmin CFD Analysis of Drilling Fluid Flow in Vertical Well Flow Modeling and Simulation. In Proceedings of the 6th Brunei International Conference on Engineering and Technology, Bandar Seri Begawan, Brunei, 14–16 November 2016. [Google Scholar]
  19. Osgouei, R.E.; Ozbayoglu, E.M.; Ozbayoglu, M.A.; Yuksel, E.H. A New Model to Determine the Two-Phase Drilling Fluid Behavior Through Horizontal Eccentric Annular Geometry, Part A: Flow Pattern Identification and Liquid Hold-up Estimation. Energy Sources Part A Recovery Util. Environ. Eff. 2015, 37, 1663–1673. [Google Scholar] [CrossRef]
  20. Vanpuymbroeck, L. Increasing Drilling Performance Using Hydro-Mechanical Hole Cleaning Devices. In Proceedings of the SPE Unconventional Gas Conference and Exhibition, Muscat, Oman, 28–30 January 2013; pp. 544–561. [Google Scholar] [CrossRef]
  21. Mohammadsalehi, M.; Malekzadeh, N. Optimization of Hole Cleaning and Cutting Removal in Vertical, Deviated and Horizontal Wells. In Proceedings of the SPE Asia Pacific Oil and Gas Conference and Exhibition, Jakarta, Indonesia, 20–22 September 2011; Volume 1, pp. 301–308. [Google Scholar] [CrossRef]
  22. Rathgeber, D.; Johnson, E.; Lucon, P.; Anderson, R.; Todd, B.; Downey, J.; Richards, L. A Novel Approach to Determining Carrying Capacity Index Through Incorporation of Hole Size and Pipe Rotation. In Proceedings of the SPE Western Regional Meeting, Anchorage, AK, USA, 22–25 May 2023. [Google Scholar] [CrossRef]
  23. Yeu, W.J.; Katende, A.; Sagala, F.; Ismail, I. Improving Hole Cleaning Using Low Density Polyethylene Beads at Different Mud Circulation Rates in Different Hole Angles. J. Nat. Gas Sci. Eng. 2019, 61, 333–343. [Google Scholar] [CrossRef]
  24. Khosravanian, R.; Aadnøy, B.S. Methods for Petroleum Well Optimization: Automation and Data Solutions; Elsevier: Amsterdam, The Netherlands, 2021; pp. 1–538. [Google Scholar] [CrossRef]
  25. Huque, M.M.; Rahman, M.A.; Zendehboudi, S.; Butt, S.; Imtiaz, S. Investigation of Cuttings Transport in a Horizontal Well with High-Speed Visualization and Electrical Resistance Tomography Technique. J. Nat. Gas Sci. Eng. 2021, 92, 103968. [Google Scholar] [CrossRef]
  26. Rodriguez Corredor, F.E.; Bizhani, M.; Kuru, E. Experimental Investigation of Cuttings Bed Erosion in Horizontal Wells Using Water and Drag Reducing Fluids. J. Pet. Sci. Eng. 2016, 147, 129–142. [Google Scholar] [CrossRef]
  27. Ozbayoglu, E.M.; Osgouei, R.E.; Ozbayoglu, A.M.; Yuksel, H.E. Hole-Cleaning Performance of Gasified Drilling Fluids in Horizontal Well Sections. SPE J. 2012, 17, 912–923. [Google Scholar] [CrossRef]
  28. Hyun, C.; Subhash, N.S.; Osisanya, S.O. A Three-Segment Hydraulic Model for Cuttings Transport in Horizontal and Deviated Wells. In Proceedings of the SPE/CIM International Conference on Horizontal Well Technology, Calgary, AB, Canada, 6–8 November 2000; pp. 1–16. [Google Scholar] [CrossRef]
  29. Nwagu, C.; Awobadejo, T.; Gaskin, K. Application of Mechanical Cleaning Device: Hole Cleaning Tubulars, to Improve Hole Cleaning. In Proceedings of the SPE Nigeria Annual International Conference and Exhibition, Lagos, Nigeria, 5–7 August 2014; Volume 1, pp. 662–675. [Google Scholar] [CrossRef]
  30. Forshaw, M.; Becker, G.; Jena, S.; Linke, C.; Hummes, O. Automated Hole Cleaning Monitoring: A Modern Holistic Approach for NPT Reduction. In Proceedings of the International Petroleum Technology Conference, Dhahran, Saudi Arabia, 13–15 January 2020. [Google Scholar] [CrossRef]
  31. Davoodi, S.; Ramazani, A.; Rukavishnikov, V.; Minaev, K. Insights into Application of Acorn Shell Powder in Drilling Fluid as Environmentally Friendly Additive: Filtration and Rheology. Int. J. Environ. Sci. Technol. 2021, 18, 835–848. [Google Scholar] [CrossRef]
  32. Sanchez, R.A.; Azar, J.J.; Bassal, A.A.; Martins, A.L. The Effect of Drillpipe Rotation on Hole Cleaning During Directional Well Drilling. In Proceedings of the SPE/IADC Drilling Conference, Amsterdam, The Netherlands, 4–6 March 1997. [Google Scholar] [CrossRef]
  33. Saasen, A. Hole Cleaning During Deviated Drilling—The Effects of Pump Rate and Rheology. In Proceedings of the European Petroleum Conference, Hague, The Netherlands, 20–22 October 1998. [Google Scholar] [CrossRef]
  34. Reda, M.; El Sayed, N.A.; Shalaby, S.E.; Farahat, M.S. A Statistical Model for Hole Cleaning and Cuttings Transport Efficiency During Drilling of Wells. J. Pet. Min. Eng. 2018, 20, 30–40. [Google Scholar] [CrossRef]
  35. Abbas, A.K.; Alsaba, M.T.; Al Dushaishi, M.F. Comprehensive Experimental Investigation of Hole Cleaning Performance in Horizontal Wells Including the Effects of Drill String Eccentricity, Pipe Rotation, and Cuttings Size. J. Energy Resour. Technol. Trans. ASME 2022, 144, 063006. [Google Scholar] [CrossRef]
  36. Jimmy, D.; Wami, E.; Ogba, M.I. Cuttings Lifting Coefficient Model: A Criteria for Cuttings Lifting and Hole Cleaning Quality of Mud in Drilling Optimization. In Proceedings of the SPE Nigeria Annual International Conference and Exhibition, Lagos, Nigeria, 31 July–2 August 2022. [Google Scholar] [CrossRef]
  37. Sifferman, T.R.; Myers, G.M.; Haden, E.L.; Wahl, H.A. Drill Cutting Transport in Full Scale Vertical Annuli. J. Pet. Technol. 1974, 26, 1295–1302. [Google Scholar] [CrossRef]
  38. Robinson, L.; Morgan, M. Effect of Hole Cleaning on Drilling Rate and Performance. In Proceedings of the AADE 2004 Drilling Fluids Conference, Houston, TX, USA, 6–7 April 2004; pp. 6–7. [Google Scholar]
  39. Mitchell, B. Advanced Oilwell Drilling Engineering Handbook; Society of Petroleum Engineers of the AIME: Dallas, TX, USA, 1992. [Google Scholar]
  40. Lyons, W.C.; Carter, T.; Lapeyrouse, N.J. Formulas and Calculations for Drilling, Production, and Workover: All the Formulas You Need to Solve Drilling and Production Problems; Elsevier: Amsterdam, The Netherlands, 2015; ISBN 9780128034170. [Google Scholar]
  41. Samuel, R. Modeling and Analysis of Drillstring Vibration in Riserless Environment. J. Energy Resour. Technol. 2013, 135, 013101. [Google Scholar] [CrossRef]
  42. Guo, B.; Liu, G. Applied Drilling Circulation Systems: Hydraulics, Calculations and Models; Elsevier: Amsterdam, The Netherlands, 2011; ISBN 9780123819574. [Google Scholar]
  43. Widiyatni, H.; Rizkina, A.; Dirastri, W.I. Evaluation of Drilling Hydraulic Calculation to the Ability of Bottom Hole Cleaning. J. Phys. Conf. Ser. 2019, 1402, 055109. [Google Scholar] [CrossRef]
  44. Moore, P. Drilling Practices Manual. 1986. Available online: https://openlibrary.org/publishers/Petroleum_Pub._Co (accessed on 1 May 2023).
  45. Saudi Aramco Drilling Manual. 2018. Available online: https://www.academia.edu/ (accessed on 1 May 2023).
  46. Hamoudi, M.R.A.; Abdulwahhab, A.H.; Khalid, A.W.; Authman, D.; Ameen, R.A.M. Transportation of Cuttings in Inclined Wells. UKH J. Sci. Eng. 2018, 2, 3–13. [Google Scholar] [CrossRef]
  47. Chien, S.F. Annular Velocity for Rotary Drilling Operations. Int. J. Rock Mech. Min. Sci. Geomech. Abstr. 1972, 9, 403–416. [Google Scholar] [CrossRef]
  48. Bizhani, M.; Rodriguez-Corredor, F.E.; Kuru, E. Hole Cleaning Performance of Water vs. Polymer-Based Fluids Under Turbulent Flow Conditions. In Proceedings of the SPE Canada Heavy Oil Technical Conference, Calgary, AB, Canada, 9–11 June 2015; pp. 545–562. [Google Scholar] [CrossRef]
  49. Chen, Y.; Wang, L.; Chang, H.; Zhang, Q. A Review of Drag Coefficient Models in Gas-Liquid Two-Phase Flow. ChemBioEng Rev. 2023. [Google Scholar] [CrossRef]
  50. Mitchell, J. Trouble-Free Drilling; Drilbert Engineering Inc.: Conroe, TX, USA, 2003; ISBN 9780972298605. [Google Scholar]
Figure 1. Schematic of transport cutting: (a) shows the transport of cuttings in a horizontal well, and (b) shows the difficulty of hole cleaning in relation to inclination.
Applsci 13 06464 g001
Figure 2. Cutting transport mechanism for different ranges of zenith angle at different speeds in the annulus.
Applsci 13 06464 g002
Figure 3. The use of iterative steady-state modelling with real-time parameters as inputs while drilling in real-time.
Applsci 13 06464 g003
Figure 4. The input and output of the novel model CTRm as a real-time evaluation for indicating the hole cleaning condition.
Applsci 13 06464 g004
Figure 5. Application of CTRm in the offshore proper hole cleaning of Well-A (a) and the poor hole cleaning of Well-B (b).
Applsci 13 06464 g005
Figure 6. Application of CTRm in the offshore gas vertical Well-C (a) and the horizontal Well-B (b).
Applsci 13 06464 g006
Table 1. The recommended GPM based on the hole size diameters.
Hole Size, inches Recommended GPM, gal/min V a n n , ft/hr
221000–120054–65
161000108
12.5950–1000185–195
8.5500–600292–350
6.125250–300285–342
5 7/8250–300330–397
Table 2. Formation and drilling cuttings’ properties.
ParameterValue
Formation lithology typeSandstone, limestone, and shale
Formation temperature(140–155) °F
Formation porosity0.15–0.25
Washout10–30%
Density of drill cuttings(20–24) (ppg)
Size of drill cuttings(0.2–0.375) (inches)
Table 3. The drilling fluid characteristics.
ParameterCharacteristic Range
Oil-based drilling mud density80 lb/ft3
Oil ratio(0.75–0.8)
Water ratio(0.2–0.25)
Electrical stability(400–600) volts
Low-gravity solids(2.5–5) (%)
High-gravity solids(10–15) (%)
March funnel viscosity(65–75) (s)
Solid content(15) (%)
Mud solid control equipment efficiency0.5
Table 4. Impact of employing  C T R m .
Performance of Well-A Employing  C T R m
ItemsOutputMinimumMaximumAverageRemark
1CTRm0.490.790.64Effective hole cleaning
2ROP120280205Improved the drilling performance due to optimized efficiency of hole cleaning
Performance of Well-B Employing   C T R m
ItemsOutputMinimumMaximumAverageRemark
1CTRm0.390.490.44Improper removal of cuttings from the wellbore
2ROP105264135Decreased drilling efficiency and performance attributable to inefficient wellbore cleaning
Table 5. Impact of employing CTRm on well performance.
Performance of Well-C Employing CRTm
ItemsOutputMinimumMaximumAverageRemark
1CTRm0.480.630.57Proper removal of cuttings from the wellbore
2ROP5.025.714.3Normal drilling efficiency and performance due to proper wellbore cleaning
Performance of Well-D Employing CTRm
ItemsOutputMinimumMaximumAverageRemark
1CTRm0.580.950.45Poor removal of cuttings from the wellbore
2ROP0.55226793.4Decreased drilling efficiency and performance attributable to inefficient wellbore cleaning and stuck pipes
Disclaimer/Publisher’s Note: The statements, opinions and data contained in all publications are solely those of the individual author(s) and contributor(s) and not of MDPI and/or the editor(s). MDPI and/or the editor(s) disclaim responsibility for any injury to people or property resulting from any ideas, methods, instructions or products referred to in the content.

