Article

Extraction of Building Information Based on Multi-Source Spatiotemporal Data for Earthquake Insurance in Urban Areas

1
Institute of Geophysics, China Earthquake Administration, Beijing 100081, China
2
Key Laboratory of Urban Security and Disaster Engineering of China Ministry of Education, Beijing University of Technology, Beijing 100124, China
3
Institute of Disaster Prevention, Langfang 065201, China
*
Author to whom correspondence should be addressed.
Appl. Sci. 2023, 13(11), 6501; https://doi.org/10.3390/app13116501
Submission received: 30 April 2023 / Revised: 23 May 2023 / Accepted: 24 May 2023 / Published: 26 May 2023

Abstract

:
Establishing a database of building exposures is an important basic work in earthquake insurance research. How to efficiently, accurately, and scientifically construct the risk exposure database of buildings has become a hot topic these days. Based on multi-source data, a system for extracting seismic information from urban buildings was constructed in the Tangshan urban area, and a perfect earthquake insurance risk database was established in this study. In the extraction system, the U-net identification method, spatial overlay and kernel density estimation method, Kriging interpolation method, statistical analysis, and multi-temporal land cover data analysis were used, respectively, to extract the information of footprint areas, use function, story number, structure type, and construction age of the urban buildings. The extraction results are stratified and randomly sampled, and the confusion matrix is introduced to verify the extraction effect. The results show that the building covers an area of about 50 million square meters in the urban area of Tangshan City. With the training and validation of the U-net model, the global accuracy of the building footprint areas recognition model is 71%. By comparing the results of manually determined real data with the extraction results of this study for a sample of 660 buildings, it was found that the overall accuracy rates of the extraction results of building function, story number, structure type, and construction age were 88.62%, 86.65%, 86.49%, and 85.58%, respectively, and kappa coefficients were all over 0.8. These indicate that the information on buildings extracted by the method of this study is accurate and reliable. This study can provide data and methods for the establishment of the exposure database of earthquake insurance and provide strong data support for pre-earthquake disaster prevention, post-earthquake emergency rescue, and disaster loss assessment.

1. Introduction

The two main types of earthquake insurance are personal accident insurance and property damage insurance. However, 95% of the casualties in earthquakes are caused by building damage and collapse [1]. The construction of the building exposure database has become a crucial part of the earthquake mitigation work, and its accuracy is related to the emergency response speed of the government and society and the assessment of economic losses from disasters, which further affects the determination of catastrophe insurance rates for insurance companies. This will provide strong data support for disaster prevention before the earthquake and emergency relief and damage assessment after the earthquake [2]. Structural attributes such as the footprint, structure type, use function, story number (height), and construction age of buildings are considered to be the main building seismic information parameters that affect the degree of post-disaster damage to building structures [3,4,5,6,7,8].
There are three main methods of obtaining information about buildings: (1) Reasonable speculation based on statistical information and data. For example, Portugal, Greece, Italy, Turkey, and other European countries carry out censuses to collect building information [9]. The Italian National Institute of Statistics (ISTAT) periodically conducts a census of dwellings and provides a set of information on housing, including structural typology, date of construction (or renovation), number of floors, building position in the block, state of repair, and quality of maintenance [10,11]. Gao et al. established a county-level housing structure database using 1% provincial population sampling survey data for 2005 [12]. (2) Field survey. For example, Di Pasquale et al. and Rosti et al. investigated the damage to buildings after an earthquake in Italy and conducted a vulnerability analysis [13,14]. Based on the survey of thousands of buildings in hundreds of survey sites in 26 provinces in China, Sun et al. classified mainland China into 12 categories according to regional seismic capacity and developed vulnerability evaluation models for various types of structures in different regions [1]. The statistical information is mainly in the form of data in administrative districts. The use of data usually requires scaling and averaging, but the accuracy of the processed data is reduced, and there is a lack of spatial and temporal properties. Guéguen and Su obtained detailed data such as the construction age, construction materials, and the number of floors of buildings through visits and investigations [15,16]. Manual survey or mapping data are more accurate but limited by the scope of acquisition, acquisition cost, and other factors. It is difficult to support the construction of a large-scale building exposure database, especially for fast-developing or disaster-prone areas. (3) Extraction based on remote sensing technology, machine learning, and other new technological means. The “attribute” type building features that are crucial for vulnerability assessment, such as the distinction of building materials—e.g., masonry/reinforced concrete—or the building age, cannot be easily decided by relying on earth observation data alone, and remote sensing methods should be combined with other sources of information to allow the extraction of relevant vulnerability parameters [5]. In recent years, remote sensing technology, artificial intelligence, and other technologies are increasingly maturing, and the computing power of software and hardware continues to be enhanced. This makes it possible to extract building information on a large scale and with high efficiency [17,18]. Numerous scholars have accomplished recognition of building outline, roof, and height of buildings to meet different needs and have achieved certain results [2,19,20,21,22,23]. However, these methods are limited in extraction efficiency and result accuracy when applied to a large area by factors such as sample quantity and quality, model structure, and parameter adjustment. In addition, it is difficult to obtain key information such as structure type and use function of buildings by relying only on remote sensing data due to limitations such as data dimensionality and identification methods [24]. With the research and application of deep network data, such as AOI (Area of Interest), POI (Point of Interest), and public management information, many scholars have carried out a series of research work on housing property information because of the advantages of the fast update cycle and low comprehensive cost and have achieved better results. For example, Xu et al. established a novel method for building height calculation for an urban area based on a mask region-based convolutional neural network (Mask R-CNN) model and street view image [25]. Some scholars used POI data and adopted certain methods to achieve the quantitative identification of neighborhood functions [26,27,28]. Gu et al. used POI and AOI data to determine and classify building functions [29]. Qi et al. extracted the building footprint, number of floors, and structure type from Google Earth images using high-resolution Google Earth images, Tencent/Baidu Street View, crowdsourced data, and relevant building-related local knowledge [30].
The above methods have achieved some practical research results for specific data and problems, but they also have shortcomings. Most studies rely on a single data source and research method, focusing on the extraction of a single building parameter, which is inefficient and has a small scope of application. In addition, most studies focus more on the identification of building footprint, while the research results on the extraction of attribute information such as the story number, structure, age, and use function of buildings are limited. Building exposure databases serving disaster management and earthquake insurance cannot be built by relying only on a single parameter. In summary, the establishment of a building exposure database for housing requires the integration of multiple data, methods, and related domain knowledge. There are significant differences between urban and rural development in China, and the housing exposure database should be constructed separately according to rural and urban areas.
In this paper, based on various data and extraction methods and taking urban areas as the object of specific research, the research was conducted on the seismic information extraction of buildings in urban areas for earthquake insurance. Firstly, building footprint data were obtained based on remote sensing data using a deep-learning method. Then, multi-source data such as public data, deep network data, crowdsourcing data, and spatiotemporal data were analyzed and screened, and building function information, story number (or height), structure type, and construction age data were obtained through spatial overlay and kernel density analysis, Kriging interpolation, and other methods. Finally, the extraction effect was verified.

2. Materials and Methods

The technical route of this paper is shown in Figure 1. Firstly, we collect the data required for the study, which are mainly divided into four types: remote sensing data, land cover data, crowdsourcing data, and public management data. After pre-processing, the building information database is composed. Then, the attribute information, such as floor area, function, story number (or height), structure type, and construction age, is extracted according to different methods. Finally, the extraction accuracy and extraction effect are verified.

2.1. Building Footprint Extraction Method Based on U-Net Model

The building footprint represents the geographical location and size of the building and is a carrier of other building information, so the building footprint must be determined first. Deep-learning models can achieve good results in the field of image semantic recognition, such as building extraction. Fully convolutional network (FCN) is a common structure of artificial neural network, which mainly consists of encoder and decoder. The encoder extracts features by convolutional cloud, completes feature downsampling using pooling operation, and repeats the operation to complete the feature encoding. The decoder is to perform upsampling work on the feature encoding by interpolation and convolutional merging of the deconvolution operation, repeat the operation output, and, finally, complete the semantic segmentation work.
The U-net model architecture is a continuation of Ronneberger’s optimization based on FCN [17]. It has a symmetrical structure, with the encoder on the left and the decoder on the right, as shown in Figure 2. The main advantage of the structure is the use of jump connections to combine the shallow features extracted by downsampling in the encoder with the deeper features obtained by upsampling, which improves the accuracy of the output results. In this study, the existing image data and building outline vector data are used to make a sample data set, and the sample data are partitioned into a training set, a validation set, and a test set, obtaining the optimal model and parameters after training with the training and validation sets. Finally, the effectiveness of the model is evaluated using a test set. The specific process is as follows:
(1)
Processing sample data sets. The open-source Google Images and Tianditu Images are used as the original remote sensing images, and the footprint data of the buildings are obtained as the annotated dataset after using human-assisted correction;
(2)
Making a model training set. The targeted selection of labeled data covering multiple types of buildings is used as the training dataset. A part of the annotated dataset is also selected as the validation set. The remaining sample set is the test dataset. The division ratio of the three datasets is 5:3:2;
(3)
Model training. The model runs mainly using the U-net model platform built by GPU GTX1080Ti 8G video memory hardware and Python3.6 and ArcGIS Pro2.8 deep-learning tools. The training and validation sets are input into the model, and parameters such as learning rate, number of training samples, and number of iterations are set. As the number of training iterations increases, the training and validation conclusions of the U-net network model tend to stabilize. Finally, the parameters are solidified, and the model training is completed;
(4)
Model testing. The test set is fed into the model, the model is run, and the test sample data are recorded. After outputting the conclusion, the model prediction accuracy is evaluated using metrics such as intersection over union (IoU) and accuracy rate (Acc), as shown in Equations (1) and (2), where P denotes the prediction sample, T denotes the true sample, and count() denotes the area of the building footprint.
I o U = a r e a P T a r e a P T
A c c = a r e a ( P T ) a r e a ( T )

2.2. Spatial Overlay Analysis Method

Spatial overlay analysis refers to the overlay of multiple data layers of the same area through operations under a unified spatial coordinate system to generate multiple attribute feature data or establish new spatial correspondence. It can solve the work of information extraction, element update, multiple attribute analysis, dynamic change of spatial features, and quantity statistics. The spatial overlay analysis establishes new topological and property relationships through the process of geometric intersection finding and property determination. According to different data attributes, it can be divided into overlay analysis based on vector data and raster data. The overlay method and illustration are shown in Figure 3. The spatial expression and attribute judgment of polygon overlay are shown in Table 1. A and B are both polygons containing different attributes, and Area() is the area function.

2.3. Kernel Density Estimation Method

Kernel density estimation (KDE) is a non-parametric test method to estimate the unknown probability density function in the case of given data. Because the analysis needs to select the bandwidth, it is also called the Parzen window [31]. The idea is to define a kernel function, create a kernel function ( K ) on each data point x i , i = 1,2 , 3 , , n , and superimpose it to receive the kernel density estimation, which can be expressed as:
f ^ x = 1 n i = 1 n K ( | x x i | 2 )
where f ^ is the overall probability density function and 1 n is normalized so that the sum of probability density is 1.
In general, the kernel function K needs to follow three conditions: 1. nonnegative: K x 0 ; 2. symmetry: K x = K x ; 3. decreasing: when x > 0 , K ( x ) 0 . In the case of many data points, the estimation results are very similar when the kernel functions, such as triangular kernel, biweight kernel, triweight, normal, Epanechnikov, and Gaussian, are selected. In this study, Gaussian function is selected as the kernel function to calculate the kernel density of data points. The formula is:
K t = 1 2 π e t 2 2
Considering bandwidth h, Equation (3) can be expressed as:
f ^ x = 1 n h 2 i = 1 n K ( | x x i | 2 h )
Among them, | x x i | 2 is a 2-norm, also known as Euclidean distance, which uses a circular search for data points near x i .
Bring Equation (4) into Equation (5):
f ^ h x = 1 n h 2 i = 1 n ( 1 2 π e ( | x x i | 2 ) 2 2 h 2 )
The kernel density maps of residential, commercial, industrial, and public service buildings and the four kernel density values corresponding to each building are obtained by kernel density analysis. Set different thresholds for different target buildings and select the best classified attribute value according to the actual situation. The buildings with a kernel density value of function greater than or equal to the set threshold are defined as the corresponding function so that buildings are classified and extracted according to residential, commercial, industrial, and public service functions, and the functional classification of buildings in urban areas is realized. In case of simultaneous exceeding of non-one functional threshold, the determination of functions follows this rule: industrial is preferred over public service, public service is preferred over residential, and residential is preferred over commercial.

2.4. Kriging Interpolation Method

The story number of buildings is preferentially obtained using deep net data, but the coverage of deep net data is limited, and there are still some buildings with unknown story number. In order to obtain the story number of all buildings, it is assumed that story number of buildings follows the first law of geography. Based on the assumptions, story number of the unknown building is deduced from story number of the surrounding buildings using ordinary Kriging interpolation, with the following basic idea:
The story number of a building is denoted by s i , which is a smooth random function. Assuming that the story number of all buildings in a certain range is s 1 , s 2 , , s n , the estimate of the number of unknown story number s 0 is
s 0 = i = 1 n λ i s i
where λ i is a weighting factor indicating the degree of contribution of the story number of the ith building to the unknown layer value of the building. Solving for λ i requires that the estimate of the unknown story number of building s k is an unbiased estimate of the true value s k and is optimal, i.e., the mathematical expectation of the deviation is 0 and the variance is minimized, as expressed in Equations (8) and (9). From the unbiased constraint, it can be deduced that i = 1 n λ i = 1 .
E s 0 s 0 = 0
min V a r s 0 s 0 = m i n ( E s 0 s 0 2 )
Therefore, the estimated value of s 0 for the number of unknown story number is obtained, which is transformed into a weighting factor λ i that seeks the minimum variance of the estimated value s 0 from the true value s k , and the solution steps are as follows:
  • Calculate the semi-covariance γ i j of the distance d i j between two buildings and the story number of building, as shown in Equation (10) and Equation (11), respectively.
γ i j = s i s j 2 2
d i j = d z i , z j = d x i , y i , x j , y j = x i x j 2 + y i y j 2
where x i , y i and x j , y j are the position coordinates of the building z i and z j , respectively;
2
Fitting the relationship between the building distance d i j and the semi-covariance of the story number γ i j : γ i j = f ( d i j ) ;
3
According to the fitted model in step 2, the semi-variance of any building story number in a certain range and the unknown building story number are found;
4
Construct the Lagrangian function according to Equation (9) and i = 1 n λ i 1 = 0 .
The text continues here;
5
Let the first-order partial derivatives of F λ k , μ with respect to μ and λ be equal to zero to obtain the system of Kriging equations in Equation (12), which can also be written in the matrix form of Equation (13). Solve to obtain the optimal weight coefficients λ i ;
i = 1 n λ i = 1 i = 1 n γ i j λ i μ = λ i 0 , j = 1,2 , 3 , , n
γ 11 γ 12 γ 21 γ 22 γ 1 n γ 2 n 1 1 γ n 1 γ n 2 1 1 γ n n 1 1 0 λ 1 λ 2 λ n μ = γ 10 γ 20 γ n 0 1
6
Substitute the λ i solved in step 5 into Equation (7) to obtain the unknown building layer value.
Combined with the principle that the number of building layers is a positive integer, the results calculated by using the Kriging method are subject to rounding.

3. Overview of the Study Area and Data Sources

This section outlines the research area and source of the data. The study area is the urban area of Tangshan City, China. The data includes remote sensing data, land cover data, crowdsourcing data, and public management data.

3.1. Overview of the Study Area

The study area in this paper is the urban area of Tangshan City, which is located in the northeastern part of Hebei Province, with the Bohai Sea to the south, Beijing and Tianjin to the west, and the cities of Chengde and Qinhuangdao to the north and east, respectively. The northern and northeastern parts of Tangshan City are mountainous and belong to the eastern section of the Yanshan Mountains, while the central part is a plain, and the southern and western parts are coastal saline lands with low elevation. The North China Seismic Zone, to which Tangshan City belongs, has been at the late stage of the seismically active period since 1815 and is still affected by the aftershocks of the 1976 Great Tangshan Earthquake. Based on the land use coverage data, the urban area of Tangshan City is defined as the research area by using the entity regional analysis method, as shown in Figure 4a. The research area is divided into blocks according to the actual road network in Figure 4b.

3.2. Data Sources

The data used in this study mainly includes four types: remote sensing data, land cover data, crowdsourcing data, and public management data. The first three are basic data with geospatial attributes, and the fourth category is text data for use in result validation. The main data and data sources are shown in Table 2.

4. Results and Analysis

This section presents the extraction results based on models and methods defined in Section 2, including footprint, function, story number, structure type, and construction age of the buildings. The results are validation by means of field investigation and street view photo.

4.1. Extraction Results of Building Information

4.1.1. Extraction Results of Building Footprint

In the urban area, remote sensing image data and AOI data are used as sample datasets, and training datasets, validation datasets, and test datasets are formed. AOI data covering various building types were selected and combined with the image data to make the labeled dataset, and the labeled dataset is about 500 pairs; an example of the labeled dataset is shown in Figure 5.
As the number of training iterations increases, the training and verification conclusions of the U-net model tend to be stable, and the model can converge and be generalized. The changes in accuracy with the number of iterations during the U-net model training are shown in Figure 6. The accuracy of the model gradually increases after 100 iterations of training and finally stabilizes at about 74% in the training set. As the number of iterations increases, the accuracy of the validation set also rises steadily and stabilizes at about 71%. Therefore, the accuracy of the model is determined to be about 71%, which proves that the model recognition effect is good. The effect of the selected model in the verification set is shown in Figure 7.
Analyzing the results from a qualitative perspective: the accuracy of the results of the U-net model is reasonable, as shown in Figure 7a. Most of the buildings labeled in the original dataset are identified as independent elements, but there are some inaccurate pixel identification phenomena, which is due to the low clarity of the original data. Some of the prediction results are relatively clear and complete, but there are more fuzzy adhesions between buildings, as shown in Figure 7b, because of the low resolution of remote sensing images, and the buildings are low buildings with small spacing between buildings. These problems have a negligible impact on the earthquake insurance categorization study. According to the above analysis, it can be seen that the model has the ability to extract the building footprint, and the extraction results perform well. The final data of the building footprint in the central city of Tangshan City and some examples were obtained through the model identification, as shown in Figure 8. A total of 170,000 buildings were identified, covering an area of 54 million square meters.

4.1.2. Extraction Results of Building Function

In earthquake insurance, buildings are classified into four types of use: residential, industrial, commercial, and public services. The AOI and POI were reclassified into four building functions [26], and the results are shown in Figure 9. AOI data was used as a priority. The spatial overlay of the AOI surface and the building footprint was used to obtain some building functions, and the recognition rate was about 81%. Then, POI data was used as a supplement to identify the functions of buildings through spatial overlay such as polygons and kernel density analysis. The kernel density surface of POI points was obtained, as shown in Figure 10. The building functions were assigned according to the kernel density thresholds. The kernel density thresholds for residential buildings, commercial buildings and public buildings are 1,000,000, 8,000,000, and 2,000,000, respectively. It should be noted that industrial buildings are generally in the form of industrial zones, and their building functions are mainly determined by the AOI. Finally, the use function distribution of buildings in urban areas of Tangshan City is shown in Figure 11. From the figure, it can be seen that commercial buildings are mainly distributed on both sides of the street or at corner intersections in a point or strip distribution, which is in line with the accessibility, convenience, and visibility of urban commercial facilities. Residential buildings are clustered and distributed, which is consistent with the characteristics of residential space. Public service buildings are scattered in a dotted pattern, in line with the public nature and openness of public buildings. Industrial buildings are mainly distributed at the boundary of the urban area, far away from civil buildings, which helps to protect the urban ecological environment and reduce pollution to residential areas. Additionally, industrial areas gather with each other to meet their collaboration and transportation needs. From the results of the distribution of building functions, the buildings in the urban area are generally distributed in a mixed state, and each functional building is intricately connected with each other.

4.1.3. Extraction Results of the Story Number

In this study, the story numbers of buildings are classified into five categories: 1–3 (low-rise building), 4–6 (multi-rise building), 7–9 (mid-rise building), 10–33 (high-rise building), and more than 33 (super high-rise building) according to the building codes in China and some scholars’ research [32,33,34]. It should be noted that industrial buildings are divided into single-story industrial buildings and multi-story industrial buildings in this study. For the extraction of the story number of buildings in the urban area of Tangshan City, two main steps were performed: (1) spatial matching of the story number information of the deep network data with the building footprint to obtain the story number information of buildings; (2) for other buildings with unknown story number, the relationship between the building distance d i j and the story semi-variance γ i j is established as follows:
γ i j = 11.03 + 24.46 × ( 1 e d i j 675.55 )
The information on the story number of the building is extracted using Kriging interpolation. An example is shown in Figure 12. According to the deep network data, the distribution of story numbers in the urban area of Tangshan City was obtained by using the Kriging interpolation method, as shown in Figure 13. As seen from the figure, there are more high-rise buildings in the west and south of the urban area and more low-rise buildings in the east and north. The low-rise buildings are mainly distributed in the old urban area and the urban–rural area. Combining the satellite map and Baidu 3D street view map, it is clear that most of these buildings are old residential buildings that have not been renovated. Multi-rise buildings are common in the central old city. With the expansion of urban areas, buildings gradually develop into the air to save the land and improve land utilization, and mid-rise and high-rise buildings gradually become more numerous. The number of building stories in the urban–rural area (the edge of the urban area) gradually decreases. These characteristics reflect the development of urban areas from the center to the edge of the suburbs.

4.1.4. Extraction Results of Construction Age

According to the years when the Chinese building codes were developed and implemented, the construction age of buildings in the urban areas of Tangshan City was divided into before 1990, 1991–2000, 2001–2010, and after 2011. The extraction of the building construction age in the Tangshan urban area mainly uses the multi-temporal surface coverage data of the urban area in 1980, 1990, 2000, 2010, and 2018. Spatial overlay analysis was used to carry out the replacement of the old and new urban built-up areas in temporal order. The building coverage of the urban area in multiple time periods was obtained,, as shown in Figure 14. Finally, the range of the construction age of the buildings is determined. On this basis, supplemented by Internet data, the construction age of buildings was modified and improved. Finally, the age distribution map of urban buildings was obtained in Tangshan, as shown in Figure 15.

4.1.5. Extraction Results of Building Structure Type

The structural types of buildings are divided into masonry structures, brick and concrete structures, reinforcement concrete structures, and others according to the seismic performance of buildings. The structure types of industrial buildings are divided into single-story industrial buildings and multi-story industrial buildings according to the story number. Su found that the seven-story brick and concrete structures in Tangshan City had completely disappeared in 2015, and in residential and office buildings, single-story buildings can be considered brick and masonry structures, 2–6-story buildings can be considered brick and concrete structures, and 7-story and above buildings are reinforced concrete structures; in residential buildings in rural areas of Tangshan, 66% are brick and masonry structures, 17% are reinforced concrete structures, and 17% are brick and masonry structures, and the public building structure is better than that of residential buildings [16]. The relationship between the building function and story number was analyzed based on the statistics of the deep network data. Figure 16 shows the percentage of reinforcement concrete and masonry structures of buildings in urban areas of Tangshan with different construction ages and building story numbers. Since the percentage of other structures is relatively small, it is not presented here. From the figure, it can be seen that buildings of 1–3 stories before 2001 are mainly masonry structures, while buildings of 1–3 stories after 2000 are mostly reinforcement concrete structures. The buildings of 4–6 stories after 2010 are mostly reinforced concrete structures, while the structure types of buildings before 2011 are brick and concrete structures. As a result, relationships were established among the story number, construction age, structure type, and function of buildings in the urban areas of Tangshan City, as shown in Table 3. The distribution of building structure types is derived from the correspondence, as shown in Figure 17, from which it can be seen that brick and steel structures account for more, which is consistent with the results of Su’s study.

4.2. Validation Analysis

The accuracy of building information extraction directly affects the determination of the earthquake catastrophe rate. In this study, stratified random sampling was used to validate the results of information extraction on building functions, story number, construction age, and structure type of buildings in the urban areas of Tangshan City. Firstly, according to the plot ratio of buildings in the block, the block is divided into five categories by using the natural breakpoint classification method in the urban areas of Tangshan City. Excluding the largest area and the smallest building area, 43 blocks were randomly selected from the remaining four categories. The location distribution of these 43 blocks is shown in Figure 18. Then, about 660 buildings were extracted from these blocks and used as sample buildings. The attribute information of each sample building, such as building function, story number, construction age, and structure type, was obtained as real data by manual determination using field research and street view photo assistance. The attribute information of the buildings obtained through this study is used as validation data. Finally, the real data and the validation data are compared, and the accuracy rate of the validation data is judged according to the confusion matrix, so as to verify the feasibility of the method of this study.
Table 4, Table 5, Table 6 and Table 7 show the confusion matrices for function, story number, construction age, and structure type, respectively. The element a i , j in row i and column j of the table indicates the number of buildings manually judged as attribute j in the sampling survey and identified as attribute type i in this study. The element a i , i in row i and column i is the number of buildings whose manually determined attributes in the sample survey and the attributes extracted in this study are the same. The accuracy rate in the table is the ratio of a i , i to j a i , j , where j a i , j is the total number of manually determined attributes of category i . According to the results of the confusion matrix, the overall accuracy rates of building function, story number, structure type, and construction age are 88.62%, 86.65%, 86.49%, and 85.58%, respectively, and the accuracy of classification is measured by kappa coefficient. The values are all more than 0.8, which proves that the results of building information extraction are highly consistent and reliable.

5. Conclusions

Building exposure data is the basis for structural vulnerability calculations, rate determination of earthquake insurance, and earthquake loss estimation. However, establishing a complete database of building information with high accuracy and rich semantics is a huge challenge worldwide. This study takes an urban area as a research object; integrates multi-source spatial data such as remote sensing data, land cover data, crowdsourcing data, and public management data; and combines various methods to realize the extraction of information of buildings in urban areas. To a certain extent, it makes up for the lack of research on comprehensive building exposure data, and also can provide the necessary reference base for improving the earthquake insurance risk exposure database, as well as for the structural vulnerability module and loss module in earthquake insurance. In this paper, we take the urban area of Tangshan City as an example; obtain the information of building footprint, function, story number, structure type, and construction age by different methods; and verify the extraction results. With the training and validation of the U-net model, the global accuracy of the building footprint extraction model is 71%. By comparing the results of manually determined real data with the extraction results of this study for a sample of 660 buildings, it was found that the overall accuracy of building function, story number, structure type, and age extraction are 88.62%, 86.65%, 86.49%, and 85.58%, respectively, and the accuracy of the classification was measured by using kappa coefficient, whose values all exceed 0.8. These indicate that the results of extracting information about buildings using the method of this study can be trusted. The results of the study mainly reveal that the extraction of multiple attribute information of buildings in urban areas can be achieved by the U-net identification method, spatial overlay and kernel density estimation method, Kriging interpolation method, statistical analysis, and multi-temporal ground cover data analysis. In the future, this research method system can be used to provide some technical support to realize the establishment of an earthquake insurance exposure database, which can effectively obtain the building attribute information on a large scale.
However, there are many problems in the research method of this paper:
  • The extraction results of the building footprint are not fine enough. Due to the difference of the buildings’ own attributes, surface occlusion, and insufficient number of samples, the extraction of remote sensing image information is not precise enough, and the extraction of building footprint still has fuzzy adhesion and an irregular out-line;
  • In identifying the single building attributes, today, more and more combined buildings appear, including structural combination and functional combination, but this study still considers a single attribute;
  • The total amount of data is limited, and the extraction results have limitations. Due to the excessive data volume requirements for building functions and building story number, the limited data may lead to large deviations in the results.
Therefore, in the subsequent study, the original data will be improved, and the model will be optimized to continue to provide support for the earthquake insurance study to establish a more perfect building risk exposure database.

Author Contributions

Conceptualization, P.Z. and X.L.; methodology, P.Z., Q.H. and X.L.; validation, P.Z.; formal analysis, P.Z.; investigation, P.Z.; writing—original draft preparation, P.Z.; writing—review and editing, P.Z., Q.H. and X.L.; visualization, P.Z. All authors have read and agreed to the published version of the manuscript.

Funding

This research was funded by the National Natural Science Foundation of China (52192675, U1839202) and the 111 Project (D21001).

Institutional Review Board Statement

Not applicable.

Informed Consent Statement

Not applicable.

Data Availability Statement

Not applicable.

Conflicts of Interest

The authors declare no conflict of interest.

References

  1. Sun, B.; Zhang, G. Study on seismic disaster risk distribution of buildings in mainland China. China Civ. Eng. J. 2017, 50, 1–7. [Google Scholar] [CrossRef]
  2. Chen, L.; Shen, X.; Wang, H.; Hong, S.; Jing, F. Application of highresolution remote sensing technique to earthquake studies in China. Acta Seismol. Sin. 2016, 38, 333–344+508. [Google Scholar] [CrossRef]
  3. GIROJ (General Insurance Rating Organization of Japan). Earthquake Insurance in Japan, 4th ed.; GIROJ: Tokyo, Japan, 2022; Available online: https://www.giroj.or.jp/english/pdf/Earthquake.pdf (accessed on 3 July 2022).
  4. Wang, D.; Ou, J. Earthquake premium and premium rate pricing based on probabilistic model of earthquake loss estimation. Earthq. Eng. Eng. Dyn. 2014, 34, 66–74. [Google Scholar] [CrossRef]
  5. Polese, M.; Marcolini, M.; Zuccaro, G.; Cacace, F. Mechanism based assessment of damage-dependent fragility curves for RC building classes. Bull. Earthq. Eng. 2015, 13, 1323–1345. [Google Scholar] [CrossRef]
  6. Cheng, Q.; Xu, Z.; Lu, X.; Zeng, X.; Wan, H.; Zhang, X. Building seismic damage prediction of Tangshan City based on the nonlinear time-history analysis of urban buildings. J. Nat. Disasters 2018, 27, 71–80. [Google Scholar]
  7. Indirli, M. Organization of a Geographic Information System (GIS) Database on Natural Hazards and Structural Vulnerability for the Historic Center of San Giuliano Di Puglia (Italy) and the City of Valparaiso (Chile). Int. J. Archit. Herit. 2009, 3, 276–315. [Google Scholar] [CrossRef]
  8. Latcharote, P.; Hansapinyo, C.; Limkatanyu, S. Seismic Building Damage Prediction From GIS-Based Building Data Using Artificial Intelligence System. Front. Built Environ. 2020, 6, 576919. [Google Scholar] [CrossRef]
  9. Cacace, F.; Zuccaro, G.; De Gregorio, D.; Perelli, F.L. Building Inventory at National Scale by Evaluation of Seismic Vulnerability Classes Distribution Based on Census Data Analysis: BINC Procedure. Int. J. Disaster Risk Reduct. 2018, 28, 384–393. [Google Scholar] [CrossRef]
  10. Ruggieri, S.; Calò, M.; Cardellicchio, A.; Uva, G. Analytical-Mechanical Based Framework for Seismic Overall Fragility Analysis of Existing RC Buildings in Town Compartments. Bull. Earthq. Eng. 2022, 20, 8179–8216. [Google Scholar] [CrossRef]
  11. Leggieri, V.; Mastrodonato, G.; Uva, G. GIS Multisource Data for the Seismic Vulnerability Assessment of Buildings at the Urban Scale. Buildings 2022, 12, 523. [Google Scholar] [CrossRef]
  12. Gao, X.L.; Jing, F.J.; Ji, J. Establishment of a county-level housing structure database in China. Geogr. Res. 2011, 30, 2127–2138. [Google Scholar]
  13. Pasquale, G.D.; Orsini, G.; Romeo, R.W. New Developments in Seismic Risk Assessment in Italy. Bull. Earthq. Eng. 2005, 3, 101–128. [Google Scholar] [CrossRef]
  14. Rosti, A.; Del Gaudio, C.; Rota, M.; Ricci, P.; Di Ludovico, M.; Penna, A.; Verderame, G.M. Empirical Fragility Curves for Italian Residential RC Buildings. Bull. Earthq. Eng. 2021, 19, 3165–3183. [Google Scholar] [CrossRef]
  15. Guéguen, P.; Michel, C.; LeCorre, L. A Simplified Approach for Vulnerability Assessment in Moderate-to-Low Seismic Hazard Regions: Application to Grenoble (France). Bull. Earthq. Eng. 2007, 5, 467–490. [Google Scholar] [CrossRef]
  16. Su, G.; Qi, W.; Zhang, S.; Sim, T.; Liu, X.; Sun, R.; Sun, L.; Jin, Y. An Integrated Method Combining Remote Sensing Data and Local Knowledge for the Large-Scale Estimation of Seismic Loss Risks to Buildings in the Context of Rapid Socioeconomic Growth: A Case Study in Tangshan, China. Remote Sens. 2015, 7, 2543–2601. [Google Scholar] [CrossRef]
  17. Wieland, M.; Pittore, M.; Parolai, S.; Zschau, J. Exposure Estimation from Multi-Resolution Optical Satellite Imagery for Seismic Risk Assessment. ISPRS Int. J. Geo-Inf. 2012, 1, 69–88. [Google Scholar] [CrossRef]
  18. Wang, J.; Qin, Q.; Ye, X.; Wang, J.; Qin, X. A Survey of Building Extraction Methods from Optical High Resolution Remote Sensing Imagery. Remote Sens. Technol. Appl. 2016, 31, 653–662. [Google Scholar]
  19. Fujimoto, K.; Miura, H.; Midorikawa, S. Automated Building Detection from High-Resolution Satellite Image for Updating Gis Building Inventory Data. In Proceedings of the 13th World Conference on Earthquake Engineering, Vancouver, BC, Canada, 1–6 August 2004. [Google Scholar]
  20. Kim, T.; Lee, T.Y.; Lim, Y.J.; Kim, K.O. The use of voting strategy for building extraction from high resolution satellite images. In Proceedings of the IEEE International Geoscience and Remote Sensing Symposium, Seoul, Republic of Korea, 29 July 2005; pp. 1269–1272. [Google Scholar] [CrossRef]
  21. Maruyama, Y.; Tashiro, A.; Yamazaki, F. Use of Digital Surface Model Constructed from Digital Aerial Images to Detect Collapsed Buildings during Earthquake. Procedia Eng. 2011, 14, 552–558. [Google Scholar] [CrossRef]
  22. Huang, X.; Zhang, L. Morphological Building/Shadow Index for Building Extraction from High-Resolution Imagery Over Urban Areas. IEEE J. Sel. Top. Appl. Earth Obs. Remote Sens. 2012, 5, 161–172. [Google Scholar] [CrossRef]
  23. Teimouri, M.; Mokhtarzade, M.; Valadan Zoej, M.J. Optimal fusion of optical and SAR high-resolution images for semiautomatic building detection. GIScience Remote Sens. 2016, 53, 45–62. [Google Scholar] [CrossRef]
  24. Xiao, X. Building Seismic Damage Information Extraction Based on Full Polarization SAR. Master’s Thesis, China Earthquake Administration Lanzhou Institute of Seismology, Lanzhou, China, 2020. [Google Scholar] [CrossRef]
  25. Xu, Z.; Zhang, F.; Wu, Y.; Yang, Y.J.; Wu, Y. Building height calculation for an urban area based on street view images and deep learning. Comput.-Aided Civ. Infrastruct. Eng. 2022, 38, 892–906. [Google Scholar] [CrossRef]
  26. Qu, C.; Ren, Y.H.; Liu, Y.L.; Li, Y. Functional classification of urban buildings in high resolution remote sensing images through POI-as-sisted analysis. J. Geo Inf. Sci. 2017, 19, 831–837. [Google Scholar] [CrossRef]
  27. Cao, Y.H.; Liu, J.; Wang, Y.; Wang, L.; Wu, W.; Sun, F. A study on the method for functional classification of urban buildings by using POI data. J. Geo Inf. Sci. 2020, 22, 1339–1348. [Google Scholar] [CrossRef]
  28. Tang, L.; Xu, H.; Ding, Y. Comprehensive vitality evaluation of urban blocks based on multi- source geographic big data. J. Geo Inf. Sci. 2022, 24, 1575–1588. [Google Scholar] [CrossRef]
  29. Gu, Y.; Jiao, L.; Dong, T.; Wang, Y.; Xu, G. Spatial Distribution and Interaction Analysis of Urban Functional Areas Based on Multi-source Data. Geomat. Inf. Sci. Wuhan Univ. 2018, 43, 1113–1121. [Google Scholar] [CrossRef]
  30. Qi, W.; Su, G.W.; Sun, L.; Yang, F.; Wu, Y. “Internet+” approach to mapping exposure and seismic vulnerability of buildings in a context of rapid socioeconomic growth: A case study in Tangshan, China. Nat. Hazards 2017, 86, 107–139. [Google Scholar] [CrossRef]
  31. Sheather, S.J.; Jones, M.C. A Reliable Data-Based Bandwidth Selection Method for Kernel Density Estimation. J. R. Stat. Soc. Ser. B (Methodol.) 1991, 53, 683–690. [Google Scholar] [CrossRef]
  32. Uma, S.R.; Ryu, H.; Luco, N.; Liel, A.B.; Raghunandan, M. Comparison of Main-Shock and Aftershock Fragility Curves Developed for New Zealand and US Buildings. In Proceedings of the Ninth Pacific Conference on Earthquake Engineering: Building an Earthquake-Resilient Society, Auckland, New Zealand, 14–16 April 2011. [Google Scholar]
  33. Asteris, P.G.; Chronopoulos, M.P.; Chrysostomou, C.Z.; Varum, H.; Plevris, V.; Kyriakides, N.; Silva, V. Seismic Vulnerability Assessment of Historical Masonry Structural Systems. Eng. Struct. 2014, 62–63, 118–134. [Google Scholar] [CrossRef]
  34. Akkar, S.; Sucuoglu, H.; Eeri, M.; Yakut, A. Displacement-Based Fragility Functions for Low and Mid-Rise Ordinary Concrete Buildings. Earthq. Spectra 2005, 21, 901–927. [Google Scholar] [CrossRef]
Figure 1. Technical route of this study.
Applsci 13 06501 g001
Figure 2. U-net network structure.
Applsci 13 06501 g002
Figure 3. Spatial overlay analysis method and examples.
Applsci 13 06501 g003
Figure 4. Research area and block network. (a) Research area-Tangshan urban area; (b) block network.
Applsci 13 06501 g004
Figure 5. The example of raw and labeled data. (a) Raw data; (b) labeled data.
Applsci 13 06501 g005
Figure 6. Change curve of accuracy rate during training of U-net model.
Applsci 13 06501 g006
Figure 7. Building footprint areas recognition effect. (a) Validation set A; (b) Validation set B.
Applsci 13 06501 g007
Figure 8. The distribution of buildings in Tangshan urban area.
Applsci 13 06501 g008
Figure 9. POI data and AOI data display.
Applsci 13 06501 g009
Figure 10. Example of the kernel density and building function results. (a) Kernel density of public service buildings; (b) kernel density of commercial buildings; (c) kernel density of residential buildings; (d) example of extraction results of building functions.
Applsci 13 06501 g010
Figure 11. Distribution map of building function in Tangshan urban area.
Applsci 13 06501 g011
Figure 12. Example of Kriging interpolation and extraction result for the story number of buildings.
Applsci 13 06501 g012
Figure 13. Distribution map of building story numbers in Tangshan urban area.
Applsci 13 06501 g013
Figure 14. Multi-temporal construction land display in Tangshan urban area.
Applsci 13 06501 g014
Figure 15. Distribution map construction age of buildings in Tangshan urban area.
Applsci 13 06501 g015
Figure 16. The proportion of various structures with different construction ages and story numbers of buildings in the urban area of Tangshan City. (a) The proportion of reinforced concrete structures with different construction ages and story numbers of buildings in the urban area of Tangshan City. (b) The proportion of masonry structures with different construction ages and story numbers of buildings in the urban area of Tangshan City. (c) The proportion of brick and concrete structures with different construction ages and story numbers of buildings in the urban area of Tangshan City.
Applsci 13 06501 g016
Figure 17. Distribution map of structure type of buildings in Tangshan urban area.
Applsci 13 06501 g017
Figure 18. Sampling range of buildings in Tangshan urban area.
Applsci 13 06501 g018
Table 1. Polygon relation space expression and attribute judgment.
Shape RelationshipIllustrationsFormula ExpressionProperty Judgment
Inclusion relationshipApplsci 13 06501 i001 A r e a ( A B ) A r e a ( B ) = 1 A r e a ( A B ) A r e a ( B ) = 1
Intersection relationshipApplsci 13 06501 i002 0 < A r e a A B A r e a B < 0.5 
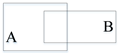
B may have the properties of A. Other data and methods are needed to assist in the determination.
Applsci 13 06501 i003 0.5 A r e a A B A r e a B < 1 A has the properties of B.
Separation relationshipApplsci 13 06501 i004 A r e a ( A B ) A r e a ( B ) = 0 Judgment with the help of other data and methods.
Table 2. Data source for this article.
DataSource and YearDescription
Medium- and high-resolution remote sensing data(https://www.tianditu.gov.cn/) (2020)Load online images for building information inspection and verification.
High-resolution remote sensing data(https://earthengine.google.com/) (2019)Acquisition of 0.45 m resolution remote sensing images for building footprint identification.
GlobeLand30 land cover data(http://www.globeland30.org/) (2020)30 m resolution for calibrating land cover data accuracy.
Global land cover product with fine classification system at 30 m(http://www.aircas.ac.cn/) (1990–2020)30 m resolution multi-temporal data for building age analysis.
Street view(https://map.baidu.com/) (2020–2022)Various types of street photos to assist in manual judgment of building information.
Deep web data(https://lbs.amap.com/) (2020–2022)
(https://lbsyun.baidu.com/) (2020–2022)
(https://cloud.tencent.com/) (2020–2022)
(https://lianjia.com/) (2020–2022)
(https://ts.fang.com/) (2020–2022)
(https://anjuke.com/) (2020–2022)
Multi-source AOI and POI data are pre-processed and applied to building seismic information extraction.
All kinds of statistical yearbooks and survey bulletins(http://www.tangshan.gov.cn/) (2020)Data from city statistical yearbooks and other related documents are applied to building information feature inspection.
National standards, industry standards(https://openstd.samr.gov.cn/bzgk/gb/)The criteria are applied to the judgment of building information.
Basic geographic information data(https://www.webmap.cn/) (2021)Includes data such as roads, railways, water systems, and lakes at all levels for delineating urban areas.
Table 3. The corresponding relationship between the structure type, construction age, function, and story number of buildings in the urban areas of Tangshan City.
Building FunctionStory NumberConstruction AgeStructure Type
Residential buildings
Commercial buildings
1–3Before 2001
After 2000
Masonry structure
Reinforcement concrete structure
4–6Before 2011
After 2010
Brick and concrete structure
Reinforcement concrete structure
7–9/Reinforcement concrete structure
10–33/Reinforcement concrete structure
≥34 floors/Reinforcement concrete structure
Industrial buildings1/Single-story industrial buildings
≥2/Multi-story industrial buildings
Table 4. Confusion matrix table of building function.
Building FunctionNumber of Real DataTotalAccuracy Rate
(%)
Industrial BuildingsPublic Service BuildingsCommercial BuildingsResidential Buildings
Number of validation dataIndustrial building730598783.91
Public service buildings07491810173.27
Commercial buildings40891310683.96
Residential buildings001734836595.34
Total7774120388659
Accuracy rate (%)94.81100.0074.1789.69
Overall accuracy (%)88.62
Kappa coefficient0.814
Table 5. Confusion matrix of the story number of the buildings.
Story NumberNumber of Real DataTotalAccuracy Rate (%)
Industry Single-StoryIndustry Multi-StoryLow-StoryMiddle-StoryMid–High-StoryHigh-StorySuper-High Story
Number of validation dataIndustry single-story422002004493.75
Industry multi-story115000001684.96
Low-story7196700011395.45
Middle-story008279122030192.69
Mid–high-story0009741409776.29
High-story00012116308673.26
Super-high story00000022100.00
Total501810430799792659
Accuracy rate (%)84.0083.3392.3190.8874.7579.75100.00
Overall accuracy (%)86.65
Kappa coefficient0.813
Table 6. Confusion matrix of construction age of the buildings.
Construction AgeNumber of Real DataTotalAccuracy Rate
(%)
Before 1990 1991–20002001–2010After 2011
Number of validation dataBefore 1990 811008298.78
1991–20003151 23117884.83
2001–2010071713621479.91
After 2011012316118587.03
Total84160217198659
Accuracy rate (%)96.4394.3878.8081.31
Overall accuracy (%)85.58
Kappa coefficient0.802
Table 7. Confusion matrix of structure type of the buildings.
Structure TypeNumber of Real DataTotalAccuracy Rate (%)
Industry Single-StoryIndustry Multi-StoryMasonry StructureBrick and Concrete StructureReinforcement Concrete StructureOther
Number of validation dataIndustry single-story42200004495.45
Industry multi-story11500001693.75
Masonry structure50587207280.56
Brick and concrete structure00922435026883.58
Reinforcement concrete structure00119212123390.99
Other21013192673.08
Total50186825125220659
Accuracy rate (%)84.0083.3385.2989.2484.1395.00
Overall accuracy (%)86.49
Kappa coefficient0.805
Disclaimer/Publisher’s Note: The statements, opinions and data contained in all publications are solely those of the individual author(s) and contributor(s) and not of MDPI and/or the editor(s). MDPI and/or the editor(s) disclaim responsibility for any injury to people or property resulting from any ideas, methods, instructions or products referred to in the content.

