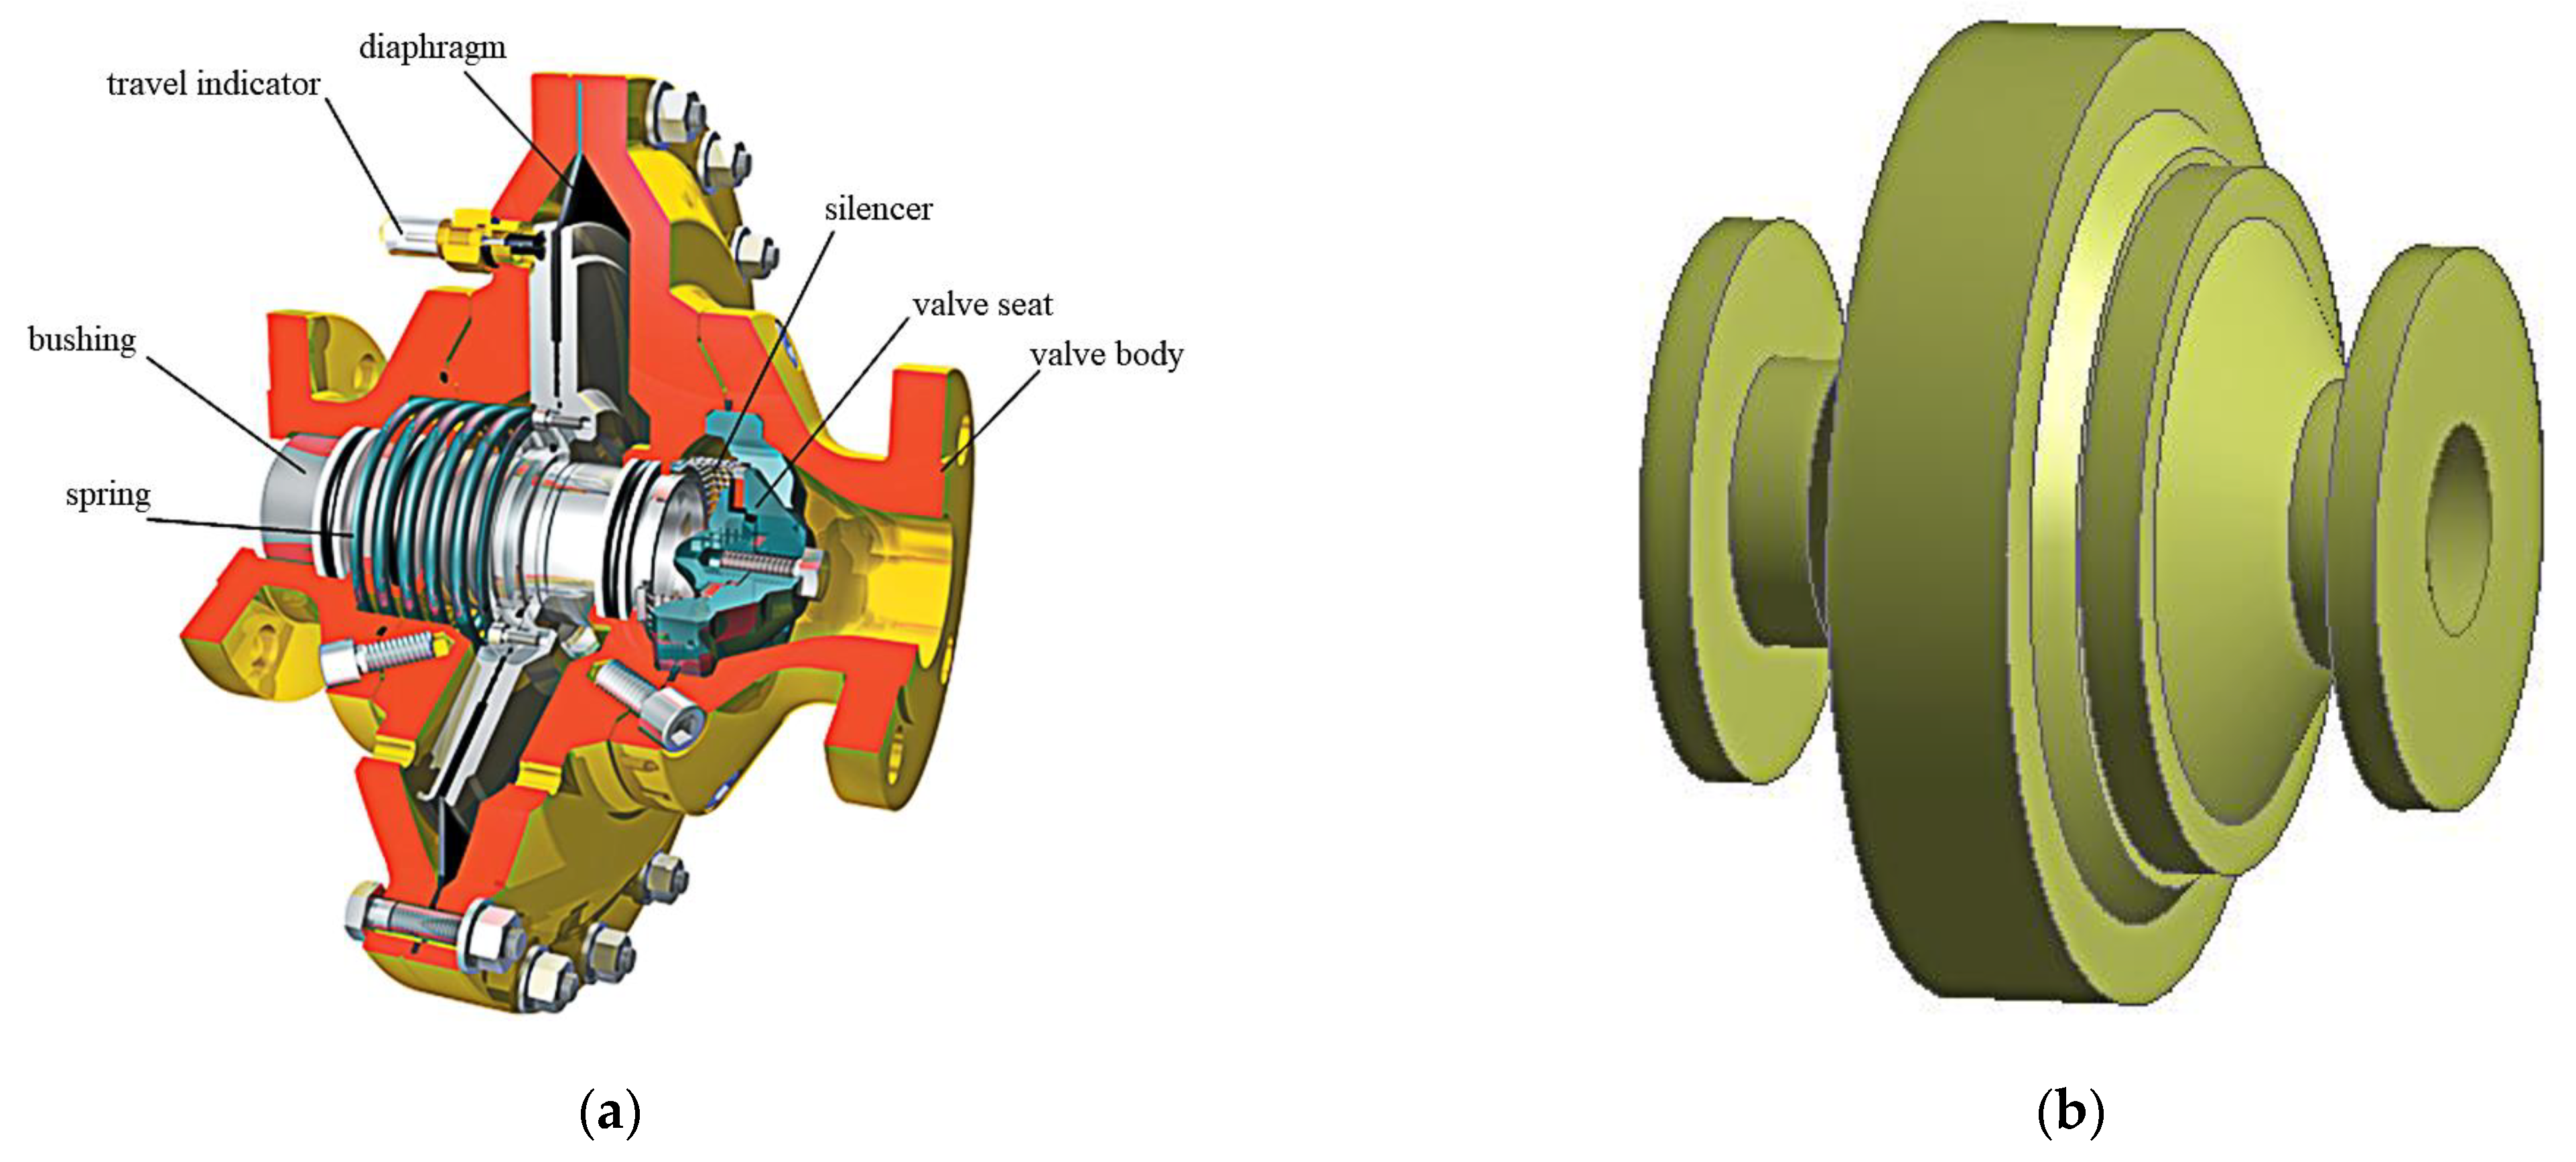
Based on the experimental data obtained from the response surface method, the influence of parameters such as sleeve wall thickness, valve orifice diameter, and outlet seat wall thickness on the displacement and equivalent stress of the gas pressure regulator is also considered. The sleeve wall thickness, valve bore diameter, and outlet valve seat wall thickness are selected as the optimization parameters. The equivalent effect stress is chosen as the optimization objective function to optimize the design of the regulator structure.
Table 2 shows the relevant design requirements of the gas pressure regulator [
14] and the formal variables and solution range of relevant parameters.
6.2. Analysis of Optimization Results
The coefficients of the response surface model are shown in
Table 4 and indicate a 95% confidence interval for each parameter. This interval can be used to determine the significance of each parameter. If the upper and lower bounds of the interval do not contain 0, then the term is significant. If it contains 0, the term is insignificant, and the corresponding parameter should be excluded. Whether the exclusion is determined will be further judged according to the analysis of variance (ANOVA).
After obtaining the relationship between input variables, response values, and variables, the significance test of the regression using ANOVA is conducted to determine the significance of each item (
Table 5). The value of F indicates the significance of the whole fitted equation, and the larger the F, the more significant the equation and the better it fits. However, to determine the significance of the variables, the value of
p must be analyzed. The
p of the regression model measures the magnitude of the difference between the control and experimental groups. If
p is less than 0.0001, it indicates that the choice of the quadratic polynomial for the response surface model is very reasonable and that the relationship between the regression equation and the equivalent stresses is significant. It also indicates that the presence of variables has a positive effect on the significance of the model.
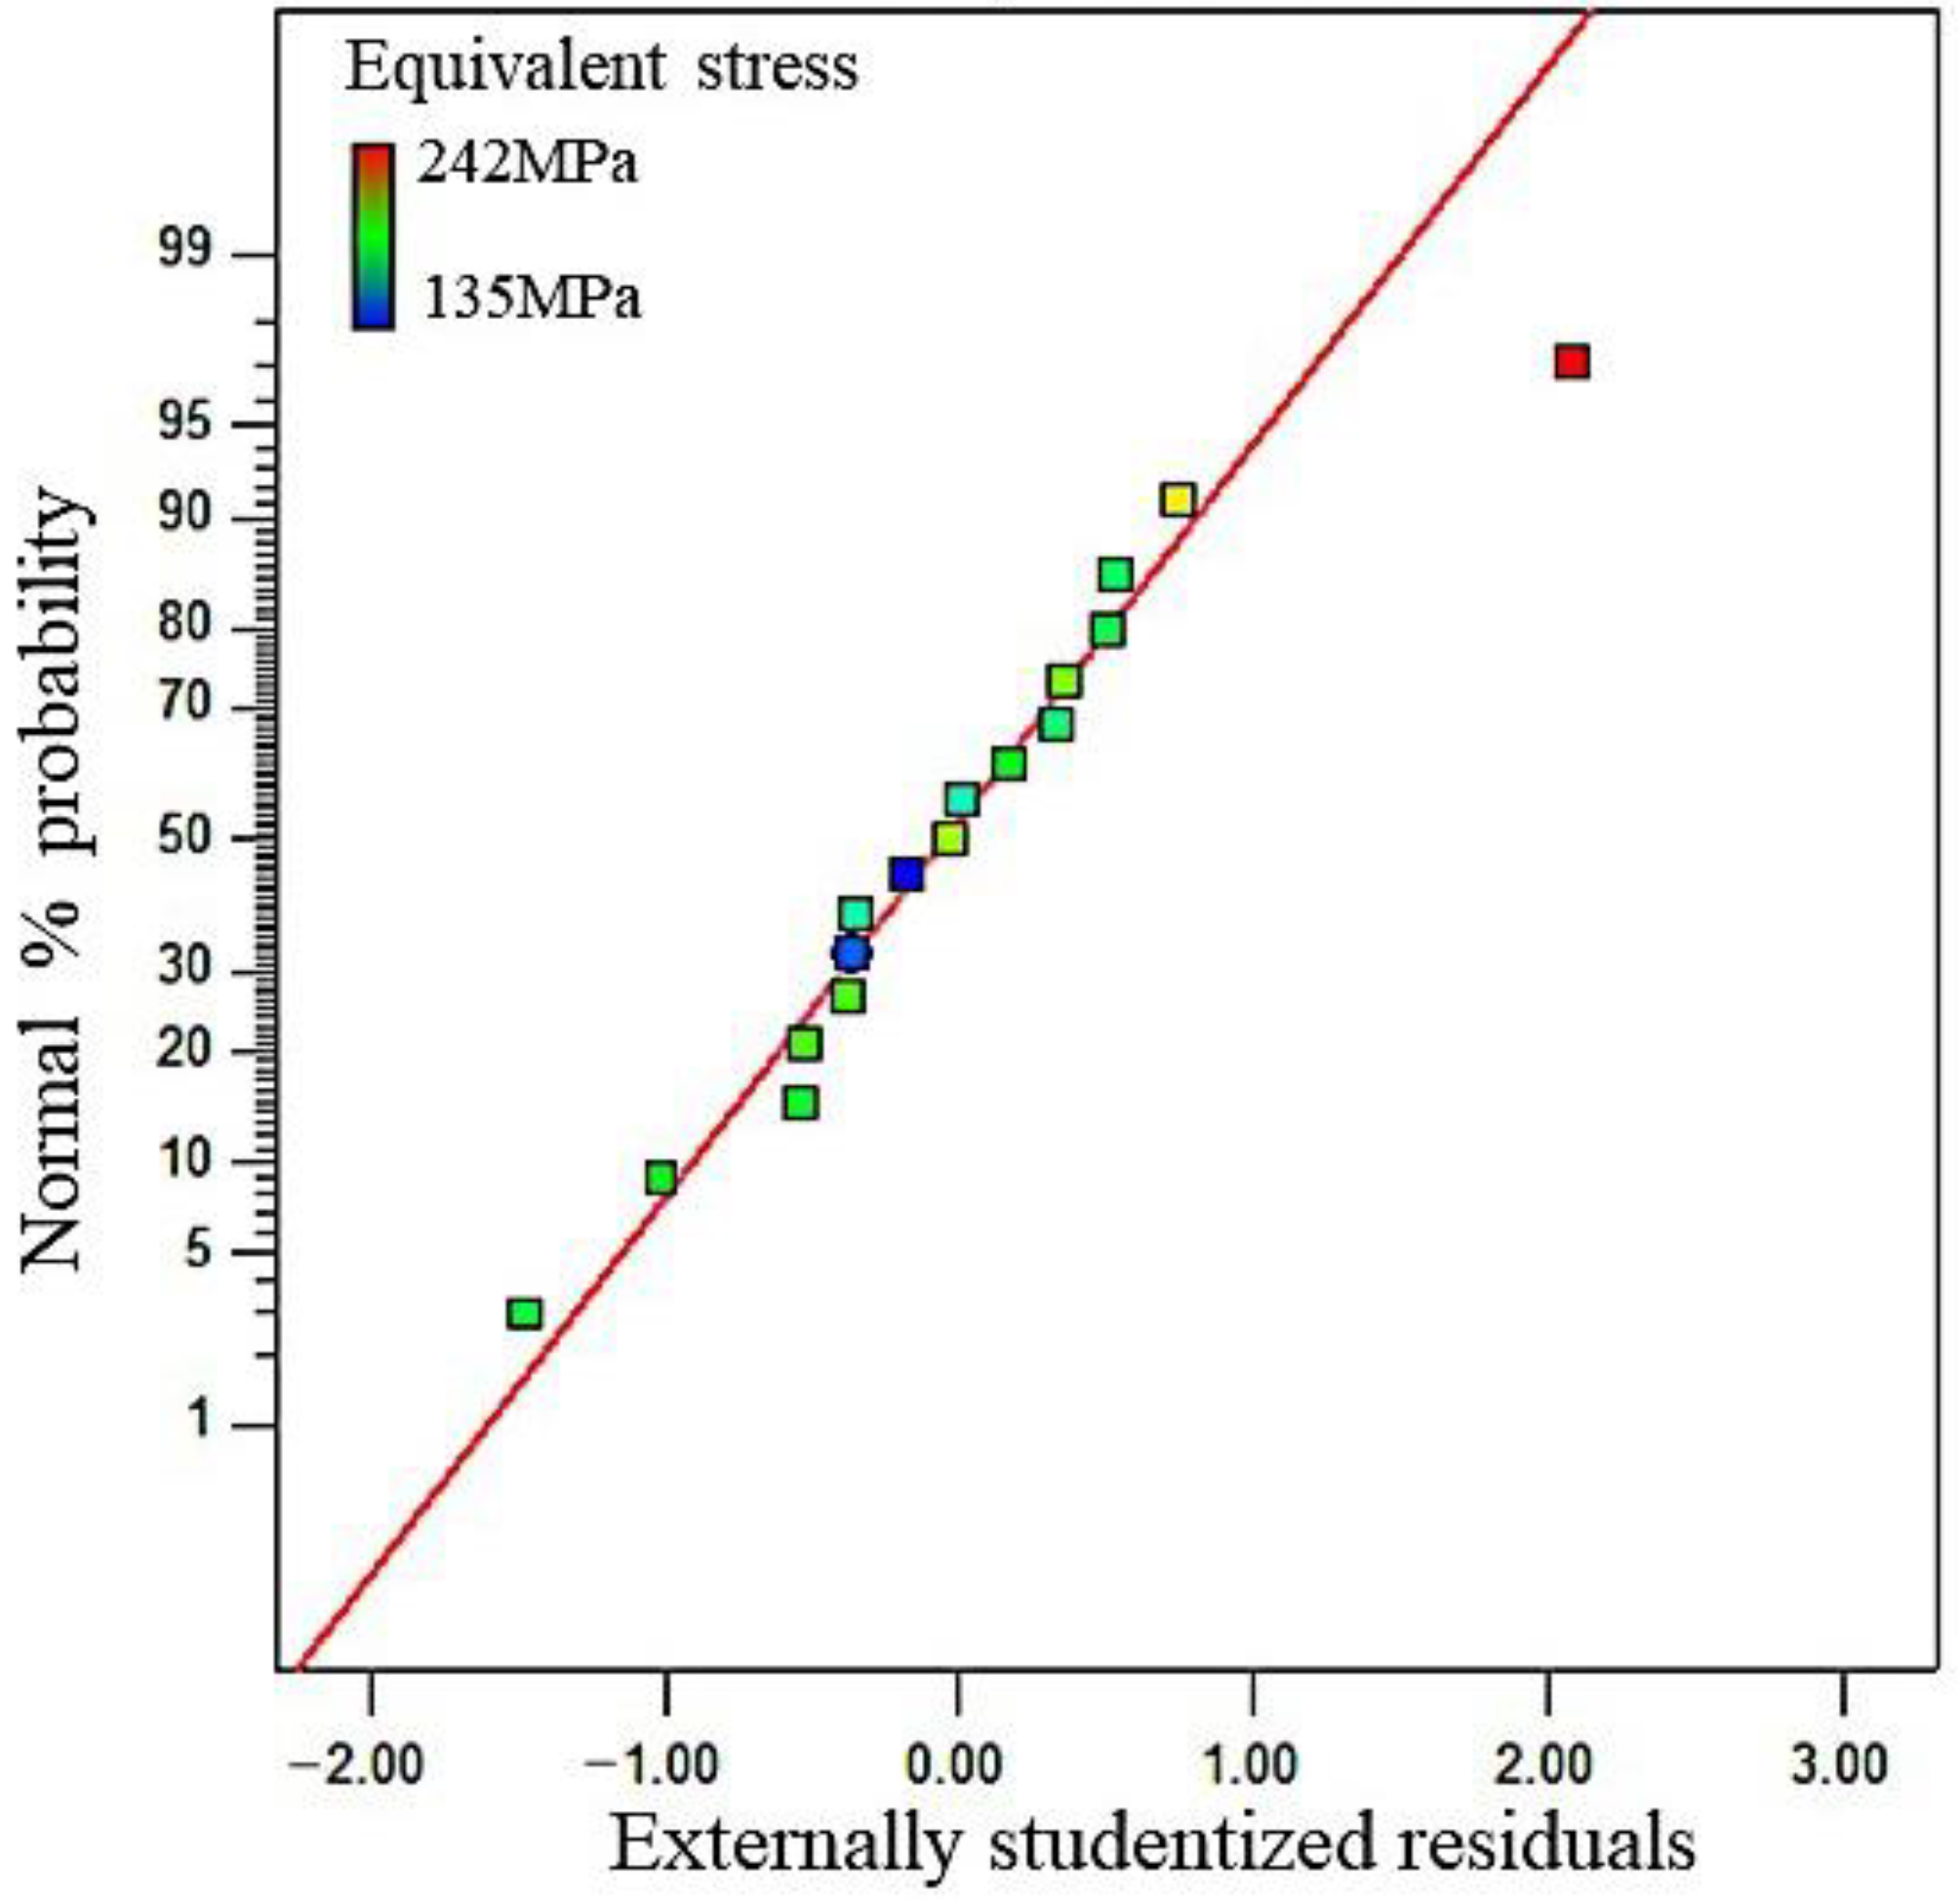
The regulator model is analyzed to verify the applicability of the model using a residual-based diagnostic plot obtained from regression analysis methods. A normal probability plot is considered the ideal normal probability if the reference points are distributed along a straight line.
Figure 8 shows the residual normal probability plot, which shows that the reference points are uniformly distributed on both sides of the straight line. Although individual reference points can be observed with the offset, the impact on the model is not significant or acceptable. Hence, the data for calculating the results of the equivalent stress in this paper are accurate and meet the requirements.
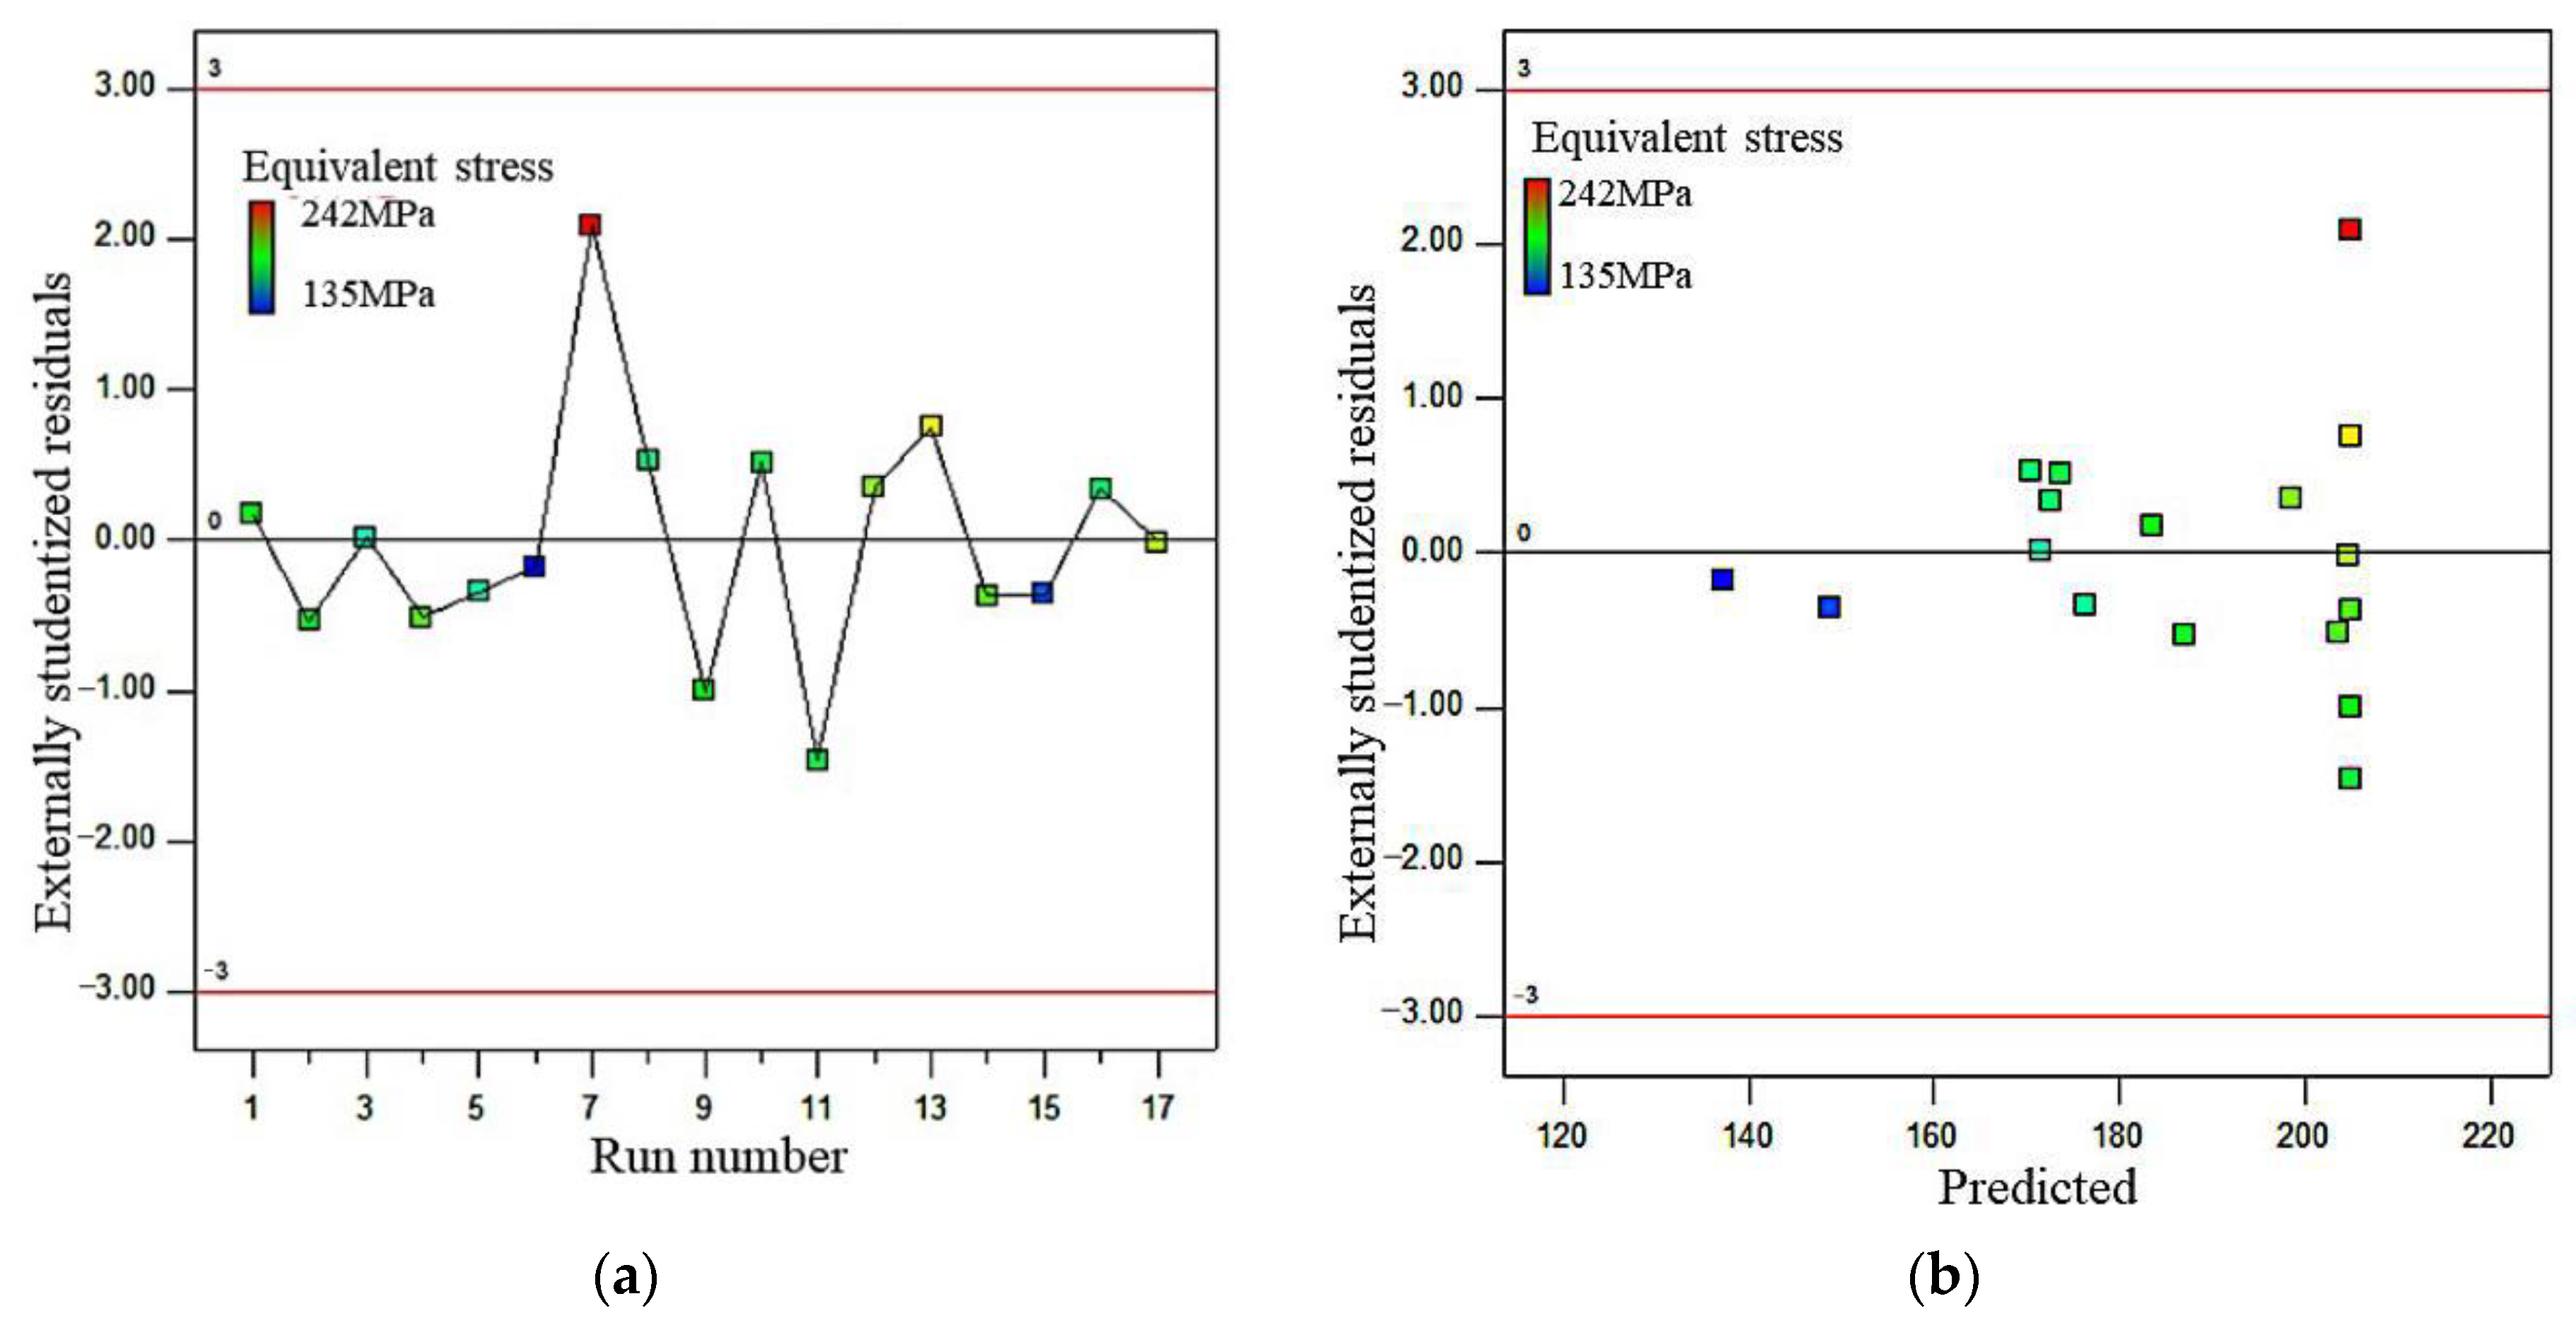
Figure 9 shows the residuals versus the number of trials plot and the predicted value plot, which can be used to check the reasonableness of the model. The plot indicates that all residuals are distributed within the horizontal band between the two red lines, which means that the quadratic polynomial model is reasonable.
Table 6 shows the comparison between the predicted and actual values. The maximum relative error is 15.13%, indicating that the predicted and actual values have a good correlation and that the quality of prediction and the accuracy of the model are high.
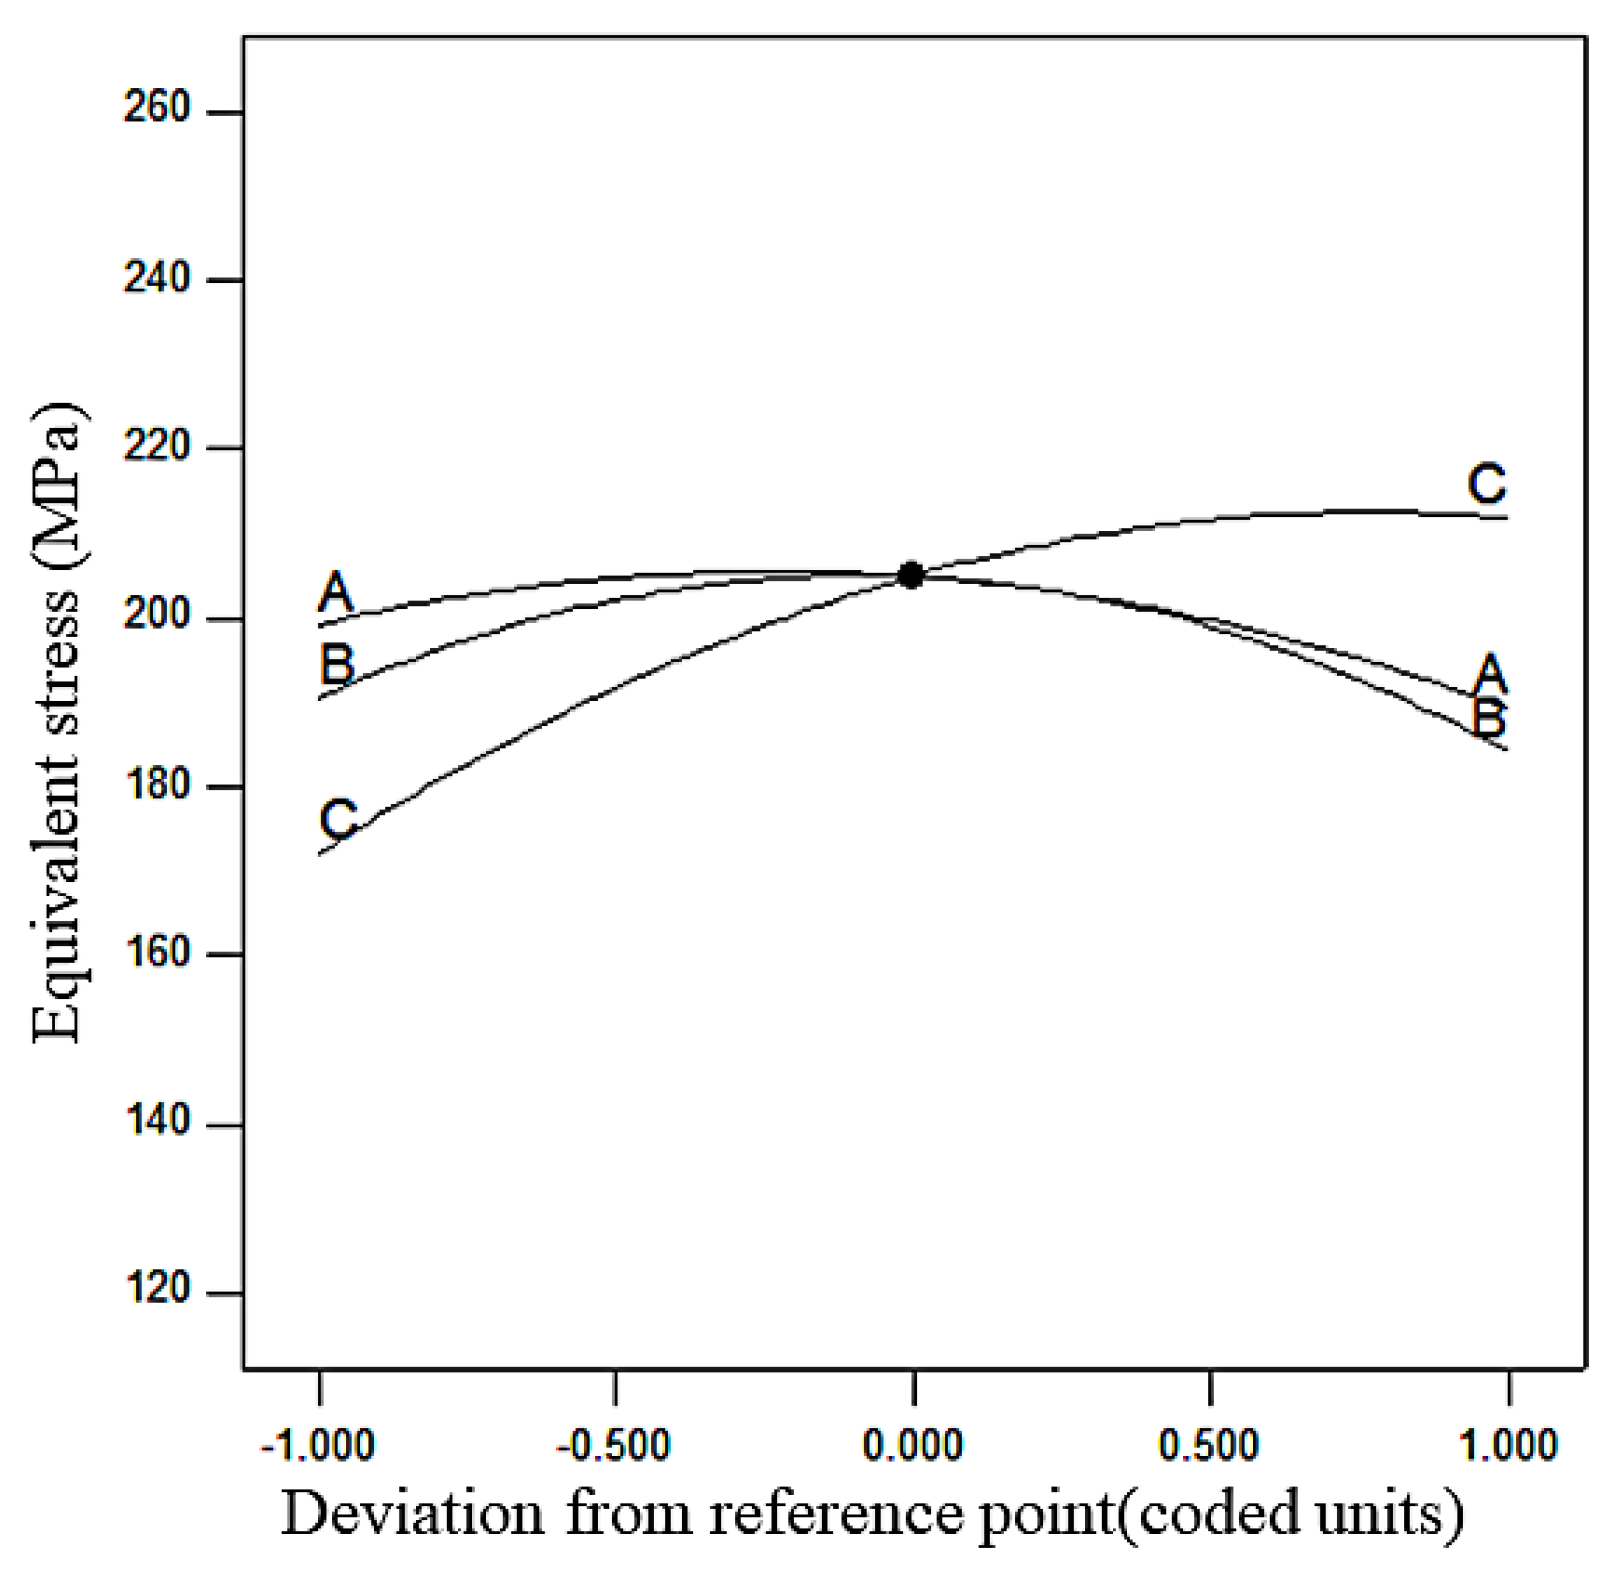
The regression diagram can visualize the trend of each variable, and the change of the equivalent stress can also be visualized. The change in the slope of each curve shows how sensitive the equivalent stress is to each variable.
Figure 10 shows that the equivalent stress increases with the sleeve wall thickness and the diameter of the valve bore, and then the value decreases. This result indicates that increasing the above values is beneficial for reducing the equivalent force. Equivalent stress with the increase in wall thickness of the outlet seat has a certain upward trend, but the rising trend gradually slows down, negatively affecting the reduction of the equivalent force. Hence, larger is not necessarily better in selecting the outlet seat wall thickness; rather, it should be taken within a reasonable range of values.
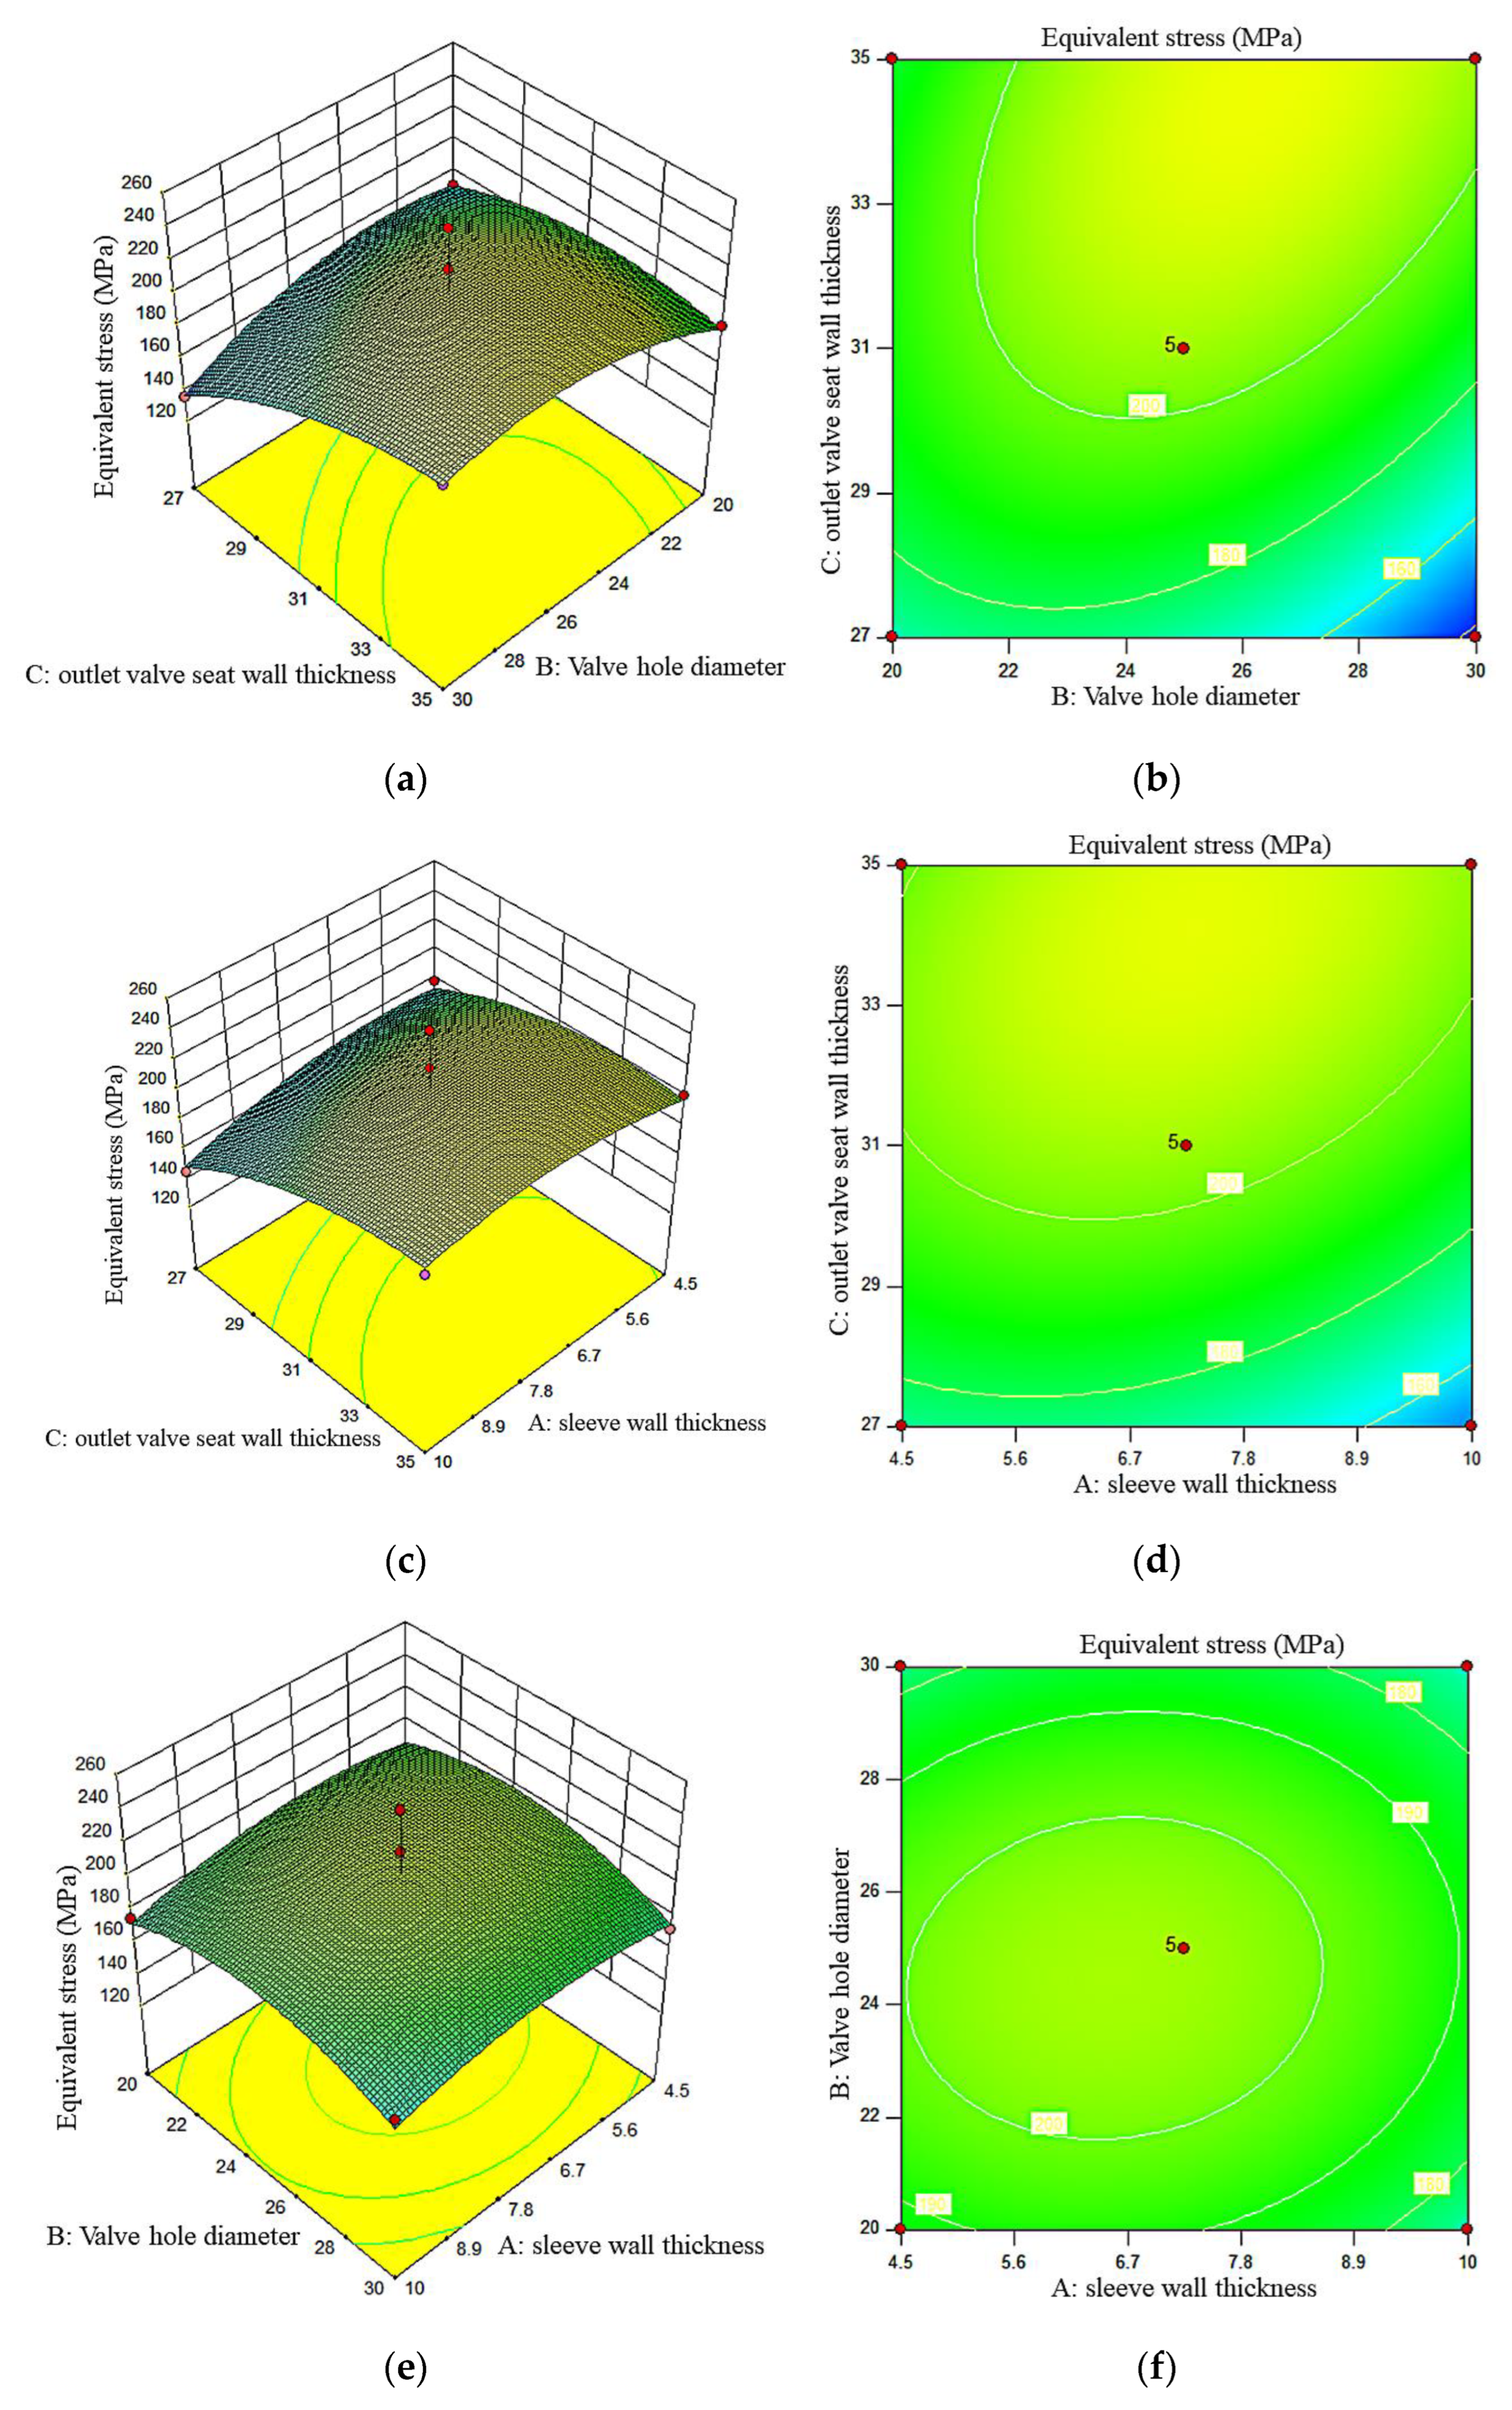
The three-dimensional response surface plot can more intuitively show the effect of the two variables acting simultaneously on the equivalent force. The two-dimensional contour plot can represent the mutually changing relationship between the two variables. Therefore, the three-dimensional response surface diagram and its two-dimensional contour diagram are shown in
Figure 11.
The gas regulator secondary response surface interaction term surface image and the corresponding contour plot can be analyzed under the simultaneous action of the two factors equivalent effect force change law. As the sleeve wall thickness and valve hole diameter increase, the equivalent effect force first increases and then decreases. When the outlet seat wall thickness is small, the sleeve thickness and valve hole diameter increase, and the equivalent effect force decreases significantly. The above results are consistent with the results of the regenerative analysis.
The above diagnostic analysis, regression analysis, and ANOVA can obtain response surface equations with good fit and high predictive ability, and the response surface’s fitting coefficients are substituted into the objective optimization function (Equation (9)). Thus, the optimization function for the gas pressure regulator can be obtained.
The extreme value of the response surface is the optimal parameter. The optimal parameters of the gas regulator can be obtained according to the surface and optimization function analyses. The sleeve wall thickness is 7.25 mm, the valve hole diameter is 25 mm, the outlet valve seat wall thickness is 31.05 mm, and the equivalent stress is 135.62 MPa.
All the above parameters are within the constraints specified in
Table 2. A comparison of the equivalent stress in
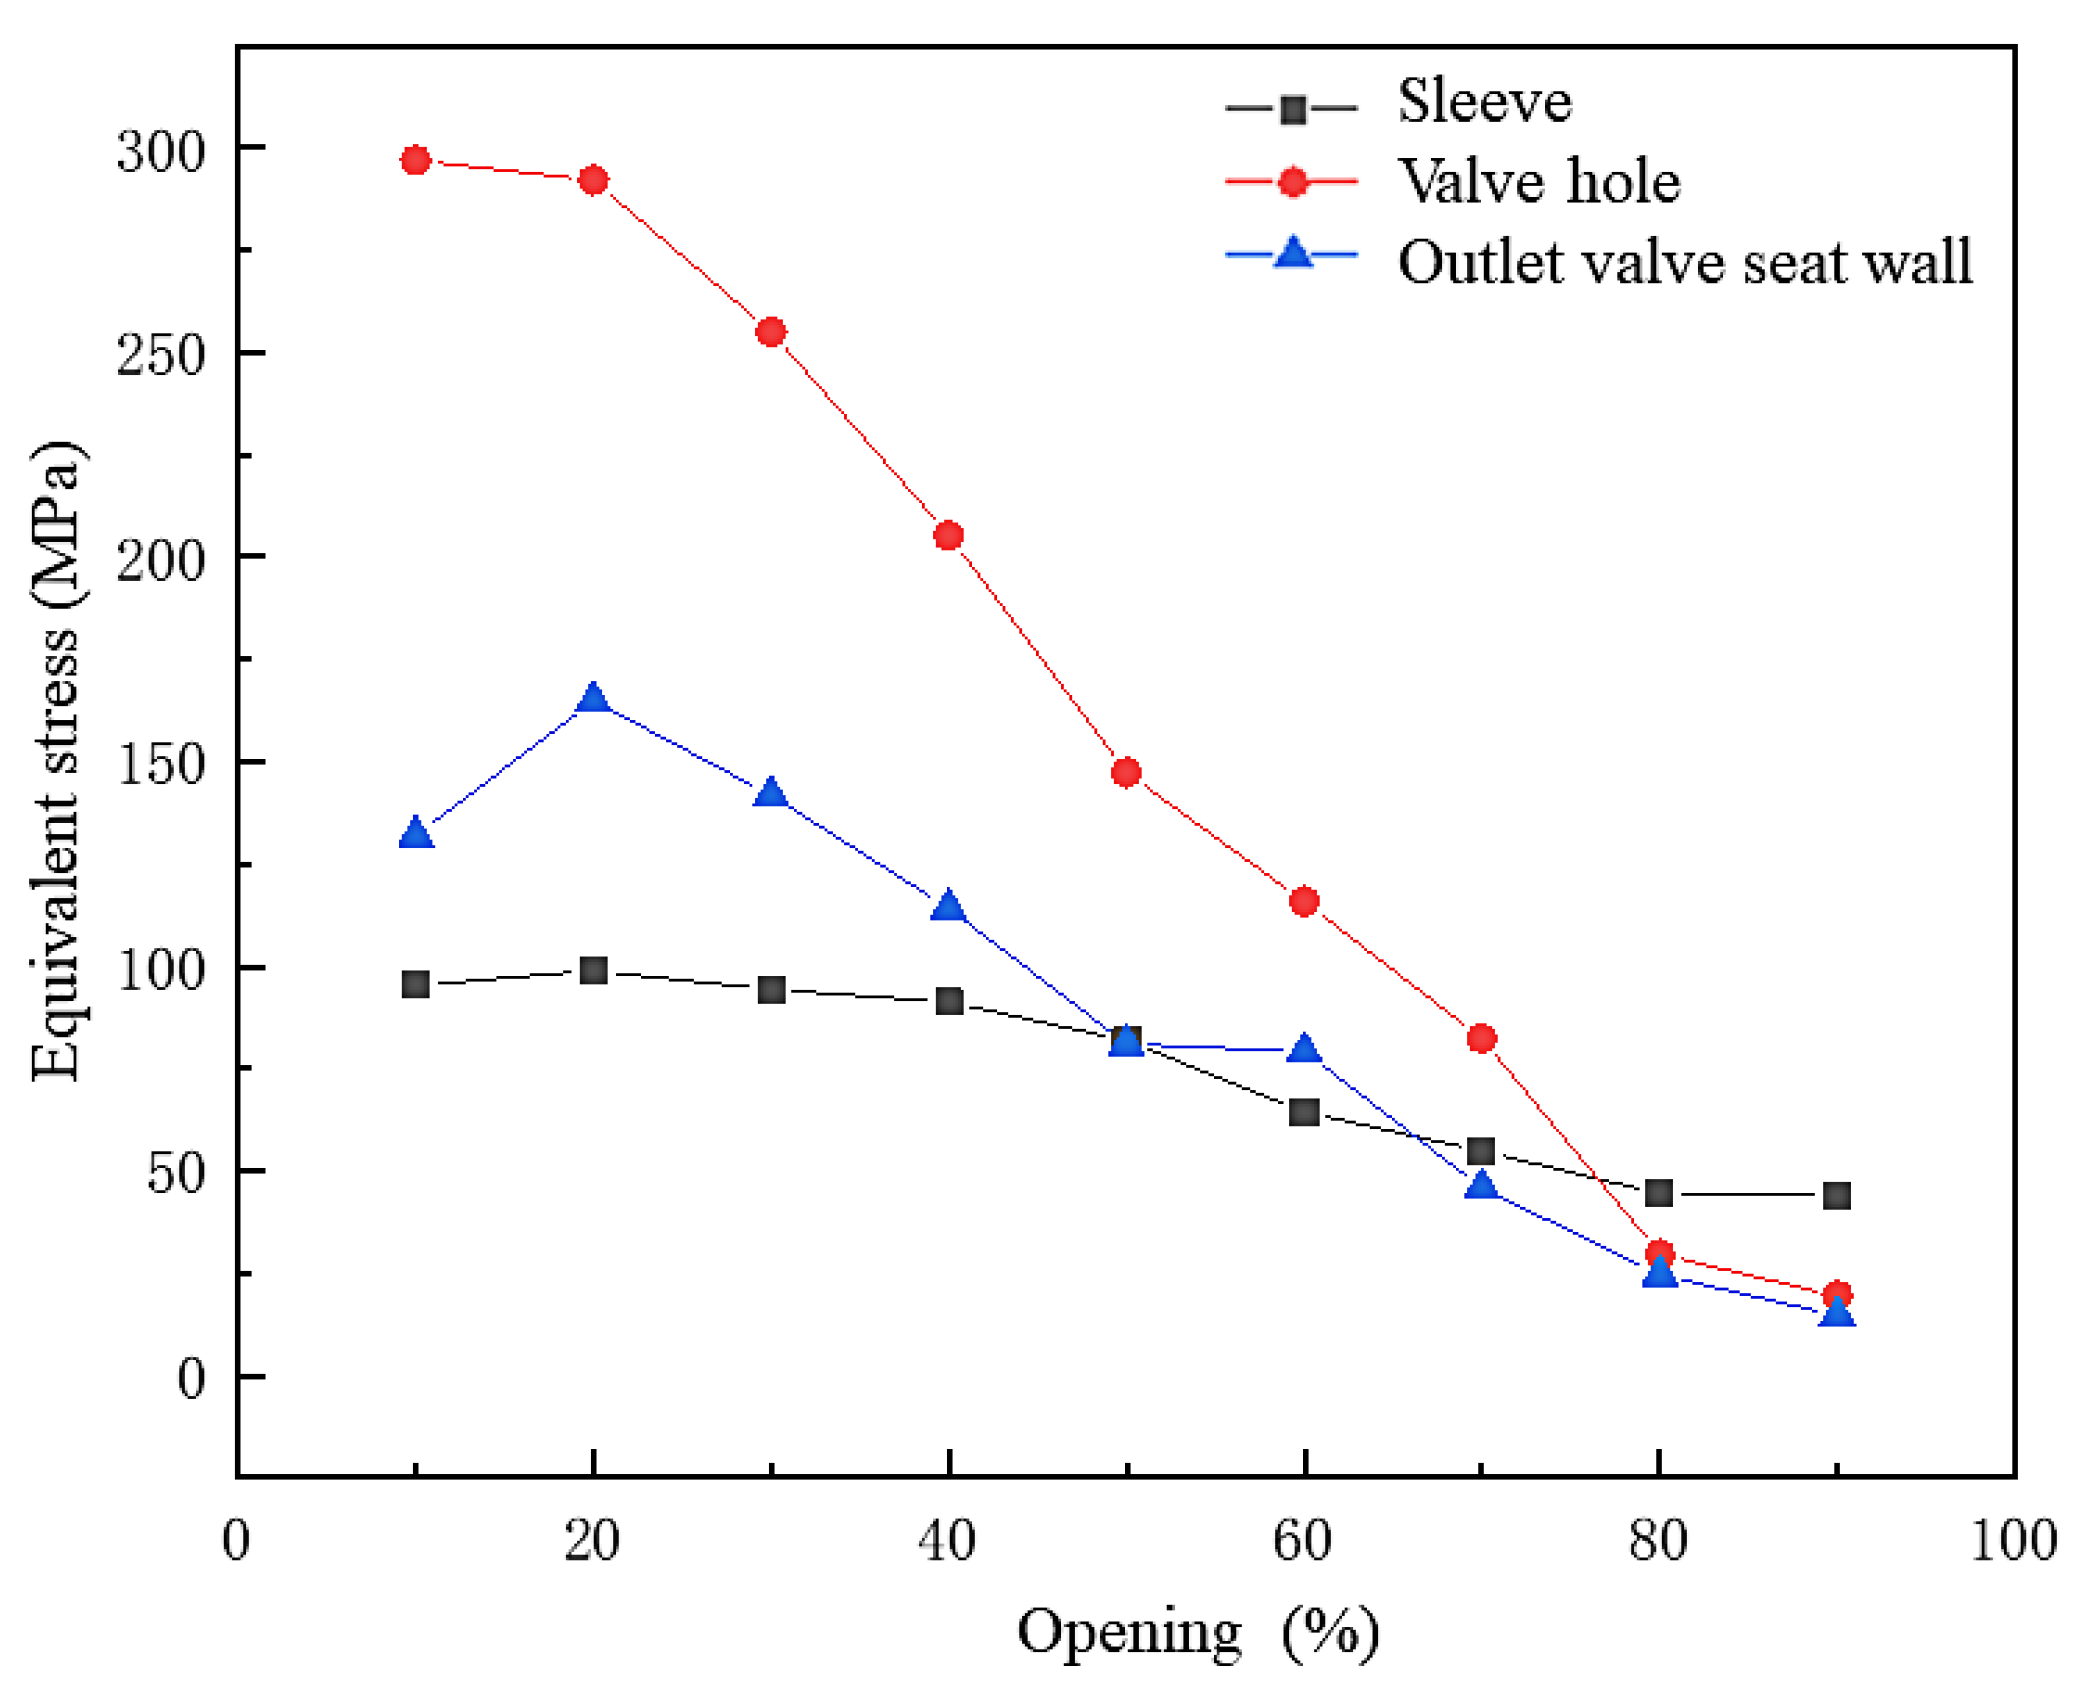
Figure 9 shows that at the 20% opening, the equivalent stress after optimization is significantly lower than the equivalent stress before optimization, and this optimization scheme has high feasibility. Through this method, the pressure use requirements of the regulator can be met while reducing the equivalent stress and improving the reliability of the structure through the optimization of the key structural dimensions of the regulator.


