Abstract
Railroad accidents involving dangerous goods (DG) need to be rescued quickly due to their hazardous nature. This paper proposes an emergency facility location model for the railway dangerous-goods transportation problem (RDGT-EFLP, abbreviated as EFLP). The EFLP model is based on an ellipsoidal robust model that introduces a robust control safety parameter Ω to measure the risk preferences of decision makers and limits the range of uncertain demand, the range of uncertain service and the range of safety parameters to find the solution for siting emergency facilities, when the time and location of emergency events are unknown. The model is solved using a genetic algorithm (GA) and real data after abstraction. Finally, a comprehensive analysis of the solution results under different maximum overcoverages illustrates the feasibility and effectiveness of the model.
1. Introduction
A derailment occurred on 3 February 2023 in East Palestine, a village of 4700 people in northeastern Ohio near the Pennsylvania border. Of the fifty cars on the derailment, five were equipped with vinyl chloride. Out of concern of a possible explosion, authorities decided to release and burn vinyl chloride, sending hydrogen chloride and the toxic gas phosgene, used during World War I battles, into the air [1]. The release of hydrogen chloride and phosgene from this railroad hazardous-material transport accident will cause serious ecological pollution. In China’s “Road Dangerous Goods Transportation Management Regulations”, it is stipulated that DG have special physical and chemical properties, such as explosive, flammable, toxic, corrosive and radioactive properties, and the same applies to railway dangerous-goods transportation (RDGT) [2,3,4]. Because of these special physical and chemical properties, emergency resources stored in emergency facilities covering the emergency area should be able to respond to emergency for the rescue of railroad hazardous materials in a timely manner in the event of an emergency or accident. Therefore, the location of emergency facilities affects the timeliness of the emergency rescue and the service level of the whole emergency rescue process, and a scientific and reasonable decision on the location of emergency facilities at RDGT is extremely important to improve the level of emergency rescue services [1,3].
The traditional siting problem is more concerned with the siting cost, while the location of emergency facilities for RDGT should be more concerned with the timeliness of the emergency rescue. The location selection needs to meet the principles of full coverage, emergency linkage, reliability and adaptability and should achieve the goal of full coverage of demand, high emergency rescue level, minimum cost of facilities and high reliability of emergency facilities. However, due to the uncertainty of the emergency demand, emergency time and location, the emergency facilities’ service capacity and the risk appetite of the siting decision makers, the difficulty of siting railroad emergency facilities is greatly increased. The above uncertainties are important parameters affecting the efficiency of emergency response; therefore, the abovementioned uncertainties are taken into account when planning the location of emergency facilities in this paper.
This paper is structured as follows: Section 2 reviews the relevant literature. Section 3 affirms the problem hypothesis and establishes an RDGT-EFLP. Section 4 introduces the numerical analysis applied to the railroad emergency facility siting issues. Finally, the research results and future research directions are discussed in Section 5.
2. Literature Review
The four conventional and dominant types of location-optimization problem models include the basic location model, dynamic location model, random location model and robust location model [5], as shown in Table 1. The basic location model usually includes the maximum-covering location model [6], set-covering location model [7,8] and P-medium model [9]; those basic models satisfy basic covering demands but need to allocate different types of facilities that complicate the problem. The fixed character of the parameters results in a basic location model that can be used only once for a given situation and cannot be reused. The reality is that as time changes, the siting of emergency facilities becomes a long-term, continuous decision-making process. Therefore, some studies have proposed a dynamic location model [10] and random location model [11] for staged site selection decisions and for better expression of the real location situation separately. The two models mentioned above have a subjective bias in the determination of uncertainties. Thus, robust location models, which include the box robust model [12] (the most basic robust optimization model) and ellipsoidal robust model [13], have been proposed. In addition, based on the above initial site selection models, some other location models have been developed, such as probabilistic models [14,15], a multicriteria decision-making (MCDM) framework [16,17,18,19], dual-objective models [6,10,20,21,22,23,24,25] and triple-objective models [26,27,28]. In the above location models, the main objective function is generally the shortest time/mileage to ensure the effectiveness of emergency response; second, these studies will use overall system cost or maximum coverage as the lower level objective function (or constraint) to ensure the economy of facility operation and maintenance.

Table 1.
Basic classification of the location problem.
There are many uncertain parameters affecting facility location, and siting is a complex decision-making process, where the distribution of uncertainties is often indeterminate. In the siting of facilities in the transportation field, it is also necessary to consider the difficulties that uncertainty brings to the modeling process. Some studies have considered uncertainty [8], for example, uncertain response times [15], uncertain costs [20,29], uncertain demands [15,21,22,23,26] and uncertain references [26]. However, the above siting models consider a single factor or no human factors. Some studies on railroad emergencies have shown that human factors are more important risk factors. For example, Huang, W. et al. developed a historical data-driven weight calculation approach [4] and an interpretive structural modeling (ISM) and Bayesian network (BN) combining approach [30], proving that unsafe human actions and a lack of technology are the most dangerous factors of RDGT. There are also studies by Batarlienė, N. et al. [31], Ebrahimi, H. et al. [32] and Bekisz, A. et al. [33] that reveal that human factors occupy a very important place in railroad accidents. In fact, human influence is present throughout the location decision. In the final decision stage, especially the decision stage of RDGT emergency facilities location, the risk preference of decision makers affects the final choice of siting options. Prudent decision makers with higher requirements for emergency services for RDGT accidents should implement siting options with higher resilience to risks at the decision stage. Conversely, aggressive decision makers may appropriately forgo lower risk capacity and emphasize the timeliness of emergency response.
In summary, current studies on facility siting problems mainly focus on the location of supply chain dispatch centers [14,24,25,28] and urban public medical/security service facilities [6,14,15,16,19,20,21,34,35,36]. In the field of transportation, facility siting methods are mainly applied to road traffic [10,15,19,20], and research on emergency facility siting problems for railroads [22] is few and in the initial stage. In addition, the railroad emergency facility siting problem is a sub branch of the location problem with the characteristics of rescue time constraint, route linearity and service level restriction, which determine the uncertainty of the emergency demand, emergency time and location and the emergency facilities’ service capacity, which should be categorized into the discussion of the robust location problem. Therefore, we consider the human factor, the preference level of decision makers, as a human factor affecting emergency response and combine it with uncertainties such as the emergency demand, emergency service level and emergency timeliness of RDGT in emergencies to discuss the siting model of RDGT in a robust location problem.
3. Establish an EFLP Model and Solution Method
In this section, based on the factors of bimodality, inaccessibility, sudden transitions and divergence of RDGT emergencies [37], from the perspective of emergency service quality and emergency linkage, considering the uncertainty of the emergency demand, emergency time and location, the emergency facilities’ service capacity and the risk appetite of the siting decision makers, an EFLP model for the location of RDGT emergency facilities subject to uncertain parameters is proposed. It should be noted that site selection relies on railroad dangerous-goods handling stations, special line pick-up stations and part-time stations to set up emergency rescue facilities and can be used as a backup facility within the coverage area for joint rescue with other facilities to meet the rescue needs of emergency demand points. In addition, DG emergencies may occur inside, so the facility itself is also an emergency demand point.
3.1. Notations and Proposed Assumptions
3.1.1. Notations
- (1)
- Indices
- : The set of emergency demand point coordinates, .
- : Set of coordinates of alternative emergency facility site for RDGT, .
- (2)
- Parameters
- : When an emergency occurs, the emergency demand point coverage distance requirements.
- : The scope of emergency rescue services that can be provided by the emergency facility site for the RDGT.
- : Distance between emergency facility site and emergency demand point .
- : Capacity of emergency facility site for RDGT, i.e., emergency service capacity;
- : The degree of conservatism of decision makers in making location decisions, which we named safety parameter/conservatism. The larger the safety parameter, the more conservative the decision maker is and the more resilient to the risk of demand fluctuations.
- : Maximum number of emergency demand points to be covered.
- : The uncertainty set of the demand of emergency demand point , , where , i.e., the demand is the product of the quantity of dangerous goods and the amount of unit rescue resources. The unit rescue resources is the number of rescue resources required for a unit of dangerous goods in the event of an emergency. is the nominal value of .
- : The amount of type of hazardous materials in case of emergencies at the emergency demand point .
- : Number of rescue resources required for the type of DG per unit.
- : the jth column of the decision variable .
- : The upper limit of service recipients at the emergency facility site .
- (3)
- Decision variables
- : 0–1 decision variable, 1 if emergency facility point is selected, 0 otherwise.
3.1.2. Propose Assumptions
We make the following assumptions before establishing a robust optimal location problem for RDGT emergencies under uncertain parameters:
- In the case of any RDGT emergency, emergency facility construction costs, transportation costs, etc., are not considered.
- In the case of any RDGT emergency, if the emergency facilities are operating normally, the emergency facility sites must be able to provide emergency rescue services.
- The locations of the candidate and demand points for emergency facilities are known.
- The distance between the facility point and the demand point is expressed in terms of the abstract mileage of the railroad line.
3.2. Model Building
Considering the different categories of DG and the different demands of emergency materials required for emergency rescue, an EFLP model with standby coverage under an uncertain RDGT scenario is proposed.
Objective function:
Convert to:
The objective function indicates the shortest distance from the emergency facility site to the emergency demand point to provide emergency rescue services after an outbreak involving different hazardous materials, i.e., the shortest emergency rescue time.
The constraint on the emergency facility site of the service area:
The facility point provides its own range of services, and the demand point has its own range of needs; only when both parties are satisfied can a service relationship be established.
Therefore, the supply relationship constraint is as follows:
The emergency service capacity provided by the RDGT emergency facility site to meet the demand for various types of DG in the event of an accident, that is, the demand cannot exceed the emergency facility point capacity after the occurrence of an emergency event at the demand point.
Relationship between demand and quantity of hazardous materials:
Constraints on the number of times the emergency demand point is covered:
Constraints on the number of facility site services:
A facility site serves up to demand points. Once the service relationship is established, the capacity of the facility point must be able to serve all the demand points for which the service relationship is established at the same time.
Constraints on decision variables:
The decision variables are 0–1 variables.
3.3. Robust Peer-to-Peer Model
This section uses robust optimization theory to transform objective functions and constraints containing uncertainty parameters into uncertainty sets. Then, the objective functions and constraints in the previous deterministic model are equivalent to the robust optimization model with uncertainty sets. To represent the robust optimization model with the shortest total emergency rescue distance of the RDGT emergency rescue system, we consider the robust optimization model with the demand of demand point under the elliptical uncertainty set.
The elliptic uncertainty set is defined in the following form:
where is an ellipse, and is the nominal value of and the center of the ellipse. The positive definite matrix is a matrix that describes the uncertainty relation of the objective function and constraint conditions and affects the direction of the ellipse. Value Ω is the conservative degree, that is, the parameter of the conservative limit, which affects the size of the ellipse. Therefore, under elliptic uncertain sets, the constraints are equivalent to the following:
Then, we have the following:
This leads to the following:
Therefore, the linear programming model corresponds to the equivalent elliptic uncertainty set model:
The elliptical robust optimization model is more complex, and its robust model can be adjusted by the safety parameter Ω to improve the immunity of the original model.
The deterministic siting model is transformed into a robust peer-to-peer model according to the elliptic robust optimization conclusion for the uncertain set:
3.4. Heuristic Solution
Since EFLP is an NP-hard problem, a heuristic method [23,25,38], GA [39], is applied. The algorithm-solving process is shown in Figure 1 as follows:
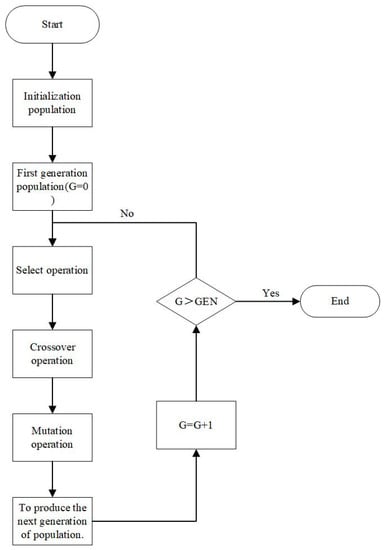
Figure 1.
Flowchart of the genetic algorithm.
- Initialization. Set the number of evolutionary generations, maximum evolutionary generations, crossover and mutation probabilities and generate the initial population.
- Individual evaluation. Set the fitness of each individual in the group, i.e., the restrictive constraints that individuals satisfy.
- Selection operator. The selection operator acts on the population, i.e., the fitness of individuals in the population is normalized. The purpose of selection is to pass the optimized individuals directly to the next generation or to generate new individuals by pairwise crossover and then pass them to the next generation.
- Crossover operator. The crossover operator is applied to the population, and the roulette wheel-based selection operation is used in the iteration. It is the crossover operator that plays a central role in the genetic algorithm.
- Variational operators. The variation operator is applied to the population. The population is crossed and mutated based on random probabilities to obtain the next generation population.
- Termination condition. If the maximum number of iterations is reached, the individual with the maximum fitness obtained in the evolution process is used as the optimal solution, and the calculation is terminated.
4. Numerical Analysis
In this section, the EFLP model is used for the emergency siting planning of DG in a road bureau to verify the validity and applicability of the model. In this section, the uncertainty of the emergency demand, emergency time and location, the emergency facilities’ service capacity and the risk appetite of the siting decision makers are fully discussed.
4.1. Railway Network Analysis and Parameter Calibration
A road bureau of China Railway Group Co. (hereinafter referred to as “the road bureau”) is one of the larger railroad group limited companies in the country. To better generalize the model theory, we abstracted the relevant attribute data, combined with the road bureau line mileage and GIS. The abstracted base data include four main aspects: railroad network, alternative points for emergency facility sites, emergency demand points and connectivity paths, as shown in Figure 2.
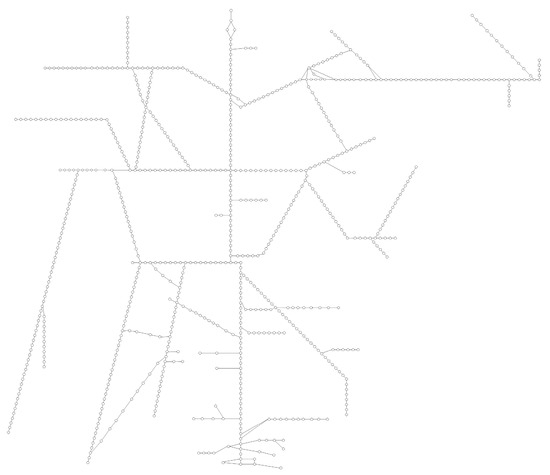
Figure 2.
The abstract diagram of railway network.
By the end of September 2020, the railroad operating mileage within the boundary of the road bureau was 14,377.4 km. Among them, there were 11,299.6 km of general speed railroad and 3077.8 km of high-speed railroad. There were 776 stations and 37 line stations in the road bureau, totaling 813. Another six stations are entrusted to management. In 2020, the Road Bureau only handled the arrival and dispatch of dangerous goods of categories 2, 3, 4, 5, 6 and 8, as shown in Table 2. The realistic operation of this road bureau is applicable to the RDGT-EFLP model we constructed.
Table 2.
Arrival and dispatch of dangerous goods by the Road Bureau in 2020.
In real-world problems, the data parameters in site selection are often disturbed by various factors and are uncertain. The probability distributions of these parameters are not available. Therefore, a range of parameters is given for realistic situations with uncertain demand, uncertain rescue capability and uncertain risk preference, and the decision solution for the shortest rescue distance is solved by substitution into the objective function.
(1) Coordinate construction.
Since alternative emergency facility sites are also subject to the possibility of emergencies, we consider alternative emergency facility sites as emergency demand points as well. On the basis of the abstraction of the railroad network, we abstract the emergency demand points (demand points include stations and lines along the line) and mark the corresponding numbers, stations and coordinate locations. A total of 111 emergency facility alternative points and 797 emergency demand points were abstracted, and their specific distribution is shown in Figure 3. As shown in Figure 3, the actual route data are based on the actual data, but the actual data involve state secrets and are difficult to apply. In order to better promote the model theory, simulated data will be adopted.
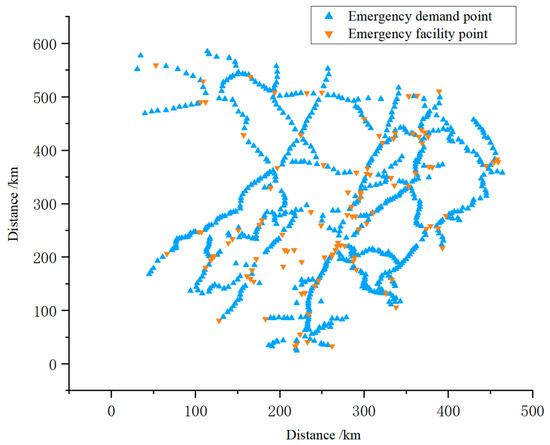
Figure 3.
The specific distribution of emergency facility alternative sites and emergency demand points.
(2) Calibration of the scope of service of emergency facility alternative sites and the scope of demand for emergency demand points .
The service range of the alternative emergency facility and the demand range of the demand point will have an impact on the siting decision. In the same network, it is necessary to consider the cases where the two ranges affect each other, i.e., the four cases where the service range of the alternative emergency facility is larger, the service range of the alternative emergency facility is smaller, the demand range of the demand point is larger, and the demand range of the demand point is smaller, and then the siting decision can achieve a certain level of robustness. We calibrate the maximum capacity of each contingency facility that makes the siting decision reach a robust level to be within [500,1500] and the demand for each demand point to be within [500,1500], and they are generated randomly in their corresponding intervals in the arithmetic solution.
(3) Calibration of RDGT emergency safety parameters.
The above siting decision to reach a certain level of robustness is defined as reaching the level indicated by the robust control safety parameter Ω. The robust control safety parameter Ω is an important indicator of robustness and a measure of the risk preference of decision makers. The larger the value of the robust control safety parameter Ω, the more conservative the decision maker’s attitude toward the siting decision in the face of unexpected event demand perturbations and the more adventurous the opposite. We calibrate the uncertain safety parameters Ω = 1, 2, 3, 4, 5, ……, 20 and substitute them directly into the model calculation.
4.2. Model Solving Results
To verify the feasibility of the model, the coordinates of alternative emergency facility points, demand point coordinates, safety parameter Ω and the maximum overcoverage (Emergency facility point to demand point override must not exceed 1, 2, 3 times), after the abstraction of the line network of a road group company, are input into the EFLP model. Execution of the algorithm on a PC with an Intel (R) Core (TM) i7-1065G7CPU@1.30 GHz, 1.50 GHz, 16 GB RAM and Windows 10 operating system using PyCharm Community Edition 2021 as the operating platform. Set population size M = 500, maximum evolutionary generation MAXGEN = 1500, parameter F = 0.5 in differential evolution and recombination probability XOVR = 0.7. The calculation results are shown in Table 3.
Table 3.
Location optimization results under different robustness levels.
Figure 4 shows the effect of the elliptical uncertainty concentration safety parameter Ω on the total emergency rescue mileage when considering the uncertainty of demand after an emergency event. As seen from Figure 4, the EFLP curve fluctuates more smoothly with the safety parameter Ω, when the maximum excess coverage is 3 and 4 times. A comparison of the results of the elliptical robust model with different maximum overcoverages is shown in Table 4. The safety parameters corresponding to the downward trend interval and the upward trend interval of the solution results with different maximum overcoverage times are basically the same, but the global optimal solutions to reach convergence are different. The model converges, when the maximum overcoverage number is 3, the safety parameter is taken as 3, and the shortest rescue mileage is 625.10 km.
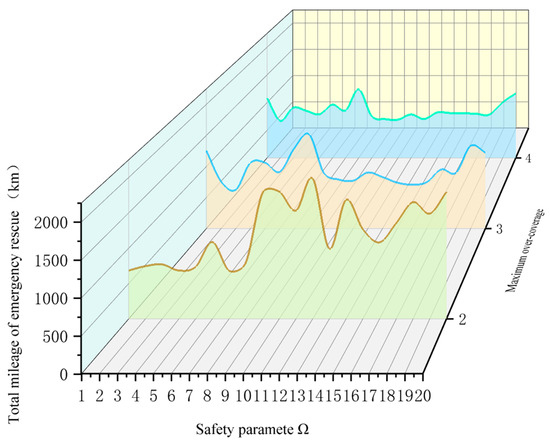
Figure 4.
The influence of safety parameter Ω on the total emergency rescue distance.
Table 4.
Comparison of the results of solving elliptic robust models with different maximum overcoverages.
4.3. Decision Evaluation
4.3.1. Risk Appetite Analysis for Decision Makers
The security parameter Ω represents the decision maker’s sentiment preference for the risk of demand volatility.
The experimental result data in Table 3 above draw a topological overlay of the emergency facility that is not concise enough to visualize. For the sake of illustration, we use a small calculation example to make another diagram. Taking the maximum number of overcoverages = 2, as an example, 28 emergency facility points are randomly selected from the solved results, and the location optimization results under different robustness levels are shown in Table 5. The network topology of the siting results corresponding to the safety parameter Ω for the shortest and longest emergency response mileage under the maximum number of overcoverages of two is shown in Figure 5.
Table 5.
Location optimization results under different robustness levels (overcoverages = 2).
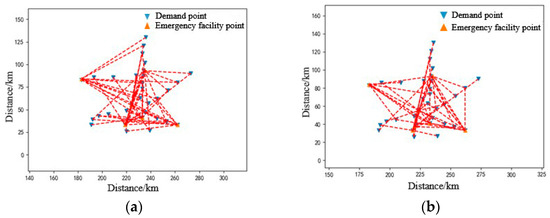
Figure 5.
Topology of the emergency location network under different robustness levels. The red dotted line in the figure represents the demand point service relationship. (a) Ω = 6; (b) Ω = 16.
As seen in Figure 5, the red dotted line represents the demand point service relationship. (a) Ω = 6; (b) Ω = 16. When the safety parameter Ω = 6, the optimal solution of the elliptical robust model appears at this time, and the total emergency rescue mileage of the whole system is 66.68 km. When the safety parameter Ω = 16, which indicates that the decision makers are more pessimistic about the risk of demand fluctuation, the elliptical robust model at this time yields the longest total emergency relief mileage for the whole system, which is 133.13 km, and the obtained emergency siting road network topology is more resistant to the risk of demand fluctuation. When decision makers consider that the risk of demand fluctuation tends to be pessimistic, the corresponding safety parameter Ω is larger; when the emergency facilities are more conservatively sited, the ability to resist the risk of demand fluctuation is stronger, but the total emergency rescue mileage of the system is relatively larger; and when decision makers tend to be optimistic considering the risk of demand fluctuations, the corresponding safety parameter Ω is small, and the total system emergency rescue mileage is relatively small. Therefore, our model uses the safety parameter Ω to measure the risk appetite of decision makers, and the appropriate safety parameter can be selected according to the degree of risk appetite and specific reality in the model application to achieve a systematic balance of risk resilience and rescue mileage optimization.
4.3.2. Comprehensive Analysis of Location
To compare the most available decision results under different maximum overcoverages, a comprehensive analysis is conducted for the three siting decisions corresponding to the shortest rescue mileage in Table 4, as shown in Table 6. The distribution of emergency facility points corresponding to different siting decisions is shown in Figure 6.
Table 6.
Comparison of the results of solving elliptic robust models with different maximum overcoverages.
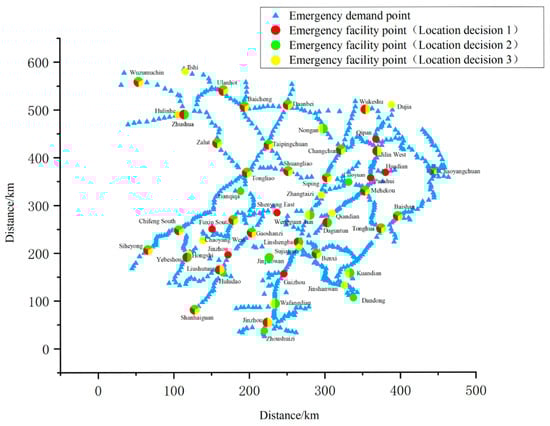
Figure 6.
Emergency location network scatter diagram.
As shown in Table 6 and Figure 6, the 32 emergency facility points of location decision 1 can cover all the demand points, and the demand points are overcovered no more than 2 times, as shown in location decision 3.
As shown in Figure 7a, the objective of minimizing the total emergency rescue mileage of location decision 1 is obtained after the 691st iteration of the population. The algorithm converges for the first time in the 31st iteration, for the second time in the 88th iteration and for the third time in the 421st iteration; the relationship between the number of railway hazardous-cargo emergency facilities and the number of iterations shows that the number of railroad hazardous-cargo emergency facilities decreases in the first 690 iterations and gradually converges with the optimal solution. That is, the number of RDGT emergency facilities with the smallest total emergency rescue mileage.
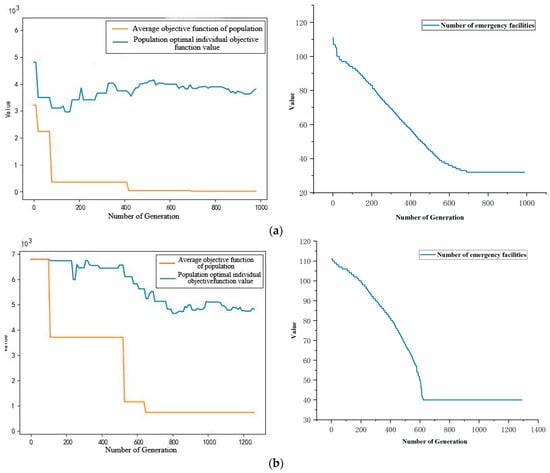
Figure 7.
Relationship between the number of iterations and the total mileage of emergency rescue and the number of emergency facilities. (a) Location decision 1. (b) Location decision 2. (c) Location decision 3.
As shown in Table 6 and Figure 6, the 40 emergency facility points of site selection decision 2 can cover all the demand points as well as the demand point’s overcoverage no more than three times. As shown in Figure 7b, the objective of minimizing the total emergency rescue mileage of site selection decision 2 is obtained after the 622nd iteration of the population. The algorithm converges for the first time during the 97th iteration, and the optimal solution is obtained after several iterations of convergence over 503 iterations. From the relationship between the number of RDGT emergency facilities and the number of iterations, we can see that in the first 621 iterations, the number of RDGT emergency facilities keeps decreasing and gradually converges with the optimal solution. That is, the number of RDGT emergency facilities with the smallest total emergency rescue mileage.
As shown in Table 6 and Figure 6, the 41 emergency facility points of site selection decision 3 can cover all demand points as well as the demand point’s overcoverage no more than four times. As shown in Figure 7b, the objective of minimum total emergency rescue mileage for site selection decision 3 is obtained after the 1052nd iteration of the population. The algorithm converges for the first time during the 12th iteration, for the second time during the 48th iteration and for the third time during the 53rd iteration, and the optimal solution is obtained after converging many times during 866 iterations. From the relationship between the number of RDGT emergency facilities and the number of iterations, it can be seen that during the first 1052 iterations, the number of RDGT emergency facilities remains. The optimal solution is obtained after convergence. That is, the number of RDGT emergency facilities with the smallest total emergency rescue mileage.
Based on the comprehensive analysis illustrated in Table 6 and Figure 6 and Figure 7, among the above three decision options, location decision 1 has fewer emergency facilities compared to other decision options, but the overcoverage is lower, the linkage between emergency facilities is poor, the total emergency rescue mileage is relatively high, and the emergency rescue service capacity is poor. Location decision 3 has a higher number of emergency facilities, more overcoverage and better linkage between emergency facilities compared to other decision options, but the total emergency rescue mileage is relatively high. Compared to location decision 1 and location decision 3, location decision 2 has a higher number of sites for emergency facilities but a higher overcoverage, better linkage between emergency facilities, relatively low total emergency rescue mileage and better emergency rescue service capacity; therefore, location decision 2 has the shortest total emergency rescue mileage and the least number of iterations of the optimal solution, which not only achieves comprehensive coverage of demand points, a more moderate number of overcoverage and tighter emergency facility point connectivity but also achieves rapid response to multiple demand points, which is more in line with the current status of emergency rescue under the currently given database.
5. Conclusions
We take the optimal objective of the total mileage of the whole railroad emergency rescue as the premise, trade off the spare coverage and the shortest response time after an accident and use elliptic robust optimization theory to construct a robust optimization model of spare coverage under uncertain RDGT conditions. Based on the data of the railroad network under the jurisdiction of the Road Bureau Group Limited company, the RDGT network is abstracted, and the advantages and disadvantages of the decision scheme of RDGT emergency facilities’ location under the uncertainty of demand are obtained separately by solving the model through GA in many aspects, such as the number of emergency facilities, the number of overcoverage and the total emergency rescue mileage, and the analysis of the influence of risk preference of decision makers on the location selection is given. The simulation results show that we obtain the optimal solution when the maximum overcoverage number is 3, the safety parameter is taken as 3 and the shortest rescue mileage is 625.10 km. Our model has an extremely important theoretical value and practical significance to reduce the casualties of people on and off the road caused by the special physical and chemical properties of DG emergencies that may cause serious property damage and ecological loss and to restore normal railroad transportation in time.
The highlights of this paper are as follows:
(1) From the emergency service level (measured by distance) and the emergency linkage standby coverage response (described by the amount of coverage), the quantitative measure of each uncertainty is determined.
(2) Based on the standby coverage response, dangerous goods category and emergency rescue service level, considering the uncertainty of the emergency demand, emergency time and location, the emergency facilities’ service capacity and the risk appetite of the siting decision makers, an EFLP model with standby coverage is established with the objective of shortest rescue distance.
(3) By comparing the differences in emergency rescue mileage under different decision options, the different emergency needs that can be accommodated by the EFLP model under the uncertainty of RDGT demand are clarified and a relatively satisfactory location decision option is derived according to the degree of risk preference of decision makers, the risk induced by uncertainties and the specific reality.
Although the research on the optimization model of the EFLP in this paper has achieved certain results, there are still many shortcomings, and future research work can be carried out mainly from the following aspects:
(1) The EFLP proposed in this paper only considers the robust location model with emergency rescue mileage as a single objective and does not consider other emergency rescue objectives such as the cost of emergency facility location. The value of the multi-objective location model can be studied in the future.
(2) This paper only considers the uncertainty of the demand point, and other uncertainties, such as the type of disaster and the degree of line damage, also need further studies.
(3) The EFLP proposed in this paper does not consider the vulnerability of railway, so the priority can be given to the construction of emergency facilities on the lines with low vulnerability, so as to improve the safety factor.
(4) In this paper, only the optimization model of elliptic uncertain sets is considered, and other uncertain sets, such as box uncertain sets, are not considered. Two kinds of uncertainty sets can be established for comparison of simulation experiments to verify the advantages of the robust optimization model.
(5) In the future, we can focus on how to meet emergency needs, when emergency facilities operate normally after emergencies but cannot provide emergency services.
Author Contributions
Conceptualization, validation, investigation, data curation, writing—review and editing, Y.W.; conceptualization, methodology, software, validation, writing—original draft preparation and visualization, J.W.; writing—original draft preparation, visualization, writing—review and editing, J.C.; visualization, supervision, writing—review and editing, K.L. All authors have read and agreed to the published version of the manuscript.
Funding
This work was supported by the National Science Foundation of Liaoning Province, China under Grant Nos. 2023-MS-273.
Institutional Review Board Statement
Not applicable.
Informed Consent Statement
Not applicable.
Data Availability Statement
Not applicable.
Conflicts of Interest
The authors declare no conflict of interest.
References
- Heng, W. Ohio Alarmed by Toxic Chemicals. Available online: https://www.chinadaily.com.cn/a/202302/14/WS63eb0ca4a31057c47ebaeb10.html (accessed on 14 February 2023).
- Xu, Y. Discussion on Transportation Management of Railway Dangerous Goods. Transp. Manag. 2018, 1, 283. [Google Scholar] [CrossRef]
- Huang, W.; Shuai, B.; Zuo, B.; Xu, Y.; Antwi, E. A Systematic Railway Dangerous Goods Transportation System Risk Analysis Approach: The 24 Model. J. Loss Prev. Process Ind. 2019, 61, 94–103. [Google Scholar] [CrossRef]
- Huang, W.; Zhang, Y.; Yu, Y.; Xu, Y.; Xu, M.; Zhang, R.; De Dieu, G.J.; Yin, D.; Liu, Z. Historical Data-Driven Risk Assessment of Railway Dangerous Goods Transportation System: Comparisons between Entropy Weight Method and Scatter Degree Method. Reliab. Eng. Syst. Saf. 2021, 205, 107236. [Google Scholar] [CrossRef]
- Cao, Q.; Chen, W.X. Research Review of Emergency Facility Location Problem. Comput. Eng. 2019, 45, 26–37. [Google Scholar] [CrossRef]
- Paul, N.R.; Lunday, B.J.; Nurre, S.G. A Multiobjective, Maximal Conditional Covering Location Problem Applied to the Relocation of Hierarchical Emergency Response Facilities. Omega 2017, 66, 147–158. [Google Scholar] [CrossRef]
- Caprara, A.; Toth, P.; Fischetti, M. Algorithms for the Set Covering Problem. Ann. Oper. Res. 2000, 98, 353–371. [Google Scholar] [CrossRef]
- Lutter, P.; Degel, D.; Büsing, C.; Koster, A.M.C.A.; Werners, B. Improved Handling of Uncertainty and Robustness in Set Covering Problems. Eur. J. Oper. Res. 2017, 263, 35–49. [Google Scholar] [CrossRef]
- Hodgson, M.J.; Rosing, K.E. A Network Location-Allocation Model Trading off Flow Capturing Andp-Median Objectives. Ann. Oper. Res. 1992, 40, 247–260. [Google Scholar] [CrossRef]
- Liu, K.; Sun, X.H. Considering the Dynamic Refueling Behavior in Locating Electric Vehicle Charging Stations. ISPRS Ann. Photogramm. Remote Sens. Spatial Inf. Sci. 2014, 2, 41–46. [Google Scholar] [CrossRef]
- Vaezi, A.; Dalal, J.; Verma, M. Designing Emergency Response Network for Rail Hazmat Shipments under Uncertainties: Optimization Model and Case Study. Saf. Sci. 2021, 141, 105332. [Google Scholar] [CrossRef]
- Soyster, A.L. Technical Note—Convex Programming with Set-Inclusive Constraints and Applications to Inexact Linear Programming. Oper. Res. 1973, 21, 1154–1157. [Google Scholar] [CrossRef]
- Ben-Tal, A.; Nemirovski, A. Robust Convex Optimization. Math. OR 1998, 23, 769–805. [Google Scholar] [CrossRef]
- Mete, H.O.; Zabinsky, Z.B. Stochastic Optimization of Medical Supply Location and Distribution in Disaster Management. Int. J. Prod. Econ. 2010, 126, 76–84. [Google Scholar] [CrossRef]
- Zhang, B.; Peng, J.; Li, S. Covering Location Problem of Emergency Service Facilities in an Uncertain Environment. Appl. Math. Model. 2017, 51, 429–447. [Google Scholar] [CrossRef]
- Roh, S. The Pre-Positioning of Humanitarian Aid: The Warehouse Location Problem. Ph.D. Thesis, Cardiff University, Cardiff, UK, 2012. [Google Scholar]
- Li, C.; Xu, C.; Li, X. A Multi-Criteria Decision-Making Framework for Site Selection of Distributed PV Power Stations along High-Speed Railway. J. Clean. Prod. 2020, 277, 124086. [Google Scholar] [CrossRef]
- Younes, A.; Kotb, K.M.; Abu Ghazala, M.O.; Elkadeem, M.R. Spatial Suitability Analysis for Site Selection of Refugee Camps Using Hybrid GIS and Fuzzy AHP Approach: The Case of Kenya. Int. J. Disaster Risk Reduct. 2022, 77, 103062. [Google Scholar] [CrossRef]
- Xu, W.; Xu, J.; Proverbs, D.; Zhang, Y. A Hybrid Decision-Making Approach for Locating Rescue Materials Storage Points under Public Emergencies. Kybernetes, 2022; ahead of print. [Google Scholar] [CrossRef]
- Taslimi, M.; Batta, R.; Kwon, C. A Comprehensive Modeling Framework for Hazmat Network Design, Hazmat Response Team Location, and Equity of Risk. Comput. Oper. Res. 2017, 79, 119–130. [Google Scholar] [CrossRef]
- Üster, H.; Dalal, J. Strategic Emergency Preparedness Network Design Integrating Supply and Demand Sides in a Multi-Objective Approach. IISE Trans. 2017, 49, 395–413. [Google Scholar] [CrossRef]
- Bababeik, M.; Khademi, N.; Chen, A. Increasing the Resilience Level of a Vulnerable Rail Network: The Strategy of Location and Allocation of Emergency Relief Trains. Transp. Res. Part E Logist. Transp. Rev. 2018, 119, 110–128. [Google Scholar] [CrossRef]
- Gao, H.; Liu, K.; Peng, X.; Li, C. Optimal Location of Fast Charging Stations for Mixed Traffic of Electric Vehicles and Gasoline Vehicles Subject to Elastic Demands. Energies 2020, 13, 1964. [Google Scholar] [CrossRef]
- Li, Q.; Li, M.; Gong, Z.; Tian, Y.; Zhang, R. Locating and Protecting Interdependent Facilities to Hedge against Multiple Non-Cooperative Limited Choice Attackers. Reliab. Eng. Syst. Saf. 2022, 223, 108440. [Google Scholar] [CrossRef]
- Yan, T.; Lu, F.; Wang, S.; Wang, L.; Bi, H. A Hybrid Metaheuristic Algorithm for the Multi-Objective Location-Routing Problem in the Early Post-Disaster Stage. JIMO 2022, 19, 4663–4691. [Google Scholar] [CrossRef]
- Rezaei Ehsan, E. Emergency Response Network Design for Hazardous Materials Transportation with Uncertain Demand. IJIEC 2012, 3, 893–906. [Google Scholar] [CrossRef]
- Hajipour, V.; Fattahi, P.; Tavana, M.; Di Caprio, D. Multi-Objective Multi-Layer Congested Facility Location-Allocation Problem Optimization with Pareto-Based Meta-Heuristics. Appl. Math. Model. 2016, 40, 4948–4969. [Google Scholar] [CrossRef]
- Lu, H.; Li, L.; Zhao, X.; Cook, D. A Model of Integrated Regional Logistics Hub in Supply Chain. Enterp. Inf. Syst. 2018, 12, 1308–1335. [Google Scholar] [CrossRef]
- Tang, Z.; Li, W.; Zhou, S.; Sun, J. Research on Railway Emergency Resources Scheduling Model under Multiple Uncertainties. Appl. Sci. 2023, 13, 4432. [Google Scholar] [CrossRef]
- Huang, W.; Zhang, Y.; Kou, X.; Yin, D.; Mi, R.; Li, L. Railway Dangerous Goods Transportation System Risk Analysis: An Interpretive Structural Modeling and Bayesian Network Combining Approach. Reliab. Eng. Syst. Saf. 2020, 204, 107220. [Google Scholar] [CrossRef]
- Batarlienė, N. Improving Safety of Transportation of Dangerous Goods by Railway Transport. Infrastructures 2020, 5, 54. [Google Scholar] [CrossRef]
- Ebrahimi, H.; Sattari, F.; Lefsrud, L.; Macciotta, R. Analysis of Train Derailments and Collisions to Identify Leading Causes of Loss Incidents in Rail Transport of Dangerous Goods in Canada. J. Loss Prev. Process Ind. 2021, 72, 104517. [Google Scholar] [CrossRef]
- Bekisz, A.; Kowacka, M.; Kruszyński, M.; Dudziak-Gajowiak, D.; Debita, G. Risk Management Using Network Thinking Methodology on the Example of Rail Transport. Energies 2022, 15, 5100. [Google Scholar] [CrossRef]
- Ahmadi-Javid, A.; Seyedi, P.; Syam, S.S. A Survey of Healthcare Facility Location. Comput. Oper. Res. 2017, 79, 223–263. [Google Scholar] [CrossRef]
- Haddad, Y.; Salonitis, K.; Emmanouilidis, C. Design of Emergency Response Manufacturing Networks: A Decision-Making Framework. Procedia CIRP 2021, 96, 151–156. [Google Scholar] [CrossRef]
- Bozkaya, E.; Eriskin, L.; Karatas, M. Data Analytics during Pandemics: A Transportation and Location Planning Perspective. Ann. Oper. Res. 2022, 1–52. [Google Scholar] [CrossRef]
- Huang, W.; Zhang, R.; Xu, M.; Yu, Y.; Xu, Y.; De Dieu, G.J. Risk State Changes Analysis of Railway Dangerous Goods Transportation System: Based on the Cusp Catastrophe Model. Reliab. Eng. Syst. Saf. 2020, 202, 107059. [Google Scholar] [CrossRef]
- Dou, X.; Meng, Q.; Liu, K. Customized Bus Service Design for Uncertain Commuting Travel Demand. Transp. A Transp. Sci. 2021, 17, 1405–1430. [Google Scholar] [CrossRef]
- Diveev, A.I.; Bobr, O.V. Variational Genetic Algorithm for NP-Hard Scheduling Problem Solution. Procedia Comput. Sci. 2017, 103, 52–58. [Google Scholar] [CrossRef]
Disclaimer/Publisher’s Note: The statements, opinions and data contained in all publications are solely those of the individual author(s) and contributor(s) and not of MDPI and/or the editor(s). MDPI and/or the editor(s) disclaim responsibility for any injury to people or property resulting from any ideas, methods, instructions or products referred to in the content. |
© 2023 by the authors. Licensee MDPI, Basel, Switzerland. This article is an open access article distributed under the terms and conditions of the Creative Commons Attribution (CC BY) license (https://creativecommons.org/licenses/by/4.0/).