
Interface Behavior Analysis of Different Geomembrane Liner Systems Based on PIV Techniques
Abstract
:1. Introduction
2. Laboratory Tests
2.1. Devices
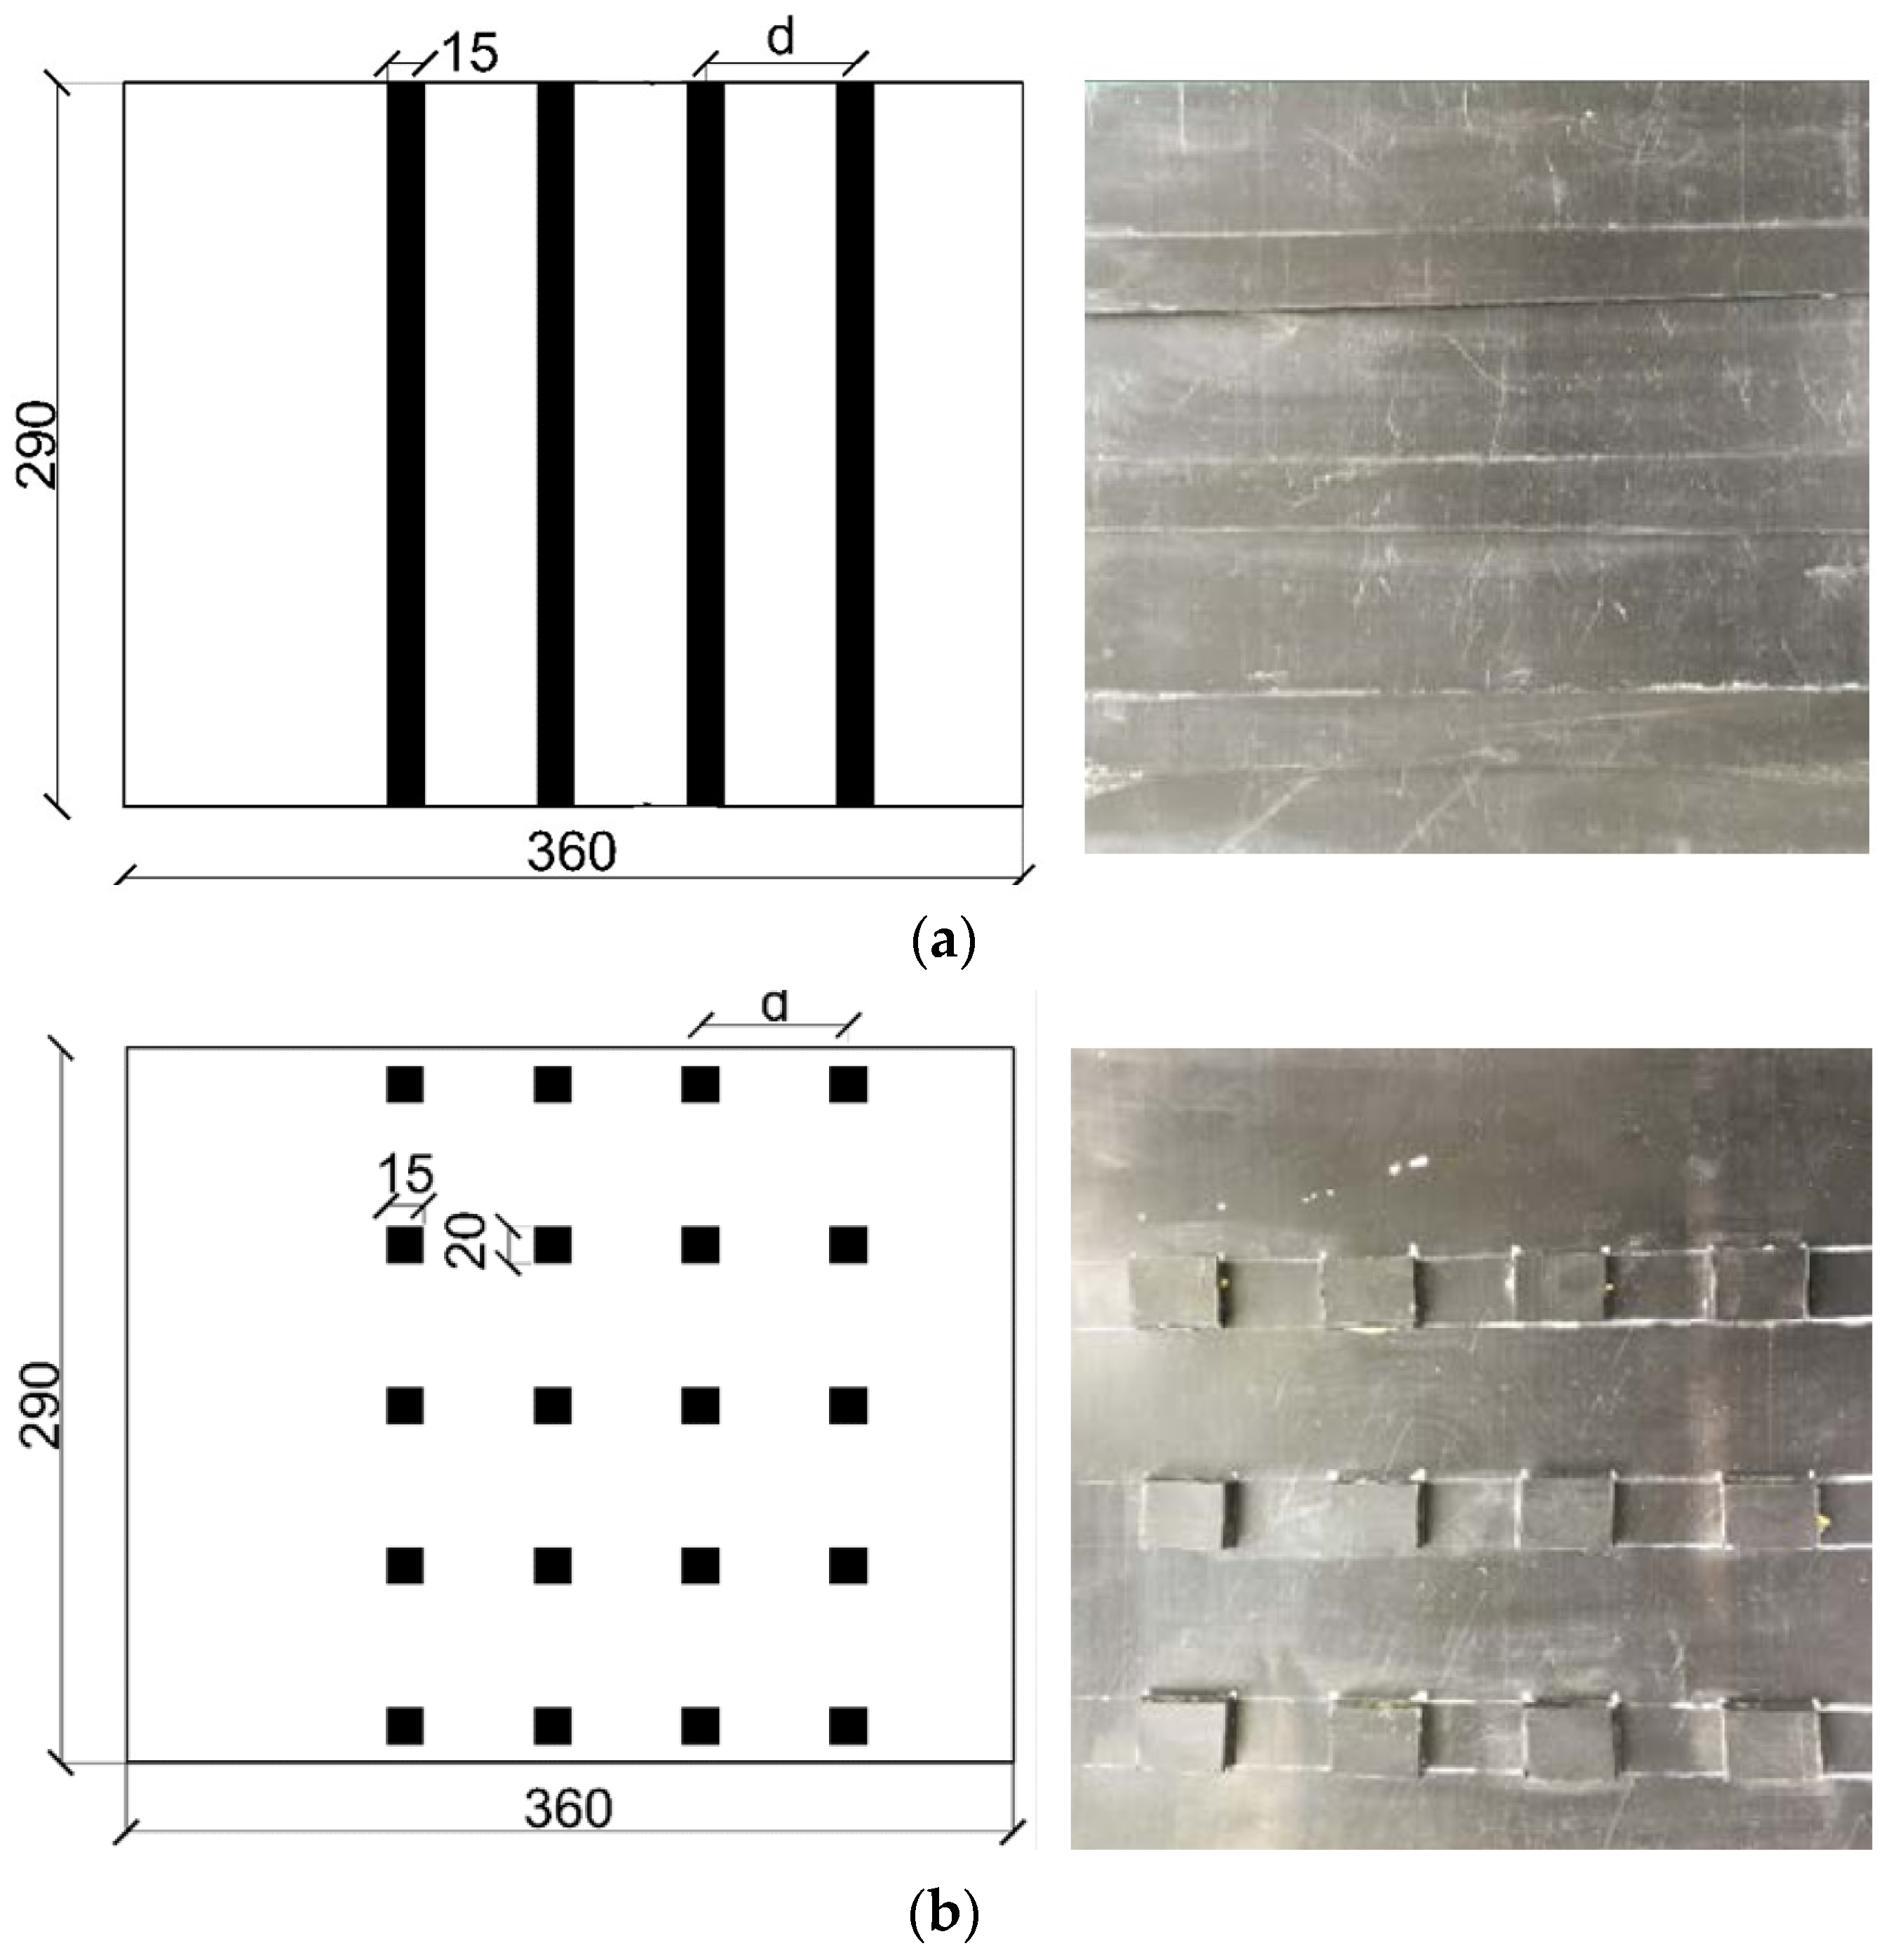
2.2. Materials
2.3. Test Plan
2.4. Test Procedure
3. Results and Discussion
3.1. Model Settlement Analysis
3.2. Model p–s Curve Analysis
3.3. Additional Stress Analysis of Sand
3.4. PIV Image Analysis
3.5. Sand Displacements Analysis of Different Geomembranes
3.6. Analysis of Rib Spacing on Sand Displacements
3.7. Analysis of Rib Height on Sand Displacements
4. Conclusions
- It can be seen from the comparative analysis of working conditions that the settlement of the ribbed geomembrane was significantly less than that of the smooth geomembrane. It was proved that the ribs enhanced the stability of the liner system.
- According to the analysis of the test results, there was an optimum value of 60 mm for the rib spacing and 4.5 mm for the rib height. When the value was less than the optimal value, the ribbed geomembrane could not effectively improve the stability of the liner system. When the value was more than the optimal value, the reinforcing effect of the ribbed geomembrane on the sand gradually decreased.
- By analyzing the additional stress of the sand, it can be concluded that the ribbed geomembrane was beneficial to the stress redistribution, thereby improving the overall stability of the liner system.
- According to the PIV image analysis, the ribbed geomembrane can form an indirect influence area with the sand within a specific range to restrain the displacement of nearby sand particles. The indirect influence area was conducive to the stability of the liner system.
5. Prospect
Author Contributions
Funding
Institutional Review Board Statement
Informed Consent Statement
Data Availability Statement
Conflicts of Interest
References
- Gao, J.L.; Zhang, M.X.; Zhang, W.J. Interface property between sand and reinforced geomembrane. Rock Soil Mech. 2011, 32, 3220–3230. [Google Scholar]
- Bao, C.G. Study on interface behavior of geosynthetics and soil. Chin. J. Rock Mech. Eng. 2006, 25, 1735–1744. [Google Scholar]
- Irsyam, M.; Hryciw, R.D. Friction and passive Resistance in soil reinforced by plane ribbed Inclusions. Géotechnique 1991, 41, 485–498. [Google Scholar] [CrossRef]
- Zhang, M.X.; Zhang, S.L. Behaviour of soil reinforced with H-V inclusions by PFC^2D. Chin. J. Geotech. Eng. 2008, 30, 625–631. [Google Scholar]
- Zhou, J.; Kong, X.L.; Wang, X.C. Bearing capacity behaviours and failure modes of reinforced grounds. Chin. J. Geotech. Eng. 2008, 30, 1265–1269. [Google Scholar]
- Yang, Q.; Zhang, K.; Lua, M.T. Study of model test on performance of soil foundation reinforced by geogrids. J. Dalian Univ. Technol. 2006, 46, 390–394. [Google Scholar]
- Oda, M.; Nemat-Naaser, S.; Konish, J. Stress-induced anisotropy in granular masses. Soil Found. 1985, 25, 85–97. [Google Scholar] [CrossRef] [PubMed]
- Gao, J.L.; Zhang, M.X.; Zhang, W.J. Interface Frictional Property Between Sand and Geomembrane. In Advances in Environmental Geotechnics, Proceedings of the International Symposium on Geoenvironmental Engineering, Hangzhou, China, 8–10 September 2009; Springer: Berlin/Heidelberg, Germany, 2010; pp. 822–827. [Google Scholar]
- Gao, J.L.; Zhang, M.X.; Lin, Y.L.; Qiu, C.C. Analysis of interaction mechanism of reinforced geomembrane and sandy sand interface. Rock Sand Mech. 2012, 33, 2465–2471. [Google Scholar] [CrossRef]
- Gao, J.J.; Xu, H.; Qian, J.W. Settlement Behavior of Soft Subgrade Reinforced by Geogrid-Encased Stone Column and Geocell-Embedded Sand Cushion: A Numerical Analysis. Adv. Civ. Eng. 2022, 2022, 8874520. [Google Scholar] [CrossRef]
- Zhang, M.X.; Zhang, S.L.; Huang, J. Behavior of interface between denti-strip geosynthetic reinforcements and sand under low surcharge. Chin. J. Geotech. Eng. 2007, 29, 1623–1629. [Google Scholar]


| Thickness (mm) | Minimum Density (g/m2) | Breaking Intensity (kN/m) | Puncture Resistance of CBR (kN) | Tearing Strength (kN) |
|---|---|---|---|---|
| 3 | 400 | 12.5 | 2.1 | 0.33 |
| Rib Shape | Rib Spacing d (mm) | Rib Height h (mm) |
|---|---|---|
| Strip rib, block rib, smooth | 50, 60, 80 | 3, 4.5, 6 |
| Test Conditions | Settlement S (mm) | Reduction Δ (%) | ||
|---|---|---|---|---|
| Rib Shape | Rib Spacing d (mm) | Rib Height h (mm) | ||
| Smooth | / | / | 5.39 | / |
| Strip rib | 50 | 3 | 3.63 | 35.25 |
| 4.5 | 3.43 | 36.36 | ||
| 6 | 3.98 | 26.16 | ||
| 60 | 3 | 3.45 | 36.01 | |
| 4.5 | 3.11 | 42.30 | ||
| 6 | 3.41 | 36.73 | ||
| 80 | 3 | 4.25 | 21.15 | |
| 4.5 | 4.3 | 20.22 | ||
| 6 | 4.45 | 17.44 | ||
| Block rib | 50 | 3 | 3.49 | 35.25 |
| 4.5 | 3.41 | 36.73 | ||
| 6 | 4.01 | 25.60 | ||
| 60 | 3 | 3.18 | 41.00 | |
| 4.5 | 2.57 | 52.32 | ||
| 6 | 3.66 | 32.09 | ||
| 80 | 3 | 4.32 | 19.85 | |
| 4.5 | 4.05 | 24.86 | ||
| 6 | 4.67 | 13.35 | ||
Disclaimer/Publisher’s Note: The statements, opinions and data contained in all publications are solely those of the individual author(s) and contributor(s) and not of MDPI and/or the editor(s). MDPI and/or the editor(s) disclaim responsibility for any injury to people or property resulting from any ideas, methods, instructions or products referred to in the content. |
© 2023 by the authors. Licensee MDPI, Basel, Switzerland. This article is an open access article distributed under the terms and conditions of the Creative Commons Attribution (CC BY) license (https://creativecommons.org/licenses/by/4.0/).
Share and Cite
Gao, J.; Wang, J. Interface Behavior Analysis of Different Geomembrane Liner Systems Based on PIV Techniques. Appl. Sci. 2023, 13, 6614. https://doi.org/10.3390/app13116614
Gao J, Wang J. Interface Behavior Analysis of Different Geomembrane Liner Systems Based on PIV Techniques. Applied Sciences. 2023; 13(11):6614. https://doi.org/10.3390/app13116614
Chicago/Turabian StyleGao, Junli, and Jiajun Wang. 2023. "Interface Behavior Analysis of Different Geomembrane Liner Systems Based on PIV Techniques" Applied Sciences 13, no. 11: 6614. https://doi.org/10.3390/app13116614