Review

Laser Cavitation Peening: A Review

1
Department of Finemechanics, Tohoku University, Sendai 980-8579, Japan
2
Institute of Fluid Science, Tohoku University, Sendai 980-8577, Japan
*
Author to whom correspondence should be addressed.
Appl. Sci. 2023, 13(11), 6702; https://doi.org/10.3390/app13116702
Submission received: 24 April 2023 / Revised: 25 May 2023 / Accepted: 29 May 2023 / Published: 31 May 2023

Abstract

:

Featured Application

Laser cavitation peening can be applied to enhance the fatigue strength of metallic materials, including three-dimensional additively manufactured metals (3D metals).

Abstract

During submerged laser peening using a pulsed laser, a bubble that behaves like cavitation is generated after laser ablation (LA). The bubble is referred to as laser cavitation (LC). The amplitude of the shockwave in water generated by LA is larger than that of LC; however, the impact passing through the target metal during LC is larger than that of LA. LC impact can be utilized for peening at optimized conditions. Thus, submerged laser peening is referred to as “laser cavitation peening”, as the peening method using the cavitation impact is known as “cavitation peening”. The impact induced by a hemispherical bubble is more aggressive than that of a spherical bubble with a microjet. Laser cavitation peening can improve the fatigue strength of metallic materials by producing work-hardening and introducing compressive residual stress. Three-dimensional additively manufactured metals (3D metals) such as titanium alloy are attractive materials for aviation components and medical implants; however, the fatigue strength of as-built components is nearly half of that of bulk metals, and this is an obstacle for the applications of 3D metals. In the present study, published research papers are reviewed to identify the key factors of laser cavitation peening, with additional visualization of LC and data. Then, improvements in the fatigue strength of metallic materials, including 3D metals treated by laser cavitation peening, are summarized.

1. Introduction

In order to establish a sustainable society, improvements in the life and reliability of machine components are required to save energy and resources. Mechanical surface treatments such as shot peening comprise one of most powerful methods to increase fatigue life and strength [1]. In addition, three-dimensional additively manufactured metallic materials (3D metals) are attractive metals for medical implants [2] and aviation components [3], as the components are directly formed from CAD/CAM data. However, the fatigue strength of 3D metals is almost half of that of wrought metals [3], and improving the fatigue strength of 3D metals is a serious issue with respect to their practical use. Laser peening [4,5] and cavitation peening [6] are newly developed methods used to improve the fatigue properties of metallic materials. One of the reasons for the weak fatigue strength of 3D metals is their extremely large surface roughness due to unmelted metal particles on the surface. As laser ablation smoothens the surface of 3D metals and laser shock introduces compressive residual stress and work hardening, laser peening can improve the fatigue properties of metallic materials, including 3D metals [7,8,9,10].
With respect to laser peening, also known as laser shock peening, there are three methods. In the first method, a pulsed laser is irradiated to a target surface that is covered with a water film [4]. In the second method, the target is placed in water and a pulsed laser is applied to the target surface, i.e., submerged laser peening [11]. In these two types of laser peening, water or a confinement layer [12] is required. In the third method, dry laser peening is carried out without a confinement layer using a femtosecond pulsed laser [13,14]. For all three laser-peening methods, including submerged laser peening, it has been hypothesized that the peening mechanism that introduces local plastic deformation on the metal surface is caused by laser ablation [15]. Namely, it is thought that the inertial force caused by the shockwave is contained by the water, and this produces plastic deformation in metallic materials [4,15]. In the case of submerged laser peening, a bubble that behaves like a cavitation bubble is generated after laser ablation, and this is known as laser cavitation [16,17]. In previous studies, when the amplitude of the pressure wave in the water was measured using a shockwave sensor that was placed in the water, the amplitude of laser ablation was larger than that during laser cavitation collapse [18,19,20]. However, in another study, when the impact force passing through the target metal was measured using an impact sensor with a polyvinylidene fluoride PVDF film [21], the impact during laser cavitation collapse was larger than that during laser ablation [16,19,20]. Cavitation bubble oscillation during submerged laser peening has also been investigated, and it was concluded that the first bubble oscillation was effective for the submerged laser peening [22]. The introduction of compressive residual stress and the work-hardening of aluminum alloys has also been demonstrated using laser cavitation [23]. These results reveal that laser cavitation impact can be utilized for peening.
Cavitation peening, in which cavitation bubble collapse impacts are used for peening, has been developed [6], and it has been applied for mitigation of the stress corrosion cracking of nuclear power plants [24]; there are also reports that show improvements in the fatigue strength of metallic materials, including 3D metals [6]. In the case of conventional cavitation peening, cavitation is generated by injecting a high-speed water jet into water, i.e., a cavitating jet [6]. The peening mechanism using a cavitating jet is different from that of water jet peening, in which water-column impacts are used for peening [25]. The peening intensity using a cavitating jet under optimum conditions was shown to be more effective than that of a water jet [6]. Thus, it is worthwhile to use the impact at cavitation collapse for peening. As mentioned above, as submerged laser peening can use the impact of the laser cavitation collapse, it is a type of cavitation peening that uses laser cavitation [6]. Therefore, it can be referred to as laser cavitation peening. It is thought that the inertial force of water confines the shockwave generated by the plasma, which is caused by laser ablation, and produces local plastic deformation on the material surface. Impact at laser cavitation collapse is also useful to produce local plastic deformation.
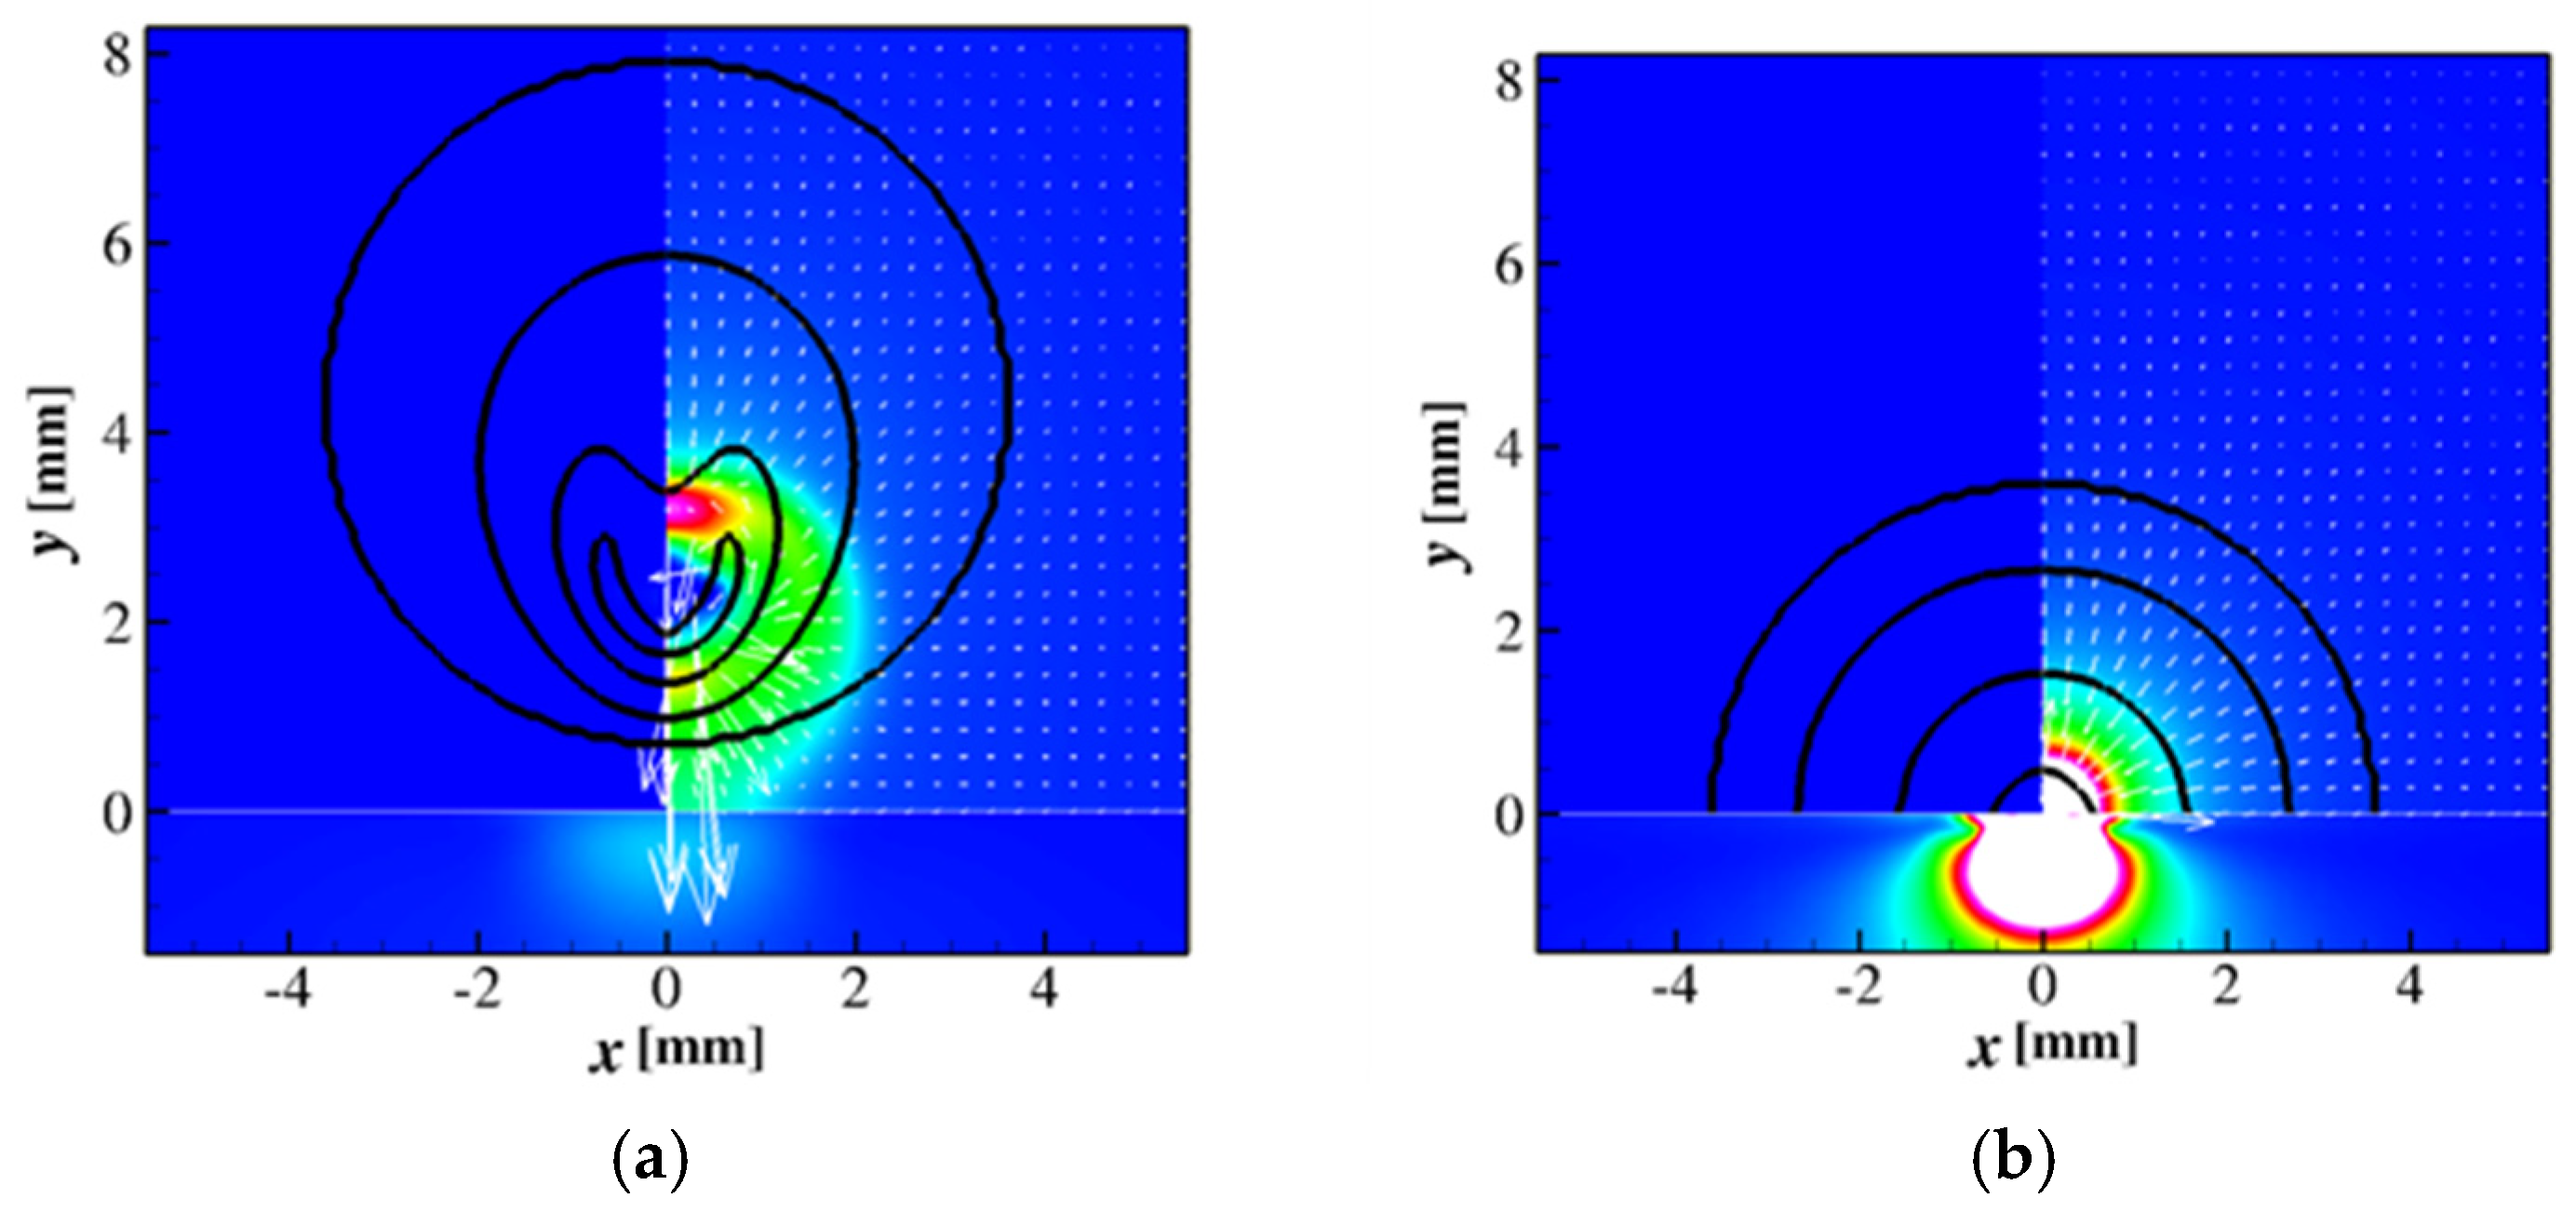
The collapse of a spherical cavitation bubble near a solid boundary in water was computed by Plesset and Chapman [26] (see Figure 1), and then the deformation of the bubble was experimentally observed using high-speed photography at a framing rate of 300,000 frames/s [27]. A microjet in a cavitation bubble was also clearly identified by Crum [28]. Microjets and shockwaves have been attractive phenomena for researchers and engineers and are important for understanding bubble dynamics [29] and sonochemistry [30]. The microjet in a cavitation bubble is still an attractive phenomenon for researchers [31,32,33,34]. As shown in Figure 1, the development of a microjet in a spherical cavitation bubble is an interesting phenomenon, and some researchers believe that the microjet during cavitation bubble collapse can be utilized for peening. It has been demonstrated numerically, using fluid/material-coupled numerical simulations, that the pressure produced by the collapse of a hemispherical bubble is much stronger than that of microjet-type collapse, as shown in Figure 2 [35]. In Figure 2, the black line shows the shape of the bubble changing with time, and the color contour reveals the pressure in the fluid and the equivalent stress in the material at bubble collapse. Although the microjet during the bubble collapse generates a pressure wave of ≈100 MPa, the collapse of the hemispherical bubble produces pressure waves several times larger than those of the microjet. Thus, a hemispherical bubble should be used for laser cavitation peening. Note that the pressure induced by a flattened bubble, i.e., a pancake-type bubble, or a longitudinal bubble is weaker than that of a hemispherical bubble [35].
In order to use cavitation peening to enhance the fatigue properties of metallic materials, knowledge of fluid dynamics is required [6], as cavitation is a hydrodynamic phenomenon. Thus, in the present review, to clarify the mechanism of laser cavitation peening, the effectiveness of the laser cavitation impact for peening is explained using published papers, with additional observations with respect to laser cavitation by using a high-speed video camera. The peening intensity was also evaluated by measuring arc height and the introduced compressive residual stress. The effect of the bubble shape is discussed experimentally and numerically, and comparisons are made between a hemispherical bubble and a bubble with a microjet. Key factors with respect to laser cavitation peening are also summarized. Finally, improvements in the fatigue properties of metallic materials, including 3D metals, are demonstrated.

2. Peening Using a Pulsed Laser

2.1. Laser Peening Underwater (Laser Cavitation Peening) and Laser Peening with a Water Film

As described in the introduction, three peening methods using a pulse laser have been developed: laser peening underwater [11,15,16,17,20], laser peening with a water film [4,12,36,37], and dry laser peening [13,14]. As shown in Figure 3, for both conventional laser peening underwater and laser peening with a water film, it is thought that the inertial force of water confines the shockwave generated by the plasma, which is caused by laser ablation, and produces local plastic deformation on the material surface. Normally, a sacrificial overlay such as paint or tape is used for laser peening with a water film, but this is not required for laser peening underwater.
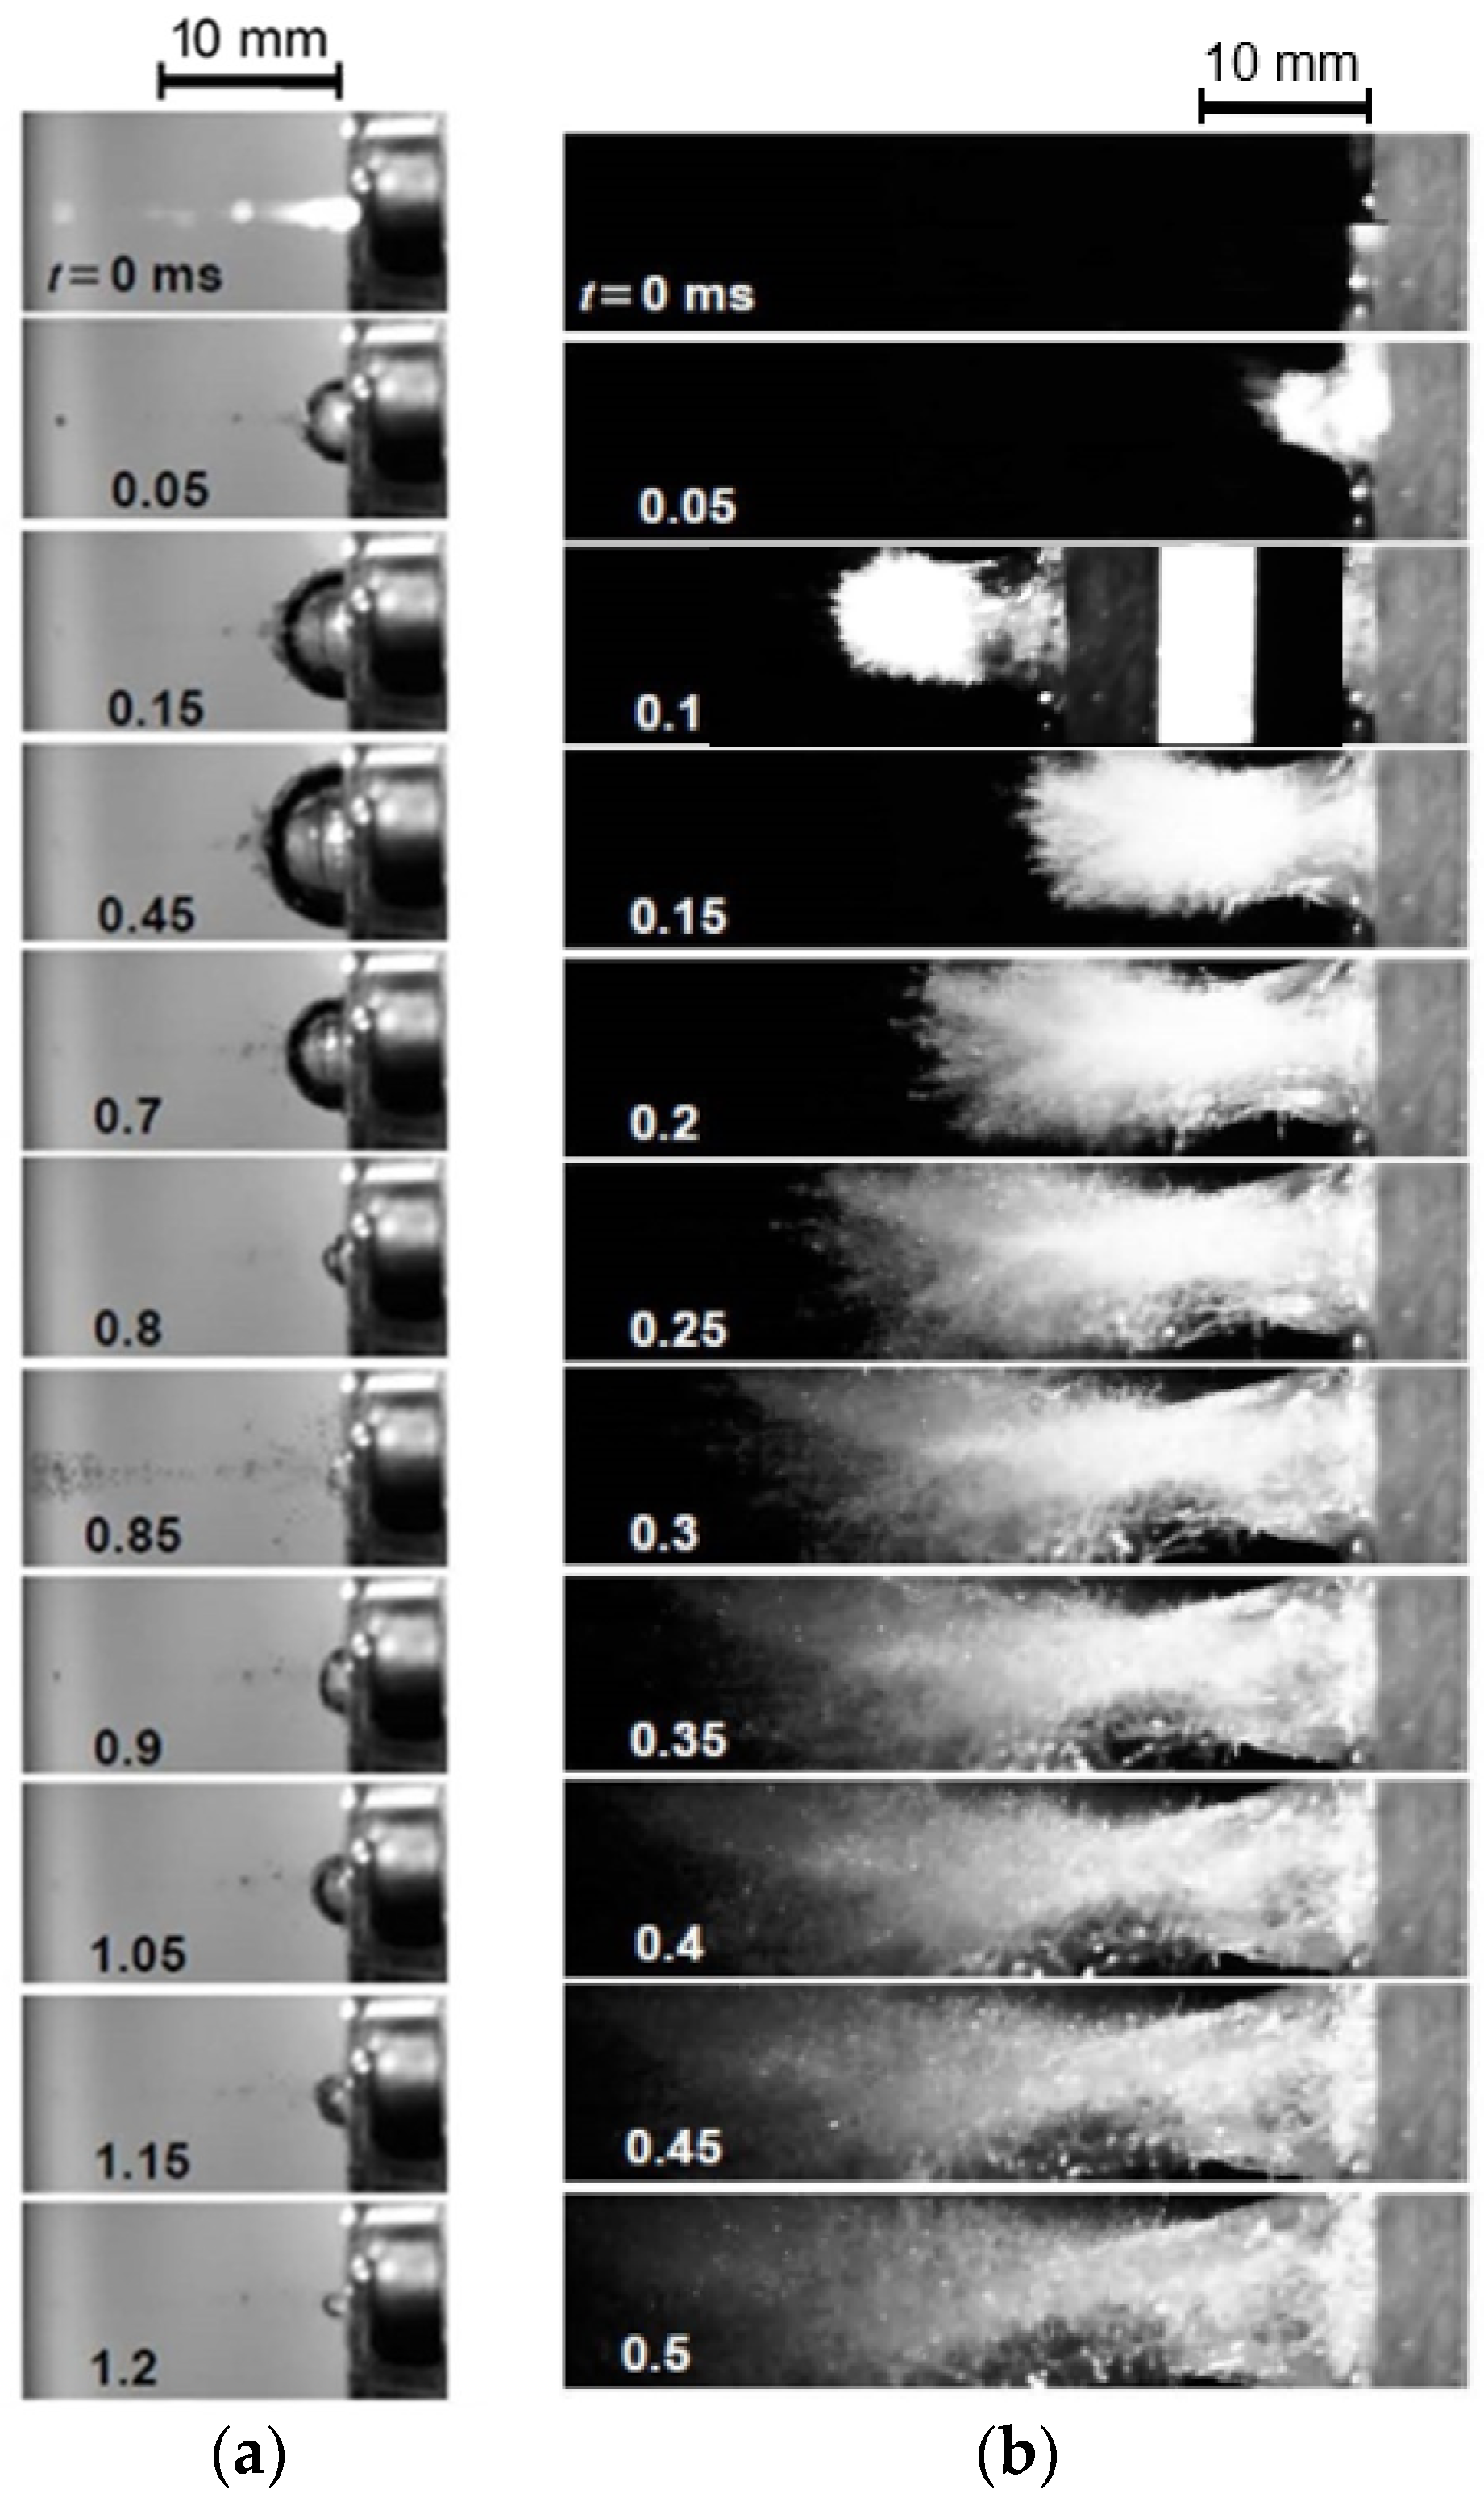
Figure 4 shows images of laser peening for (a) laser peening underwater (laser cavitation peening) and (b) laser peening with a water film [6]. The images were obtained by a high-speed video camera at 20,000 frames per second, i.e., a sampling time of 0.05 ms, and the typical images were chosen. For Figure 4a, an optical light was placed on the other side of the camera, then the bubble was shown by a shadow photograph. The light was set at the same side of the camera to take the images in Figure 4b. In the case of laser peening with a water film, the water film was splashed away, as shown in Figure 4b. However, during laser peening underwater, a bubble was initiated after laser ablation (t = 0 ms) and developed, then collapsed (t = 0.85 ms), as shown in Figure 4a. As the bubble was induced by a pulsed laser, this process is known as laser cavitation, and it behaves like a cavitation bubble. As mentioned later, the impact at the collapse of the laser cavitation can be utilized for peening; the same situation applies for the laser ablation impact. Peening methods using laser cavitation are known as laser cavitation peening. The laser cavitation impact is larger than that of the laser ablation impact under optimized laser cavitation peening conditions.

2.2. Laser Cavitation Peening System

In order to illustrate laser cavitation peening systems, Figure 5 shows a schematic diagram of a laser cavitation peening test section. A target was placed in a water-filled glass chamber. A pulsed laser from a laser source was expanded using a concave lens, then focused on the target surface using a convex lens(es) to avoid damage to the glass of the chamber. The standoff distances in air sa and water sw were optimized by measuring the peening intensity with sa and sw. During conventional submerged laser peening, the second harmonic of an Nd:YAG laser, i.e., a wavelength of 532 nm, is used in order to avoid absorption in the water [5]. However, from the point of view of the generation of cavitation bubbles, the fundamental harmonic, i.e., 1064 nm, is more beneficial, since the heat is more concentrated; researchers who have investigated cavitation bubbles using pulsed lasers have used Nd:YAG lasers [38]. A total of 40% of the pulse energy at 1064 nm is lost to obtain 532 nm during wavelength conversion. It was reported that the laser cavitation induced by a 1064 nm pulsed laser introduced compressive residual stress into hard metals such as alloy tool steel, when the standoff distance in water was optimized [39]. Recently, a portable submerged laser peening system using a pulsed laser with a wavelength of 1064 nm was developed [40]. In order to measure the pressure and/or impact caused by the laser ablation and laser cavitation collapse, a submerged shockwave sensor, a hydrophone, and a PVDF sensor were used. As the cavitation impact energy can be obtained using an AE sensor and/or a laser Doppler vibrometer [41], these can be useful for measuring and/or monitoring the peening intensity of laser cavitation peening. During submerged laser peening, peening with and without a sacrificial overlay can be carried out. In both cases, as a number of small particles are produced during laser ablation, feeding with water is required to remove contamination. We discuss water quality later in this paper. Thus, the fundamental harmonic, i.e., a wavelength of 1064 nm, was used to generate laser cavitation during the additional experiment.

3. Comparison between Laser Ablation and Laser Cavitation

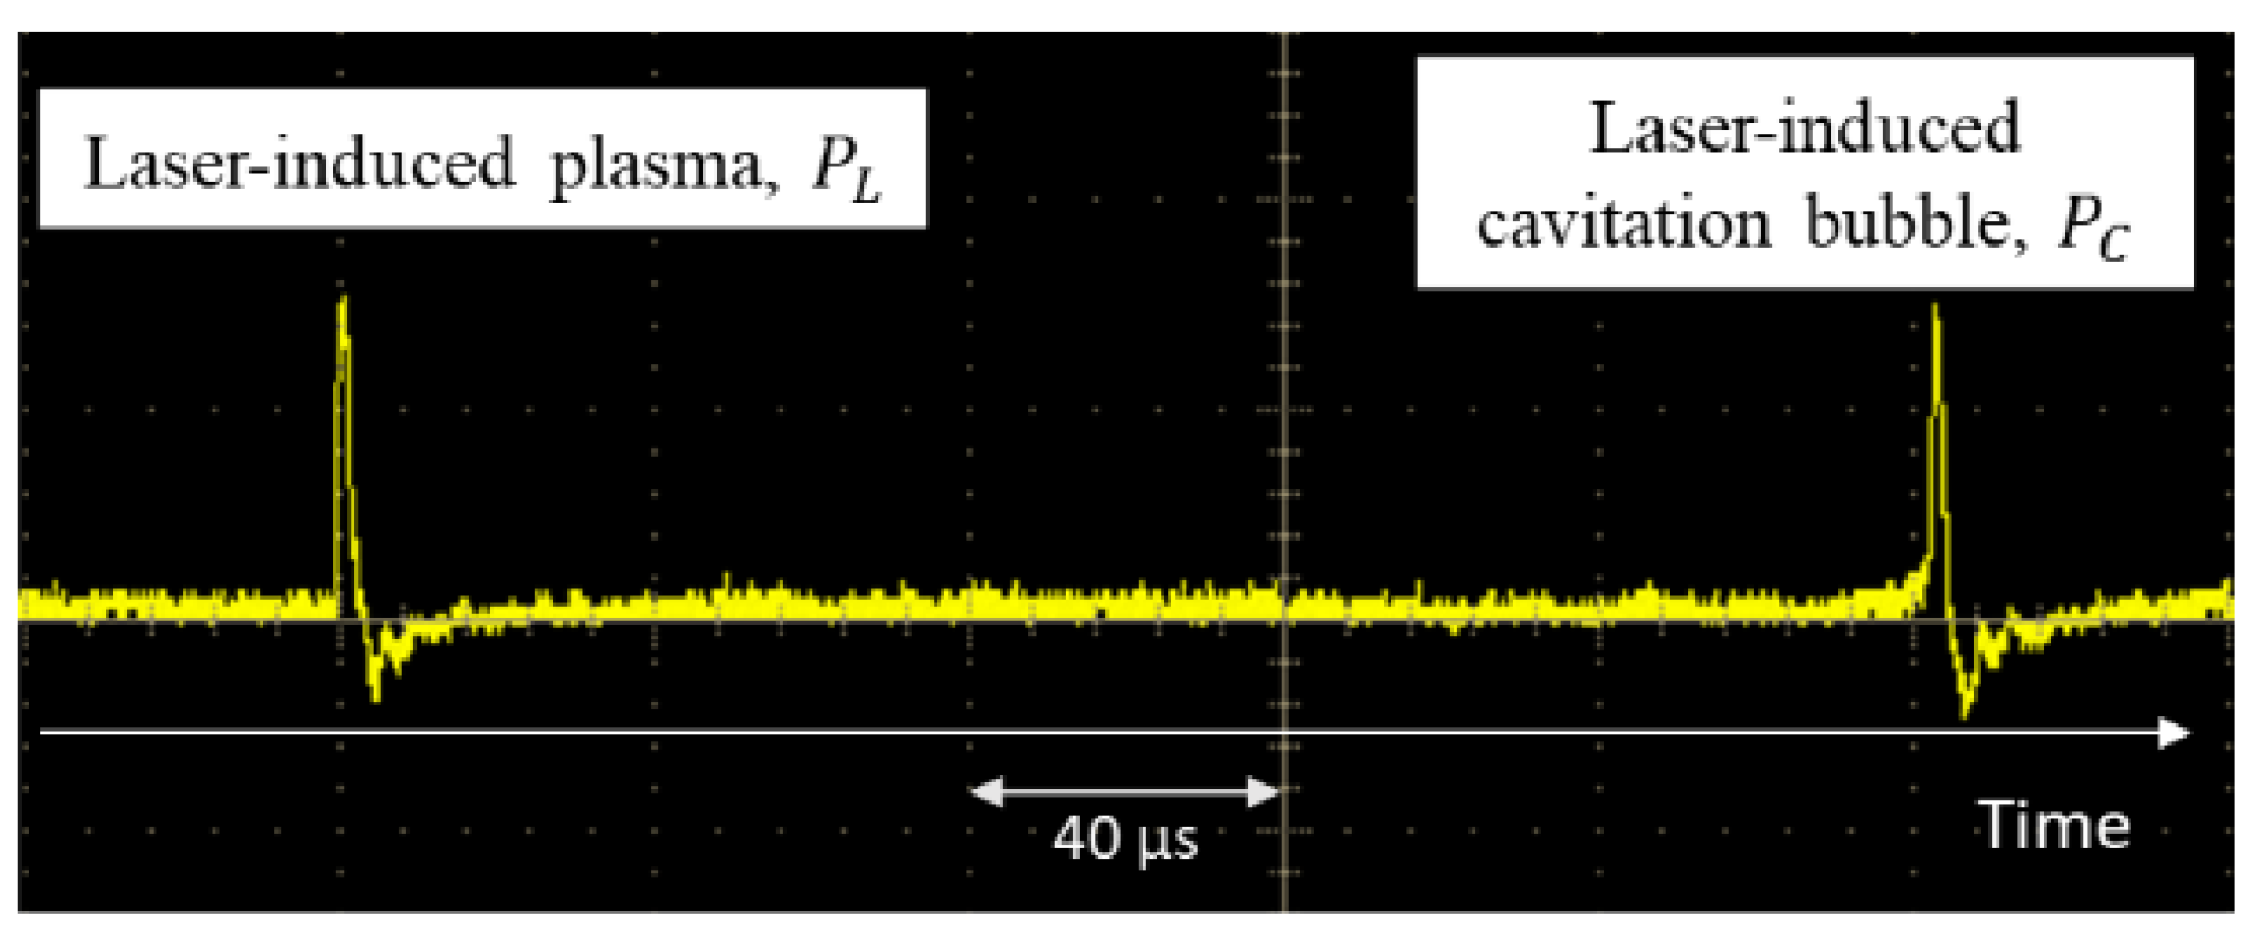
As it has been hypothesized that the laser ablation impact is used for submerged laser peening, we compared the pressures and/or impacts produced by laser ablation and laser cavitation collapse. Figure 6 shows (a) images of laser ablation, (b) the signal from the target from a PVDF sensor placed in the target, and (c) the signal from a shockwave sensor in the water [20]. At t = 0 ms, both the PVDF sensor in the target and the submerged shockwave sensor detected a pulse-like amplitude increase, which was caused by the laser ablation. After laser ablation, a bubble was initiated and developed, then shrunk as in Figure 4a. When the bubble collapsed at t ≈ 1 ms, both the PVDF sensor and the submerged shockwave sensor detected another pulse-like amplitude increase. When the amplitudes induced by the laser ablation and the laser cavitation collapse were compared, the amplitude of the laser cavitation collapse, measured using the PVDF sensor, was larger than that of the laser ablation. However, the amplitude detected by the submerged shockwave sensor with respect to laser cavitation collapse was smaller than that of the laser ablation, the same as in a previous report [18]. The secondary collapse of the bubble at t ≈ 1.5 ms was detected by the PVDF sensor, but it was not detected by the submerged shockwave sensor. It was suggested that the PVDF sensor could evaluate the impact more accurately than the submerged shockwave sensor. When glycerol was used for the plasma confinement layer, the amplitude of the signal from a PVDF sensor during laser ablation was nearly equivalent to that of the laser cavitation collapse (see Figure 7).
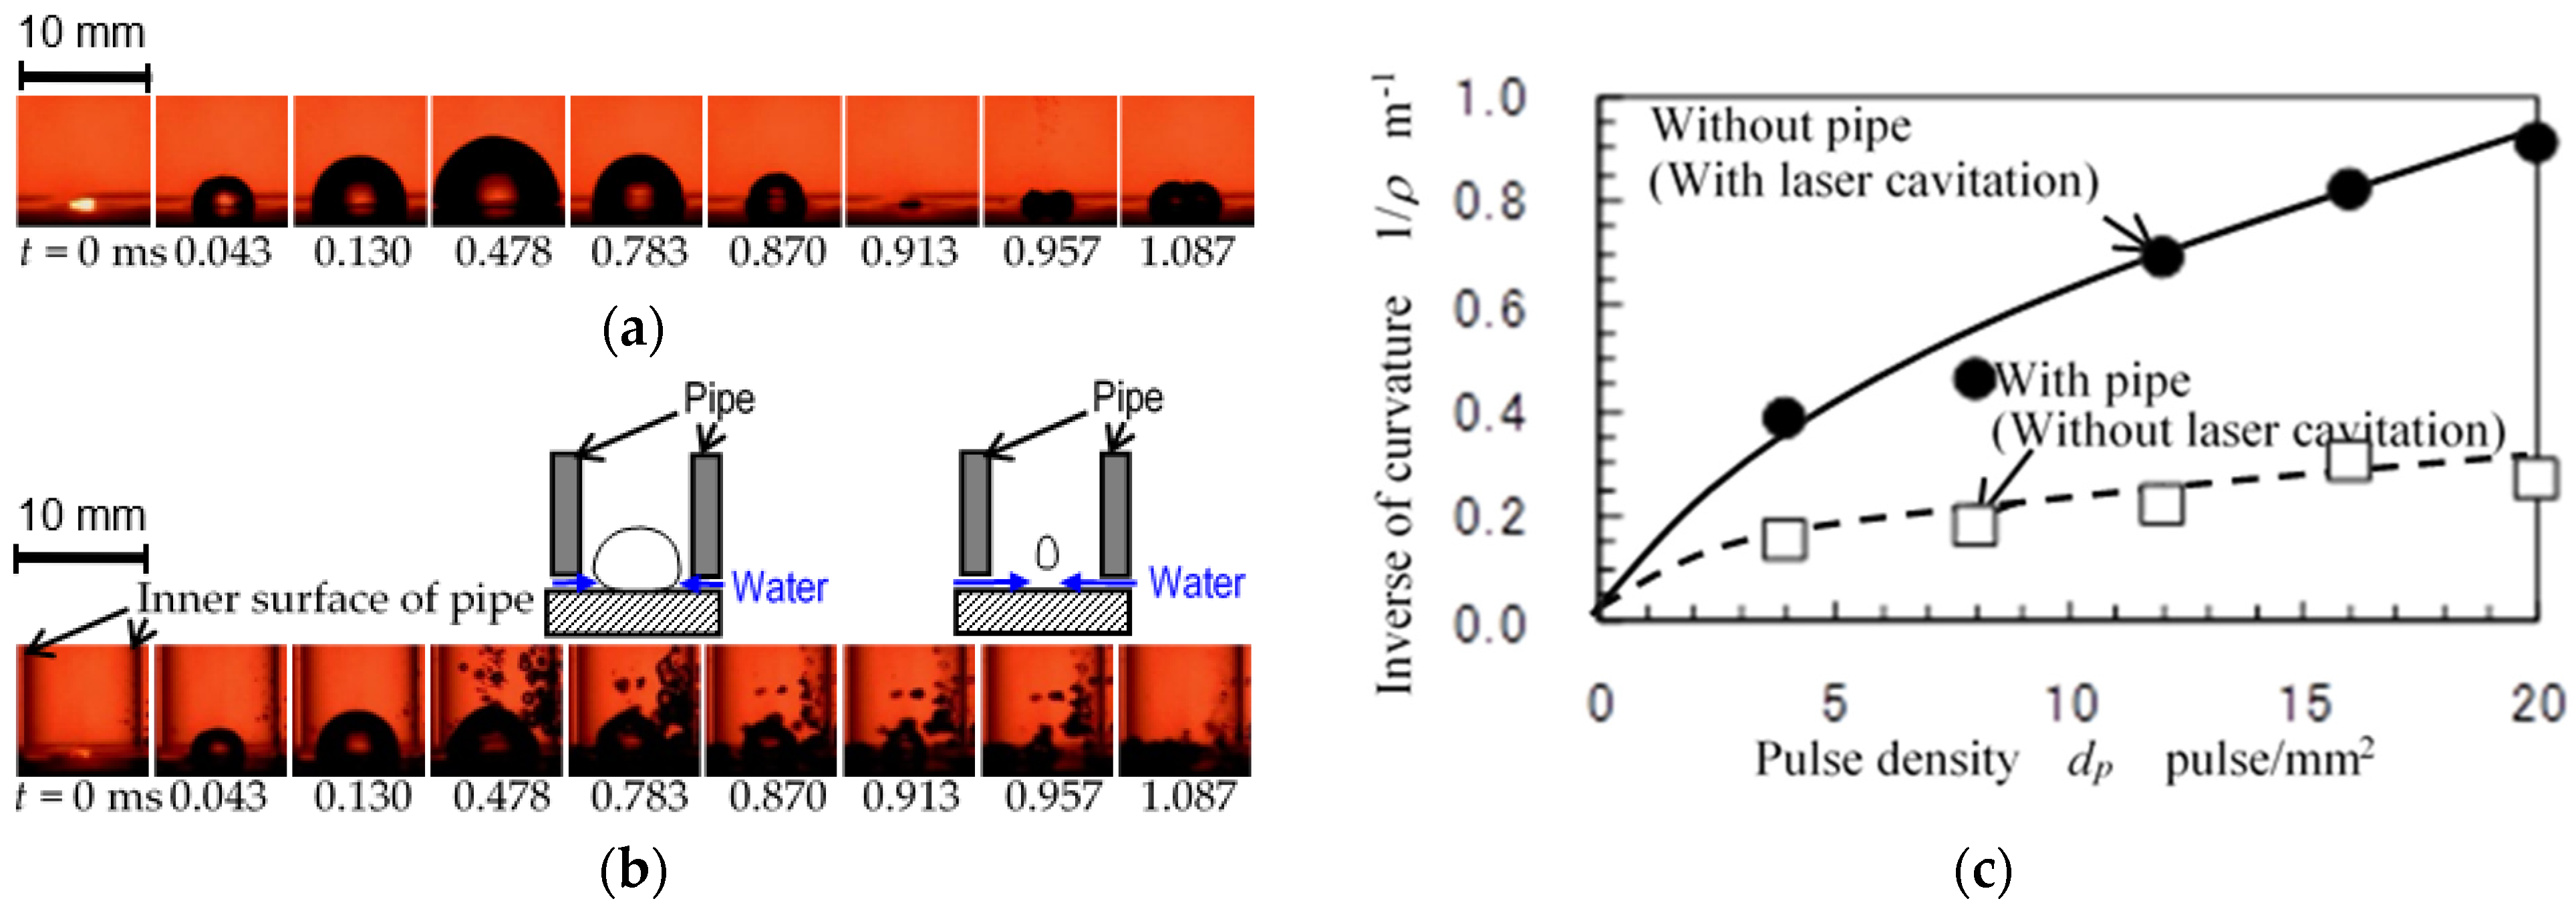
As a cavitation bubble collapse can be controlled by boundary conditions around the bubble, in one study, a pipe was placed near a target plate around the focus point and the arc height of the target plate was measured [43]. The arc height has been used for the measurement of the peening intensity [44,45]. The inverse of curvature can be calculated from the arc height, and it is proportional to the arc height [46]. In Figure 8a, the target plate without a pipe was peened using submerged laser peening; both the laser ablation impact and laser cavitation collapse were used in Figure 8a and without a pipe in Figure 8c. However, a pipe was placed near the target plate around the focus point and peened in Figure 8b. As shown in the schematic above Figure 8b, when the pipe was placed near the wall, the bubble moved upwards and collapsed in the water rather than on the target surface. Thus, the peening intensity, i.e., the inverse of the curvature with the pipe, was nearly half of that without the pipe, as only the laser ablation impact was used; the laser cavitation collapse impact was not used during the peening with the pipe. It can be concluded that both the laser ablation impact and laser cavitation collapse impact are used during conventional submerged laser peening, as one pulsed laser hits the surface twice. Regarding another important paper [47], during optimized laser cavitation peening, the laser cavitation collapse impact energy was 2.2 times larger than that of laser ablation.

4. Key Factors of Laser Cavitation Peening

4.1. Overview of Key Factors of Laser Cavitation Peening

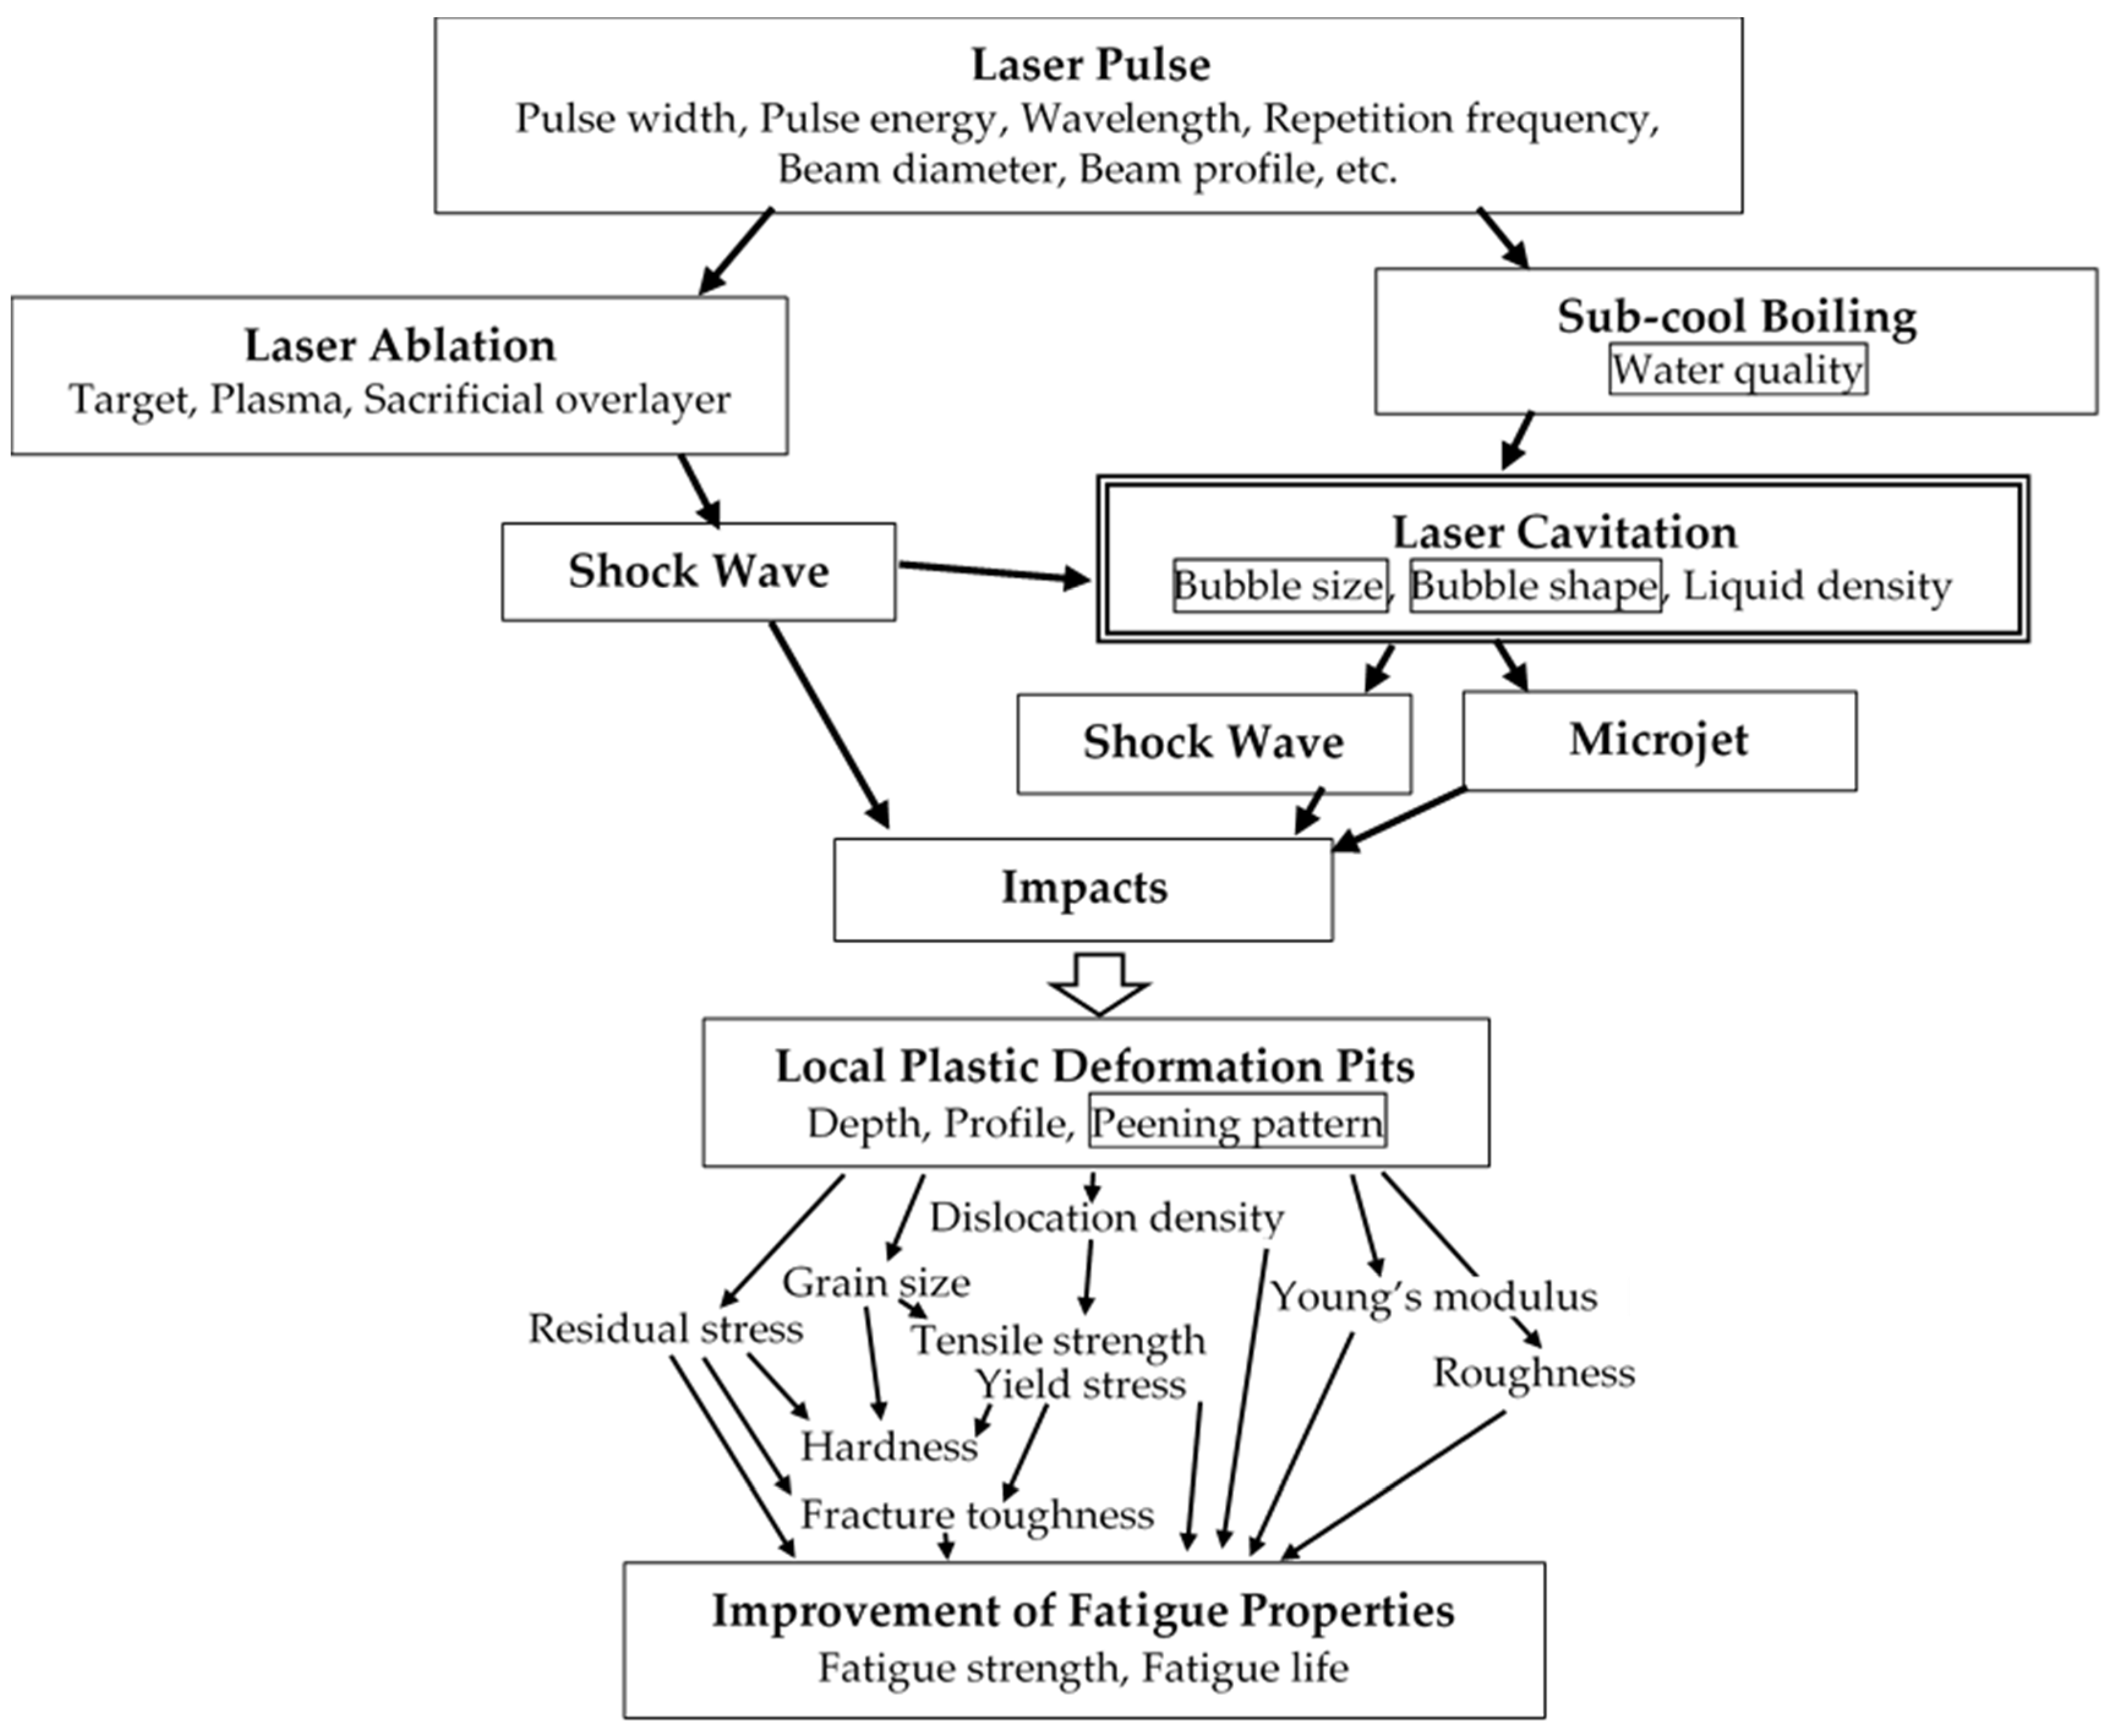
Figure 9 reveals an overview of the mechanisms and key factors of laser cavitation peening. When a laser pulse with a pulse width of several nanoseconds is irradiated to a target, laser ablation is generated, and laser ablation produces a shockwave; then, the shockwave initiates a bubble, i.e., laser cavitation. A laser pulse with a pulse width of several hundred microseconds also generates laser cavitation due to subcooled boiling [48,49]. In terms of the phase change phenomenon from the liquid phase to the gas phase, this is affected by the characteristics of the liquid. The effect of the liquid was investigated in a previous study using pure water, glycerol, liquid paraffin, and silicone oil, and it was reported that the highest stress was observed in water [50]. The shockwave and the microjet of the laser cavitation produce the impacts, as well as the shockwave induced by the laser ablation. These impacts produce local plastic deformation pits on metallic materials. The local plastic deformation pits change the material properties, such as the residual stress, hardness, yield stress, tensile strength, dislocation density, grain size, Young’s modulus, roughness, fracture toughness, etc. The compressive residual stress and the work-hardening introduced by laser cavitation peening can improve fatigue strength and fatigue life. It has been reported that laser cavitation peening reduces crack initiation and crack propagation [51].
To generate a laser pulse, several laser systems are available. The main parameters of laser systems are pulse width, pulse energy, wavelength, repetition frequency, beam diameter, etc. In a conventional laser cavitation peening system, the pulse width is several ns, the pulse energy is several hundred mJ, the wavelength is 532 nm or 1064 nm [16,20], the repetition frequency is 10–200 Hz [40], and the beam diameter is about a few mm before focusing. The effects of the pulse energy and the wavelength were discussed in a previous paper [16].
In the present review, the main factors related to laser cavitation collapse impact, such as bubble size, bubble shape, and water quality, are summarized. The effect of peening patterns is also discussed.

4.2. Bubble Size

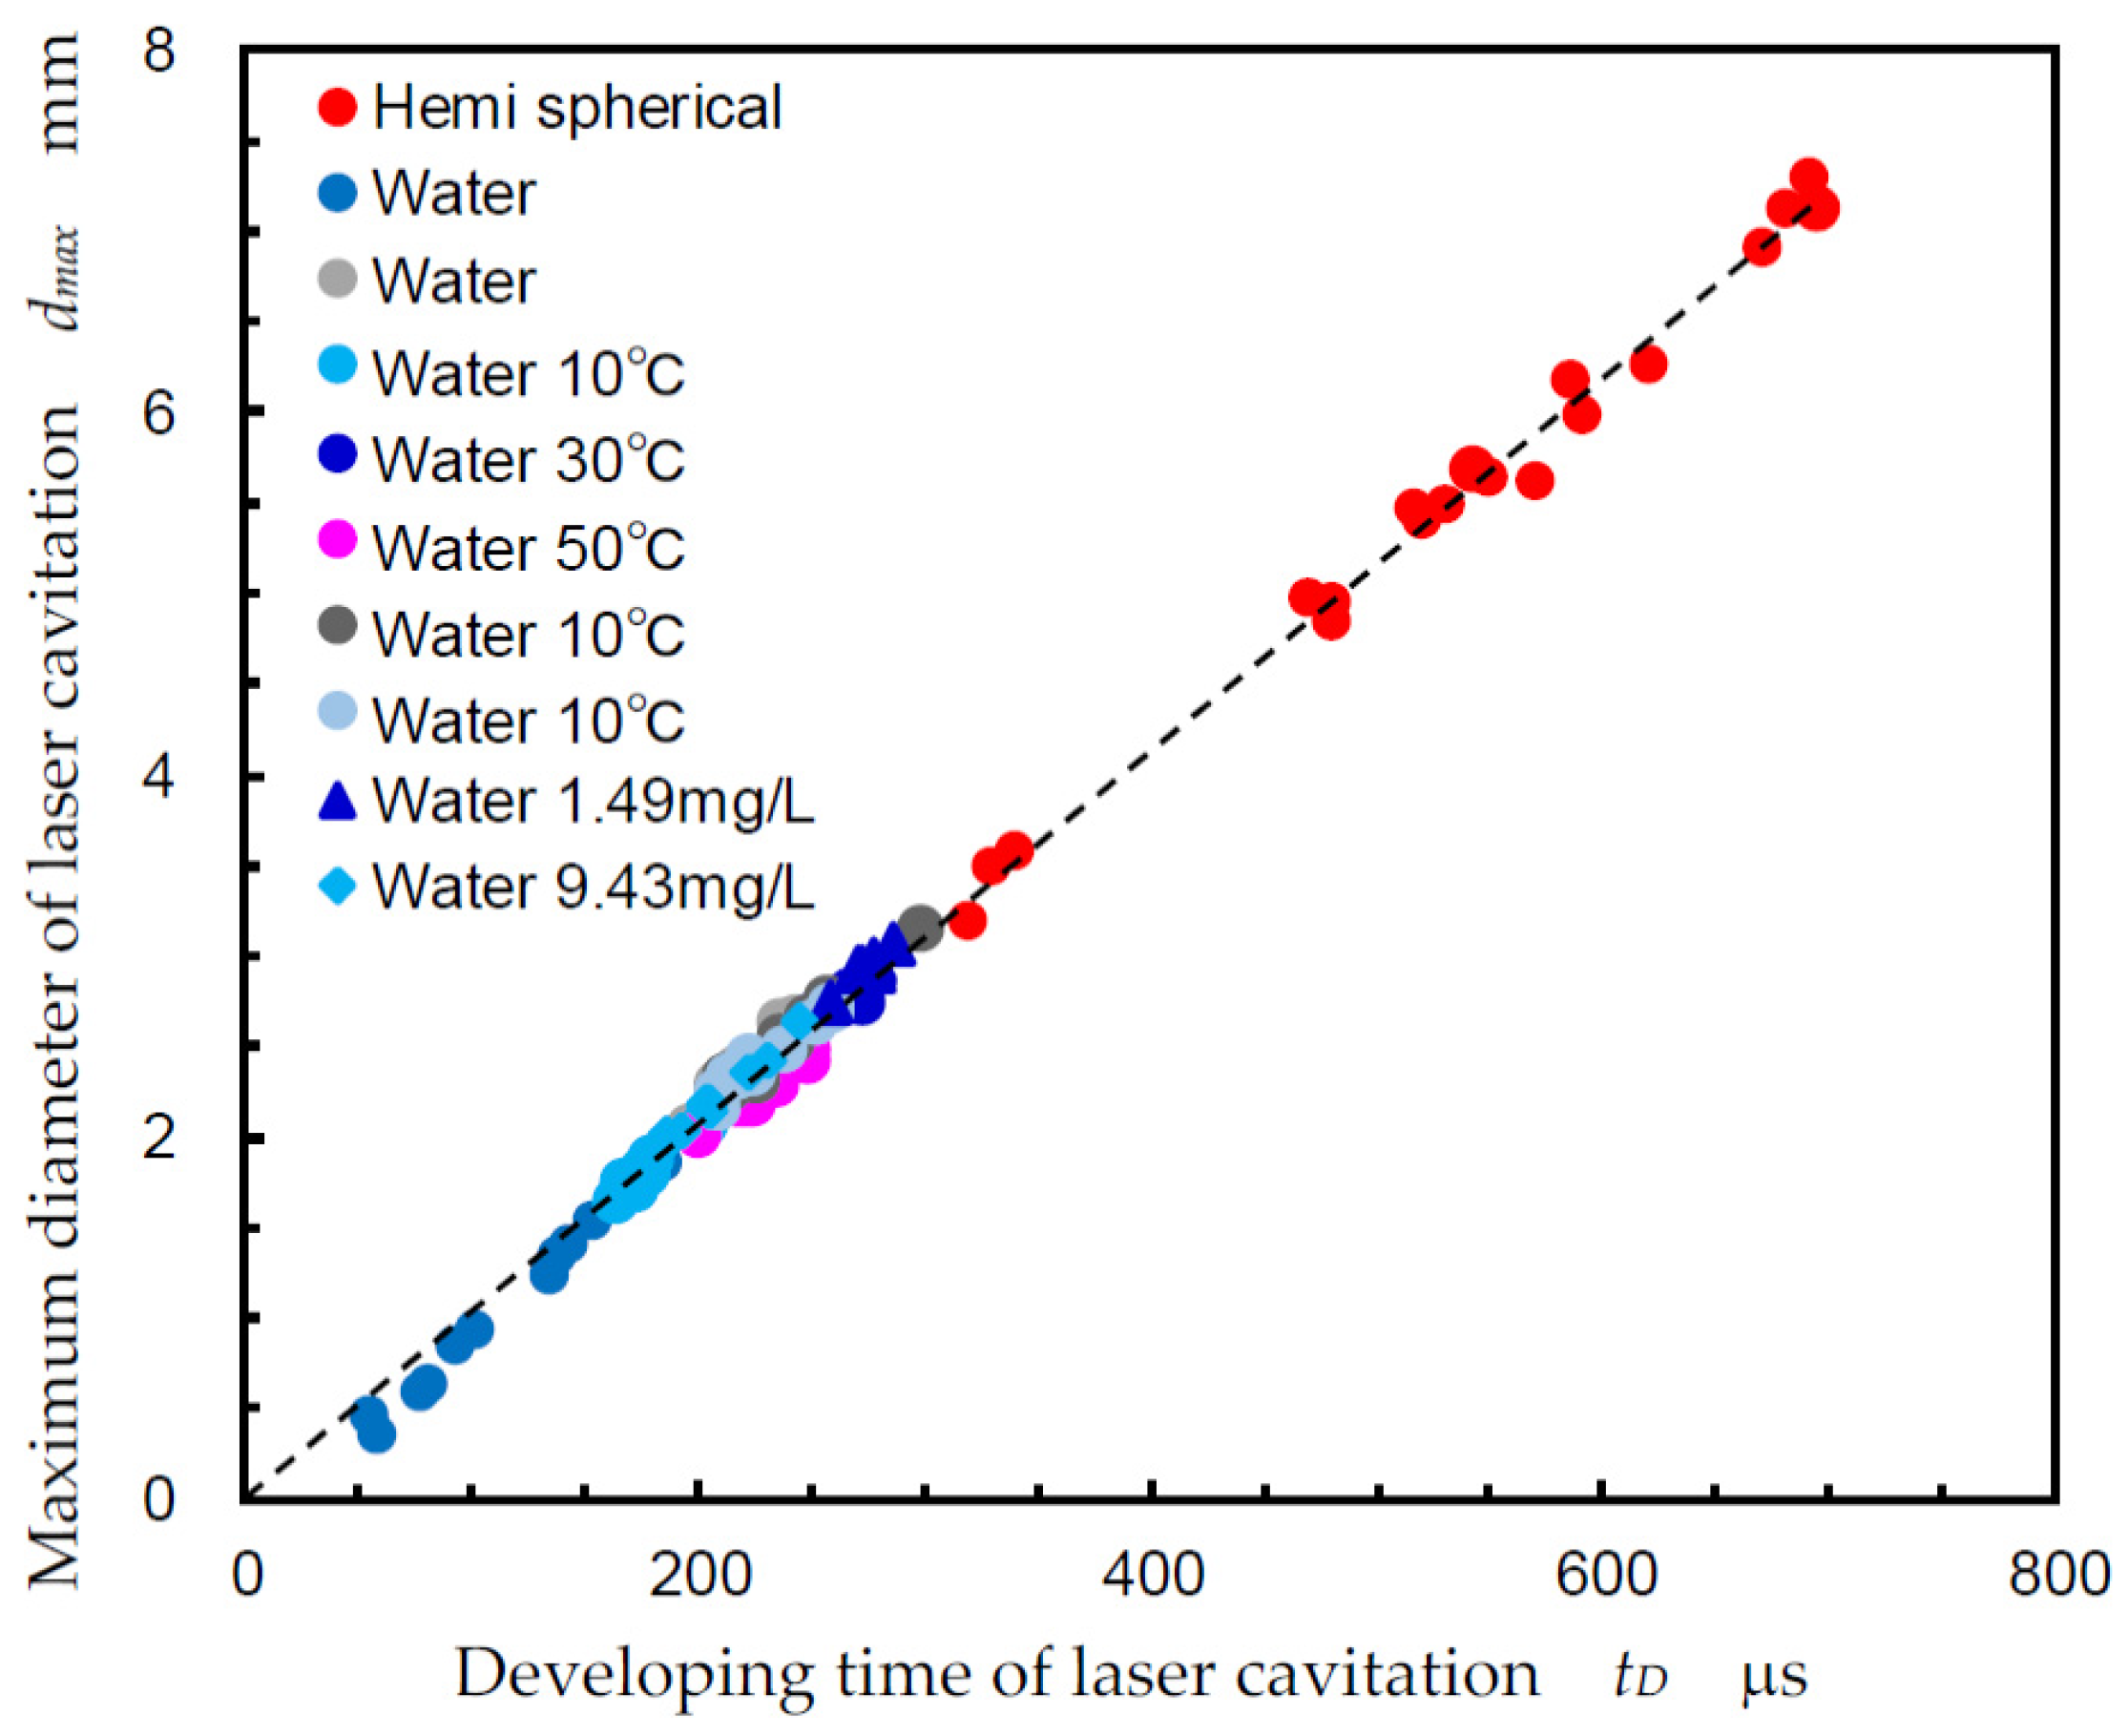
As a larger bubble produces a larger impact during cavitation bubble collapse [52,53,54,55], the most important factor of laser cavitation peening is the bubble size. In order to demonstrate the monitoring of bubble size, Figure 10 shows the relationship between the developing time, tD, and the diameter of laser cavitation, dmax [16]. In Figure 10, the red circles show the data with respect to the hemispherical bubble and the other circles indicate the spherical bubble. tD is defined as the time from laser ablation to the first collapse of the laser cavitation. For example, this was approximately 1 ms in the case of Figure 6. The dmax was evaluated using a high-speed video camera (see Figure 6a). Figure 10 was obtained by changing the laser pulse energy. As shown in Figure 10, dmax [mm] is proportional to tD [µs] and the relation is described in Equation (1), including both spherical and hemispherical bubbles [16].
d m a x [ m m ] = 0.0103   t D   [ μ s ]
Regarding Rayleigh [56], the collapse time, tc, for a bubble from radius, R0, to collapse is given by Equation (2).
t c = 0.91468   R 0   ρ p
When the values p = 0.1013 MPa and ρ = 998 kg/m3 are substituted into Equation (2), Equation (3) is obtained.
R 0   m m   =   0.0111   t c   [ μ s ]
By definition, R0 is half of dmax and tc is half of tD, so the proportional constants in Equations (1) and (3) are almost equivalent. Thus, it was concluded that the bubble size can be evaluated by measuring the developing time of the bubble.
In order to reveal the relation between bubble size and peening intensity, Figure 11 shows the relation between the developing time, tD, and the arc height, h [16]. As shown in Equation (1), the bubble size can be estimated using tD. As mentioned in the explanation of Figure 8, the peening intensity can be evaluated using the arc height. In Figure 11, duralumin, stainless steel, and N-strip were used; duralumin is a soft metal and N-strip is a hard material compared with stainless steel. Thus, the threshold impact, which corresponds to the material hardness, was assumed. When the threshold impact was assumed, the arc height was proportional to the maximum volume of the laser cavitation [16]. This is reasonable, as the cavitation intensity is proportional to the volume [52,53,54,55].

4.3. Bubble Shape

In this section, we investigate the effect of the bubble shape. Figure 12 shows images of laser cavitation. In Figure 12, the specimen was set closer than the optimal sw in Figure 5. When sw was large enough, the laser cavitation developed as a hemispherical bubble, as shown in Figure 6a. However, when sw was shorter than the optimal sw, the bubble developed into a flattened hemispherical bubble, i.e., a pancake-shaped bubble, t = 0.04–0.22 ms, as shown in Figure 12. During the shrinking of the bubble, it became a longitudinal bubble, as shown at t = 0.70 ms, and then collapsed.
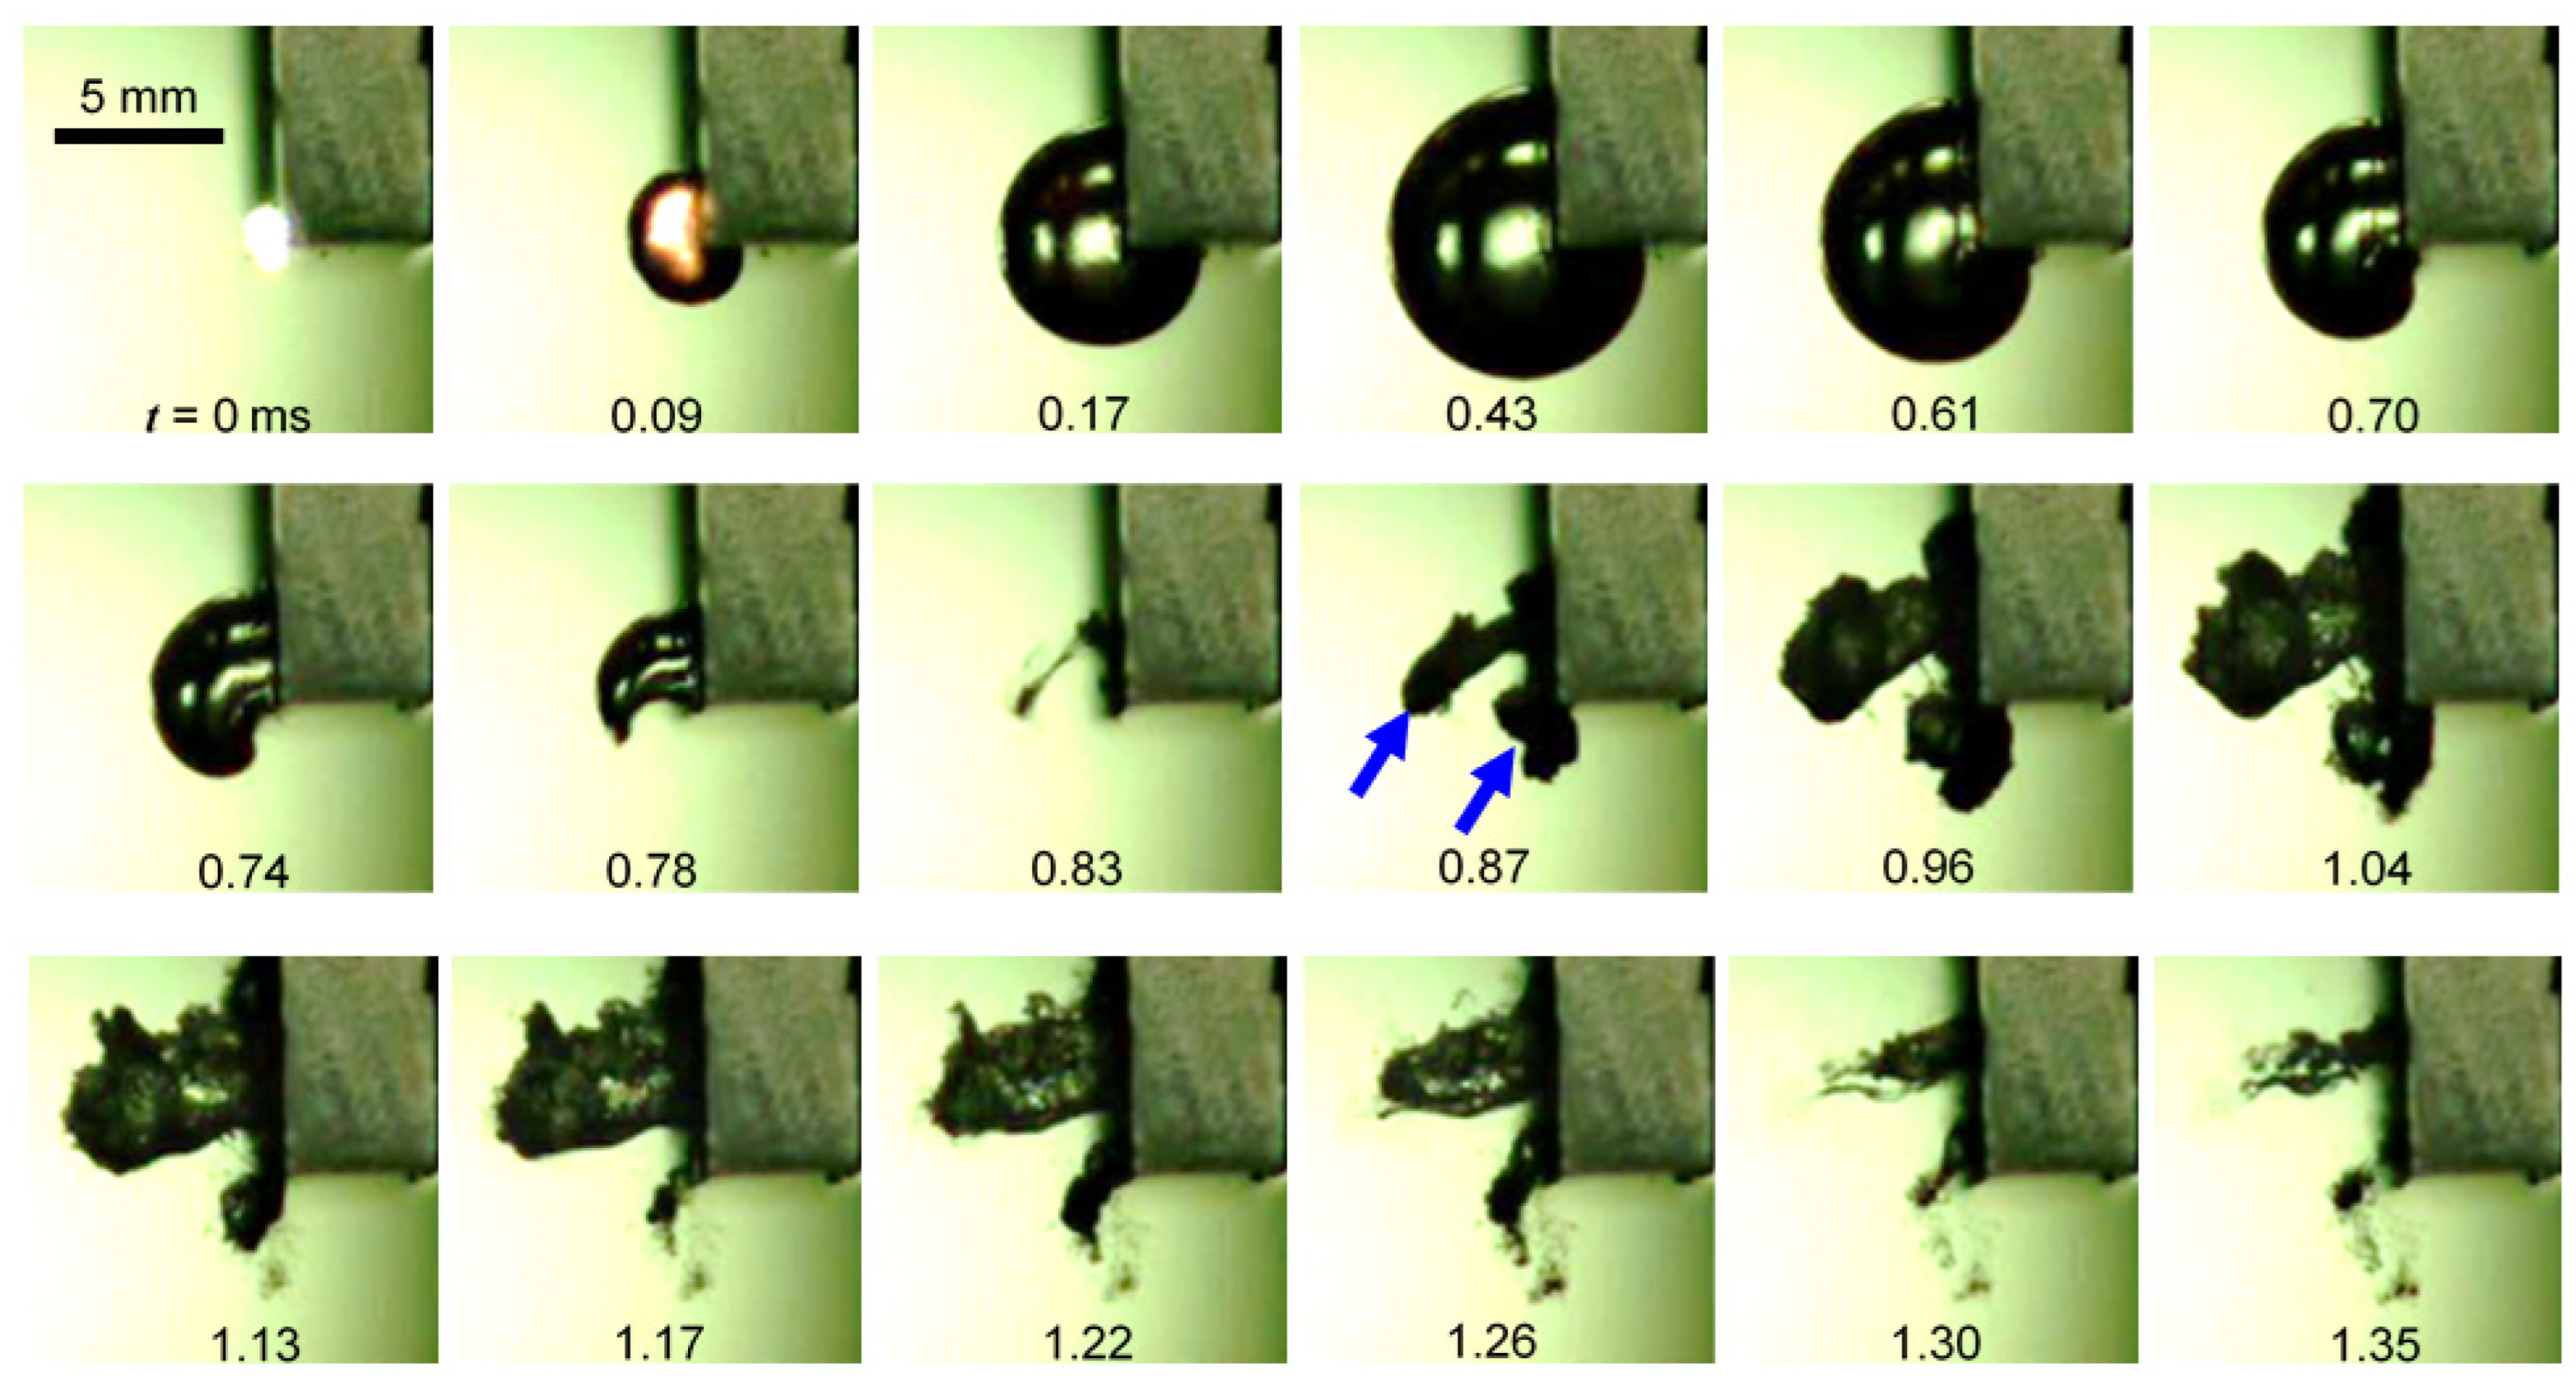
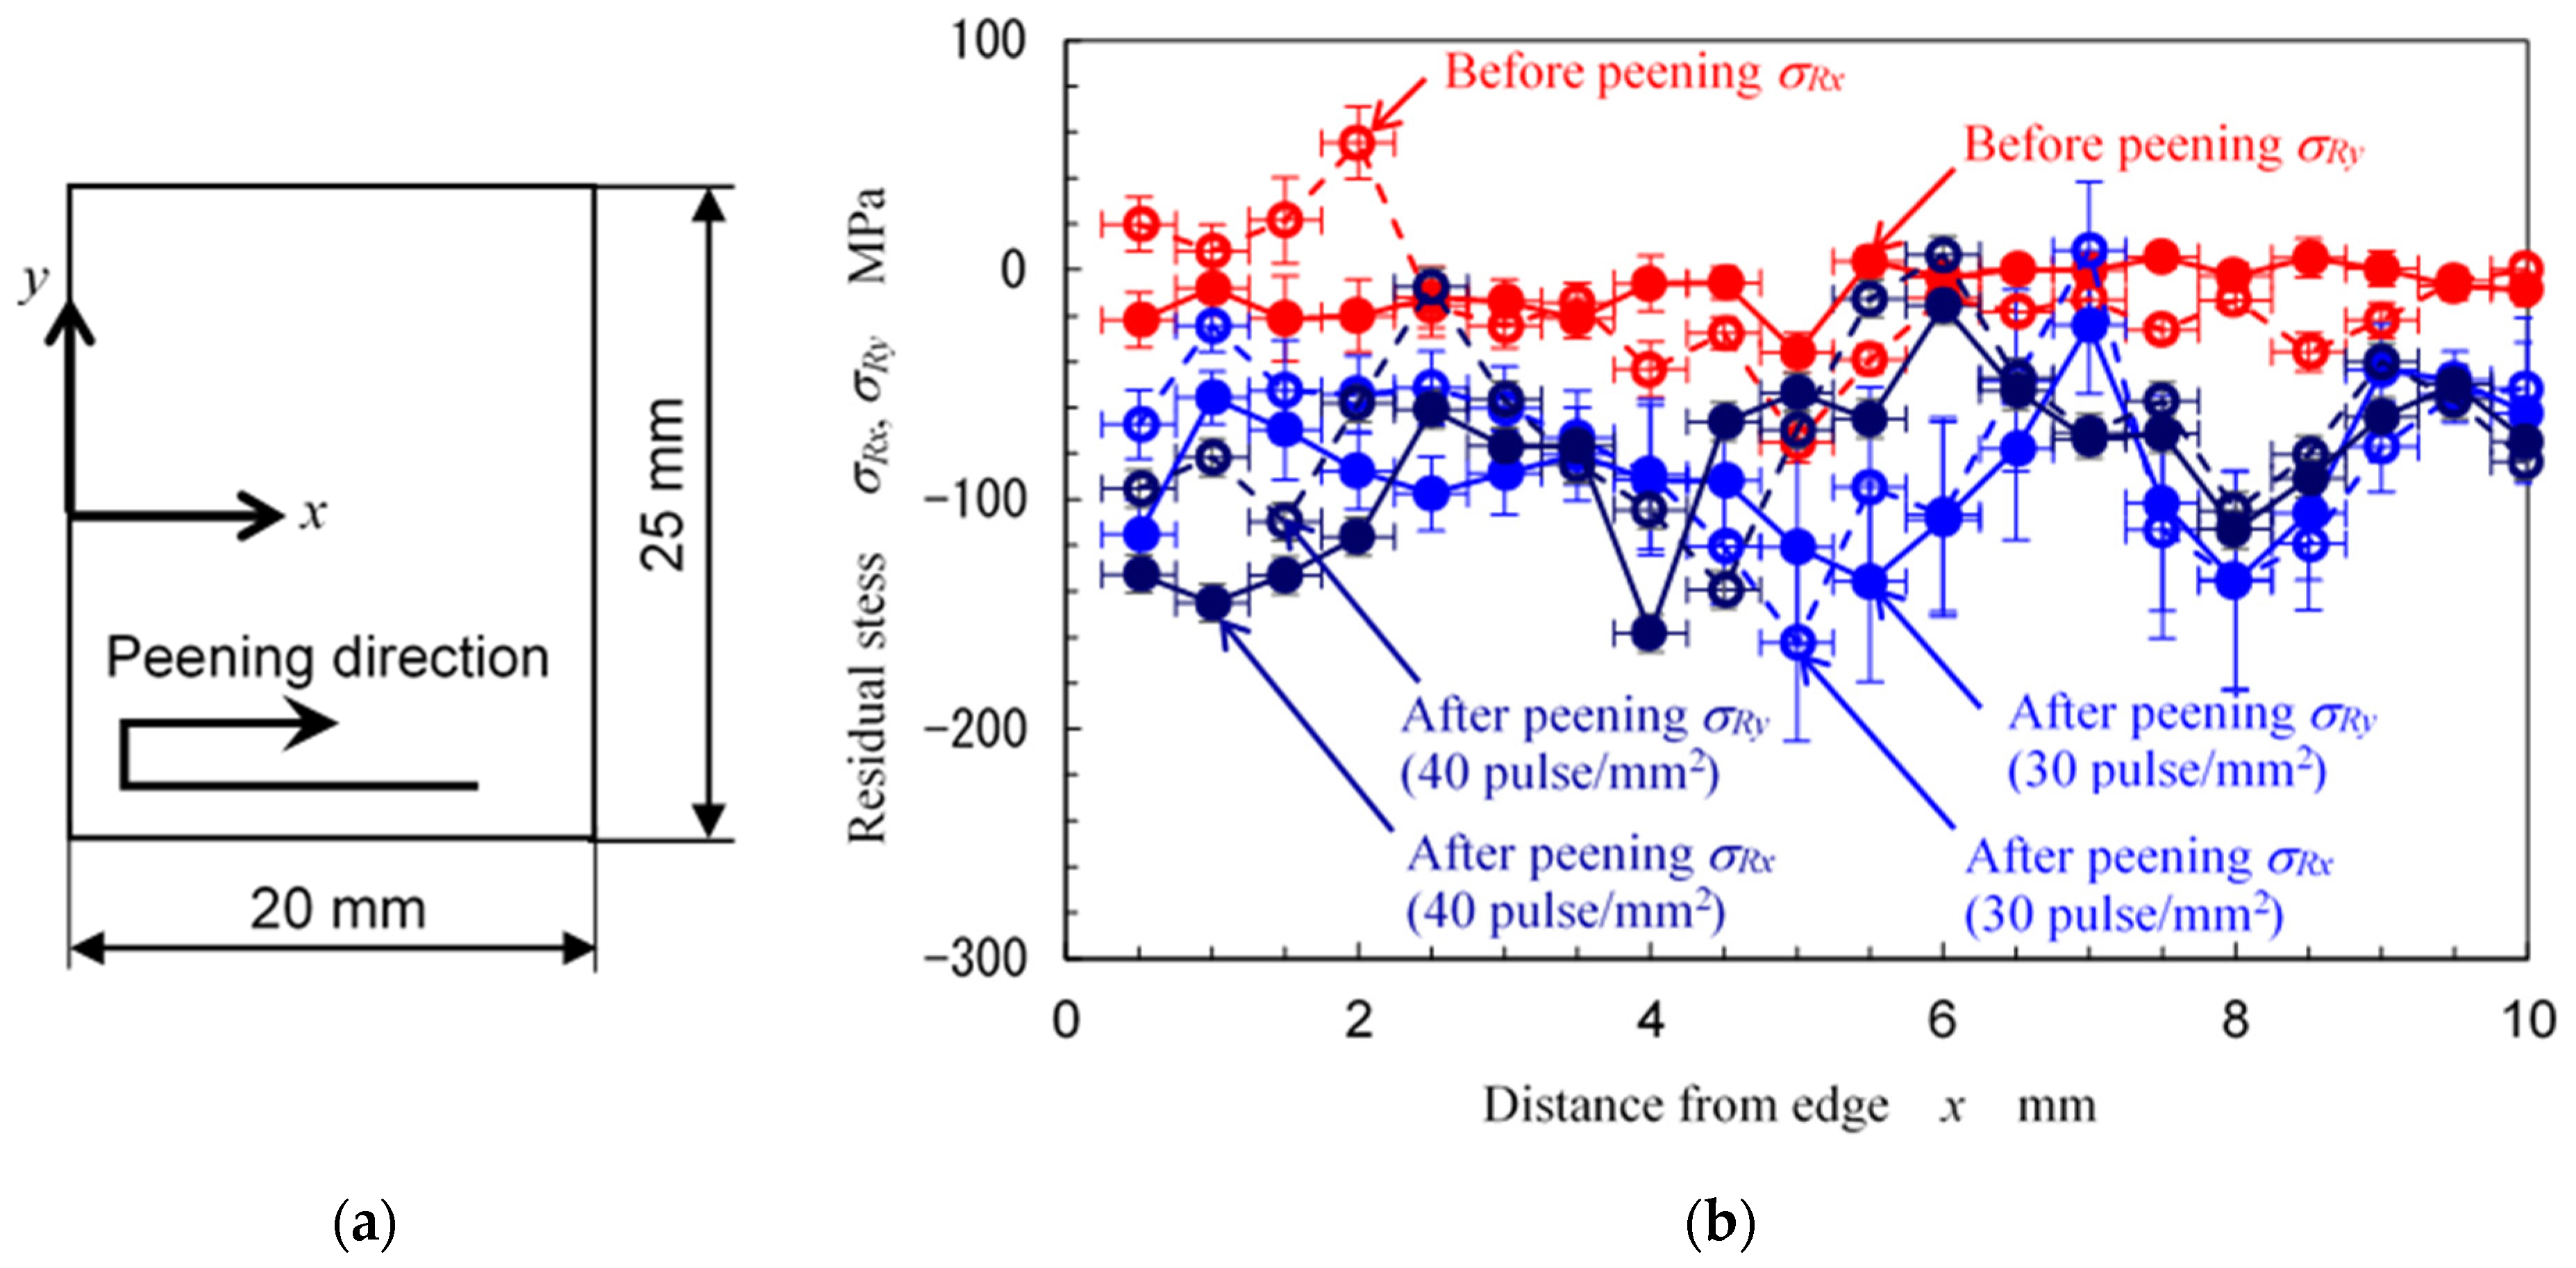
Figure 13 shows the bubble that developed at the edge. When the pulsed laser was irradiated at the edge, the bubble developed at the edge, and the outer shape was nearly a spherical bubble, i.e., t = 0.09–0.43 ms, as shown in Figure 13. During the shrinking of the bubble, it became a kind of horn-shape, then collapsed. After the first collapse, the other two bubbles, which are indicated by blue arrows at t = 0.87 ms in Figure 13, were generated and then collapsed. One of the secondary bubbles became considerably large and then collapsed. In order to illustrate the effect of the bubble that developed at the corner, Figure 14 shows the distribution of surface residual stress measured using a collimator of 0.146 mm in diameter via the 2D method [57]. The target material of Figure 14 was titanium alloy Ti6Al4V. After laser cavitation peening at 30 and 40 pulse/mm2, compressive residual stress of about 100 MPa was introduced, and the compressive residual stress introduced near the corner was almost equivalent to the value at the center of the specimen. Namely, a bubble developed at the corner that can introduce compressive residual stress into titanium alloy Ti6Al4V.
Next, we compare experimentally microjet-type bubbles, as shown in Figure 2a, and hemispherical bubbles, as shown in Figure 2b. Figure 15 shows the behavior of a bubble that was developed near the target surface by focusing on the water [58]. The bubble was initiated in the water near the target and developed, then collapsed in the water. After that, the bubble was developed on the target, then collapsed on the target.
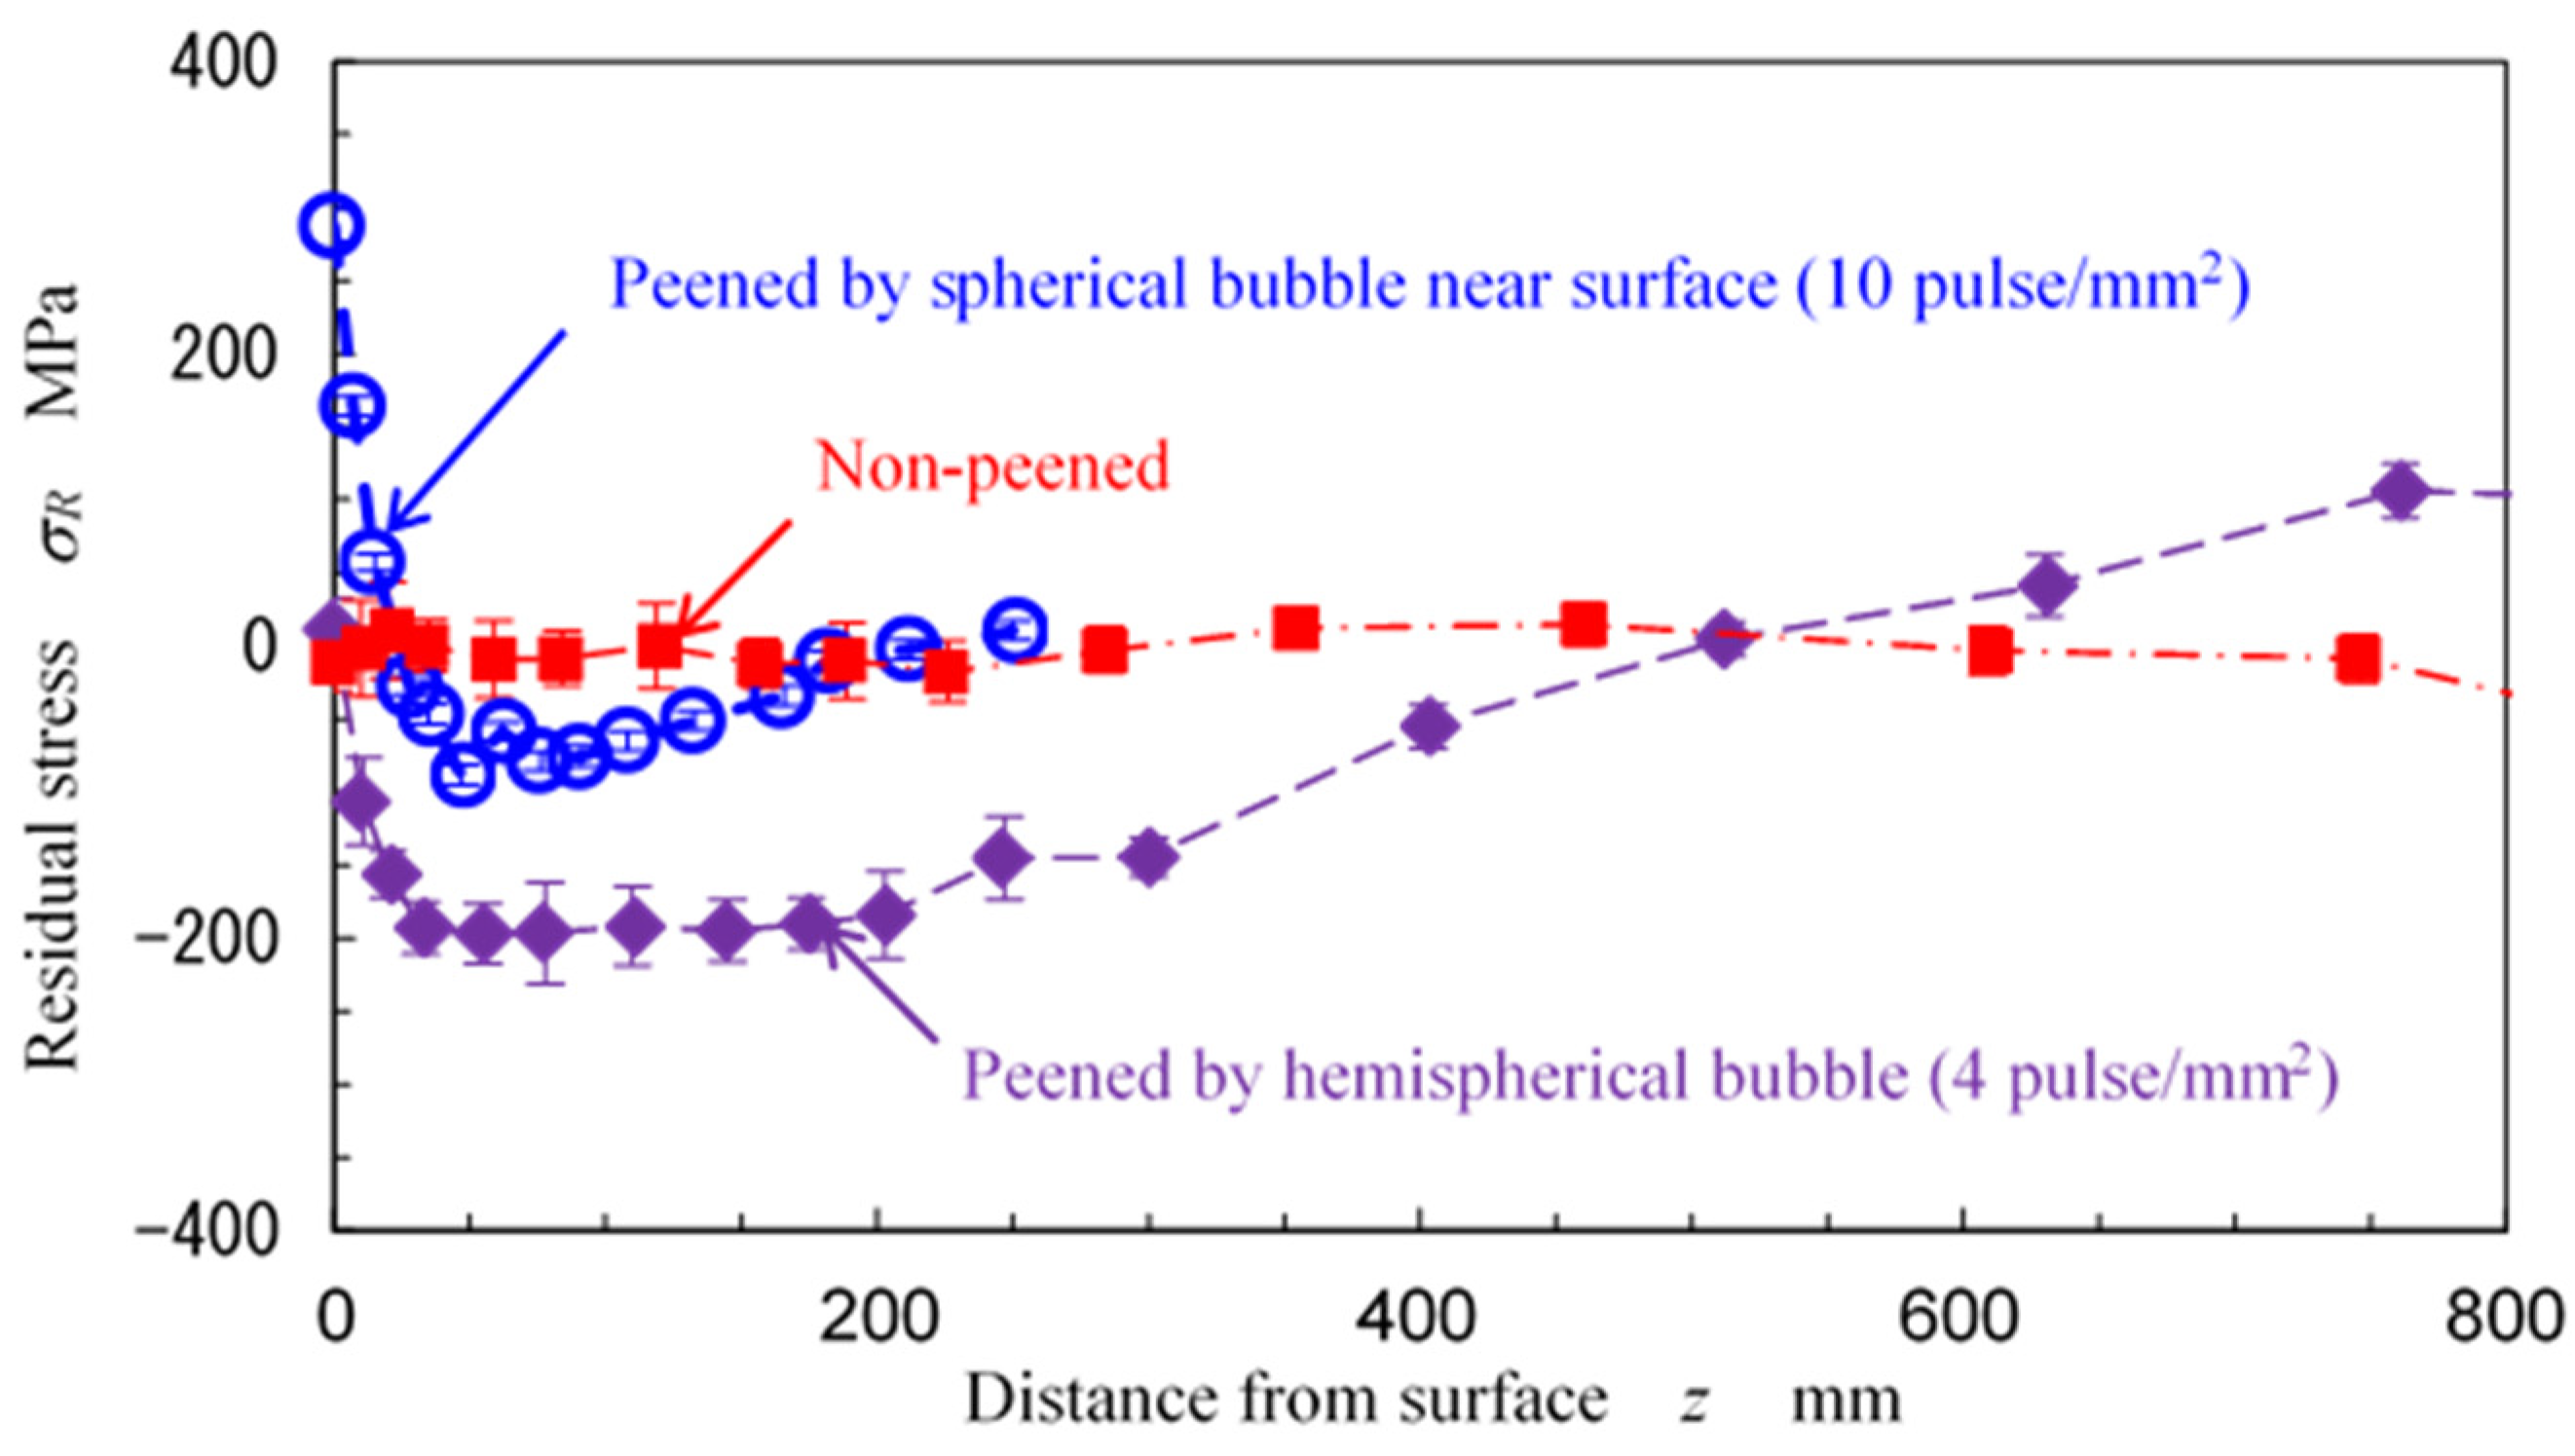
In order to compare the peening intensity of the bubble shown in Figure 15 and the hemispherical bubble, Figure 16 illustrates the residual stress as a function of the distance from the target surface. The blue line shows the residual stress of stainless steel treated at 10 pulse/mm2 by the bubble shown in Figure 15 [59], and the violet line shows treatment at 4 pulse/mm2 by the hemispherical bubble [6]. The red line reveals the residual stress without peening [59]. For both treatments, a Q-switched Nd:YAG laser of 0.35 J and 1064 nm was used. As shown in Figure 16, the hemispherical bubble at 4 pulse/mm2 introduced large compressive residual stress into a deeper region compared with the bubble shown in Figure 15 at 10 pulse/mm2. Namely, the collapse of the hemispherical bubble produced a more intense impact compared with the microjet.
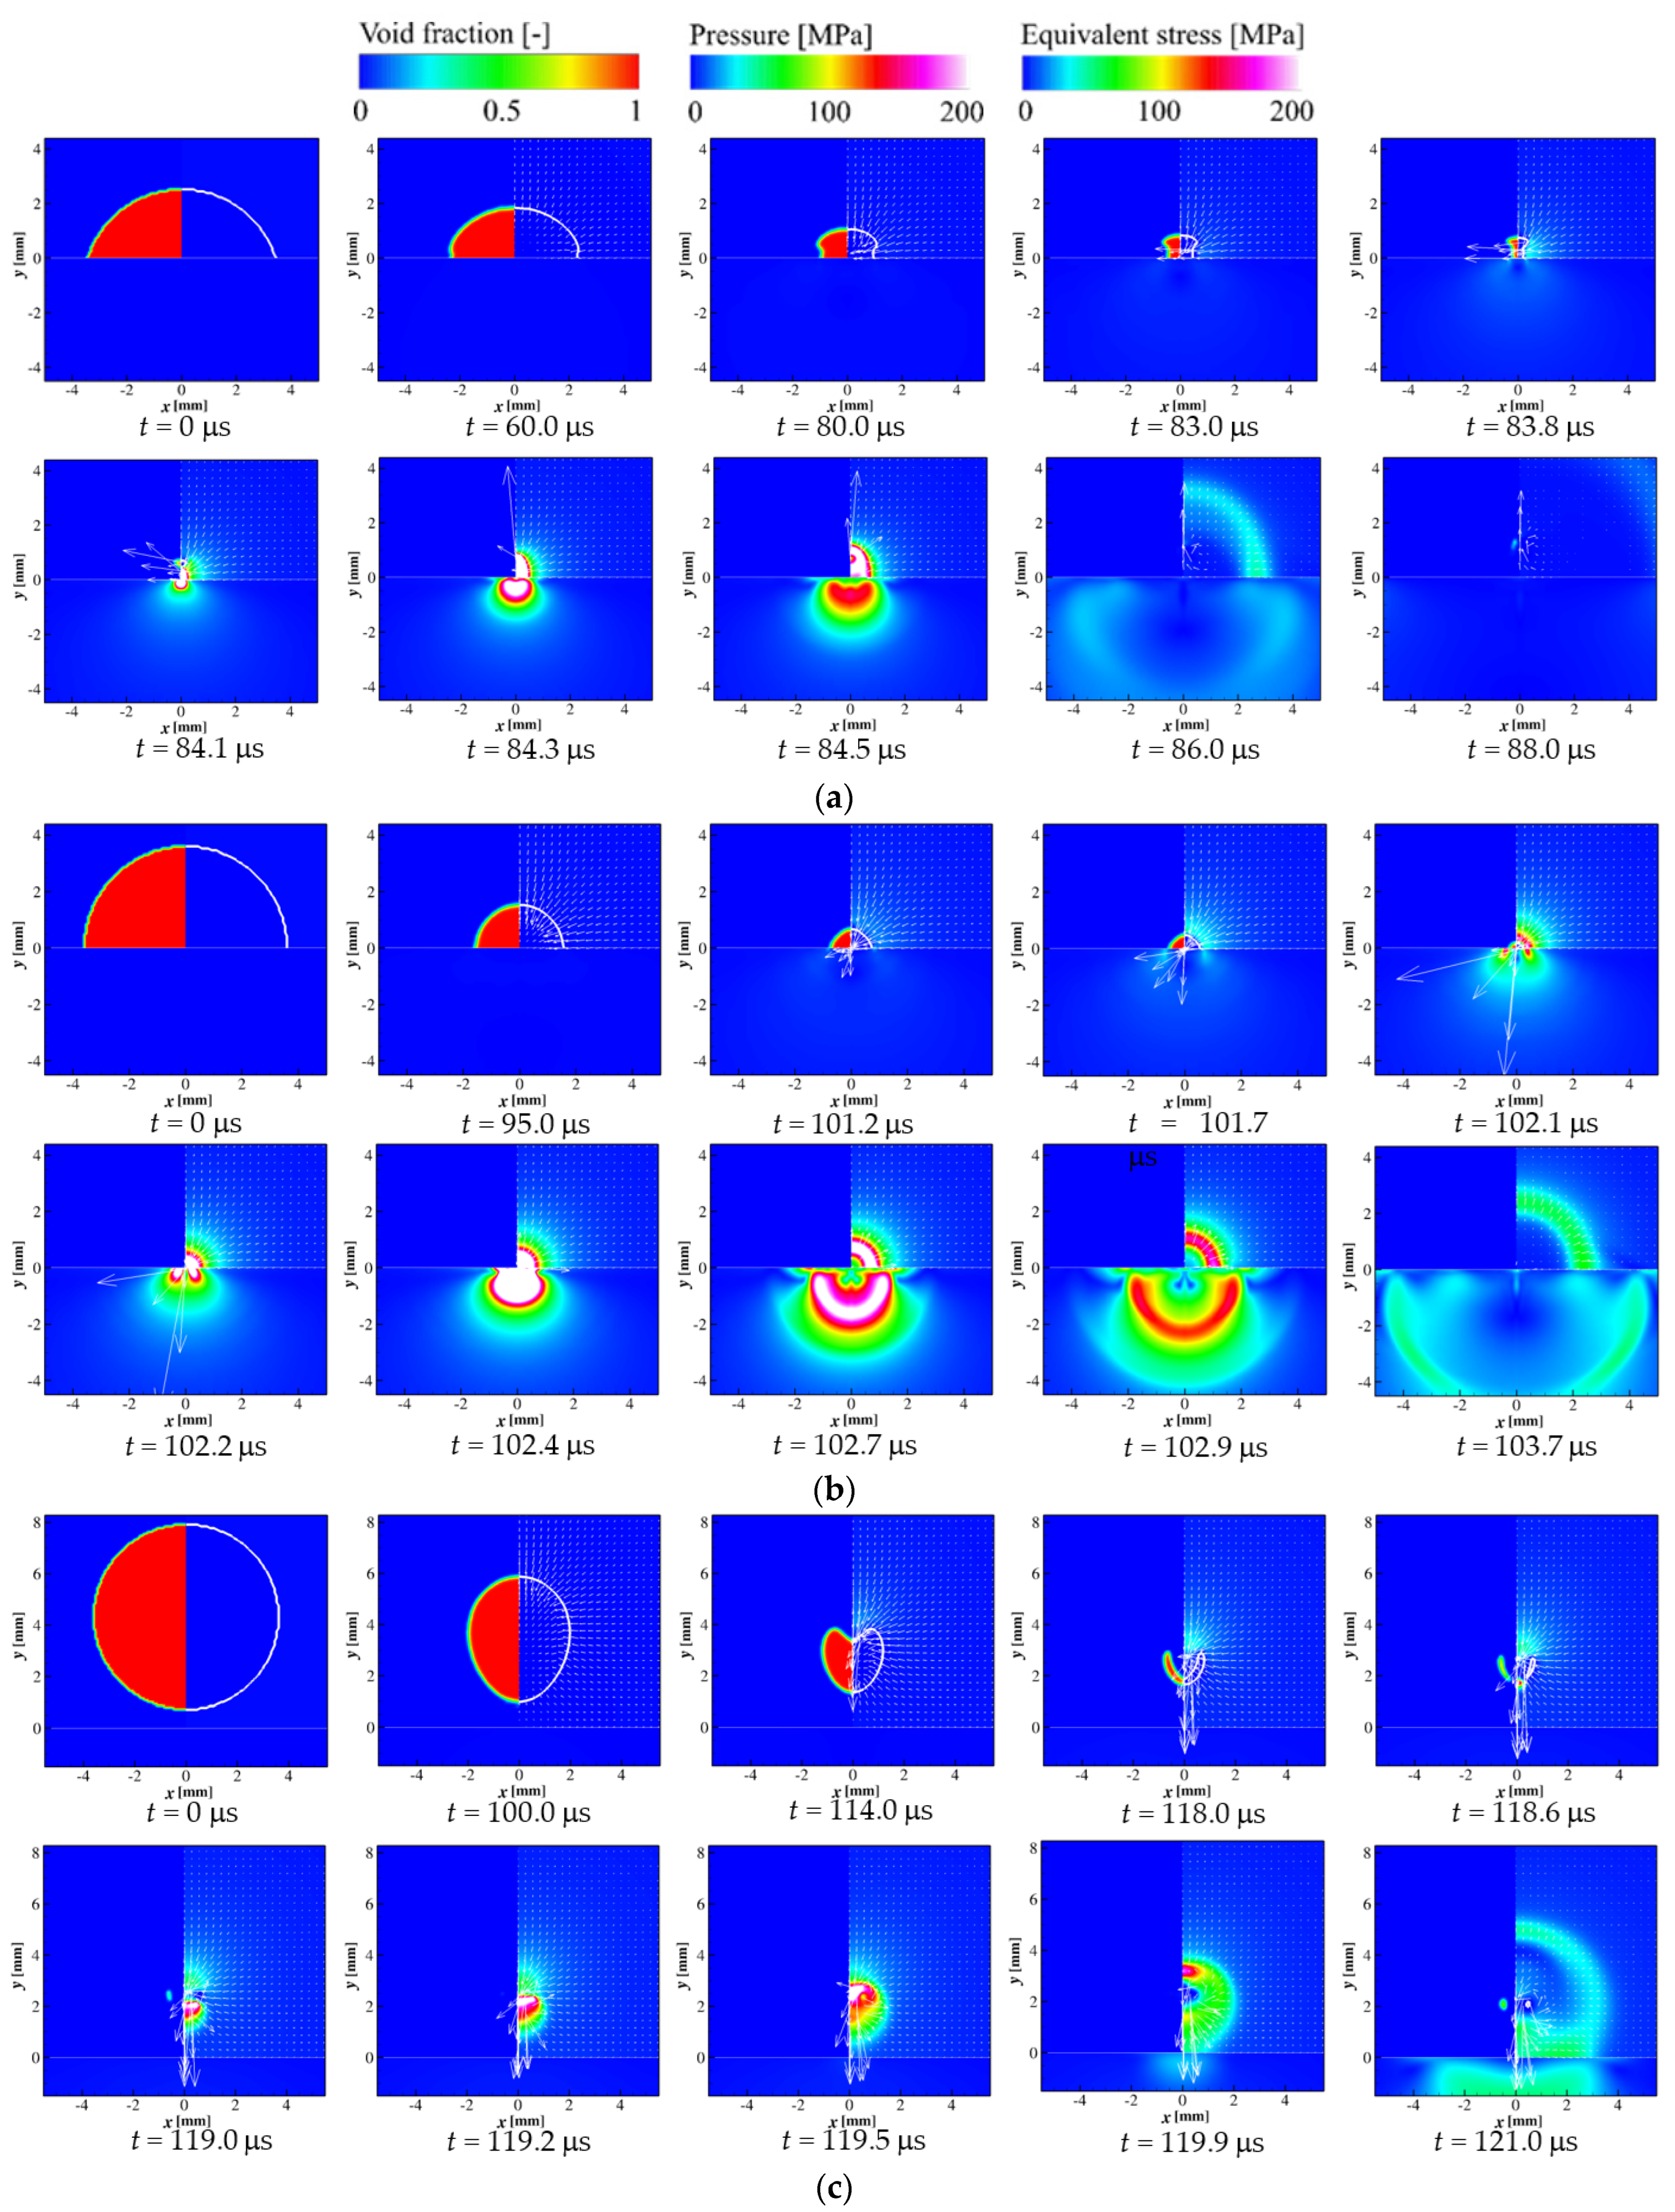
Now, we investigate the effect of the bubble shape using numerical simulation. Iga and Sasaki carried out a fluid/material-coupled numerical simulation of the first stage of the non-spherical collapse of a bubble near a wall, including the stress state inside the elastic material of the wall [35]. Figure 17 shows the results of typical cases (a) γ = −0.3, (b) γ = 0, and (c) γ = 1.2 [35]. In Figure 17, γ is defined by the distance between the center of the bubble and the wall surface, L, and the maximum bubble radius is Rmax, as per Equation (4).
γ = L R m a x
(a) γ = −0.3 corresponds to a pancake-shaped bubble, as shown in Figure 12; (b) γ = 0 corresponds to a hemispherical bubble, as shown in Figure 6a; and (c) γ = 1.2 shows the bubble near the wall, as shown in Figure 15. In the case of (c) γ = 1.2, the bubble has collapsed, generating a microjet. Iga and Sasaki simulated the void fraction, pressure in water, and equivalent stress of the material at various values of γ [35]. Three colored bars, one for each value, are shown in the upper part of Figure 17. Figure 17 reveals the contours of the values, changing with time. As shown in Figure 17a, regarding γ = −0.3, the pancake-shaped bubble, part of the bubble near the wall shrunk quicker than the top of the bubble; it became a longitudinal bubble at t = 83.8 µs. The longitudinal shape was very similar to the longitudinal bubble at t = 0.70 ms in Figure 12. t = 0 ms in Figure 12 corresponds to the irradiation of the pulsed laser.
However, t = 0 µs, in Figure 17, is the time at which the radius of the bubble reached a maximum. As shown in Figure 12 and Figure 17a, the fluid/material-coupled numerical simulation revealed experimental results. In the case of the hemispherical bubble collapse shown in Figure 17b, the pressure around the bubble became larger than that inside the bubble. This is similar to the phenomenon reported after theoretical analysis [60]. As shown in Figure 17c, a microjet was generated, and this caused a water-hammer effect.
In order to consider the effect of bubble shape on peening and/or erosion via cavitation bubble collapse, Figure 18 shows variations in the maximum equivalent stress and stress influence area changing with γ. The maximum equivalent stress had a maximum at γ = 0. Namely, the impact caused by the hemispherical bubble, γ = 0, was larger than that of the microjet-mode bubble γ = 1.2. Further, the stress influential volume has a maximum at γ = 0, and the hemispherical bubble collapse affects the wider volume compared with microjet-type collapse, as shown in Figure 18b. Note that the collapse of the bubble at γ = 0.5 affects a deeper region compared with the bubble at γ = 0. Considering the results of Figure 18a–c, the collapse of the hemispherical bubble at γ = 0 is suitable for laser cavitation peening.

4.4. Water Quality

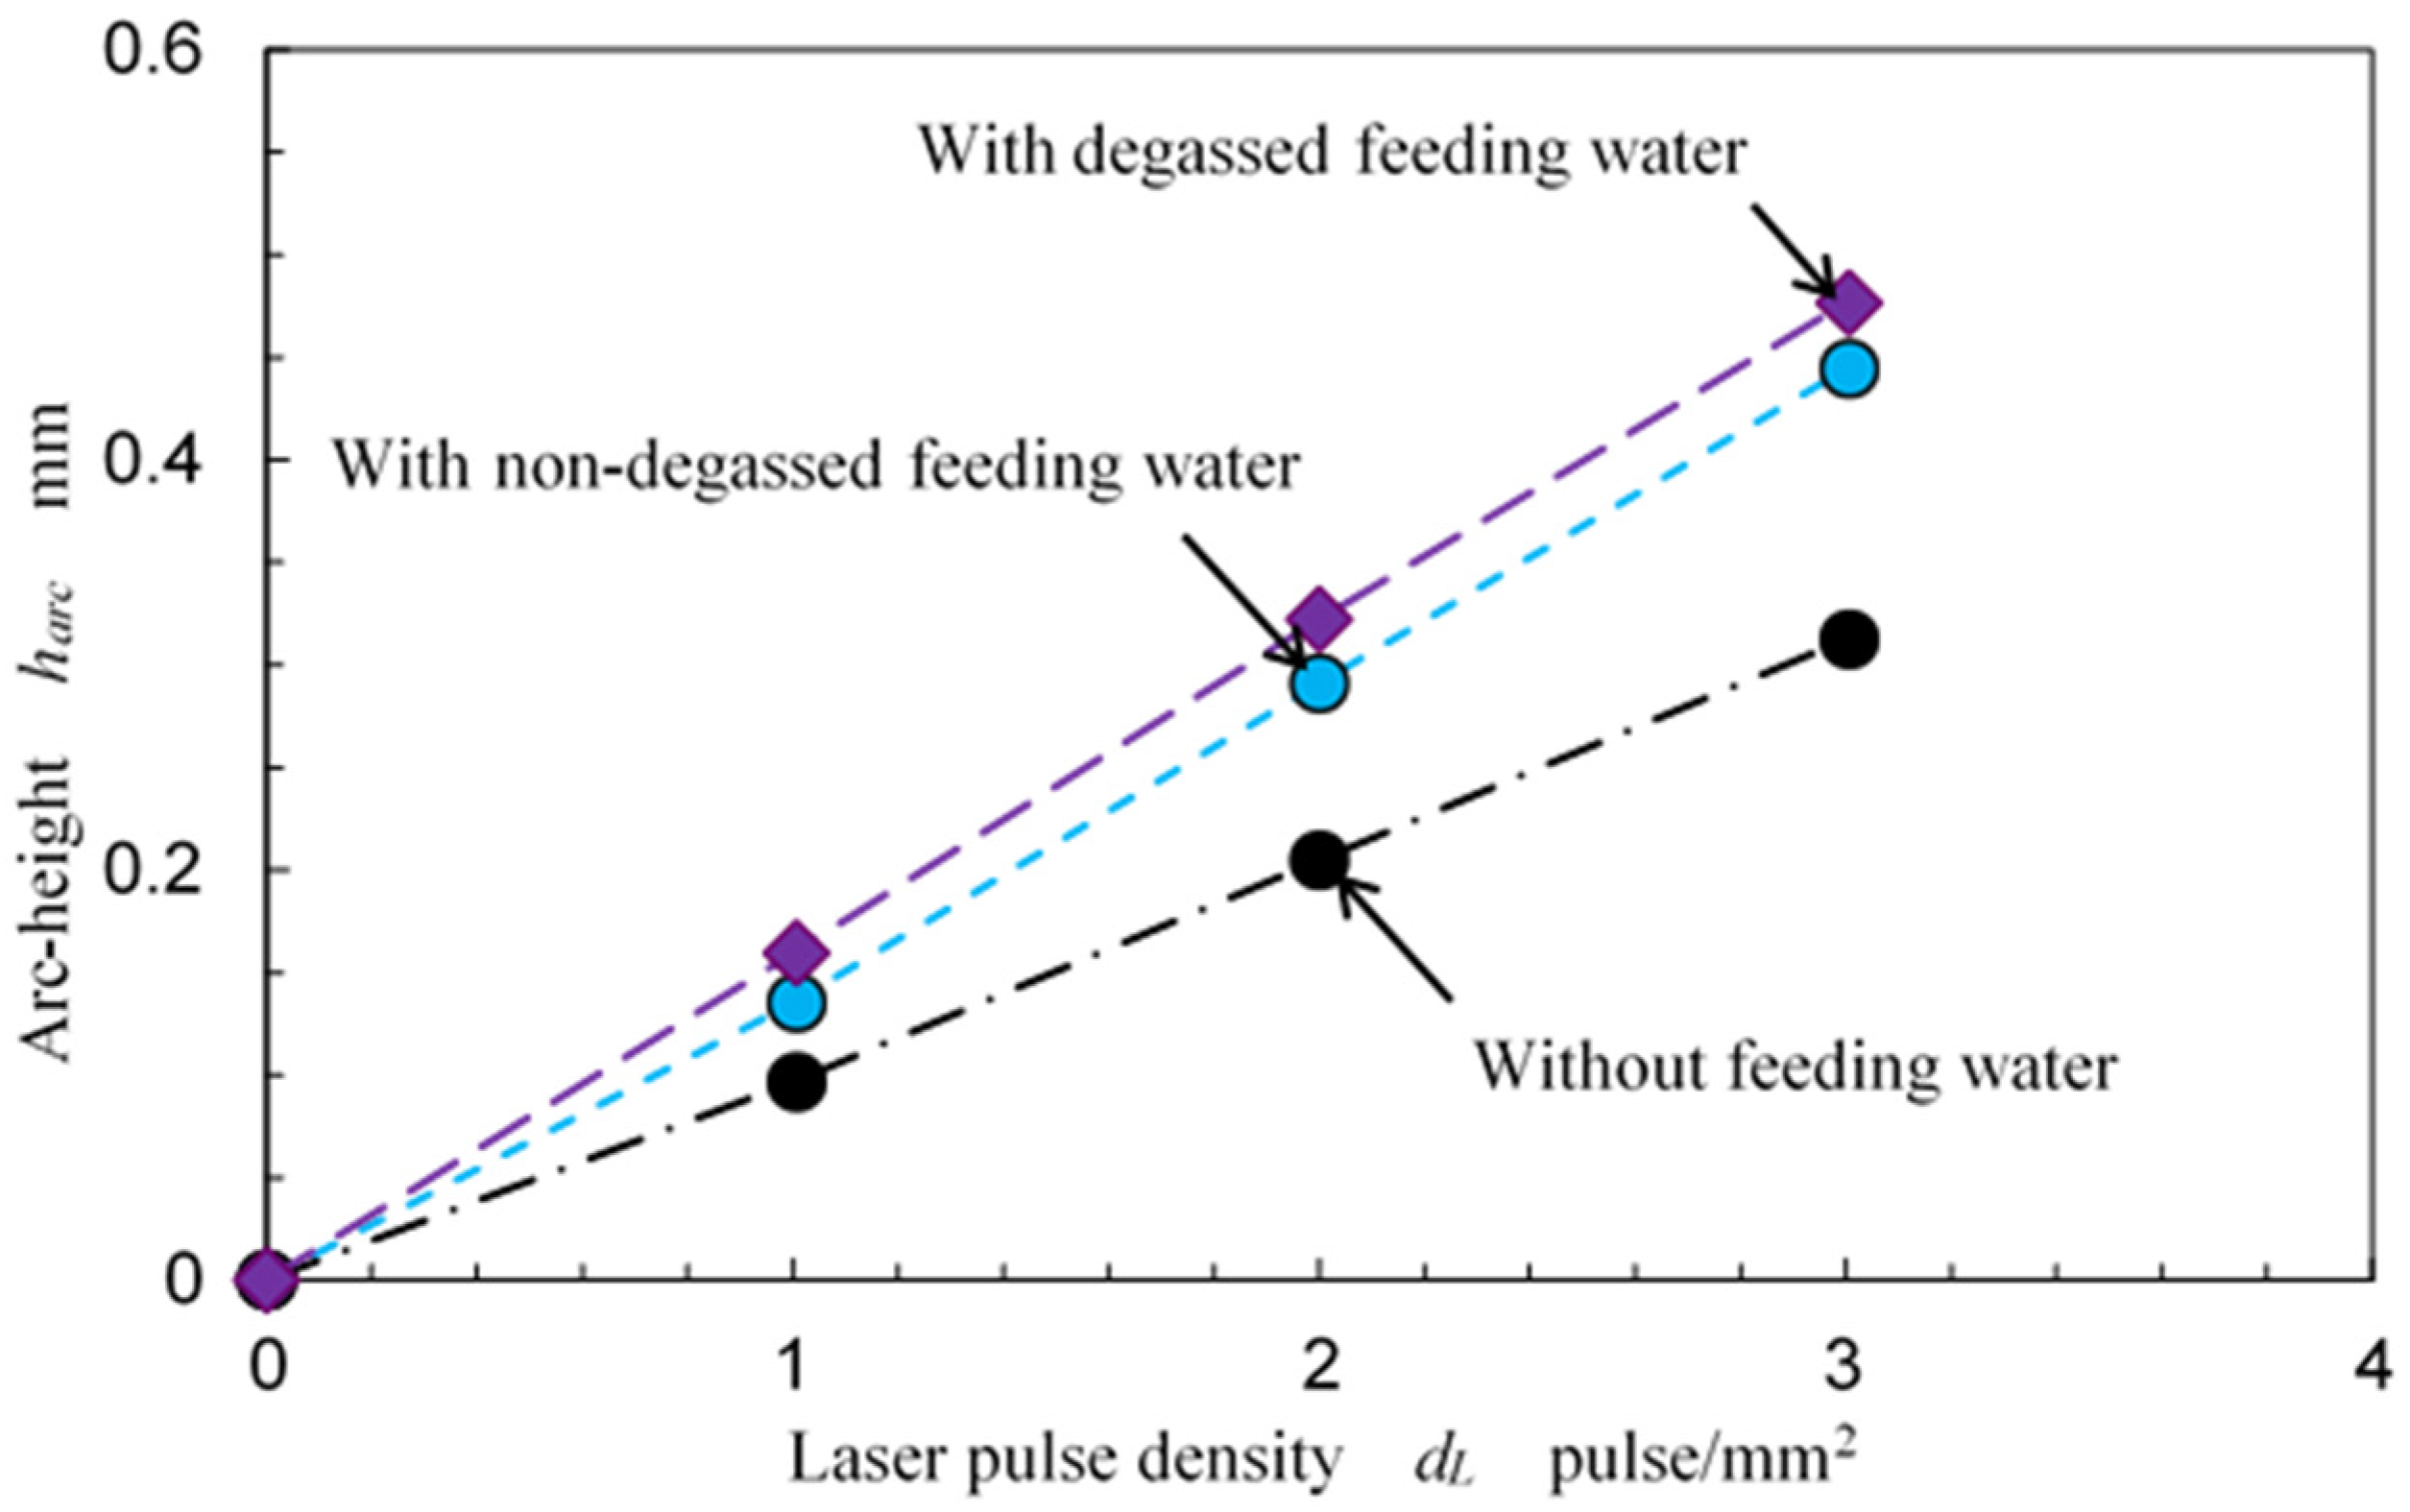
In order to investigate the effect of feeding water on peening intensity, Figure 19 shows the arc height changing with the laser pulse density at various conditions using an aluminum plate. During the present condition, the flow rate of the feeding water was 5 L/min. The oxygen content was 6.4 mg/L without degassing and 1.6 mg/L with degassing. The water temperature was about 283 K. As shown in Figure 19, the arc height of laser cavitation peening with feeding water was larger than that of the peening without feeding water, as the feeding water removed small particles that were caused by laser ablation. The small particles might obstruct the laser from reaching the target surface. If the air content in the water was large, the minimum size of the cavitation bubble was larger. Thus, the rebound after the cavitation bubble collapse was slightly slower, and the impact during bubble collapse was reduced. This is called the “cushion effect”. The cavitation bubble collapse impact is affected by the air content of the water. As shown in Figure 19, the arc height of laser cavitation peening with degassed feeding water was larger than that of non-degassed feeding water. Thus, in order to minimize the cushion effect, feeding with degassed water is suitable for laser cavitation peening.

4.5. Peening Pattern

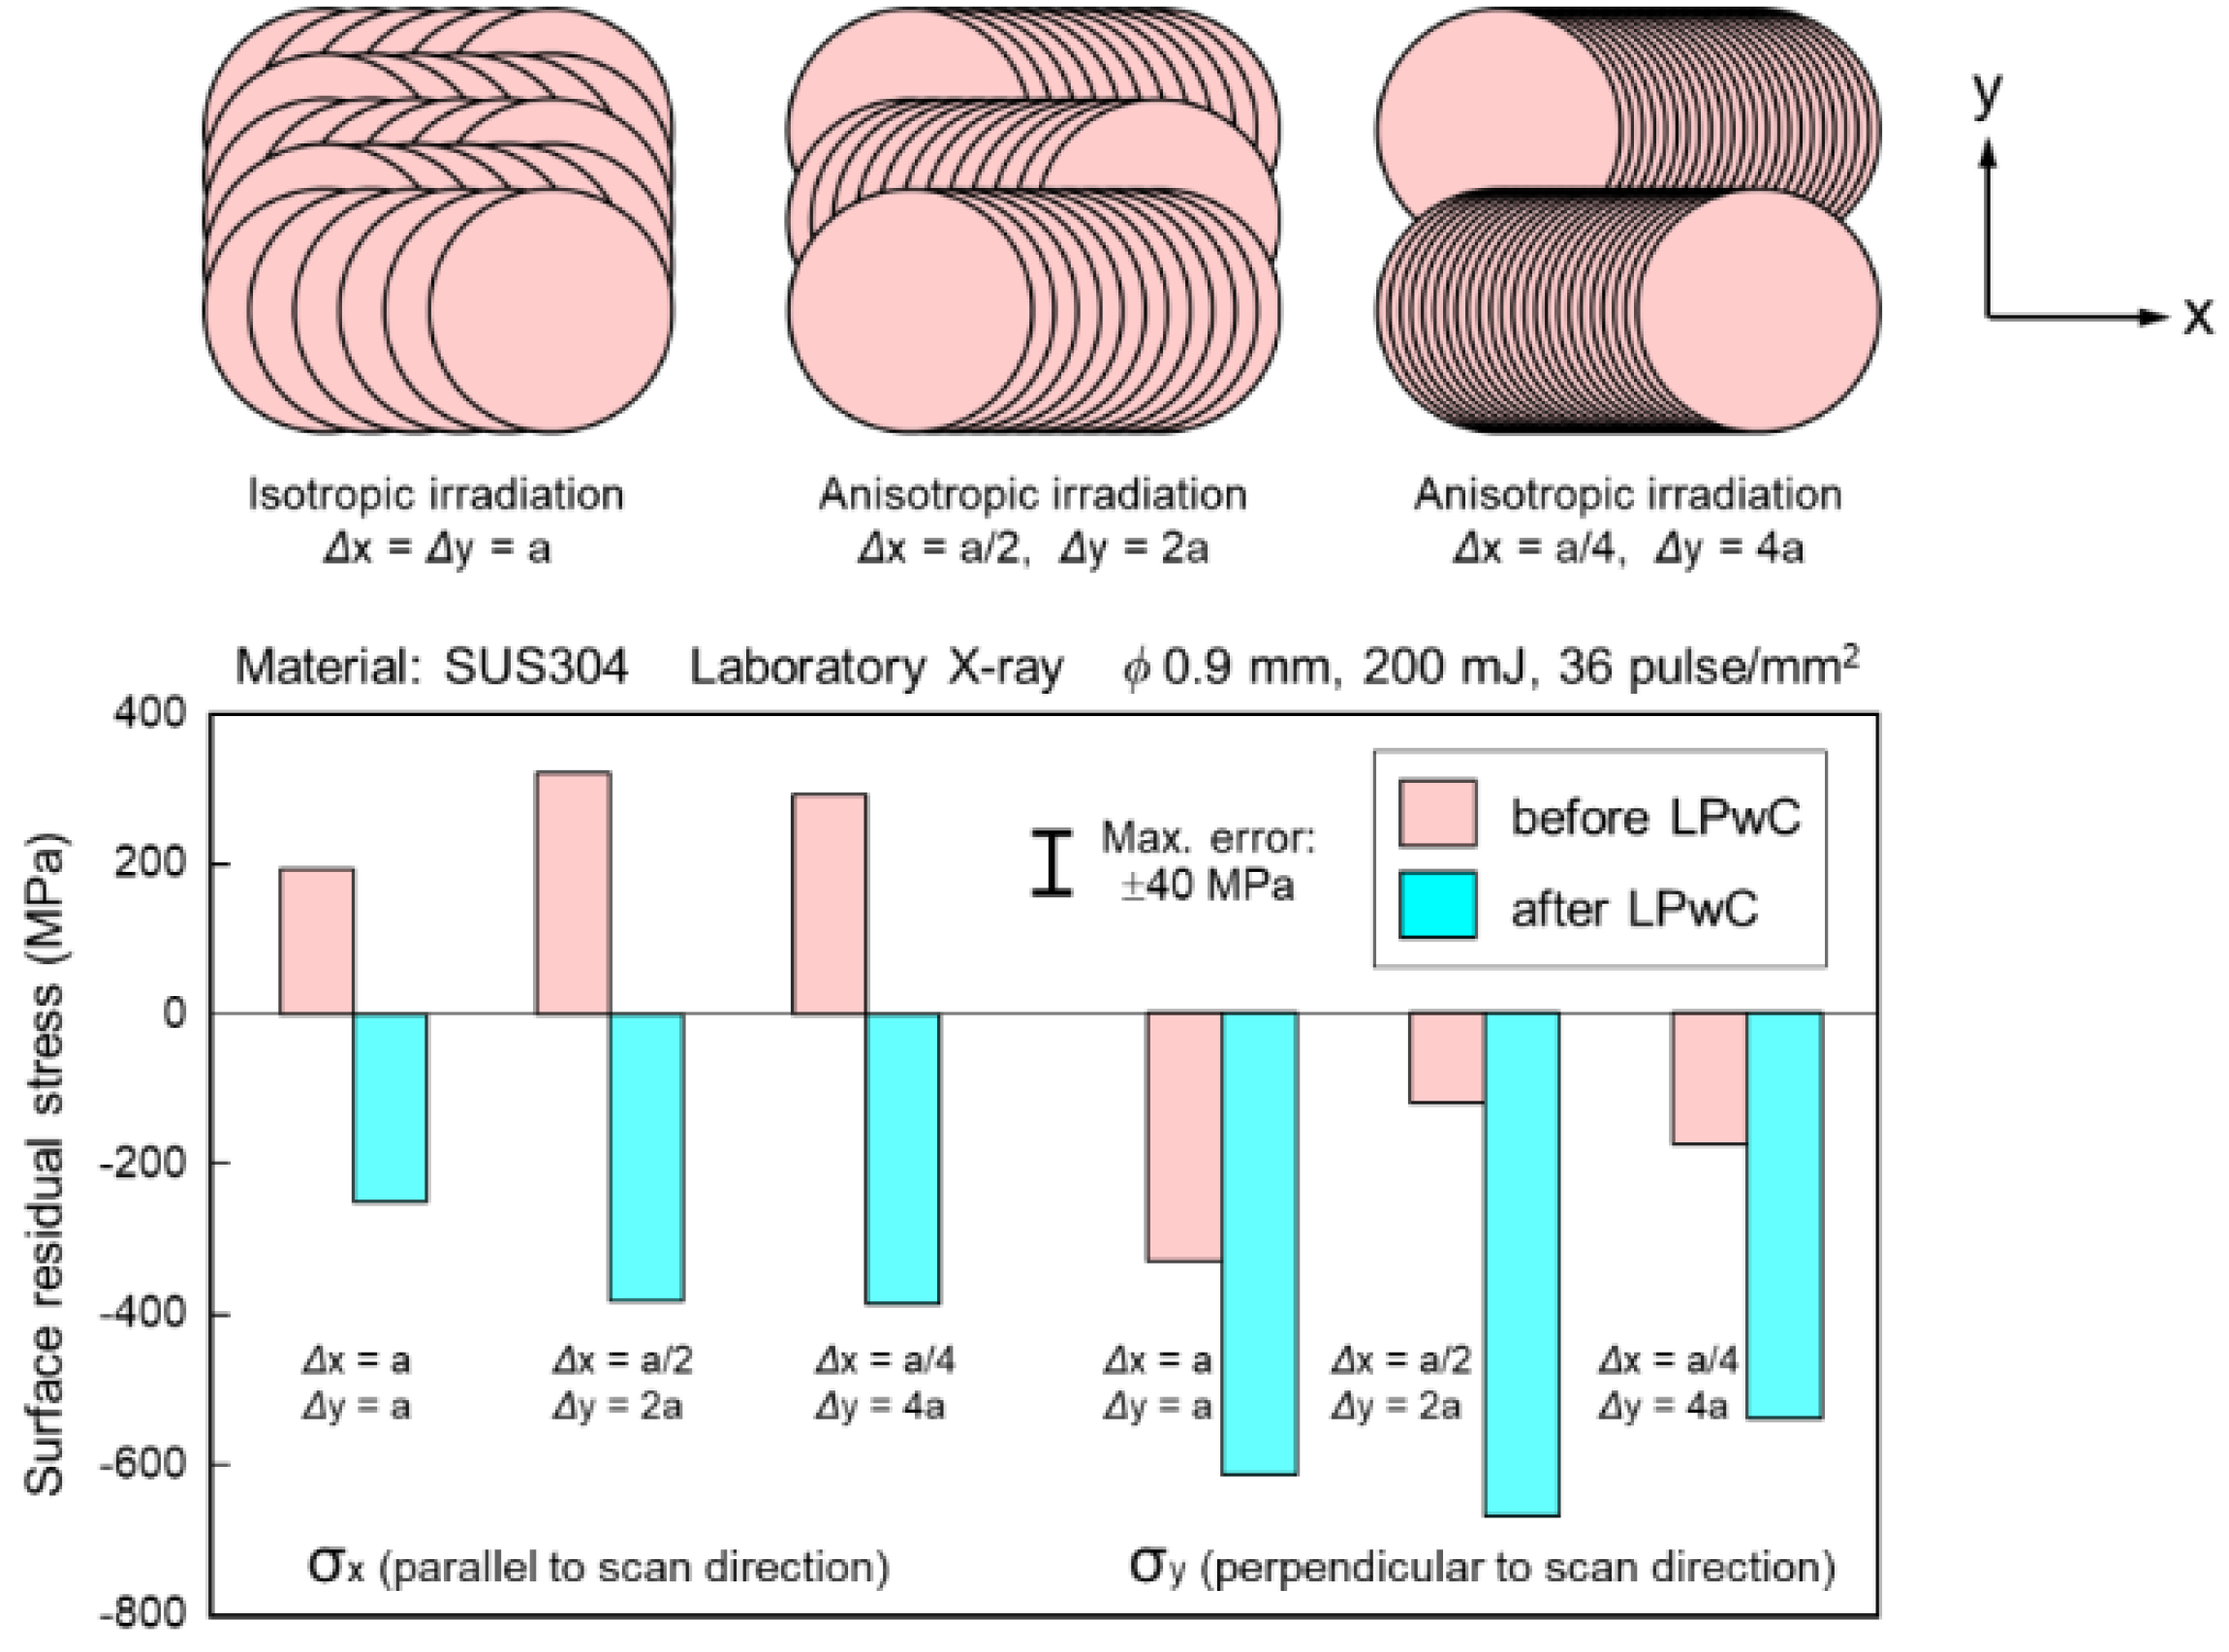
In order to reveal the effect of the peening pattern, Figure 20 shows the surface residual stress changing with the irradiation step in the x- and y-directions, as shown in the upper part of Figure 20. The interval “a” is for 36 pulse/mm2 during isotropic irradiation. For all three cases, similar compressive residual stress was introduced, even though anisotropic irradiation was applied. Note that the virgin surface was treated.
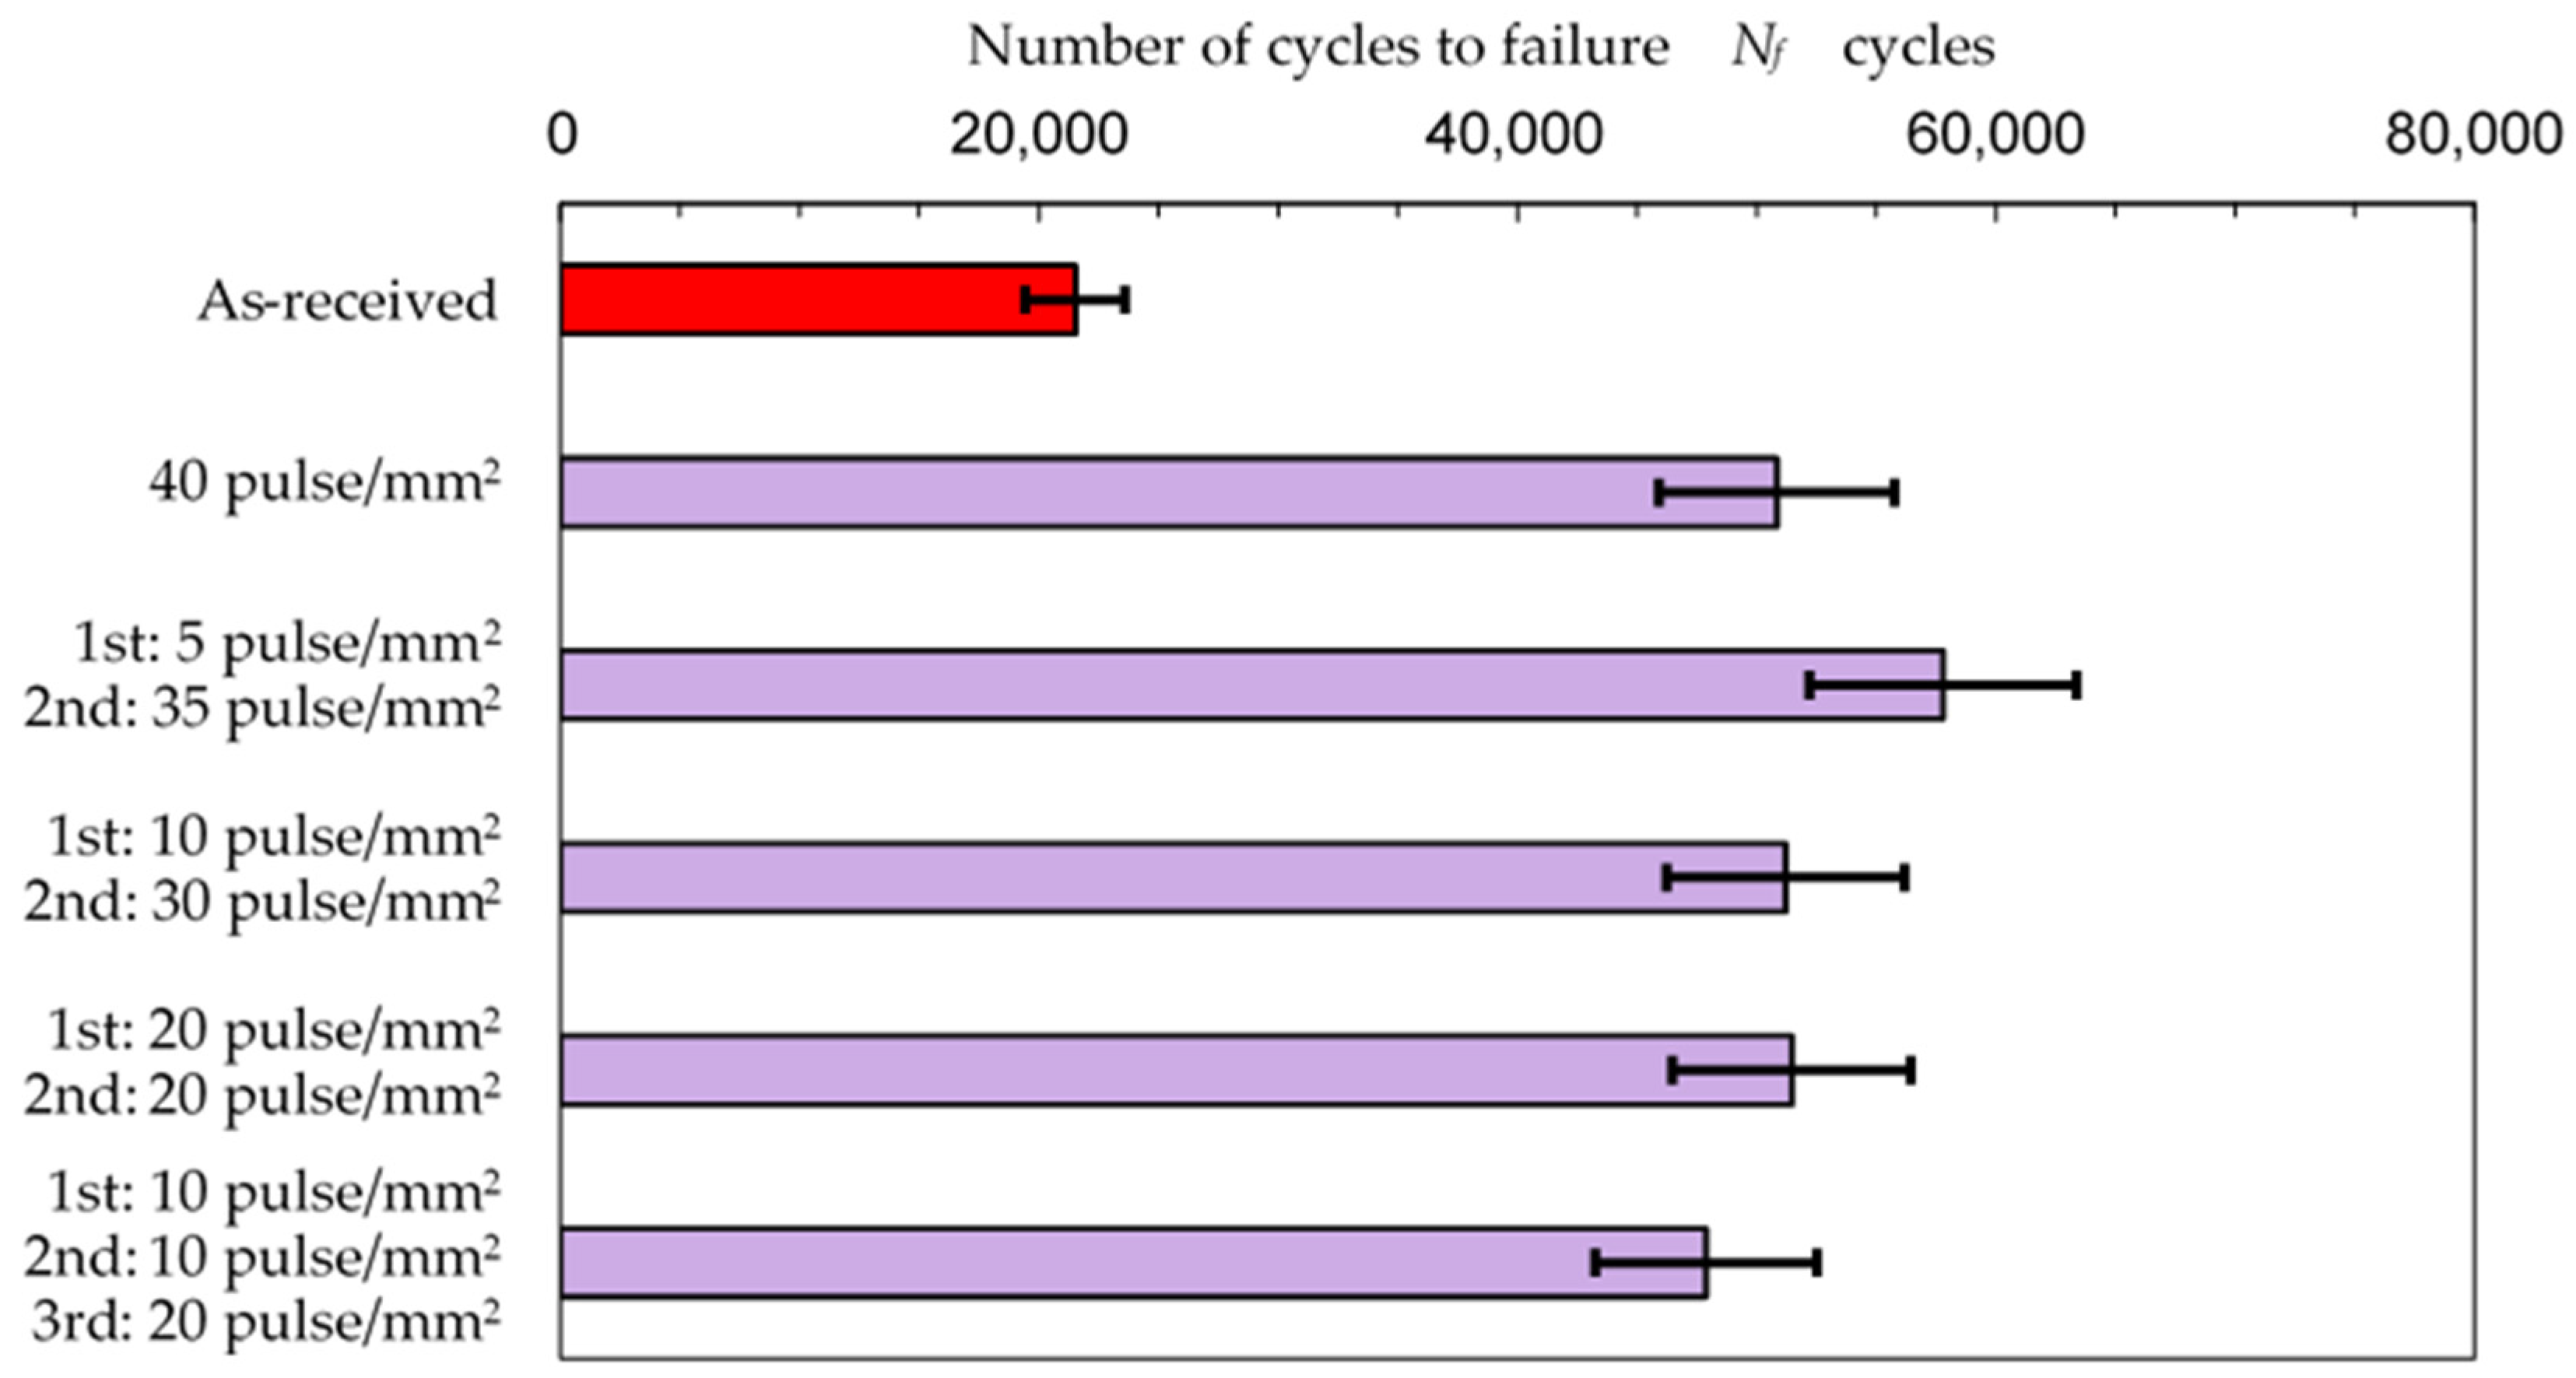
In order to investigate the effects of overstrike during laser cavitation peening, Figure 21 reveals the fatigue life of titanium alloy Ti6Al4V manufactured via direct metal laser sintering. The fatigue life was evaluated using a torsion fatigue tester [60]. For all five cases, the total laser pulse density was 40 pulse/mm2. In the case of 40 pulse/mm2, both the step distance in the circumferential direction and axial direction was 0.158 mm. In the case of 5 + 35 pulse/mm2, the step distances in both the circumferential and axial directions were 0.447 mm at the first step and 0.169 mm at the second step. For all five cases, the fatigue life was improved compared with the as-built specimen. The first 5 pulse/mm2 and the second 35 pulse/mm2 had the longest life. When Ti6Al4V was treated via laser cavitation peening, the surface was oxidized. It was reported that the oxidized layer of Ti6Al4V after laser cavitation peening was Ti4O5 [10]. As the color of Ti4O5 is black, the irradiated laser energy was more intense compared with the treatment of the virgin surface, which is blighter than Ti4O5. The local surface residual stress changed in between laser spots [57]; the higher the laser density at the last stage of laser cavitation peening, the longer the fatigue life.

5. Improvement of Fatigue Properties of Metals via Laser Cavitation Peening

In order to reveal the improvement of the fatigue properties of 3D metals via laser cavitation peening, Figure 22 shows the S–N curves of additive-manufactured titanium alloy Ti6Al4V via direct metal laser sintering (DMLS) treated using laser cavitation peening compared with a non-peened (as-built) specimen [60], as 3D metals are attractive materials [61]. As shown in Figure 22, the fatigue life was improved by laser cavitation peening (CP by laser).
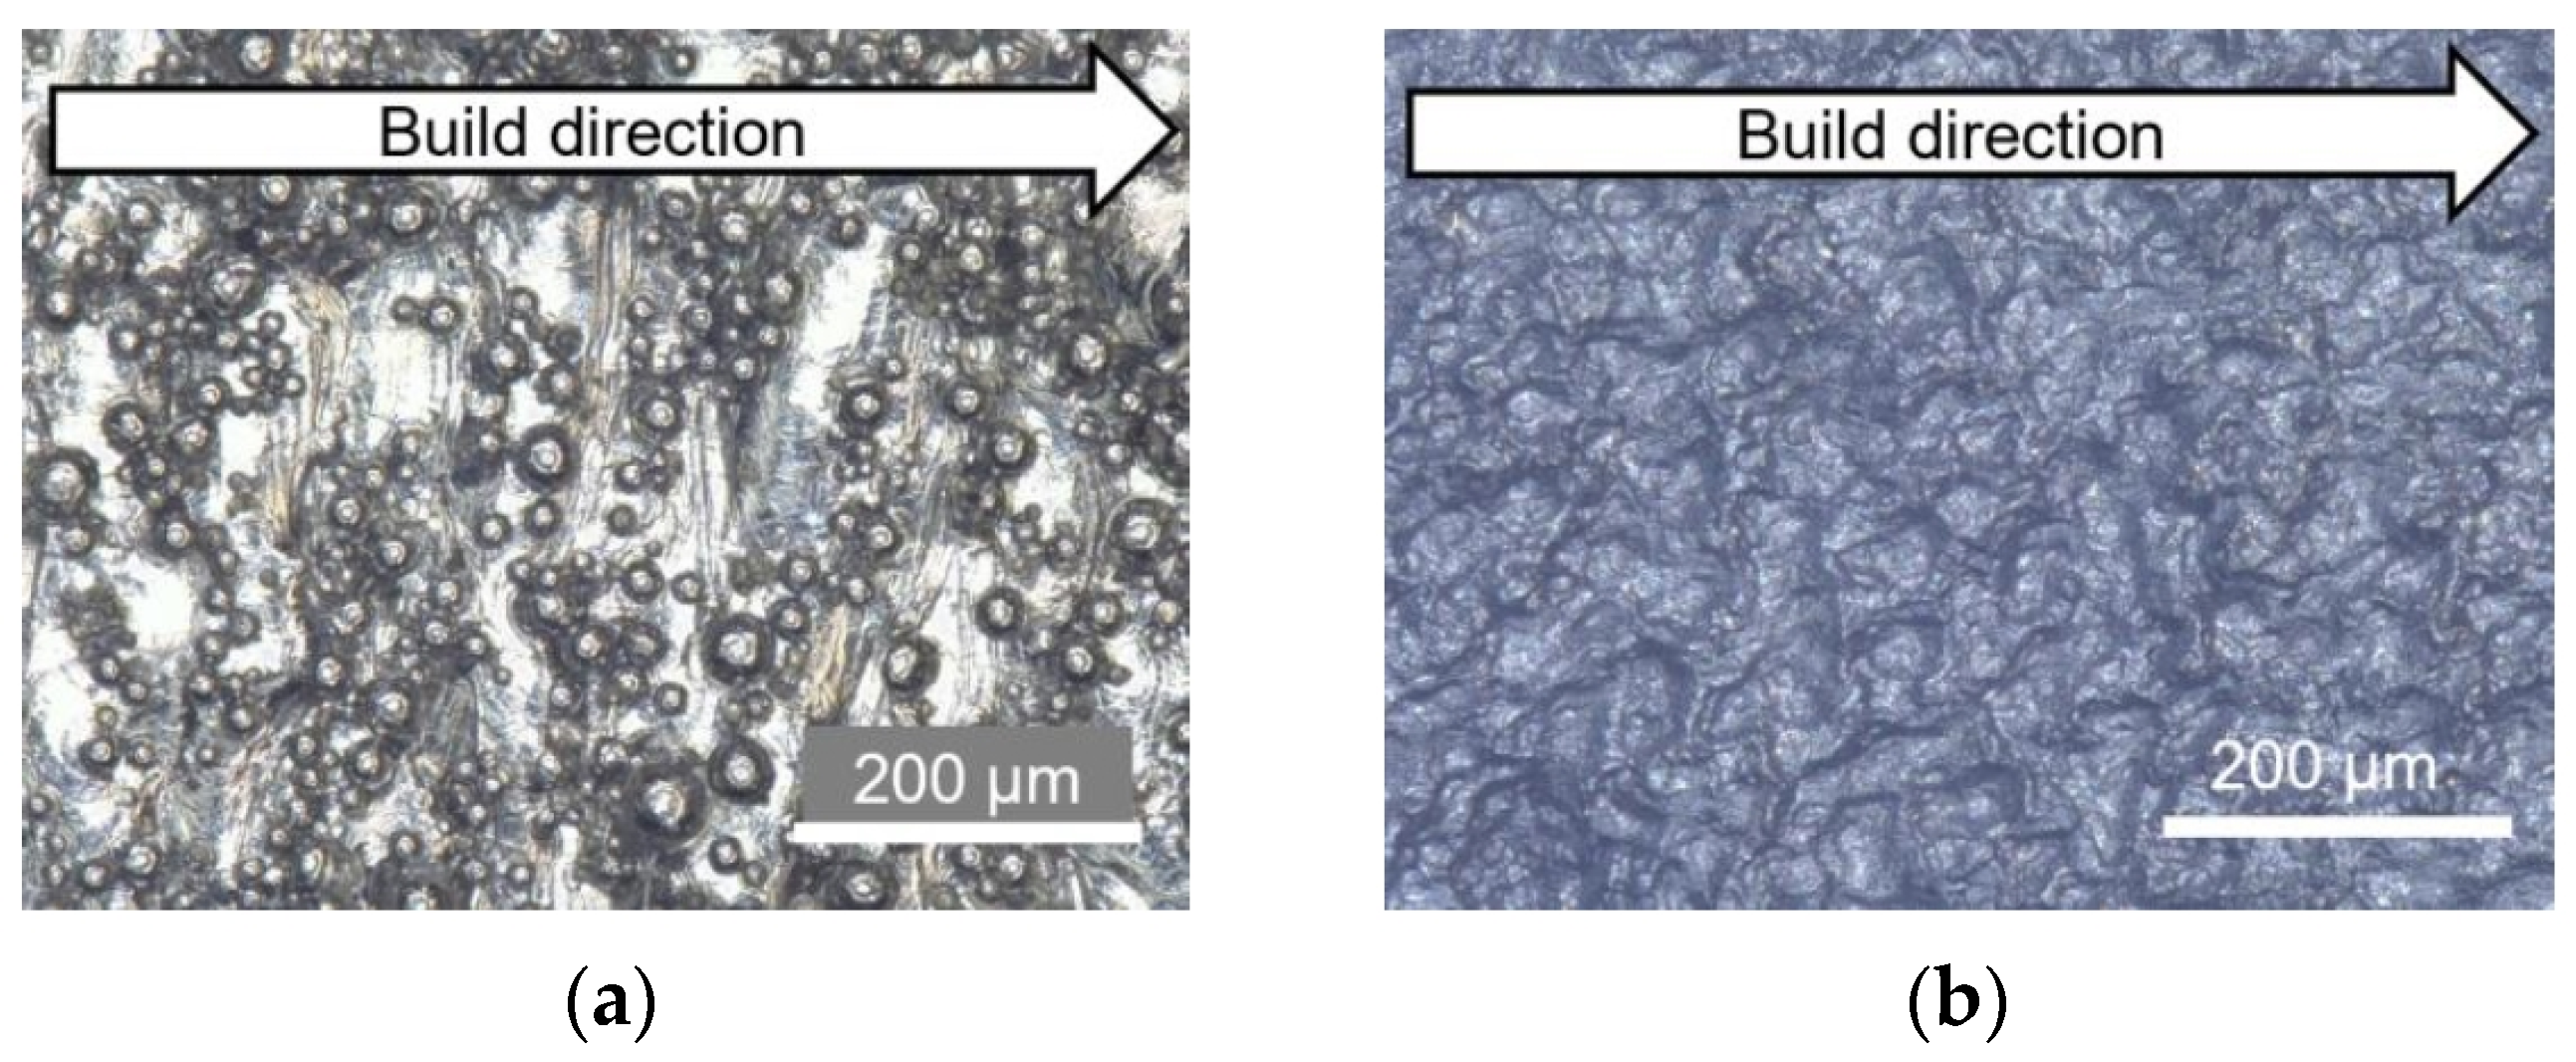
Figure 23 shows images of additively manufactured titanium alloy Ti6Al4V produced using DMLS: (a) as-built specimen and (b) laser-cavitation-peened specimen [10]. Many unmelted particles were observed on the surface of the as-built specimen, and the maximum height of roughness Rz was about 140 µm. After laser cavitation peening, Rz decreased to about 100 µm, and compressive residual stress was introduced [10]. The hardness was also increased. Thus, the reduction in surface roughness and the introduction of compressive residual stress and work-hardening are the reasons why laser cavitation peening improves the fatigue properties of 3D metals.
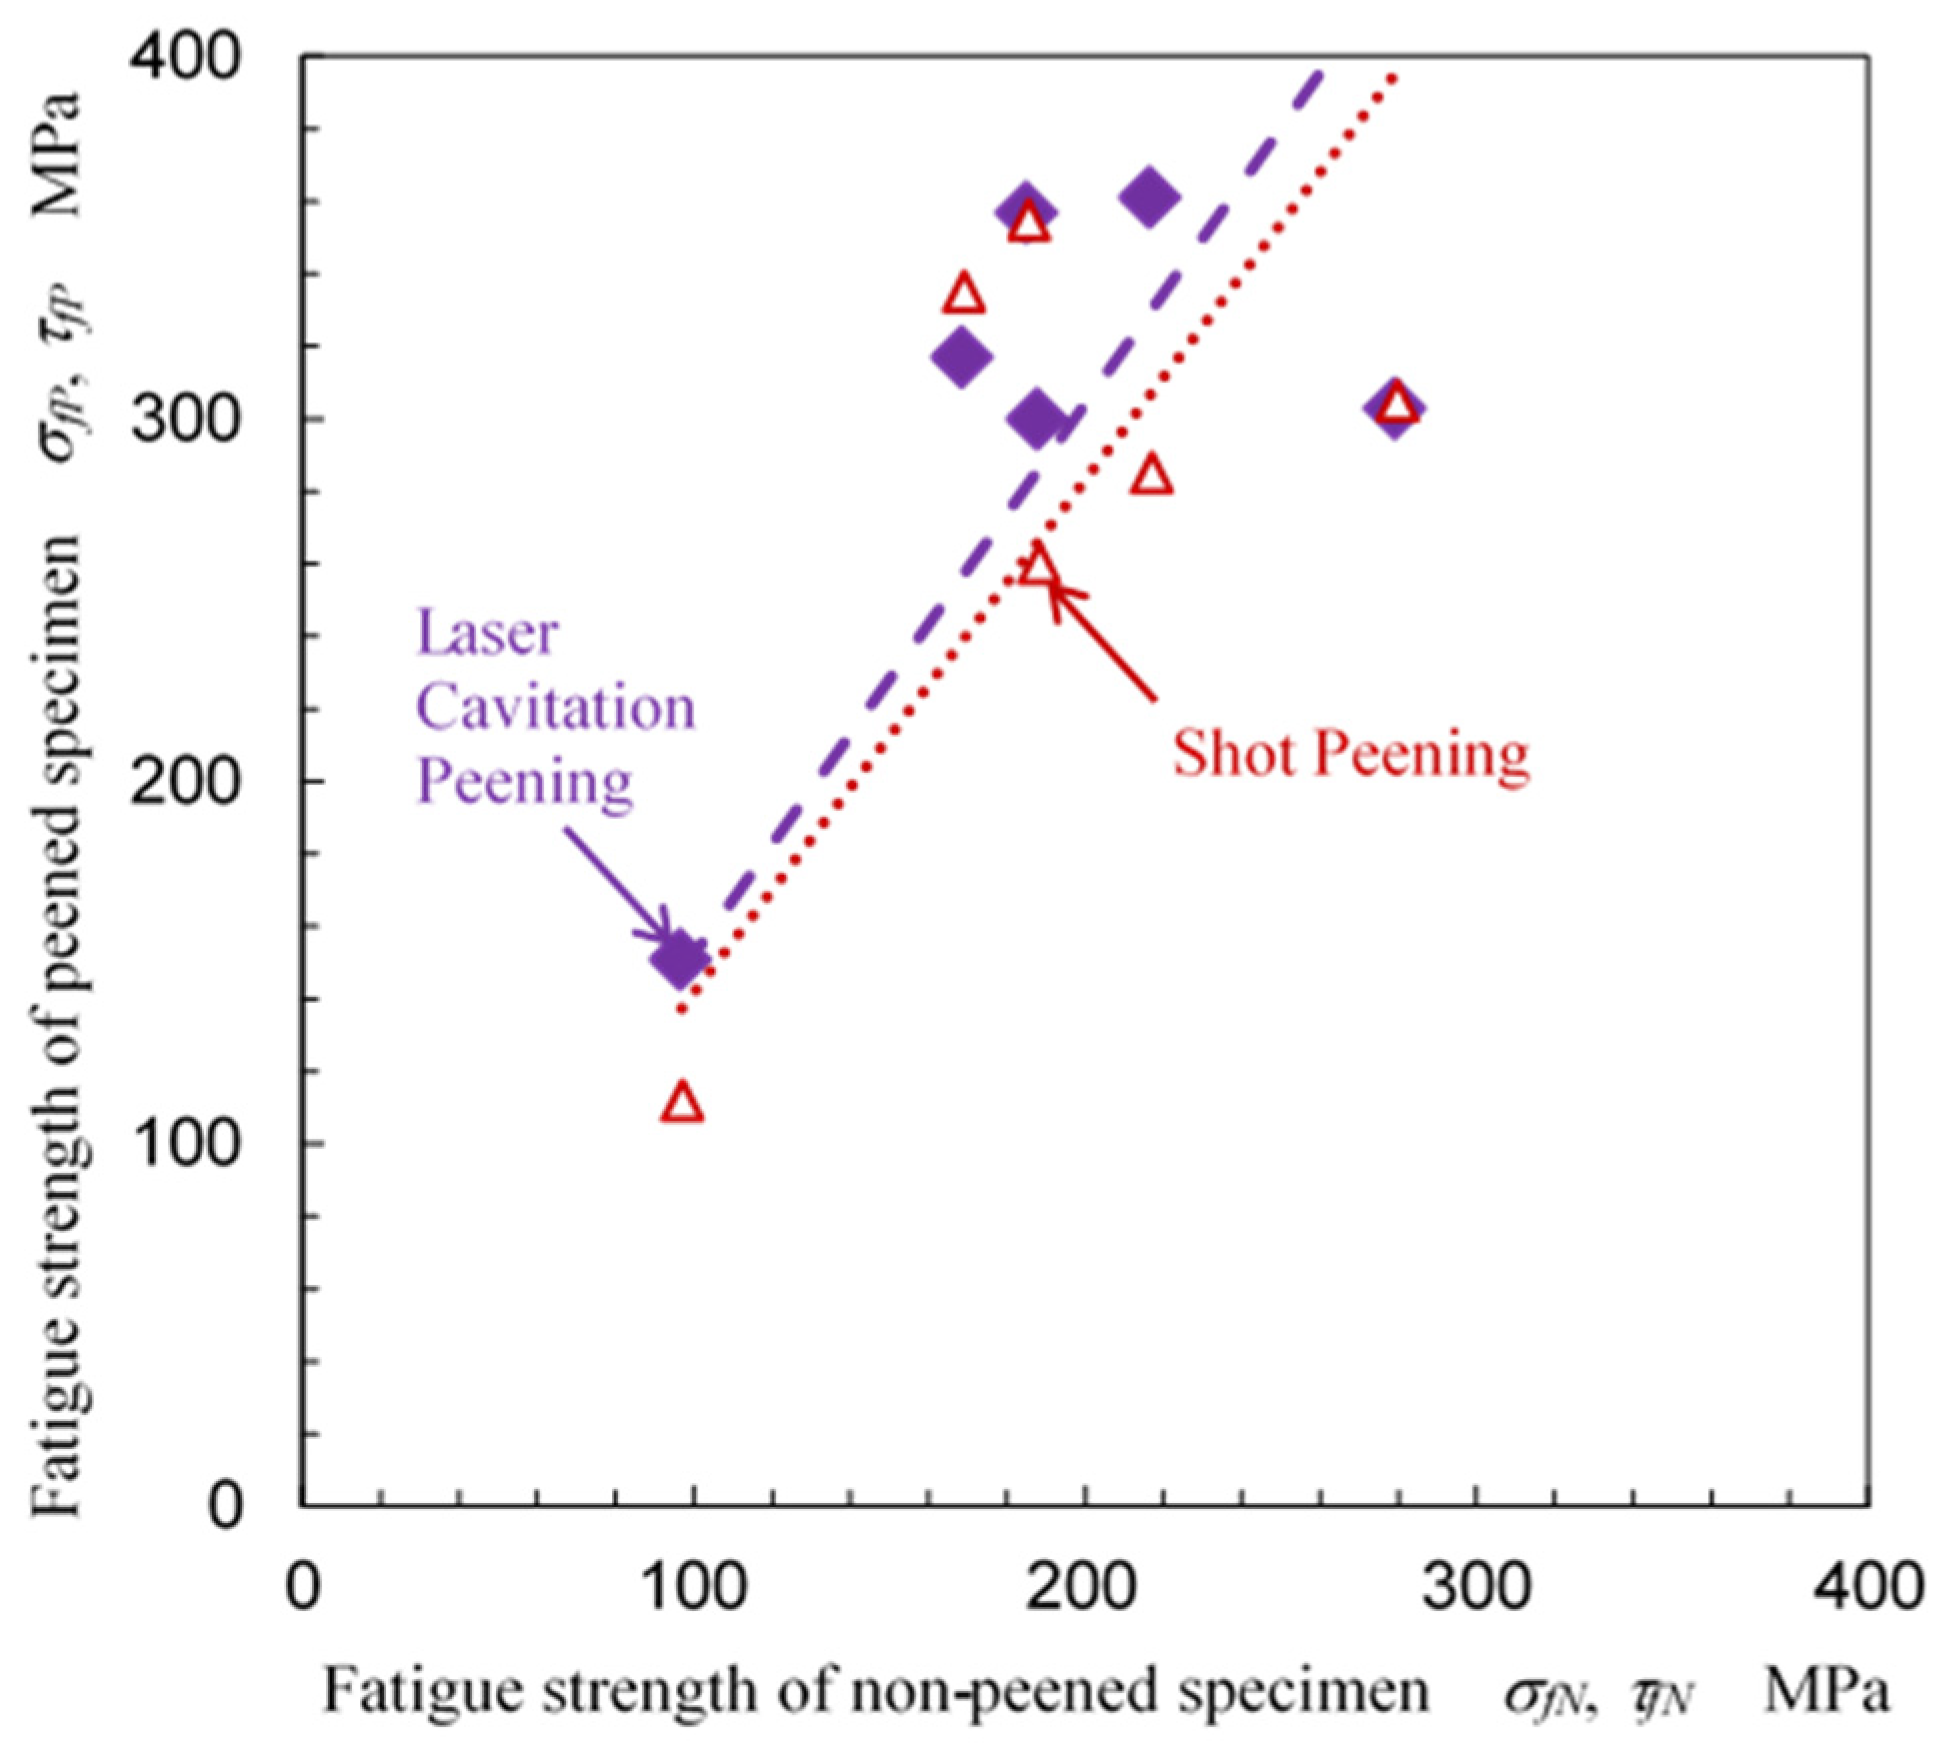
Table 1 shows the fatigue strength at 107 of non-peened metallic materials and materials that underwent laser cavitation peening compared with shot peening. The fatigue strength at 107 was calculated using Little’s method [62]. Figure 24 illustrates the relationship between the fatigue strength of the non-peened specimen, σfN, τfN, and the fatigue strength of the peened specimen, σfP, τfP. As shown in Table 1 and Figure 24, both laser cavitation peening and shot peening improve the fatigue strength compared with the non-peened specimen. When the proportional constant is considered, laser cavitation peening and shot peening can be described as in Equations (5) and (6).
σfP, τfP = 1.52 ± 0.15 σfN, τfN
σfP, τfP = 1.42 ± 0.15 σfN, τfN
Thus, laser cavitation peening can improve fatigue strength by 10% over shot peening.
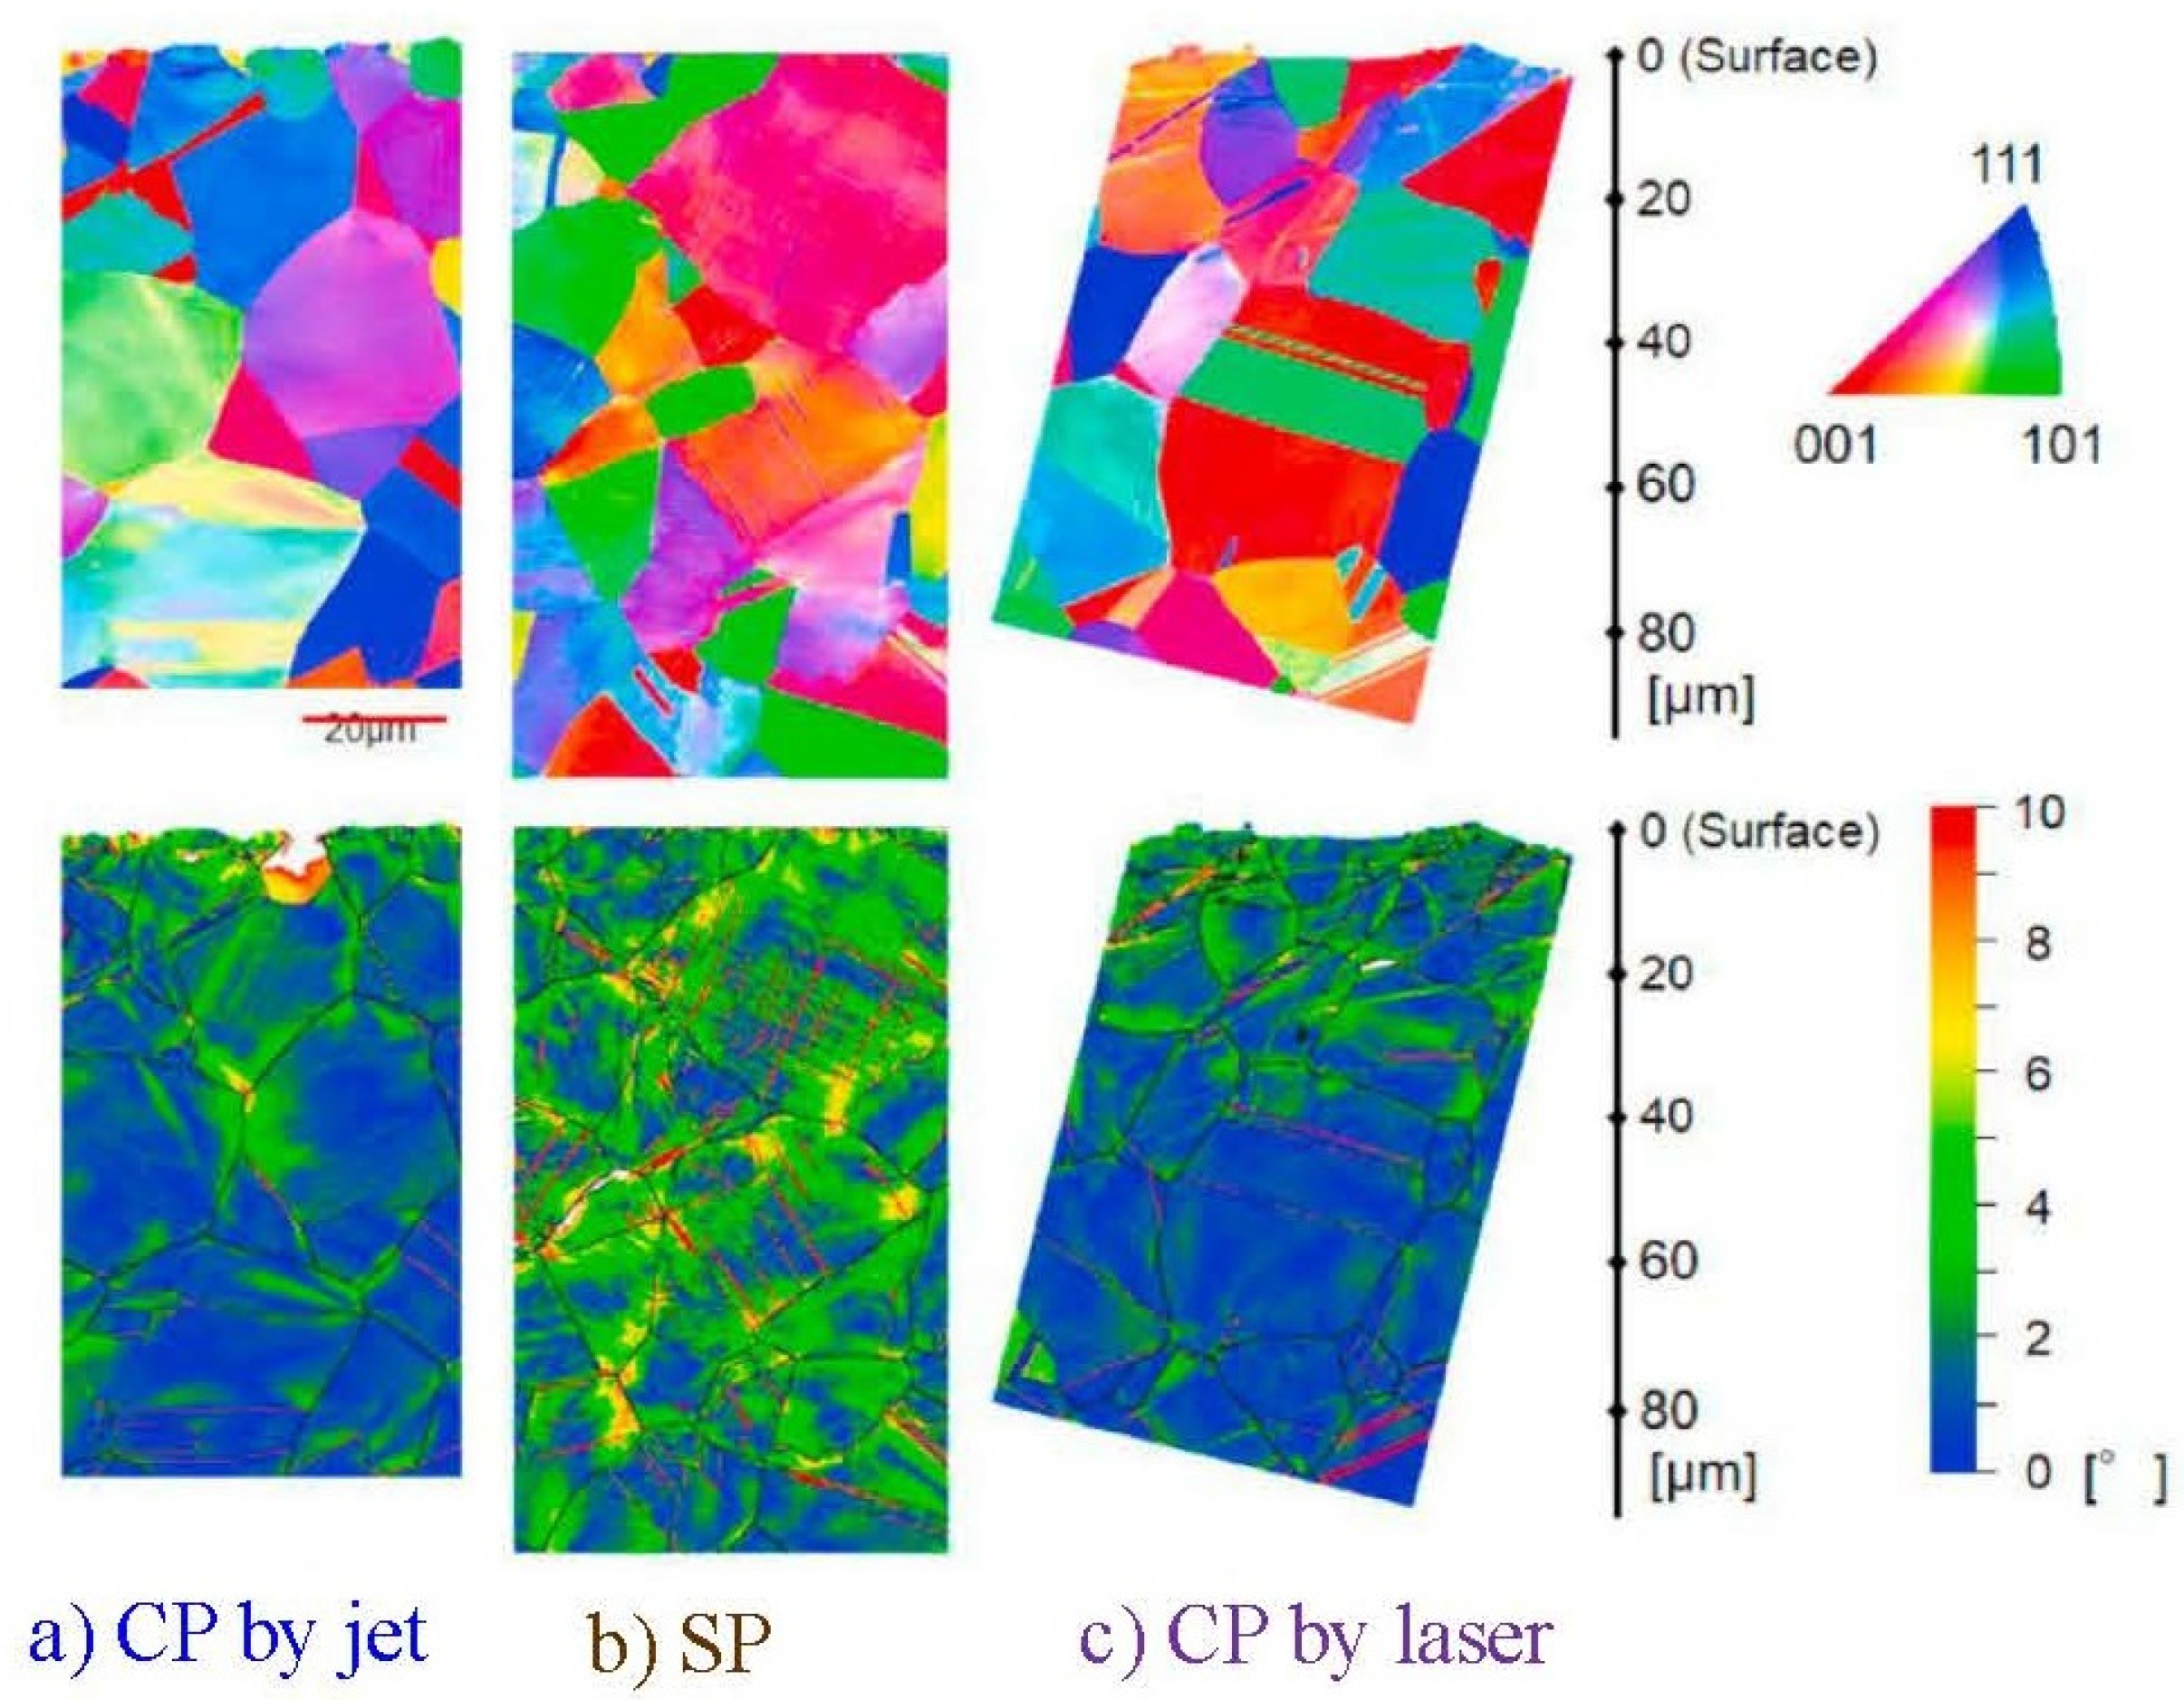
In order to consider the difference in the improvement of fatigue strength between laser cavitation peening and shot peening, Figure 25 reveals an EBSD analysis of the cross-section after (a) cavitation peening, CP, using a cavitating jet; (b) shot peening, SP; and (c) cavitation peening using a laser, i.e., laser cavitation peening [63]. During the experiment, the stainless-steel plate was treated so that the arc height was equivalent in all three cases.
Table 1. Improvement in fatigue life of metallic materials via laser cavitation peening compared with non-peened and shot peening.
MaterialFatigue TestFatigue Strength at 107References
Non-PeenedLaser Cavitation PeeningShot Peening
AM (EBM) titanium alloy Ti6Al4VPlane bending169 MPa317 MPa335 MPa[7]
AM (DMLS) titanium alloy Ti6Al4VPlane bending185 MPa357 MPa355 MPa[64]
AM (DMLS) titanium alloy Ti6Al4VTorsion217 MPa361 MPa285 MPa[65]
Magnesium alloy AZ31Plane bending97 MPa151 MPa112 MPa[66]
Stainless-steel 316LPlane bending279 MPa272 MPa305 MPa[20]
Stainless-steel 316L (welded)Plane bending188 MPa300 MPa260 MPa[16]
AM: additive manufacturing. EBM: electron beam melting. DMLS: direct metal laser sintering.
As shown in Figure 25, the dislocation density of cavitation peening using both jet and laser was less than that of shot peening. As the dislocations might become a source of crack initiation, the fatigue properties of shot peening would be weaker than those of cavitation peening. As is known, the compressive residual stress introduced by the surface treatments is released, and the relaxation of the compressive residual stress depends on the treatment methods [67,68,69,70,71]. It was reported that the relaxation of compressive residual stress introduced by cavitation peening is less than that of shot peening [72]. This would be another reason why the fatigue performance of cavitation peening is better than that of shot peening.

6. Future Work

One of the major issues to address in laser cavitation peening is the drastic improvement in efficiency, as it takes time to enhance the fatigue properties of metallic materials. A big problem of present laser cavitation peening is that the speed of the process is too slow and the slow processing speed leads to high costs. During conventional laser cavitation peening, an Nd:YAG laser with a Q-switch is used, as the impact induced by laser ablation is also utilized. As mentioned in this review paper, when suitable conditions such as the feeding of degassed water to enhance the laser cavitation collapse impact are applied, the laser cavitation impact can treat metallic materials. If the laser cavitation impact without the laser ablation impact can treat the metallic materials, a short laser pulse, whose pulse width is a few ns to generate laser ablation, is not required. It was reported that an Er:YAG laser, whose pulse width is 300 µs, can produce laser cavitation [48]. When a laser pulse of several hundred µs in pulse width can be used for laser cavitation peening, the processing efficiency of laser cavitation peening can be drastically improved. Other types of laser systems, such as fiber lasers, whose repetition frequency is 50 kHz, can be used for laser cavitation peening. Currently, the repetition frequency range of a conventional Nd:YAG laser with a Q-switch is dozens of Hz to hundreds of Hz. Thus, one of the future research directions with respect to laser cavitation peening is the research and development of laser cavitation peening using a pulse laser with a longer pulse width to increase the repetition frequency.
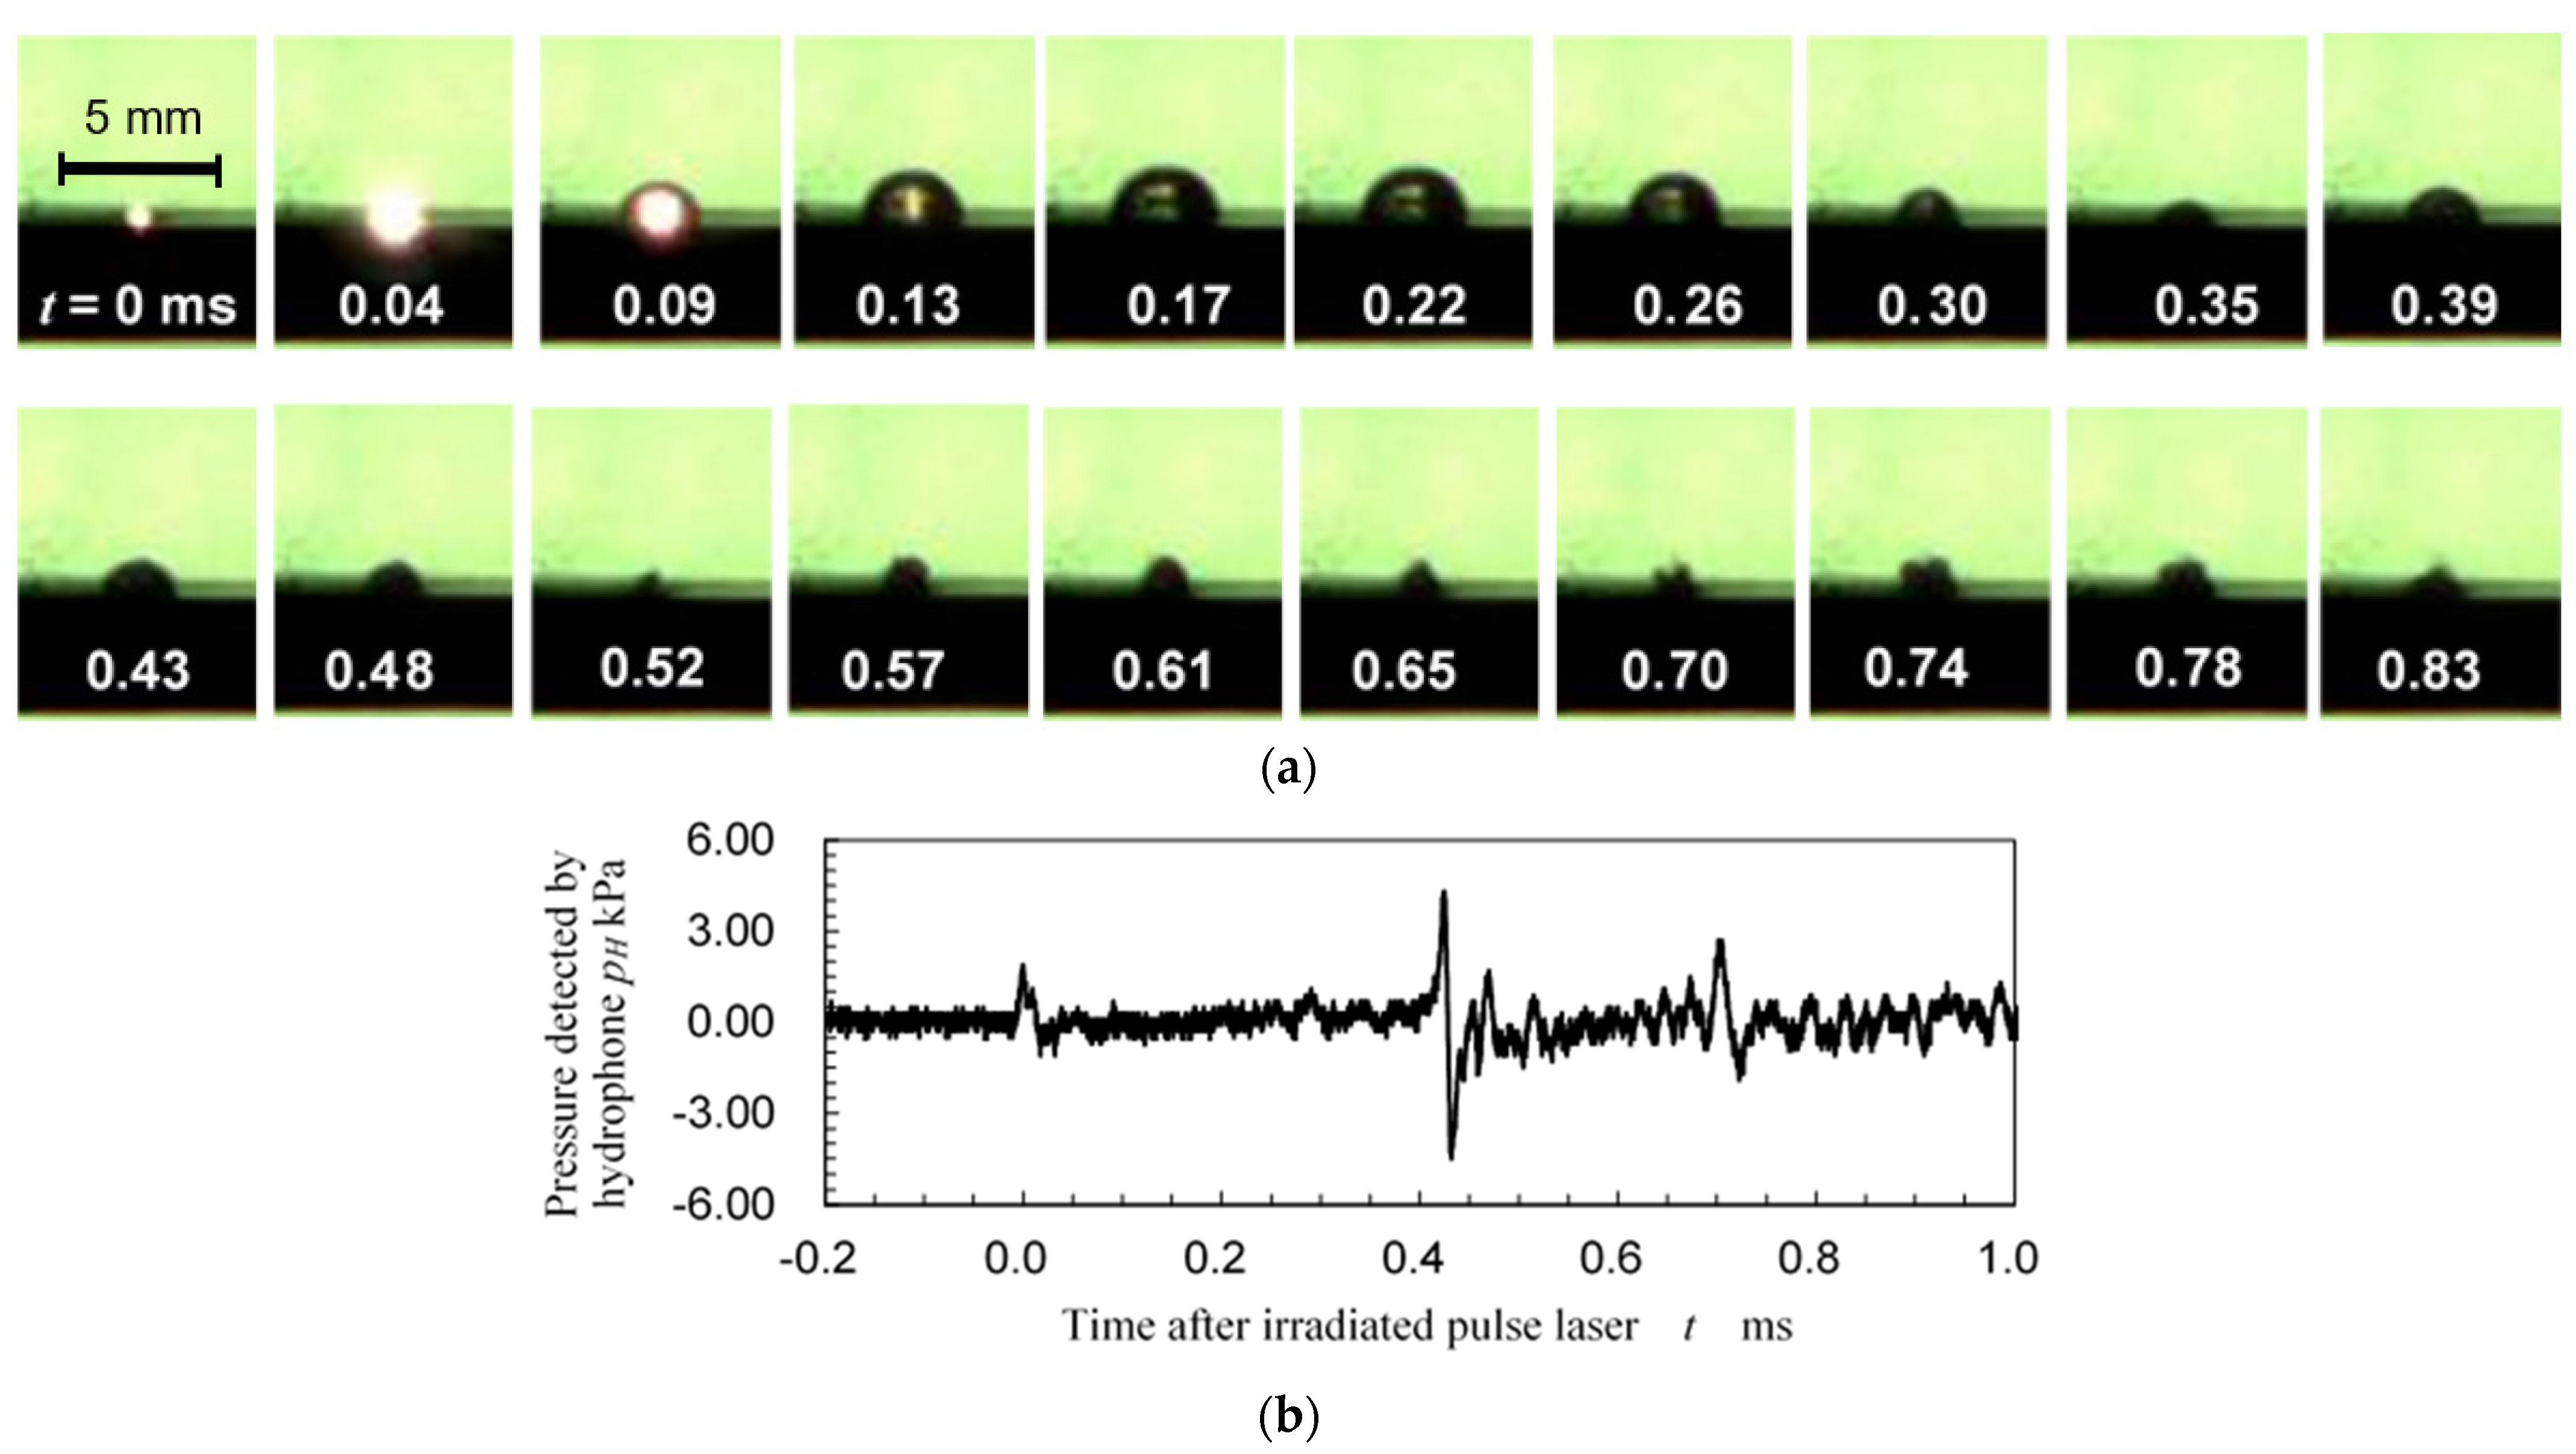
In order to reveal the possibility of laser cavitation peening using a long laser pulse, Figure 26 shows (a) images of laser cavitation and (b) the pressure detected by a hydrophone [73]. The pulse laser used was an Nd:YAG laser without a Q-switch, i.e., with normal oscillation, whose pulse width was about 200 µs. As a Q-switch was not used, the high-speed observation and the recording of the output signal from the hydrophone were not synchronized. As shown in Figure 26a, a relatively long laser pulse such as 200 µs can generate a bubble, and the bubble develops and then collapses in the same way as in Figure 7a. During laser ablation, i.e., t = 0 ms, a small pressure pulse was detected, as shown in Figure 26b. A large signal was observed during the first collapse of the laser cavitation. However, during the second collapse of the laser cavitation, the amplitude of the signal was larger than that of the laser ablation. Thus, a relatively long laser pulse such as 200 µs can generate laser cavitation, and this can be applicable for laser cavitation peening. Thus, other types of lasers, such as fiber lasers, can be utilized for laser cavitation peening to drastically increase efficiency. In order to optimize laser cavitation peening using a long laser pulse, the effect of parameters such as the laser energy, repetition frequency, standoff distance, and focal distance of the lens should be investigated, as laser cavitation peening utilizes a subcooling phenomenon, as shown in Figure 9.

7. Conclusions

In order to reveal the importance of the collapse impact of the bubble, which develops after laser ablation during submerged laser peening, the peening method was named “laser cavitation peening”, and the impact during bubble collapse was compared with the impact during laser ablation using published papers. The types of laser cavitation were reviewed by summarizing experimental data and numerical simulations, with an additional observation of laser cavitation. To show the effect of laser cavitation peening on the improvement of the fatigue properties of metallic materials, including 3D metals, the fatigue life and strength of materials after laser cavitation peening were compared with non-peened samples. The findings of the present review can be summarized as follows:
(1)
During submerged laser peening, the impact of laser cavitation, which is generated after laser ablation, can be utilized for mechanical surface treatment. This is referred to as laser cavitation peening. Water quality, such as gas content, is an important factor, as the cavitation bubble collapse impact is affected by the gas content; this is called the cushion effect.
(2)
The impact passing through the target of laser cavitation collapse is greater than that of laser ablation, although the amplitude of the shockwave in water induced by laser ablation is larger than that of laser cavitation collapse.
(3)
A hemispherical bubble is most effective for laser cavitation peening compared with a spherical bubble, which produces a microjet in the bubble.
(4)
In the case of laser cavitation peening, the peening intensity is proportional to the volume of laser cavitation when the threshold of the target materials is considered.
(5)
During laser cavitation peening, the area near the edge can be treated using laser cavitation, which develops and collapses near the edge.
(6)
Laser cavitation peening improves the fatigue strength of metallic materials, including three-dimensional additively manufactured metals (3D metals). In the case of magnesium alloy AZ31, the fatigue strength at N = 107 evaluated by a plane bending fatigue test was 151 MPa for laser cavitation peening, 112 MPa for shot peening, and 97 MPa for non-peened. In the case of additively manufactured Ti6Al4V by DMLS, the fatigue strength at N = 107 evaluated by a torsion fatigue test was 361 MPa for laser cavitation peening, 285 MPa for shot peening, and 217 MPa for non-peened.

Author Contributions

H.S.: conceptualization, additional experiment, writing—original draft, visualization, project administration, and funding acquisition. Y.I.: conceptualization, visualization, and writing—review and editing. All authors have read and agreed to the published version of the manuscript.

Funding

This research was partly supported by JSPS KAKENHI, grant numbers 23H01292 and 22KK0050, and the Amada Foundation AF-2021219-B3.

Institutional Review Board Statement

Not applicable.

Informed Consent Statement

Not applicable.

Data Availability Statement

The data presented in this study are available upon request from the authors.

Conflicts of Interest

The authors declare no conflict of interest.

References

  1. Wagner, L. Mechanical surface treatments on titanium, aluminum and magnesium alloys. Mater. Sci. Eng. A 1999, 263, 210–216. [Google Scholar] [CrossRef]
  2. Wang, P.; Li, X.; Luo, S.; Nai, M.L.S.; Ding, J.; Wei, J. Additively manufactured heterogeneously porous metallic bone with biostructural functions and bone-like mechanical properties. J. Mater. Sci. Technol. 2021, 62, 173–179. [Google Scholar] [CrossRef]
  3. Edwards, P.; O’Conner, A.; Ramulu, M. Electron beam additive manufacturing of titanium components: Properties and performance. J. Manuf. Sci. Eng. 2013, 135, 061016. [Google Scholar] [CrossRef]
  4. Peyre, P.; Fabbro, R.; Merrien, P.; Lieurade, H.P. Laser shock processing of aluminium alloys. Application to high cycle fatigue behaviour. Mater. Sci. Eng. A 1996, 210, 102–113. [Google Scholar] [CrossRef]
  5. Sano, Y. Quarter century development of laser peening without coating. Metals 2020, 10, 152. [Google Scholar] [CrossRef]
  6. Soyama, H.; Korsunsky, A.M. A critical comparative review of cavitation peening and other surface peening methods. J. Mater. Process. Technol. 2022, 305, 117586. [Google Scholar] [CrossRef]
  7. Soyama, H.; Okura, Y. The use of various peening methods to improve the fatigue strength of titanium alloy Ti6Al4V manufactured by electron beam melting. AIMS Mater. Sci. 2018, 5, 1000–1015. [Google Scholar] [CrossRef]
  8. Hackel, L.; Rankin, J.R.; Rubenchik, A.; King, W.E.; Matthews, M. Laser peening: A tool for additive manufacturing post-processing. Addit. Manuf. 2018, 24, 67–75. [Google Scholar] [CrossRef]
  9. Kahlin, M.; Ansell, H.; Basu, D.; Kerwin, A.; Newton, L.; Smith, B.; Moverare, J.J. Improved fatigue strength of additively manufactured Ti6Al4V by surface post processing. Int. J. Fatigue 2020, 134, 105497. [Google Scholar] [CrossRef]
  10. Kuji, C.; Soyama, H. Mechanical surface treatment of titanium alloy Ti6Al4V manufactured by direct metal laser sintering using laser cavitation. Metals 2023, 13, 181. [Google Scholar] [CrossRef]
  11. Sano, Y.; Obata, M.; Kubo, T.; Mukai, N.; Yoda, M.; Masaki, K.; Ochi, Y. Retardation of crack initiation and growth in austenitic stainless steels by laser peening without protective coating. Mater. Sci. Eng. A 2006, 417, 334–340. [Google Scholar] [CrossRef]
  12. Mao, B.; Siddaiah, A.; Menezes, P.L.; Liao, Y.L. Surface texturing by indirect laser shock surface patterning for manipulated friction coefficient. J. Mater. Process. Technol. 2018, 257, 227–233. [Google Scholar] [CrossRef]
  13. Kawashima, T.; Sano, T.; Hirose, A.; Tsutsumi, S.; Masaki, K.; Arakawa, K.; Hori, H. Femtosecond laser peening of friction stir welded 7075-T73 aluminum alloys. J. Mater. Process. Technol. 2018, 262, 111–122. [Google Scholar] [CrossRef]
  14. Yoshida, M.; Nishibata, I.; Matsuda, T.; Ito, Y.; Sugita, N.; Shiro, A.; Shobu, T.; Arakawa, K.; Hirose, A.; Sano, T. Influence of pulse duration on mechanical properties and dislocation density of dry laser peened aluminum alloy using ultrashort pulsed laser-driven shock wave. J. Appl. Phys. 2022, 132, 075101. [Google Scholar] [CrossRef]
  15. Sano, Y.; Akita, K.; Sano, T. A mechanism for inducing compressive residual stresses on a surface by laser peening without coating. Metals 2020, 10, 816. [Google Scholar]
  16. Soyama, H. Laser cavitation peening and its application for improving the fatigue strength of welded parts. Metals 2021, 11, 531. [Google Scholar] [CrossRef]
  17. Gu, J.Y.; Luo, C.H.; Ma, P.C.A.; Xu, X.C.; Wu, Y.; Ren, X.D. Study on processing and strengthening mechanisms of mild steel subjected to laser cavitation peening. Appl. Surf. Sci. 2021, 562, 150242. [Google Scholar]
  18. Sasoh, A.; Watanabe, K.; Sano, Y.; Mukai, N. Behavior of bubbles induced by the interaction of a laser pulse with a metal plate in water. Appl. Phys. A 2005, 80, 1497–1500. [Google Scholar]
  19. Soyama, H. Key factors and applications of cavitation peening. Inter. J. Peen. Sci. Technol. 2017, 1, 3–60. [Google Scholar]
  20. Soyama, H. Comparison between the improvements made to the fatigue strength of stainless steel by cavitation peening, water jet peening, shot peening and laser peening. J. Mater. Process. Technol. 2019, 269, 65–78. [Google Scholar] [CrossRef]
  21. Soyama, H.; Sekine, Y.; Saito, K. Evaluation of the enhanced cavitation impact energy using a pvdf transducer with an acrylic resin backing. Measurement 2011, 44, 1279–1283. [Google Scholar] [CrossRef]
  22. Glaser, D.; Polese, C. Cavitation bubble oscillation period as a process diagnostic during the laser shock peening process. Appl. Phys. A 2017, 123, 603. [Google Scholar] [CrossRef]
  23. Ren, X.D.; Wang, J.; Yuan, S.Q.; Adu-Gyamfi, S.; Tong, Y.Q.; Zuo, C.Y.; Zhang, H.F. Mechanical effect of laser-induced cavitation bubble of 2a02 alloy. Opt. Laser Technol. 2018, 105, 180–184. [Google Scholar] [CrossRef]
  24. Saitou, N.; Enomoto, K.; Kurosawa, K.; Morinaka, R.; Hayashi, E.; Ishikwa, T.; Yoshimura, T. Development of water jet peening technique for reactor internal components of nuclear power plant. J. Jet Flow Eng. 2003, 20, 4–12. [Google Scholar]
  25. Soyama, H. Cavitating jet: A review. Applied Sciences 2020, 10, 7280. [Google Scholar] [CrossRef]
  26. Plesset, M.S.; Chapman, R.B. Collapse of an initially spherical vapour cavity in neighbourhood of a solid boundary. J. Fluid Mech. 1971, 47, 283–290. [Google Scholar]
  27. Lauterborn, W.; Bolle, H. Experimental investigations of cavitation-bubble collapse in neighborhood of a solid boundary. J. Fluid Mech. 1975, 72, 391–399. [Google Scholar] [CrossRef]
  28. Crum, L.A. Surface oscillations and jet development in pulsating bubbles. J. Phys. Colloques 1979, 40, 285–288. [Google Scholar] [CrossRef]
  29. Brennen, C.E. Cavitation and Bubble Dynamics; Oxford University Press: Oxford, UK, 1995. [Google Scholar]
  30. Ley, S.V.; Low, C.M.R. Ultrasound in Synthesis; Springer: Berlin, Germany, 1980. [Google Scholar]
  31. Gonzalez-Avila, S.R.; Denner, F.; Ohl, C.-D. The acoustic pressure generated by the cavitation bubble expansion and collapse near a rigid wall. Phys. Fluids 2021, 33, 032118. [Google Scholar] [CrossRef]
  32. Park, S.-H.; Phan, T.-H.; Park, W.-G. Numerical investigation of laser-induced cavitation bubble dynamics near a rigid surface based on three-dimensional fully compressible model. Inter. J. Heat and Mass Transfer 2022, 191, 122853. [Google Scholar] [CrossRef]
  33. Sun, Y.; Du, Y.; Yao, Z.; Zhong, Q.; Geng, S.; Wang, F. The effect of surface geometry of solid wall on the collapse of a cavitation bubble. J. Fluids Eng. 2022, 144, 071402. [Google Scholar] [CrossRef]
  34. Sieber, A.B.; Preso, D.B.; Farhat, M. Cavitation bubble dynamics and microjet atomization near tissue-mimicking materials. Phys. Fluids 2023, 35, 027101. [Google Scholar] [CrossRef]
  35. Iga, Y.; Sasaki, H. Relationship between a non-spherical collapse of a bubble and a stress state inside a wall. Phys. Fluids 2023, 35, 023312. [Google Scholar] [CrossRef]
  36. Hatamleh, O.; Lyons, J.; Forman, R. Laser and shot peening effects on fatigue crack growth in friction stir welded 7075-T7351 aluminum alloy joints. Int. J. Fatigue 2007, 29, 421–434. [Google Scholar] [CrossRef]
  37. Gill, A.; Telang, A.; Mannava, S.R.; Qian, D.; Pyoun, Y.-S.; Soyama, H.; Vasudevan, V.K. Comparison of mechanisms of advanced mechanical surface treatments in nickel-based superalloy. Mater. Sci. Eng. A 2013, 576, 346–355. [Google Scholar] [CrossRef]
  38. Philipp, A.; Lauterborn, W. Cavitation erosion by single laser-produced bubbles. J. Fluid Mech. 1998, 361, 75–116. [Google Scholar] [CrossRef]
  39. Soyama, H. Introduction of Compressive Residual Stress into Alloy Tool Steel by Submerged Laser Peening Utilizing Laser Cavitation Impact. In Proceedings of the International Conference on Leading Edge Manufacturing in 21st Century: LEM21 2017.9; 2017; Volume 9, p. 10. Available online: https://www.jstage.jst.go.jp/article/jsmelem/2017.9/0/2017.9_010/_article/-char/ja/ (accessed on 23 April 2023).
  40. Sano, Y.; Kato, T.; Mizuta, Y.; Tamaki, S.; Yokofujita, K.; Taira, T.; Hosokai, T.; Sakino, Y. Development of a portable laser peening device and its effect on the fatigue properties of HT780 butt-welded joints. Forces Mech. 2022, 7, 100080. [Google Scholar] [CrossRef]
  41. Kang, C.; Liu, H.X.; Soyama, H. Estimation of aggressive intensity of a cavitating jet with multiple experimental methods. Wear 2018, 394, 176–186. [Google Scholar] [CrossRef]
  42. Noor Shahira Masroon, N.S.; Hirata, H.; Tsuyama, M.; Heya, M.; Nakano, H. Effects of laser peening parameters on plastic deformation in aqueous glycerol solution as plasma confinement layer. J. Laser Micro/Nanoeng. 2021, 16, 160–165. [Google Scholar]
  43. Soyama, H.; Kokubun, T. Effect of impact induced by cavitation bubble on submerged laser peening. J. Shot Peening Technol. Japan 2016, 28, 48–49. [Google Scholar]
  44. J442_202205; Test Strip, Holder, and Gage for Shot Peening. SAE International Standards: Warrendale, PA, USA, 2013; pp. 1–5.
  45. J443_201708; Procedures for Using Standard Shot Peening Almen Strip. SAE International Standards: Warrendale, PA, USA, 2010; pp. 1–6.
  46. Soyama, H. Cavitation peening: A review. Metals 2020, 10, 270. [Google Scholar] [CrossRef]
  47. Soyama, H. Comparison between impact induced by abrasion and bubble collapse impact on laser peening. Proc. Mechanica Eng. Congr. 2016, 16, G0400402. [Google Scholar] [CrossRef]
  48. Soyama, H.; Yahata, Y.; Saito, M. Aspect of bubbles in narrow tube imitating root canal induced by er: Yag laser. In Proceedings of the 11th International Symposium on Cavitation, Virtual, 10–13 May 2021; pp. 229–232. [Google Scholar]
  49. Sugimoto, Y.; Obata, S. Behavior of a sphere caused by pulsed laser induced bubble simulating stone crushing with TUL. Proc. 11th Inter. Sympo. Cavitation 2021, 614–617. [Google Scholar]
  50. Nguyen, T.T.P.; Tanabe, R.; Ito, Y. Influences of focusing conditions on dynamics of laser ablation at a solid–liquid interface. Appl. Phys. Express 2013, 6, 122701. [Google Scholar] [CrossRef]
  51. Soyama, H. Comparison between shot peening, cavitation peening and laser peening by observation of crack initiation and crack growth in stainless steel. Metals 2020, 10, 63. [Google Scholar] [CrossRef]
  52. Lauterborn, W.; Ohl, C.D. Cavitation bubble dynamics. Ultrason. Sonochem. 1997, 4, 65–75. [Google Scholar] [CrossRef] [PubMed]
  53. Ohl, C.D.; Lindau, O.; Lauterborn, W. Luminescence from spherically and aspherically collapsing laser induced bubbles. Phys. Rev. Lett. 1998, 80, 393–396. [Google Scholar] [CrossRef]
  54. Ohl, C.D.; Kurz, T.; Geisler, R.; Lindau, O.; Lauterborn, W. Bubble dynamics, shock waves and sonoluminescence. Philos. Trans. R. Soc. A 1999, 357, 269–294. [Google Scholar] [CrossRef]
  55. Soyama, H. Luminescence intensity of vortex cavitation in a venturi tube changing with cavitation number. Ultrason. Sonochem. 2021, 71, 105389. [Google Scholar] [CrossRef] [PubMed]
  56. Rayleigh, L. On the pressure developed in a liquid during the collapse of a spherical cavity. Lond. Edinb. Dublin Philos. Mag. J. Sci. 1917, 34, 94–98. [Google Scholar] [CrossRef]
  57. Soyama, H.; Kuji, C.; Kuriyagawa, T.; Chighizola, C.R.; Hill, M.R. Optimization of residual stress measurement conditions for a 2D method using X-ray diffraction and its application for stainless steel treated by laser cavitation peening. Materials 2021, 14, 2772. [Google Scholar] [CrossRef] [PubMed]
  58. Soyama, H. Surface mechanics design by cavitation peening using submerged pulse laser. In Proceedings of the Abstracts of 7th International Conference on Laser Peening and Related Phenomena, Singapore, 17–22 June 2018; p. 57. [Google Scholar]
  59. Soyama, H. Introduction of compressive residual stress into stainless steel by bubble induced by submerged pulse laser. J. Shot Peening Technol. Japan 2019, 31, 86–87. [Google Scholar]
  60. Soyama, H.; Kuji, C. Improving effects of cavitation peening, using a pulsed laser or a cavitating jet, and shot peening on the fatigue properties of additively manufactured titanium alloy Ti6Al4V. Surf. Coat. Technol. 2022, 451, 129047. [Google Scholar] [CrossRef]
  61. Khorasani, M.; Gibson, I.; Ghasemi, A.H.; Hadavi, E.; Rolfe, B. Laser subtractive and laser powder bed fusion of metals: Review of process and production features. Rapid Prototyp. J. 2023, 29, 935–958. [Google Scholar] [CrossRef]
  62. Little, R.E. Estimating the median fatigue limit for very small up-and-down quantal response tests and for S-N data with runouts. ASTM STP 1972, 511, 29–42. [Google Scholar]
  63. Kumagai, M.; Curd, M.E.; Soyama, H.; Ungár, T.; Ribárik, G.; Withers, P.J. Depth-profiling of residual stress and microstructure for austenitic stainless steel surface treated by cavitation, shot and laser peening. Mater. Sci. Eng. A 2021, 813, 141037. [Google Scholar] [CrossRef]
  64. Soyama, H.; Takeo, F. Effect of various peening methods on the fatigue properties of titanium alloy Ti6Al4V manufactured by direct metal laser sintering and electron beam melting. Materials 2020, 13, 2216. [Google Scholar] [CrossRef] [PubMed]
  65. Soyama, H.; Kuji, C. Comparison on fatigue strength of additive manufactured titanium alloy by various peening methods. In Proceedings of the Annual Meeting Society Materials Science Japan, Tsukuba, Japan, 29–30 May 2023; Volume 72. [Google Scholar]
  66. Soyama, H.; Kuji, C.; Liao, Y. Comparison of the effects of submerged laser peening, cavitation peening and shot peening on the improvement of the fatigue strength of magnesium alloy AZ31. J. Magnes. Alloy. 2023, 11. [Google Scholar] [CrossRef]
  67. Munoz-Cubillos, J.; Coronado, J.J.; Rodriguez, S.A. Deep rolling effect on fatigue behavior of austenitic stainless steels. Int. J. Fatigue 2017, 95, 120–131. [Google Scholar] [CrossRef]
  68. Zhou, J.; Retraint, D.; Sun, Z.; Kanoute, P. Comparative study of the effects of surface mechanical attrition treatment and conventional shot peening on low cycle fatigue of a 316L stainless steel. Surf. Coat. Technol. 2018, 349, 556–566. [Google Scholar] [CrossRef]
  69. Telang, A.; Gnaupel-Herold, T.; Gill, A.; Vasudevan, V.K. Effect of applied stress and temperature on residual stresses induced by peening surface treatments in alloy. J. Mater. Eng. Perform. 2018, 27, 2796–2804. [Google Scholar] [CrossRef]
  70. Ben Moussa, N.; Gharbi, K.; Chaieb, I.; Ben Fredj, N. Improvement of AISI 304 austenitic stainless steel low-cycle fatigue life by initial and intermittent deep rolling. Int. J. Adv. Manuf. Technol. 2019, 101, 435–449. [Google Scholar] [CrossRef]
  71. Yang, S.; Zeng, W.; Yang, J. Characterization of shot peening properties and modelling on the fatigue performance of 304 austenitic stainless steel. Int. J. Fatigue 2020, 137, 105621. [Google Scholar] [CrossRef]
  72. Soyama, H.; Chighizola, C.R.; Hill, M.R. Effect of compressive residual stress introduced by cavitation peening and shot peening on the improvement of fatigue strength of stainless steel. J. Mater. Process. Technol. 2021, 288, 116877. [Google Scholar] [CrossRef]
  73. Soyama, H. Laser cavitation peening using a Nd: YAG laser with and without Q-switch. In Abstracts of Quantum Beam Application for Sciences and Industries; 2023; p. 51. Available online: https://qbasis2023.isir-sanken.jp/QBASIS2023/wp-content/uploads/2023/05/Q-BASIS-2023_Abstract_finalver.pdf (accessed on 28 April 2023).
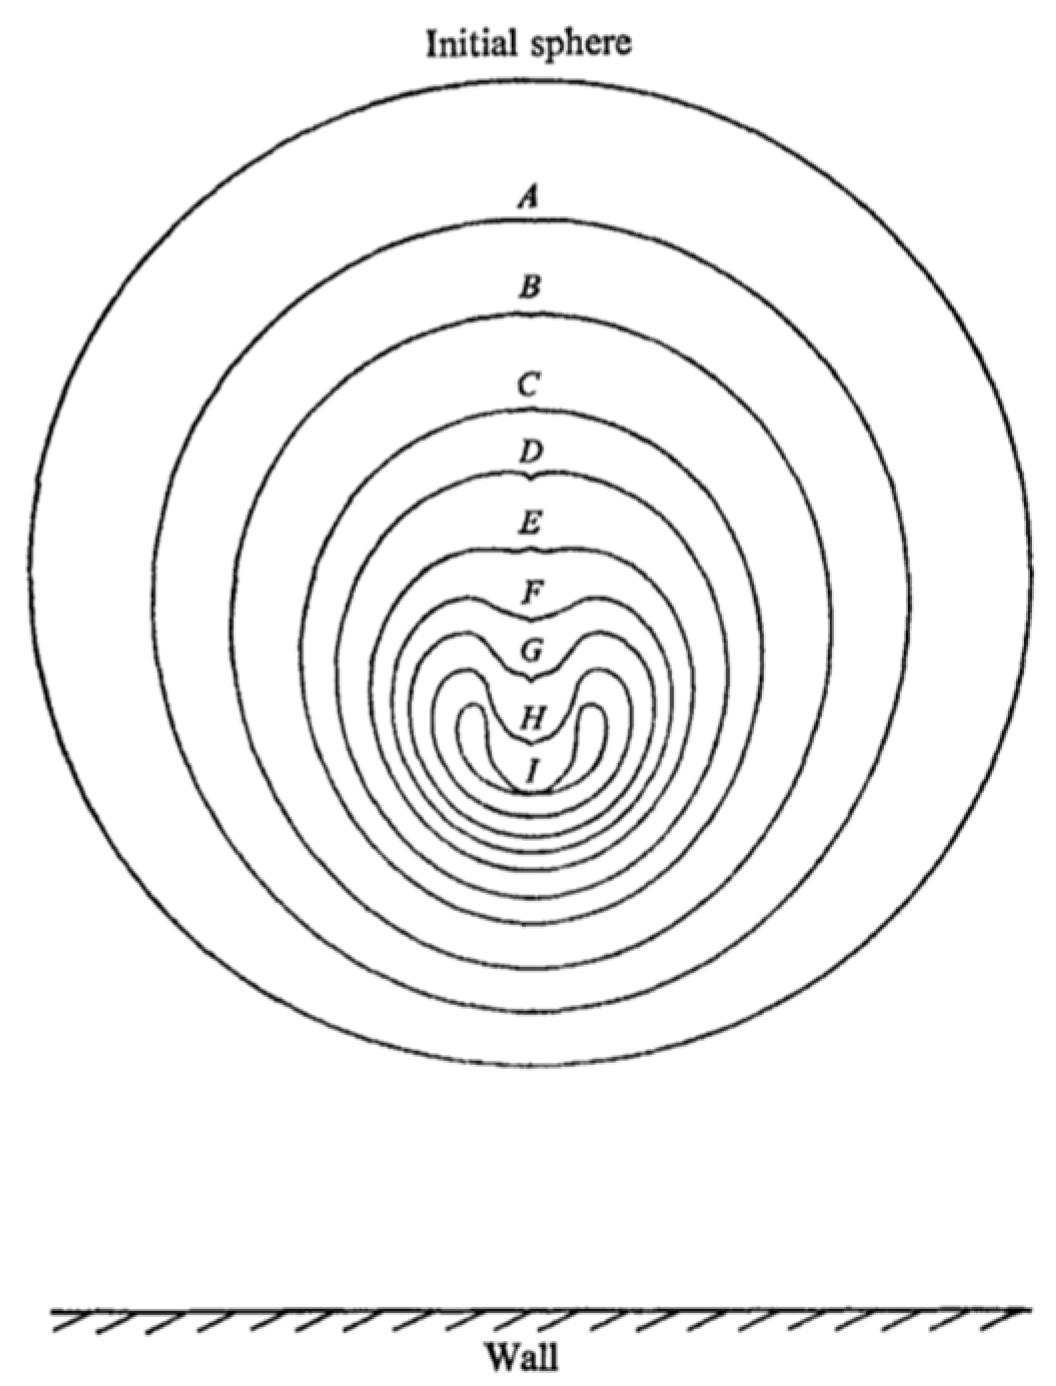
Figure 1. Collapse of a cavitation bubble near a solid boundary in water, computed by Plesset and Chapman. Reprinted from [26], with permission from Cambridge University Press, License Number 5517380575228.
Applsci 13 06702 g001
Figure 2. Fluid/material-coupled numerical simulation of collapse of a bubble near a wall by Iga and Sasaki [35]: (a) spherical bubble near the wall (microjet mode); (b) hemispherical bubble on the wall (hemispherical mode).
Applsci 13 06702 g002
Figure 3. Fundamental process: (a) laser peening without coating (LPwC); (b) laser peening with coating (sacrificial overlay) [5].
Applsci 13 06702 g003
Figure 4. Images of laser peening: (a) laser peening underwater (laser cavitation peening); (b) laser peening with a water film. Reprinted from [6] with permission from Elsevier, License Number 5532490457730.
Applsci 13 06702 g004
Figure 5. Schematic diagram of test section of laser cavitation peening system.
Applsci 13 06702 g005
Figure 6. Laser ablation and laser cavitation produced by a pulsed laser: (a) images showing the development of laser ablation and laser cavitation; (b) signal from a PVDF sensor in the target; (c) signal from a shockwave sensor in water. Reprinted from [20] with permission from Elsevier, License Number 5532490964237.
Applsci 13 06702 g006
Figure 7. Shockwave signal from laser-induced plasma and the collapse of the laser-induced cavitation bubble from a PVDF gauge sensor in glycerol. Reprinted from [42] with permission from Japan Laser Processing Society.
Applsci 13 06702 g007
Figure 8. Effect of impact induced by laser cavitation on submerged laser peening: (a) images of laser cavitation without pipe, (b) images of laser cavitation with pipe, and (c) effect of laser cavitation impact on peening intensity of submerged laser peening. Reprinted from [43] with permission from Japan Society of Shot Peening Technology.
Applsci 13 06702 g008
Figure 9. Schematic diagram of mechanisms and main factors of improvements in fatigue strength via laser cavitation peening.
Applsci 13 06702 g009
Figure 10. Relation between developing time and diameter of bubble [16].
Applsci 13 06702 g010
Figure 11. Effect of laser cavitation volume on peening intensity [16].
Applsci 13 06702 g011
Figure 12. Images of laser cavitation on the wall near the glass chamber.
Applsci 13 06702 g012
Figure 13. Images of laser cavitation on the wall near the edge.
Applsci 13 06702 g013
Figure 14. Introduction of compressive residual stress via laser cavitation peening to surface near edge of titanium alloy Ti6Al4V: (a) peening direction and definition of residual stress; (b) residual stress changing with distance from edge before and after peening.
Applsci 13 06702 g014
Figure 15. Images of laser cavitation focused in the water by pulsed laser near the wall [58].
Applsci 13 06702 g015
Figure 16. Distribution of residual stress of stainless steel introduced by laser cavitation peening [6,59].
Applsci 13 06702 g016
Figure 17. Fluid/material-coupled numerical simulation of collapse of a bubble: (a) pancake-shaped bubble on the wall (γ = −0.3), (b) hemispherical bubble on the wall (hemispherical mode; γ = 0), and (c) spherical bubble near the wall (microjet mode; γ = 1.2) [35].
Applsci 13 06702 g017
Figure 18. Variations in maximum equivalent stress and stress influence area with the stand-off distance between the bubble and the wall: (a) maximum equivalent stress, (b) volume of stress influence area, and (c) depth of stress influence area [35].
Applsci 13 06702 g018
Figure 19. Effect of feeding water on peening intensity measured using arc height of aluminum plate.
Applsci 13 06702 g019
Figure 20. Surface residual stresses before and after area isotropic and anisotropic irradiation [15].
Applsci 13 06702 g020
Figure 21. Effect of peening pattern on improvement of fatigue life at τa = 460 MPa for additively manufactured titanium alloy Ti6Al4V via direct metal laser sintering.
Applsci 13 06702 g021
Figure 22. Improvement of fatigue life of titanium alloy Ti6Al4V additively manufactured via direct metal laser sintering using laser cavitation peening (CP by laser) compared with shot peening and cavitation peening using a jet. Reprinted from [60] with permission from Elsevier, License Number 5532491421394.
Applsci 13 06702 g022
Figure 23. Images of surface of additive-manufactured titanium alloy Ti6Al4V via direct metal laser sintering: (a) as-built; (b) laser cavitation peening [10].
Applsci 13 06702 g023
Figure 24. Improvement in fatigue strength of metallic materials via laser cavitation peening compared with shot peening.
Applsci 13 06702 g024
Figure 25. EBSD analysis of cross-section after (a) CP via jet, (b) SP, and (c) CP via laser (laser cavitation peening) surface treatments showing inverse pole figure maps (top) relative to the normal of the cross-section and grain reference orientation deviation (GROD) maps (bottom). Reprinted from [63] with permission from Elsevier, License Number 5532500298391.
Applsci 13 06702 g025
Figure 26. Laser cavitation generated by Nd:YAG laser without Q-switch: (a) images of laser ablation and laser cavitation; (b) pressure detected by hydrophone [73].
Applsci 13 06702 g026
Disclaimer/Publisher’s Note: The statements, opinions and data contained in all publications are solely those of the individual author(s) and contributor(s) and not of MDPI and/or the editor(s). MDPI and/or the editor(s) disclaim responsibility for any injury to people or property resulting from any ideas, methods, instructions or products referred to in the content.