Article

Applied Research of the UAV Illumination Measurement System in Sports Stadiums

1
Research Institute of Photonics, Dalian Polytechnic University, Dalian 116039, China
2
CQC Standard (Shanghai) Testing Technology Co., Ltd., Shanghai 201114, China
*
Authors to whom correspondence should be addressed.
Appl. Sci. 2023, 13(11), 6774; https://doi.org/10.3390/app13116774
Submission received: 6 May 2023 / Revised: 22 May 2023 / Accepted: 23 May 2023 / Published: 2 June 2023

Abstract

:
In this paper, an illumination measurement system is proposed and experimentally demonstrated. The system consists of two parts, including the illumination acquisition module mounted on the UAV and the real-time display interface of the cloud platform with control functions. The illuminance acquisition module consists of a light sensor, a distance sensor, a wireless communication module, and a power-supply component. For the other part, the OneNET cloud platform developed by China Mobile is chosen as the display interface for the system’s real-time data. In addition, the local-outlier factor (LOF) algorithm is used for outlier rejection to further improve the stability and accuracy of the system. The illuminance acquisition system designed and implemented was then applied to the illuminance measurement experiments in the stadium. In experiments, the illuminance data acquired by the system was used to investigate the illuminance distribution at different height levels in the stadium. It was learned that the root mean square error (RMSE) of the data acquired is calculated to be 2.45 compared to the illuminance standard values through experimentation, with an error range of −2.77% to −0.53% for dynamic measurements.

1. Introduction

With the development of the economy and society, the number of sports grounds has risen rapidly and sports venues that can host major events are being built continuously. When an international event will be hosted, illumination requirements usually cover not only sports areas but also audience areas. According to the General Lighting Standards for the Olympic Games, the average vertical illumination of the cameras should be no less than 25% of the playing area, and the illumination should be reduced evenly to less than 10% compared with the illumination of the playing areas in the audience area from row 12 onwards [1]. In general, comprehensive stadiums are divided into six levels according to the Sports Stadium Lighting Design and Inspection Standards (JGJ153-2016) [2], and venue lighting levels are generally above level IV because they have to adapt to a variety of competition events [3]. In class IV stadiums, the ratio of horizontal minimum to maximum illuminance should be 0.3 and the ratio of horizontal minimum to average illuminance should be 0.7. Meanwhile, when broadcasting is required, the vertical illumination of the primary and secondary cameras should also be taken into account. The vertical illuminance in the direction of the main camera should be 1000 lx, while the vertical illuminance in the direction of the secondary camera should be 750 lx [4]. With this requirement, the measuring range may be very large. In addition, it can be difficult to measure vertical illuminance. In addition, when the illumination is measured in swimming competition venues, the measurement process may be inconvenient because of venue restrictions.
Faced with measurement on a large scale and complex scenarios, traditional measurement methods often take a lot of time and face big challenges. It is an excellent solution to the problems of taking advantage of the convenience of flying with UAVs, with the maturity of UAV technology and the continuous development of UAV application research. Initially, UAVs were invented for military use. In recent years, the acquisition of low-cost sensors and platforms has laid the foundation for the civilian use of UAVs, with the increasing maturity of metal electromechanical systems and microsensor technologies [5]. And a growing number of related aspects of research and commercial applications are emerging due to the convenience of UAVs [6,7]. Many studies and discussions on UAVs continue to uncover more potential for drone application technology [8,9]. Colomina and Molina et al. [10] applied UAVs to photogrammetry and remote sensing by extracting information from images and generating 3D data; Wefelscheid et al. [11] used UAVs to help with 3D modeling, reconstructing the 3D shape of a building or area. Boccardo et al. [12] conducted a study on how UAVs can be used in disaster detection to map the situation and provide up-to-date information after a catastrophic event or before an anticipated event. There are also some people who have done much research to study how to measure illumination in a quicker and more convenient way using UAVs. Takaya Maemura, et al. [13] use a PHANTOM UAV with an illumination sensor to obtain data. In the paper, the authors measured the horizontal and vertical illumination in the gymnasium. The feasibility of the gymnasium illumination measured by UAV is demonstrated. In addition, they also discussed the illumination of the gymnasium in three dimensions, and the flow of light inside the gymnasium space. In fact, UAVs are already being used in many areas of measurement. Sensor-mounted UAVs also have been used in a variety of measurement applications [14,15]. However, illuminance, an important light environment parameter, has been relatively little studied in applications using UAV measurements, and most of the applications in UAVs are based on the functionality of the drones themselves, which is less integrated with increasingly sophisticated automation and IoT technologies. Thus, the mounting system for UAVs can be made more intelligent and convenient with the widespread development of IoT and sensor technology.
In this paper, the sports venue illumination measurement system presented is based on the UAV with the function of optical flow. The illumination acquisition system consists of the STM32F103RCT6 micro control module, illumination acquisition module, distance measurement module, and wireless transmission module. The local-outlier factor (LOF) algorithm is chosen as the system outlier handling method confronted with anomaly values in the collected data [16,17]. In the experiment, we obtained the local-outlier factor (LOF) algorithm training data by modeling a standard sports stadium and determined the outlier-detection threshold. According to the experiments, the root mean square error (RMSE) of the illuminance data acquired by the system and the illuminance standard value is 2.45, and the error range for dynamic measurements is between −2.27% and −0.57%.

2. Materials and Methods

2.1. Illumination Acquisition System Architecture

The visualization function is defined as spectral luminous efficiency to represent the visual sensitivity of the human eye at different wavelengths, according to the human eye vision properties. Since stadium illuminance is mainly suitable for athletes and spectators, the process of measuring sports stadium illuminance needs to make the response of the detection equipment consistent with that of the human eye. And the illuminance sensor, which is the main information input for the dynamic measurement system, needs to have the characteristics of fast measurement speed and high measurement accuracy. The photodiode illumination sensor is chosen as the system’s illumination acquisition component, which is made with ROHM Semiconductor’s BH1750FVI chip. It is commonly used in electronic devices and projects that require light detection and measurement. Key features of the BH1750FVI include its compact size, low power consumption, and digital output. It uses a built-in 16-bit analog-to-digital converter (ADC) to provide accurate light intensity readings. The sensor is capable of measuring a wide range of light levels, from very low to high intensities. As a real-time acquisition system mounted on a UAV, the system should have low power consumption and be small in size, and it also needs to have high real-time performance. The STM32 chip made in STMicroelectronics is used as the central processing unit of the operating system proposed in this paper. The STM32 model chosen for this paper is the STM32F103RCT6 in order to facilitate the mounting, which is characterized by small size, low power consumption, and fast processing speed. Furthermore, it can be powered by the FreeRTOS operating system, which has higher real-time performance as a result of the multithreaded operation through time-slice rotation. The system also has the function of transmitting illumination data to the cloud platform wirelessly, which is based on the WiFi communication module, named ESP826 made in Espressif Systems [18]. The total data-transfer rate of the ESP8266 model is designed for 2 Mbps, and the model number is ESP8266-01S.
WiFi wireless transmission technology is easy to network, and no wiring is required for data transmission [14]. Meanwhile, the data-transmission distance can reach about 100 m. To cope with illuminance measurements at different height levels, the laser distance sensor is selected. In this paper, the distance sensor of the type is ToF Sense-UART, which can be easily communicated with different modules. OneNET IoT platform is selected as a data-receiving platform in wireless transmission that supports adaptation to various network environments and protocol types. The IoT platform has rich functions, including fast access to various sensors and smart hardware, rich APIs, application templates to support the development of various industry applications, and so on.
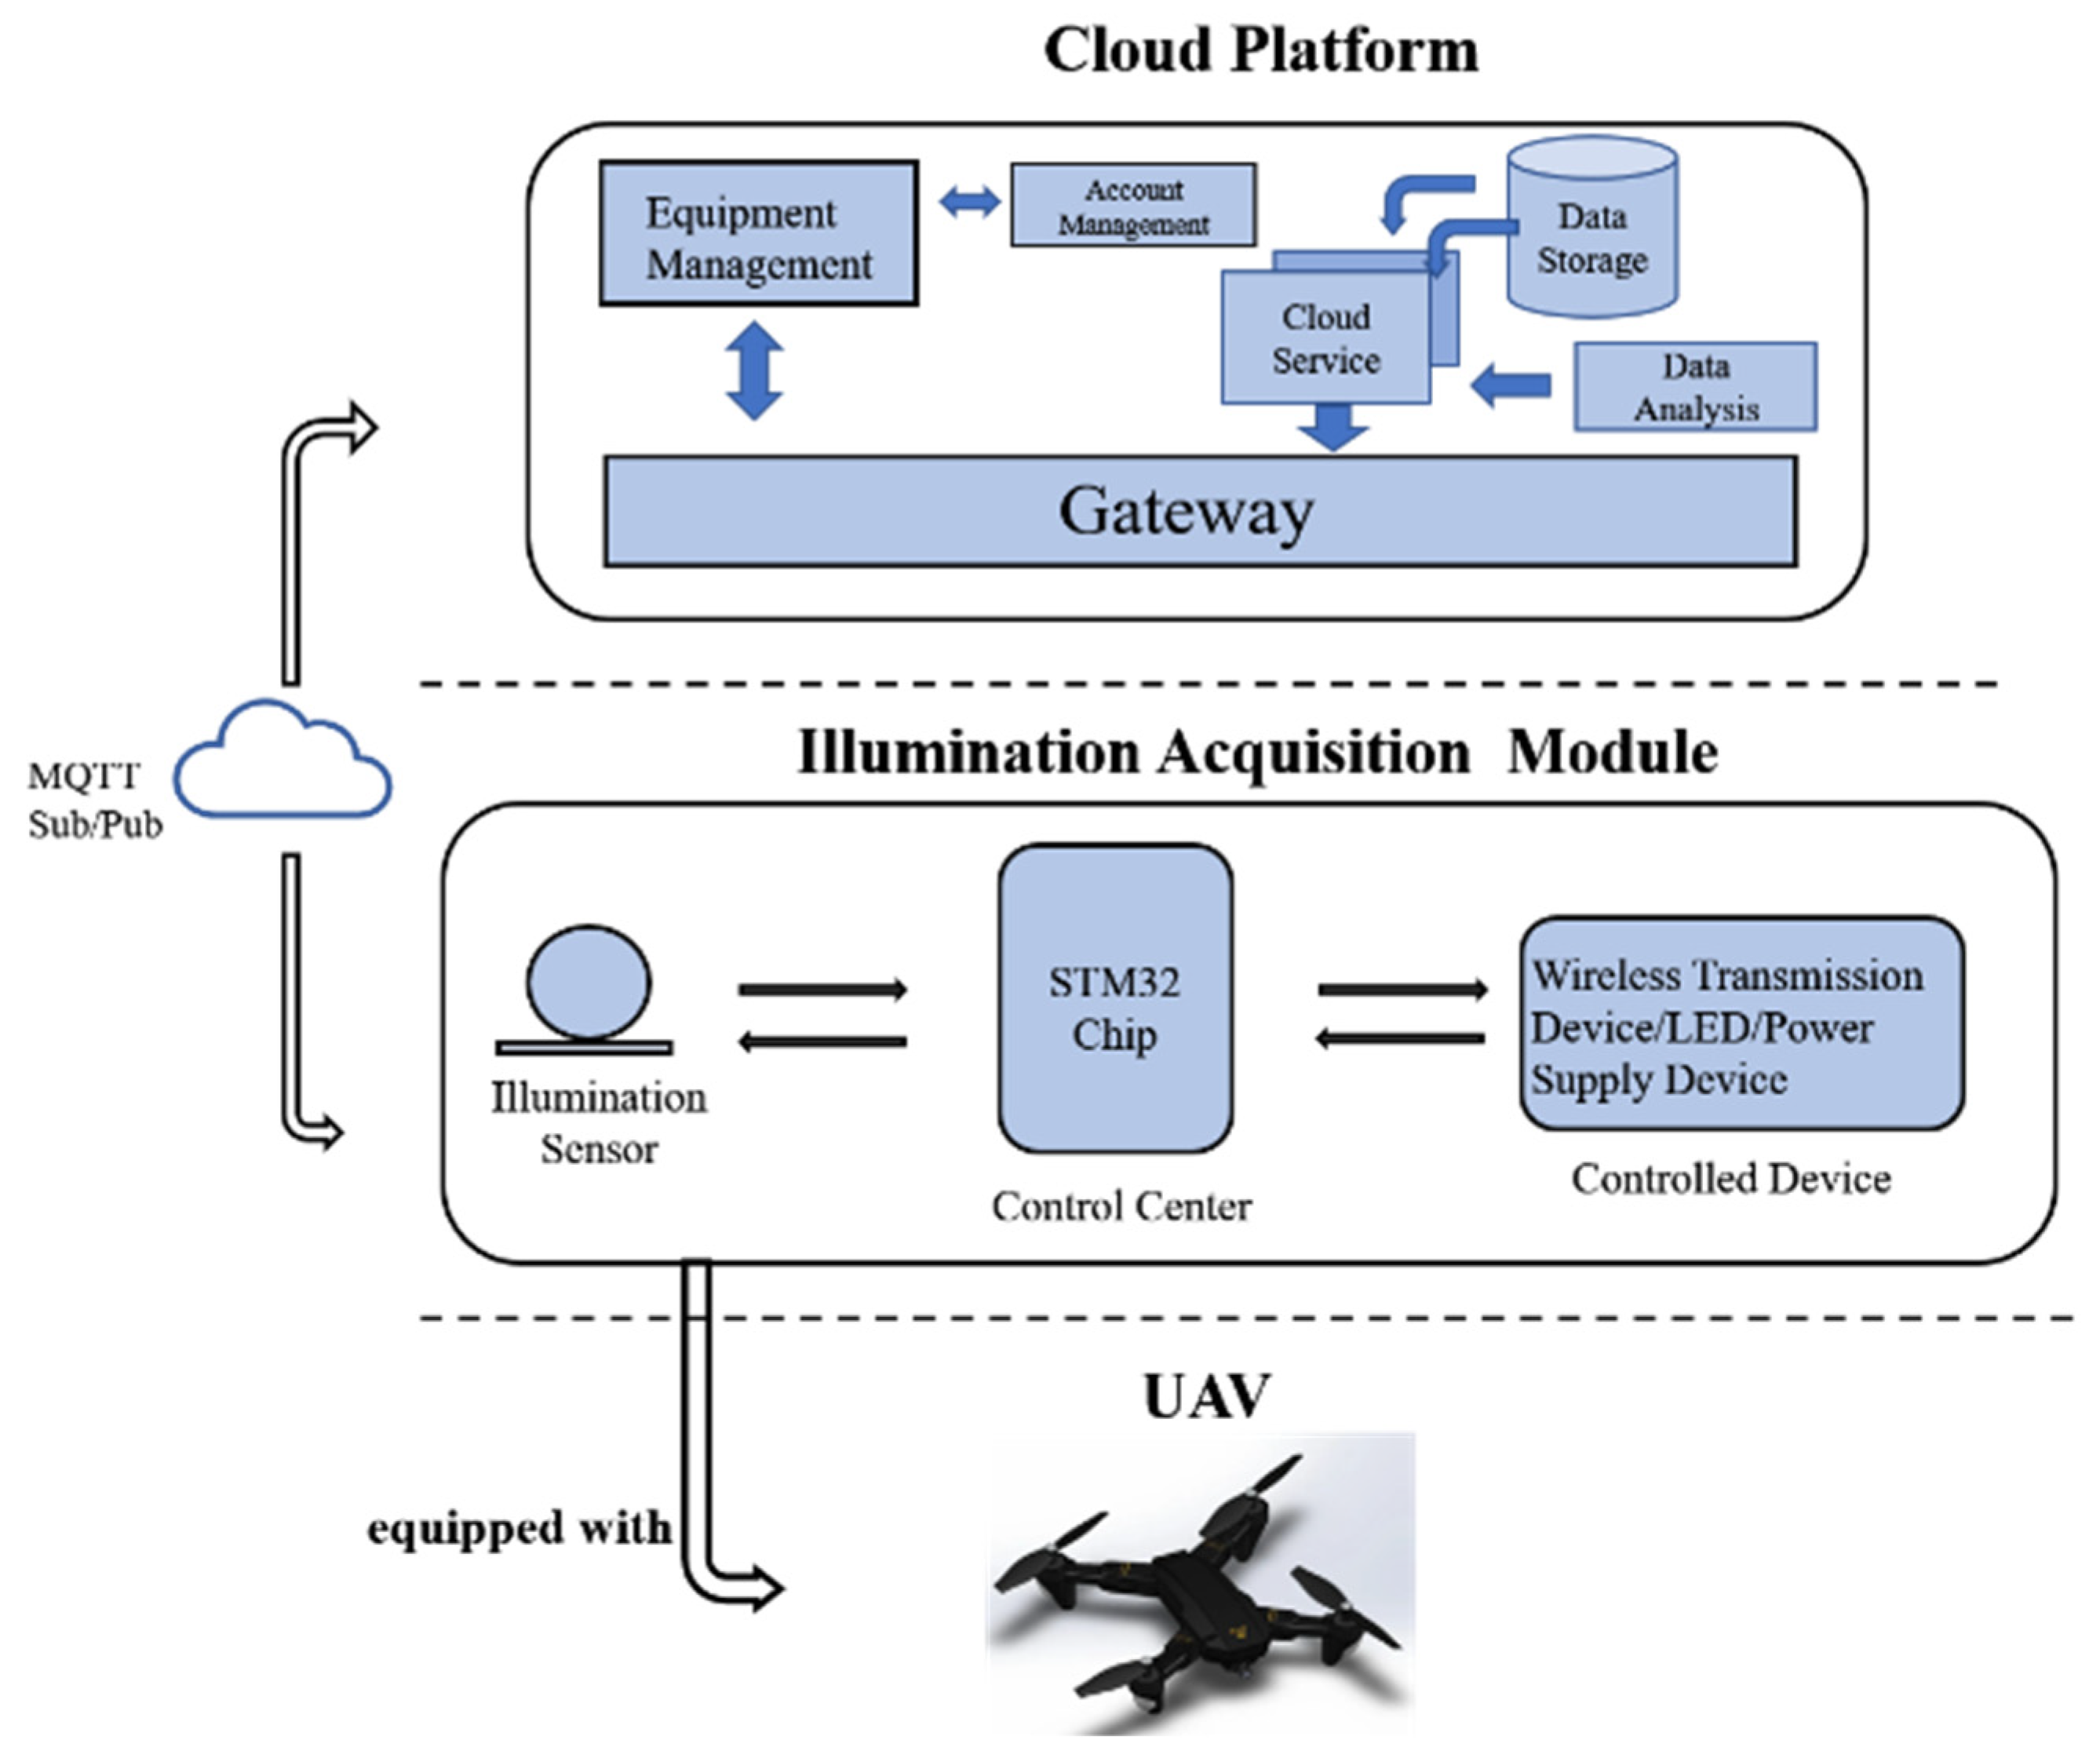
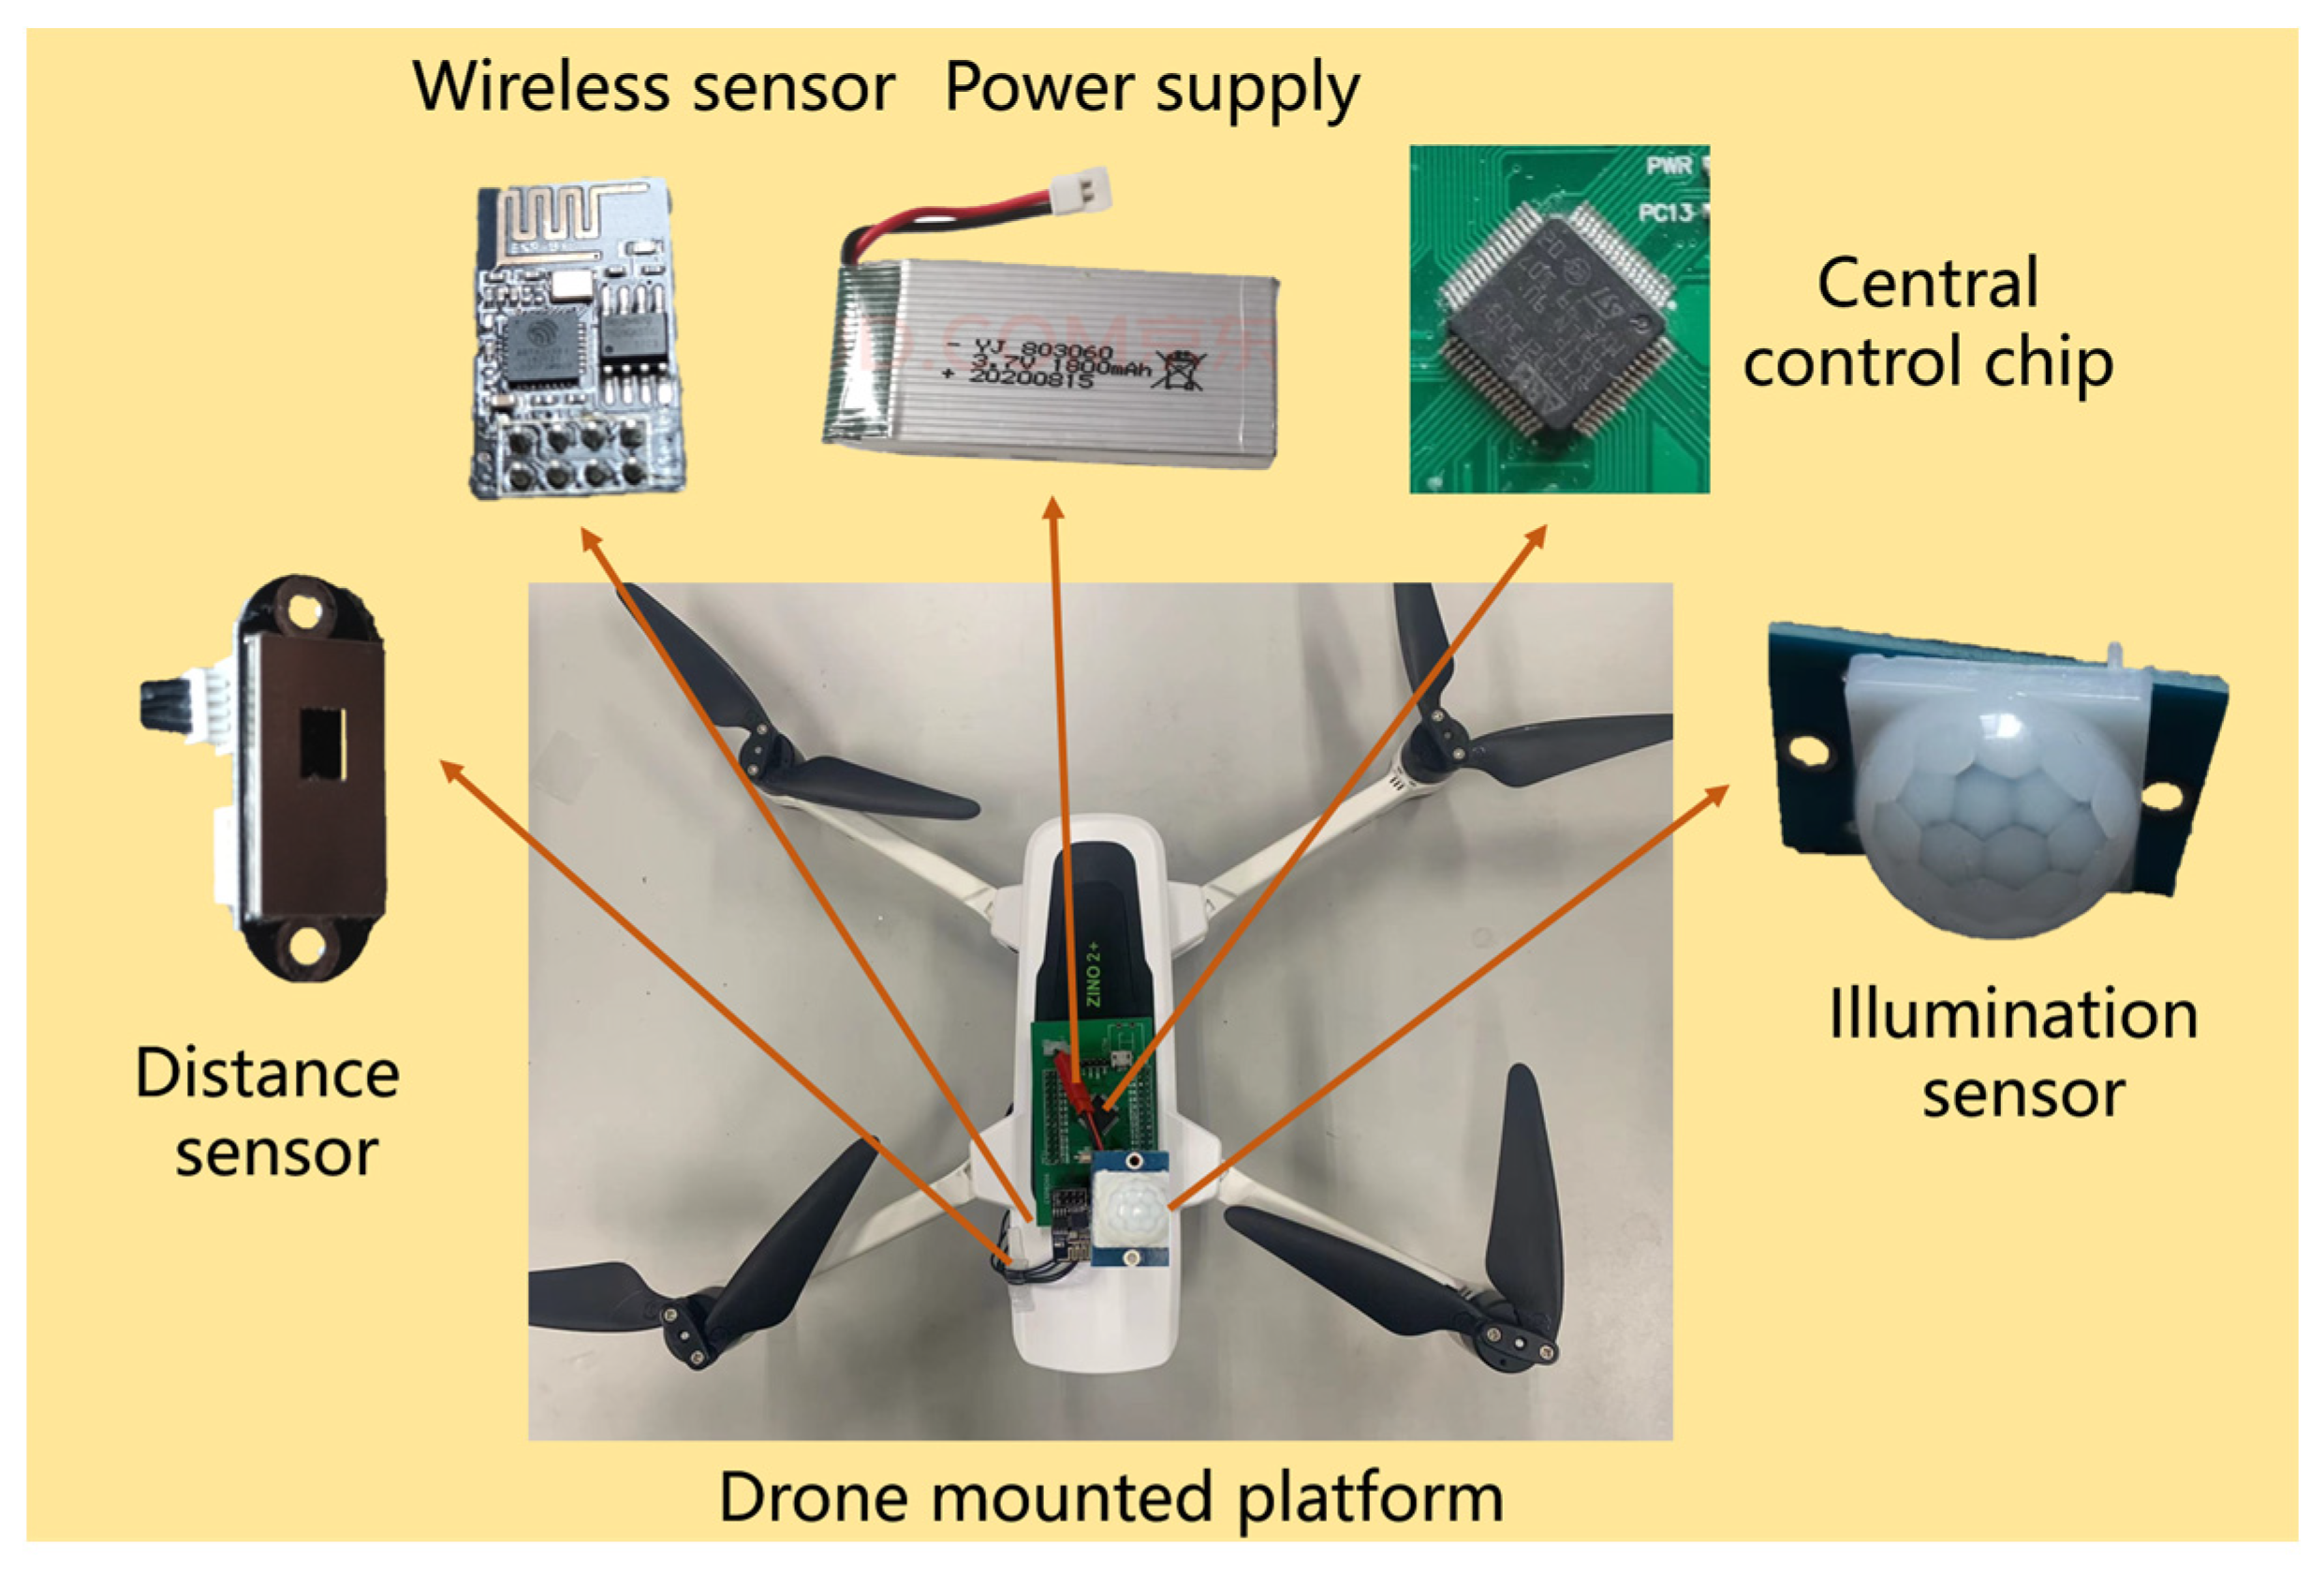
As for the UAV-carrying platform, the HUBSON ZINO2+ UAV was chosen as the platform of illumination acquisition. It is a professional-grade UAV that can hover accurately and stably indoors or outdoors, and it can load with a weight of 500 g. The UAV supports a variety of flight modes, such as variable speed and constant speed flight. In addition, the mobile app provides real-time feedback, recording the single flight time and hovering position. The HUBSAN ZINO2+ UAV used in this experiment has an optical flow positioning function, which is mainly used to determine the position information of the indoor environment. When the UAV is indoors, the optical-flow navigation system, which is a positioning method that has been used in UAV positioning and control systems in recent years, can determine the current position information based on the information acquired by a specific camera that is on the tail of the UAV. The structure of the illuminance acquisition module is as Figure 1.
As shown in Figure 1, the system is structured in three main layers, including UAV, illumination acquisition module, and cloud platform. The UAV is used as a working platform for the entire illuminance acquisition system and plays an important role in illuminance acquisition as well as in the positioning of measurement points. The illumination acquisition module is used as the data input and control command-execution part of the system, consisting of an illumination sensor (BH1750FVI), a WiFi transmission section (ESP8266), a laser distance measurement module (ToF Sense), and a Li-ion battery power supply. The illuminance acquisition module can get illuminance data every 180 ms. The individual parts of the module transmit data to each other via the different communication protocols, where data transfer between the illuminance sensor and the STM32F103RCT6 is based on the I2C communication protocol, and command delivery and data transfer between ESP8266 and STM32F103RCT6 via UART serial communication protocol, and STM32RCT6F103 also can control the laser distance-measurement module to complete the height-measurement judgment. When the UAV illumination acquisition system is used to acquire illumination in the sports venue, the distribution of illumination varies at different heights, as proved by the inverse squared ratio. Therefore, a distance measurement module is required to be carried in the system. The ToF Sense can perform distance measurement with a refresh frequency of 30 HZ, and the measuring distance is from 0.03–8 M with an accuracy of ±0.03 M. In addition, the ToF Sense’s small size and low power consumption make it very suitable for use as a sensor on the UAV. The communication between the various parts of the system is shown in Figure 2.

2.2. System Software Design

The system proposed in this paper uses the Keil uVision5 integrated development environment, including designing the program to complete the illumination acquisition and setting the ESP8266 module to operate in the appropriate mode to connect to the cloud platform and transfer the data. For the programming in this paper, the FreeRTOS real-time operating system is chosen as the basis for the programming. The FreeRTOS real-time operating system is free and highly real time, with a compact kernel and open-source source code. The FreeRTOS operating system is based on a task, which is a program entity that completes a segment for a specific purpose, to complete the overall system program design. And the design of the overall system is completed by switching between the priority of each task and the control of the four task states. The state transitions between the various task states of the FreeRTOS real-time operating system are shown in Figure 3.
As shown in Figure 3, tasks in the FreeRTOS operating system are divided into four states, called ready, block, running, and suspend. Whenever a task is created successfully, it is automatically put in the ready state, and if the current task has a higher priority than the running task, it enters the running state, but if the priority of the current task is not higher than the priority of the running task, the current task will enter the ready state. When a task in the running state calls the function associated with vTaskDelay(), the task switches to the blocking state. A task in a blocking state will not be able to execute and be called again, and it will end up in the blocking state when the blocking condition is met or when the event time change in the diagram occurs. And in the FreeRTOS operating system, the task of all the tasks in the ready state, which is with the highest priority, goes into the running state. In addition, when the vTaskSuspend() function is called, the task will be converted to a pending state and the pending task will not be scheduled indefinitely, If the task is rescheduled, it can only be unmounted with the vTaskResume() function.
For the system presented in the paper, when the system is first powered up, it will first detect if it has received a signal to start illumination measurement, and when a signal to start illumination measurement is detected, it will turn on illumination measurement. Before starting the illuminance measurement, the height of the illuminance measurement needs to be specified via the cloud platform. When the UAV takes off, the illuminance acquisition system will compare the specified measurement height received with the current height, and the system will start collecting illuminance if the UAV illuminance acquisition system is within ±0.1 m of the specified measurement height. The collected illuminance data is then transmitted to the OneNET cloud platform, which can plot the illuminance collection variation curve in real time based on the data received. Once the illuminance has been collected, the local-outlier factor algorithm is used to first reject the outliers and then calculate the average of the illuminance data collected at the same point to determine the illuminance value at the point. The program-flow diagram of the illumination acquisition system proposed in this paper is shown in Figure 4.

2.3. System Outlier Handling Algorithm

There are some outliers in the acquired data due to the instability of the drone hovering and flying in the process of illuminance acquisition by the system and changes in the external environment can also greatly interfere with the measurement of the UAV. Data acquired by a UAV-based illumination acquisition system have the characteristics of a random distribution, which is not a linear distribution, and not a Gaussian distribution. The detection of outliers in such data has important implications for the stability and accuracy of the system. These outliers can lead to large inaccuracies in measurement results, so it is necessary to find and eliminate outliers in measurements. Outliers are defined as data that are distinctive in the dataset so that they make one suspect that these data are not random deviations but are generated by a different mechanism according to Euclidean distance. The specific definition of outliers is as follows based on the description of Euclidean distance. The acquisition set to R = {r(x1), r(x2), …, r(xn)} and S = {f(x1), f(x2), …, f(xn)} is generated by two mechanisms, which are defined as r(x) and f(x) respectively, according to the data acquisition defined as D = {x1, x2, …, xn}. And then owned by is defined as outliers in the case of that M(xi) ≫ M(xj) (i ≠ j) under the condition that f(xi) is not equal to r(xi), with the defined as an outlier feature.
As shown in Figure 5, big data objects follow a certain distribution law, but the data x is clearly deviated, so it can be considered that it is produced by a different mechanism and judged as an outlier. In general, outliers can be divided into global outliers, local outliers, situational (or conditional) outliers, and collective outliers. In the design of the illumination measurement system, the LOF algorithm is selected as the detection method of outliers in this paper. The local-outlier factor is mainly used to determine whether the sample is anomalous by calculating the outlier factor and comparing whether it is far from dense data. The local-outlier factor is a density-based local-outlier detection algorithm, and the specific implementation is shown below. The d(o, p) is defined as the distance from point p to point o; dk(o) is defined as the k-distance, which is to radiate outward with p as the center of the circle until the k neighboring point is covered; and Nk(o) is the k-distance neighborhood of data point p defined by the set of all points within the k-distance of point p. The reach_distk(o, p) is defined as shown in Equation (1).
r e a c h _ d i s t k ( o , p ) = max { d k ( o ) , d ( o , p ) }
The distance definition diagram is shown in Figure 6.
The local reachable density is defined in Equation (2) based on the above-defined representation.
l r d k ( p ) = 1 / ( o N k ( p ) r e a c h _ d i s t k ( o , p ) | N k ( p ) | )
The lrdk(p) characterizes the density of the point p, and it is known the higher the density of point p and the surrounding points, the reachable distance of each point may be the smaller respective k-distance, corresponding to a larger lrd value; the lower the density of point p and the surrounding points, the reachable distance of each point may be the larger actual distance between two points, corresponding to a larger lrd value. In addition, the local-outlier factor can also be defined as Equation (3) by using the lrd value.
L O F k ( p ) = o N k ( p ) l r d k ( o ) l r d k ( p ) | N k ( p ) | = o N k ( p ) l r d k ( o ) | N k ( p ) | / l r d k ( p )
From Equation (3), we can see that the local-outlier factor of point p is the ratio of the average locally reachable density of all points in the Nk(p) neighborhood of point p to the locally reachable density of point p. When this ratio is greater than 1, the density of point p is less than the density of its surrounding points, and point p may be an outlier; when this ratio is less than 1, the density of point p is greater than the density of its surrounding points, and point p may be a normal point. The density value can be infinity if the number of duplicates is greater than the number of k neighbors; therefore, the weighted local-outlier factor (WLOF) is defined if the data contains duplicates. The details are as follows.
w l r d k ( p ) = 1 / o N k ( p ) w ( o ) r e a c h _ d i s t k ( p , o ) o N k ( p ) w ( o )
As shown in Equation (4), the w(o) is the number of duplicates in the data. After computing the weight values, the algorithm treats each set of duplicates as one data value. The calculation of the weighted local outlier is shown in Equation (5)
W L O F k ( p ) = o N k ( p ) w l r d k ( o ) w l r d k ( p ) o N k ( p ) w ( o )
In the use of the LOF algorithm, it is necessary to first determine the threshold of the LOF algorithm. In the paper, we used DIALux evo version 11.1 to model the venue and make it comply with the Venue Illumination Standards specified by the Standard for lighting design and test of sports venues (JGJ 153-2016). In the venue model scenario, a uniform light distribution is set, with an illuminance uniformity of 0.62, and it also can meet the standard for lighting design and the requirements for the illuminance of a venue with televised coverage [19]. When the UAV is acquiring data, the UAV will sway within a small area of the measurement point, according to the performance of the drone in actual measurements, so this paper chose a 20 cm × 20 cm rectangular calculation surface to simulate the dynamic range of the UAV, and the illuminance uniformity of 25 points in each rectangle (the ratio of minimum illuminance to average illuminance) is about 0.99 through DIALux simulation. We have also taken full account of the representativeness of the calculation surface about the selection of the small calculation surface; therefore, the planes were set at different illumination intervals with reference to the equivalence curve of the illumination distribution. In terms of height, we selected a calculation surface every 5 cm height for a total of 5 calculation surfaces and determined the illuminance calculation surface at a height of 1 m, 2 m, 3 m, and 4 m separately, to meet the requirements of measuring different height illumination values in different competition venues.
The selection of calculation surfaces within the model and the results of the local-outlier factor detection are shown in Figure 7 and Figure 8, respectively.
As shown in Figure 7, The horizontal axis represents the local-outlier factor value calculated from the illuminance data points in different data acquisition planes. As we can see, most of the local-outlier factor values are concentrated within 0.5, indicating that the data density is relatively high, and it also shows that there is very little variation in illuminance in the plane of calculation. In illuminance measurement, points within a small plane are specified as measurement-point illuminance values, and the measurement points are faced with the situation of calculating the uniformity of illumination. Furthermore, the vertical axis represents the number of points that obtained different local-outlier-factor values. We removed 10 percent of the data as the threshold to determine the data to remove the effect of excessive differences in illuminance values between different calculation planes. In Figure 7, the blue vertical line is the result of the threshold calculated for the different height planes of data, where the results are 0.63, 0.69, 0.51, and 0.65, respectively. As shown in the picture, the points to the right of the blue vertical line are the discarded data in the dataset. Due to the large differences in illuminance values between different high calculation planes, they cannot be used as criteria for the determination of outliers, so the LOF algorithm determines the threshold value so that it detects the 5 percent of training observations as anomalies.
With the use of the algorithm, the nearest point of the selected point is calculated according to the maximum-variance method. The smaller value is selected in the first divided area, and then the algorithm can again look for the smaller value in the second divided region until the smallest value is found in the calculation process. The flow chart of the LOF algorithm is shown in Figure 8.

3. Results

3.1. System Implementation and Testing

We have built the illumination acquisition system based on the chosen hardware and the method mentioned above. In the process of building the system, it is necessary to consider the location of the system so that there is no obstruction during the illumination measurement. Therefore, the illumination acquiring system is mounted on the top of the UAV, and it is powered by a 3.7 V, 1800 mAh battery because the illumination acquisition system requires enough power to function properly and to transmit data over long distances. Size and weight should also be taken into account to make the illumination acquisition system be carried on a UAV platform. In the system, the width of the physical hardware is 11 cm, and the length is 17 cm. The physical hardware design is shown in Figure 9.
In order to determine the stability of the illuminance acquisition system during dynamic measurements, in this paper we use the illuminance acquisition system and the SPIC-200 (manufactured by Hangzhou Yuanfang Optoelectronics Co., Ltd., Hangzhou, China) illuminance meter to obtain illuminance separately. The illumination measurement is taken at night in the closed laboratory, the influence of the external light environment on illuminance measurement experiments can be reduced to a minimum. During the experimental process, illuminance values were measured twice for each point using the SPIC-200 illuminance meter and illuminance acquisition module. The illuminance data is shown in Figure 10.
As is shown in Figure 10, the measurement points were set at 0.5 M intervals starting at the laboratory wall. The blue curve shows the illuminance value measured by the illuminance acquisition module, and the red curve shows the illuminance value measured by the SPIC-200 illuminance meter. There is little difference in the illumination value and the root mean square error is 2.45 according to Equation (6).
R M S E = 1 n i = 1 n ( x m a n u a l x S P I C ) 2
We also verified the dynamic response of the illuminance acquisition system in the range of 1.5–2 m from the light source by keeping the position of the light source fixed during the experiment. A SPIC-200 illuminance meter was used to measure the illuminance value at 1.5 m, and the maximum value was selected to save among the read values. In the next step, we used the illuminance acquired system to measure the illuminance several times at a distance of 1.5–2 m by way of sliding and recorded the maximum value of each measurement respectively. The error is determined due to dynamic measurements by calculating the interpolation of the two. The details are in Table 1.
According to the data in the table, the error range for dynamic measurements is between −2.27% and −0.57%. which is within the standard range. Thus, the illuminance acquisition system can meet dynamic illuminance measurement requirements.

3.2. Illumination Acquisition Experiment

The UAV illumination acquisition experiment in this paper was chosen to be carried out in the sports stadium located at Dalian Polytechnic University. The school sports stadium is a versatile facility measuring 40 m in length, 20 m in width, and 10 m in height. It houses designated areas for badminton, basketball, and volleyball. The stadium is well-lit with evenly distributed overhead lighting, ensuring optimal visibility for athletes. And the illuminance measurement experiment was chosen to be carried out at night to avoid the influence of sunlight. The experimental scenario was built as shown in Figure 11.
As the stadium floor is yellow, green illuminance collection points were chosen to be arranged on the ground in order to facilitate the accurate identification of measurement points during the UAV illuminance collection process. According to the stadium illuminance standard, the point was set up at 2 m intervals, and illuminance measurement was carried out according to the center-point method. In addition, during the experiment, the illuminance measurement area stadium lamps were arranged as shown in Figure 12.
In the illumination acquisition experiment, the UAV flew at a constant speed of 1 m/s.
The position of the UAV was determined based on the fact that the UAV could record and return the current flight altitude in real time, and the distance traveled in a single flight. It can be determined whether the drone is above the measurement point or not based on the live feed from the vertical head of the drone. The drone’s live image feed is shown in Figure 13.
Although the illuminance measurement experiments are carried out indoors, the drone recorded the flight data during the experiment, including flight height, flight distance, and flight speed. The UAV flight log is shown in Figure 14.
As shown in Figure 14, the graph shows the recorded data of the UAV’s flight separately. It can be known that the flight altitude is 4.0 M and 4.1 M, and the flight distance is 2.0 M and 2.1 M, respectively, in a single flight, which coincides with the position of the measuring point. The flight altitude recorded by the UAV can help determine whether the drone has risen to the specified measurement altitude, and the flight distance recorded by the UAV can help determine if the drone is flying above the measurement point. In conclusion, it is possible to locate more accurately whether the current drone is in the position of the measurement point by using the flight data recorded by the UAV in real time and the image information returned from the cloud platform.

3.3. Illumination Data Processing

In the process of drone illumination acquisition, the drone hovers over the illumination collection point for 3 min and transmits the collected illumination to the OneNET cloud platform in 3-s intervals. The cloud platform data is shown in Figure 15.
The platform is showing an illuminance value of 542 lx at the moment. Furthermore, two switches are displayed in the cloud platform, one indicating whether the system is currently in a data collection state and the other controlling whether illumination collection is on or off. Based on the data collected, the acquired illuminance data can be plotted as a real-time variation curve. In the line graph, the horizontal axis is the time of illuminance acquisition, and the vertical axis is the current illuminance value. The curve acquires the current measured illuminance value at a refresh rate of every 3 s. In addition, the current illuminance collection height can be set into the illuminance collection system via the cloud platform. Illuminance at 4 M height in the stadium was acquired by this method. The UAV is flown to the designated measurement point and hovered for 3 min to get the illuminance data of the point, in order to calculate the illuminance data of the measurement point more accurately. The illuminance data for one measurement point is shown in Table 2.
As shown in Table 2, The measurement system got the illuminance data at 3-s intervals and transmitted the collected data to the cloud platform. The illumination acquisition system takes 120 s to get data at the measurement point, for a total of 60 data. Then, the outliers in the illuminance data at the collection points can be rejected, using the thresholds determined by the LOF algorithm. The rejection of outliers at measurement points is shown in Figure 16.
The horizontal axis represents the time of acquisition, and the vertical axis is the illuminance value. It can be drawn that outliers marked in red are selected obviously; at the same time, the others are judged to be normal values and are marked in blue by analyzing the images. In addition, it can be seen that the distribution of normal values is concentrated with an error of around 50 lx. By calculation, the average value of 550.69 lx with the outliers removed is the illuminance value for that point.
Based on the data obtained from the illuminance measurement-collection experiment, the horizontal distribution of illuminance at a height of 4 m above ground level was explored, as shown in Figure 17.
As shown in Figure 17, the distribution of illumination in the stadium becomes more complex as the height increases. On the horizontal plane, the distance from the starting point of the measurement in the eastern and western directions is used as the X and Y axes, respectively; the illuminance value is used as the Z axis, and the illuminance collection data is interpolated using cubic spline interpolation to make it easier to explore the trend of illuminance changes. Illuminance distribution at 4 m height in the stadium is plotted, and the image shows that the illuminance value rises significantly directly below the luminaire and falls significantly between the luminaires as the height increases.

4. Discussion

In this paper, we have built a stadium illuminance measurement system, which takes advantage of the convenience of the UAV, combined with a widely used optical-flow positioning function, an illumination sensor, a distance measurement module, a Wi-Fi data transmission, and a cloud platform. Based on the real-time feedback data from the mobile-phone app, the UAV position information is corrected, and the location of the illumination acquisition point can be located in combination with the real-time image return from the drone. Faced with the problem of inaccurate measurements caused by the unstable hovering of UAVs during the measurement process, we used the LOF algorithm to detect outliers in the acquired data. In this way, the stability of the illuminance measurement system can be checked, and, at the same time, the acquired data can also be detected in time for large fluctuations. Then, the data collected by the system can be displayed in real-time via the cloud platform, and the system acquisition process can also be controlled via the cloud platform. On the one hand, it is possible to judge the data collection of the UAV illumination collection acquisition system in time. On the other hand, it is convenient to control the system until the system is accurately located.
In the next step of research, the measurement system will be further improved to measure vertical illuminance under the different environmental requirements of the sports stadium and to explore the detailed light-flow distribution and three-dimensional representation of illuminance in sports stadiums.

5. Conclusions

Illuminance measurement in stadiums usually has to deal with large measuring fields, high measuring heights, and complex measuring fields. The UAV illumination measurement system proposed in this paper provides an effective solution to this problem, and it has been experimentally verified to have good stability and accuracy, with the root mean square error of the illuminance data acquired by the illuminance system and the illuminance standard value is 2.45, and the error range for dynamic measurements is between −2.27% and −0.57%. In addition, this paper also explored the distribution of illuminance at different heights in the stadium, and the distribution of illuminance at high levels is mapped to provide a better understanding of the light conditions in the stadium.

Author Contributions

Conceptualization, N.Z.; methodology, S.J.; software, S.J.; formal analysis, S.J. and S.X.; investigation, M.C.; data curation, S.J.; writing—original draft preparation, N.Z.; writing—review and editing, N.Z. and S.J. All authors have read and agreed to the published version of the manuscript.

Funding

This work was supported by the following: the 2019 Industry Standardization Project of the Ministry of Culture and Tourism (Grant No. WH2019-19), a cooperative research project between Dalian Polytechnic University and CQC Standard (Shanghai) Testing Technology Co., Ltd. This work was also supported by Guizhou Bijie Science and Technology Bureau Project of 432 validationmajor special projects of Bikehe (Grant number: 202202).

Institutional Review Board Statement

Not applicable.

Informed Consent Statement

Informed consent was obtained from all subjects involved in the study. Written informed consent has been obtained from the patient(s) to publish this paper.

Data Availability Statement

No new data were created or analyzed in this study. Data sharing is not applicable to this article.

Acknowledgments

We thank Qipeng He for the contribution to this article.

Conflicts of Interest

The authors declare no conflict of interest.

References

  1. Li, N.; Yu, M. Study of lighting design standards for the Beijing-Zhangjiakou Winter Olympic Games stadiums. China Illum. Eng. J. 2017, 2, 70–74. [Google Scholar]
  2. JGJ 153-2016; Standard for Lighting Design and Test of Sports Venues. China Architecture and Building Press: Bejing, China, 2007.
  3. Pan, N.; Wang, K.; Zang, X. Understanding and operation of current stadium lighting testing standards and methods in China. Sport 2011, 9, 136–138. [Google Scholar]
  4. Lin, R.; Wang, F.; Gao, Y. Analysis of the current situation and outlook of stadium lighting. China Illum. Eng. J. 2012, 2, 1–16. [Google Scholar]
  5. Arnold, T.; de Biasio, M.; Fritz, A.; Leitner, R. (Eds.) UAV-based measurement of vegetation indices for environmental monitoring. In Proceedings of the Seventh International Conference on Sensing Technology, Wellington, New Zealand, 3–5 December 2013. [Google Scholar]
  6. Chiabrando, F.; Lingua, A.; Piras, M. Direct photogrammetry using UAV: Tests and first results. Int. Arch. Photogramm. Remote Sens. 2013, 1, 81–86. [Google Scholar] [CrossRef] [Green Version]
  7. Aicardi, I.; Chiabrando, F.; Grasso, N.; Lingua, A.M.; Noardo, F.; Spanò, A. UAV photogrammetry with oblique images: First analysis on data acquisition and processing. Int. Arch. Photogramm. Remote Sens. Spat. Inf. Sci. 2016, 41, 835–842. [Google Scholar] [CrossRef] [Green Version]
  8. Hamurcu, M.; Eren, T. Selection of unmanned aerial vehicles by using multicriteria decision-making for defence. J. Math. 2020, 2020, 4308756. [Google Scholar] [CrossRef]
  9. Shahi, T.B.; Xu, C.-Y.; Neupane, A.; Guo, W. Recent Advances in Crop Disease Detection Using UAV and Deep Learning Techniques. Remote Sens. 2023, 15, 2450. [Google Scholar] [CrossRef]
  10. Colomina, I.; Molina, P. Unmanned aerial systems for photogrammetry and remote sensing: A review. ISPRS J. Photogramm. Remote Sens. 2014, 2, 79–97. [Google Scholar] [CrossRef] [Green Version]
  11. Wefelscheid, C.; Hänsch, R.; Hellwich, O. Three-dimensional building reconstruction using images obtained by unmanned aerial vehicles. Int. Arch. Photogramm. Remote Sens. Spat. Inf. Sci. 2012, 38, 183–188. [Google Scholar] [CrossRef] [Green Version]
  12. Boccardo, P.; Chiabrando, F.; Dutto, F.; Giulio Tonolo, F.; Lingua, A. UAV deployment exercise for mapping purposes: Evaluation of emergency response applications. Sensors 2015, 15, 15717–15737. [Google Scholar] [CrossRef] [PubMed] [Green Version]
  13. Maemura, T.; Nakura, K.; Suzuki, H.; Nakura, K.; Akizuki, Y.; Iwata, M.; Matsumoto, N. Preliminary study of illumination distribution measurement making use of quadcopter-examination of accuracy and drawing of illumination distribution. In Proceedings of the 11th Asian Forum on Graphic Science, Tokyo, Japan, 6–10 August 2017. [Google Scholar]
  14. Pajares, G. Overview and current status of remote sensing applications based on unmanned aerial vehicles (UAVs). Photogramm. Eng. Remote Sens. 2015, 81, 281–330. [Google Scholar] [CrossRef] [Green Version]
  15. Giordan, D.; Adams, M.S.; Aicardi, I.; Alicandro, M.; Allasia, P.; Baldo, M.; De Berardinis, O.; Dominici, D.; Godone, D.; Troilo, F.; et al. The use of unmanned aerial vehicles (UAVs) for engineering geology applications. Bull. Eng. Geol. Environ. 2020, 79, 3437–3481. [Google Scholar] [CrossRef] [Green Version]
  16. Boukela, L.; Zhang, G.; Yacoub, M.; Bouzefrane, S.; Ahmadi, S.B.B.; Jelodar, H. A modified LOF-based approach for outlier characterization in IoT. Ann. Telecommun. 2020, 76, 145–153. [Google Scholar] [CrossRef]
  17. Xia, L.; Xu, R.; Zhang, T.; Liu, X. Theory and simulation of calculating local illuminance density based on high dynamic range panoramic maps. Light. Res. Technol. 2022, 54, 329–345. [Google Scholar] [CrossRef]
  18. Xie, L.; Xu, J.; Zhang, R. Throughput Maximization for UAV-Enabled Wireless Powered Communication Networks. IEEE Internet Things J. 2018, 6, 1690–1703. [Google Scholar] [CrossRef] [Green Version]
  19. Amir, N.; Saifuddin, S.; Muhammad, M.; Maulana, R. An analysis of lighting design in a football stadium. Web Conf. EDP Sci. 2022, 339, 6008. [Google Scholar] [CrossRef]
Figure 1. Structure of the illuminance acquisition module.
Applsci 13 06774 g001
Figure 2. The communication between the illumination acquisition system.
Applsci 13 06774 g002
Figure 3. Task state transition diagram.
Applsci 13 06774 g003
Figure 4. Illumination acquisition system flow chart.
Applsci 13 06774 g004
Figure 5. The location of the outlier diagram.
Applsci 13 06774 g005
Figure 6. Distance definition diagram.
Applsci 13 06774 g006
Figure 7. (a) Illumination calculation surface selection in the venue model. (b) Distribution of plane illuminance values calculated at different heights.
Applsci 13 06774 g007
Figure 8. LOF algorithm flow chart.
Applsci 13 06774 g008
Figure 9. Physical hardware designed.
Applsci 13 06774 g009
Figure 10. Illuminance values measured by the illumination module and by SPIC-200.
Applsci 13 06774 g010
Figure 11. Experimental scenario construction.
Applsci 13 06774 g011
Figure 12. Illumination measurement area layout map.
Applsci 13 06774 g012
Figure 13. UAV captures measurement points.
Applsci 13 06774 g013
Figure 14. The UAV flight log data.
Applsci 13 06774 g014
Figure 15. Cloud platform showing illumination data.
Applsci 13 06774 g015
Figure 16. Outlier handling of collected data.
Applsci 13 06774 g016
Figure 17. Horizontal illuminance distribution at 4 m height in the stadium.
Applsci 13 06774 g017
Table 1. The error of the dynamic measurement.
NumberStatic Data (lx)Dynamic Data (lx)Relative ErrorError Rate
1 349−6−1.70%
2 352−3−0.85%
3 348−7−1.98%
4 353−2−0.57%
5355347−8−2.27%
6 352−3−0.85%
7 349−6−1.70%
8 353−2−0.57%
9 348−7−1.99%
10 349−6−1.70%
Table 2. Illuminance values acquired by the system.
Time (s)Value (lx)Time (s)Value (lx)Time (s)Value (lx)Time (s)Value (lx)
35914855393545138586
65385155696547141505
94975455699544144508
1248557554102545147591
1548960556105542150596
1847663572108553153495
2153766562111548156543
2454269563114551159547
2754372564117550162537
3054175564120550165542
3355578536123561168557
3654981539126563171551
3954984537129562174556
4254987533132566177548
4555090532135562180545
Disclaimer/Publisher’s Note: The statements, opinions and data contained in all publications are solely those of the individual author(s) and contributor(s) and not of MDPI and/or the editor(s). MDPI and/or the editor(s) disclaim responsibility for any injury to people or property resulting from any ideas, methods, instructions or products referred to in the content.

