Article

Prediction of Intensive Care Unit Length of Stay in the MIMIC-IV Dataset

1
Deptarment for Medical Data Science, Leipzig University Medical Center, 04107 Leipzig, Germany
2
Institute for Medical Informatics, Statistics and Epidemiology, Leipzig University, 04107 Leipzig, Germany
3
Faculty Applied Computer and Bio Sciences, Mittweida University of Applied Sciences, 09648 Mittweida, Germany
*
Author to whom correspondence should be addressed.
These authors contributed equally to this work.
Appl. Sci. 2023, 13(12), 6930; https://doi.org/10.3390/app13126930
Submission received: 18 May 2023 / Revised: 3 June 2023 / Accepted: 6 June 2023 / Published: 8 June 2023
(This article belongs to the Special Issue Data Science for Medical Informatics 2nd Edition)

Abstract

:
Accurately estimating the length of stay (LOS) of patients admitted to the intensive care unit (ICU) in relation to their health status helps healthcare management allocate appropriate resources and better plan for the future. This paper presents predictive models for the LOS of ICU patients from the MIMIC-IV database based on typical demographic and administrative data, as well as early vital signs and laboratory measurements collected on the first day of ICU stay. The goal of this study was to demonstrate a practical, stepwise approach to predicting patient’s LOS in the ICU using machine learning and early available typical clinical data. The results show that this approach significantly improves the performance of models for predicting actual LOS in a pragmatic framework that includes only data with short stays predetermined by a prior classification.

1. Introduction

The intensive care unit (ICU) provides comprehensive, life-saving care for critically ill patients. It has become an essential part of hospital-based care, providing specialized technical and professional expertise to help prevent the progression of severe illness in cases of acute life-threatening organ dysfunction or injury [1,2]. However, the increasing demand for critical care for patients with serious health conditions limits the capacity of the ICU. This can result, for example, in a limited number of beds available for patients or excessive workloads for medical and hospital staff, leading to delays in ICU admissions and ultimately increased morbidity and mortality. The COVID-19 pandemic in early 2020 and the months that followed highlighted this problem, as it created an urgent need for hospital space, supplies, and medical personnel, and placed a significant strain on healthcare systems worldwide [3,4]. Such an imbalance between supply and demand has implications not only for patient care, but also for public health, with the associated socioeconomic consequences. It is therefore of great importance to understand, plan, and coordinate ICU resources in order to provide optimal care for patients with critical illnesses in the future [5,6].
The patient’s length of stay (LOS) in the ICU is a process measure of ICU efficiency and effectiveness that is widely used as an indicator of ICU performance and possibly quality of care [7,8,9], albeit controversially [10,11,12]. LOS typically refers to the length of time that a patient spends in the ICU from admission to discharge. A prolonged stay in the ICU is associated with higher care costs and resource utilization, while early discharge from the ICU can lead to medical complications and an increased risk of readmission to the ICU or even higher mortality [13,14]. Therefore, an accurate estimate of the patient’s LOS in the ICU, based on the patient’s initial health data, helps healthcare management in the appropriate resource allocation and better planning for the future. Healthcare research has long relied on physicians’ subjective estimates [5,15,16], which have been shown to be less than accurate [17,18]. However, advances in machine learning (ML) algorithms, coupled with the increasing availability of larger amounts of critical care data, have paved the way for the development of more accurate predictive models of critical care outcomes [19,20,21,22,23].
The development of ML models for predicting LOS in the ICU has been the subject of numerous studies. ML research in healthcare, however, is not without challenges and limitations [23,24,25]. Practical progress in clinical ML has only been incremental and difficult to measure due to the vast diversity of clinical datasets and objectives, as well as the lack of common standard benchmarks for evaluating models [24,25]. Many ICU prediction models, for example, have been developed using data collected by local healthcare providers in a strictly private settings with limited external access, and are therefore not generalizable [20,26]. Moreover, most health data features (attributes) are highly variable across institutions, reflecting different underlying populations, clinical conditions, or even global health issues [24]. Similarly, many models have been developed for patients with specific diseases, such as cardiac disease [27,28], diabetes [29,30], or sepsis [31], and are therefore not easily comparable.
The predictive models of any hospital LOS are typically divided into two main groups: models developed to predict LOS with continuous outcomes, such as the actual number of days (hours) a patient stays in the ICU, are referred to as regression, while others that partition patient LOS into (coarse) discrete groups, such as short vs. long stays, are referred to as classification [26,32,33]. While studies have often adopted standard laboratory measurements to predict LOS in the ICU, some have relied on physiological scores, such as the Acute Physiology and Chronic Health Evaluation (APACHE) or the Simplified Acute Physiology Score (SAPS), and achieved higher accuracy [34,35]. Recent work has also leveraged deep learning methods, such as recurrent neural networks (RNNs) with long short-term memory (LSTM), to incorporate the time-series embedded in electronic health records (EHRs) and provide a more accurate estimate of ICU outcomes [36,37].
The aim of the present study was to develop predictive models for the LOS of patients admitted to the ICU based on their initial health status. We use the publicly available Medical Information Mart for Intensive Care (MIMIC) database and only consider typical health data routinely collected on the first day of ICU admission, including demographic and administrative data as well as vital signs and laboratory measurements. We perform a binary classification to identify patients at risk for a long LOS and estimate the probability that the patient will have a short or long ICU stay. The dichotomization of LOS into short and long is based on the third quartile of the entire dataset. The unexpectedly long LOS places a significant burden on ICU performance and is associated with poor outcomes, especially in patients with chronic diseases such as diabetes [32]. We also perform regression modeling to estimate the actual LOS in the ICU in a more practical framework. In this approach, only patient data whose LOS were predicted to be short in the initial classification are considered. Structural indicators such as the adequacy of equipment and qualifications of medical personnel are beyond the scope of this study.
The remainder of this paper is organized as follows: First, in the methods section, we introduce the dataset used in this study and then describe the data preparation, models, and evaluation metrics. Next, we present the classification and regression results and discuss the key points and challenges in the models. Finally, we summarize the main findings of the study and outline avenues for future work.

2. Methods

Here, we describe the dataset, algorithms, and experimental setup designed to predict LOS in the ICU using classification and regression models. The publicly available MIMIC dataset is utilized for the experiments by defining a cohort with specific features for modeling. Data from the first 24 h of ICU admission are included, with features of interest grouped into four categories: demographics, administrative data, vital signs, and laboratory measurements. Data cleaning and preparation are performed prior to modeling, and the model performance is finally evaluated.

2.1. MIMIC-IV Database

In this study, we use the MIMIC-IV version 2.1 database, which includes patients admitted to the BETH Israel Deaconess Medical Center during the period 2008–2019 [38,39]. The data contain multiple dimensions, from administrative data to laboratory results and diagnoses. Each patient in MIMIC-IV is assigned a unique identifier upon admission to the hospital. After (hospital) admission, the patient may be transferred to different departments, such as the emergency department or the ambulatory surgery unit. The patient may eventually be transferred to the ICU, with an ICU identifier, until being transferred to another department or discharged from the ICU completely. In MIMIC-IV, only 17% of the patients who visited the hospital stayed in the ICU, comprising 73,141 ICU stays for 50,934 patients.

2.2. Feature Selection

The experiments involve the selection of features from the MIMIC-IV dataset that are typically available in each ICU admission. 
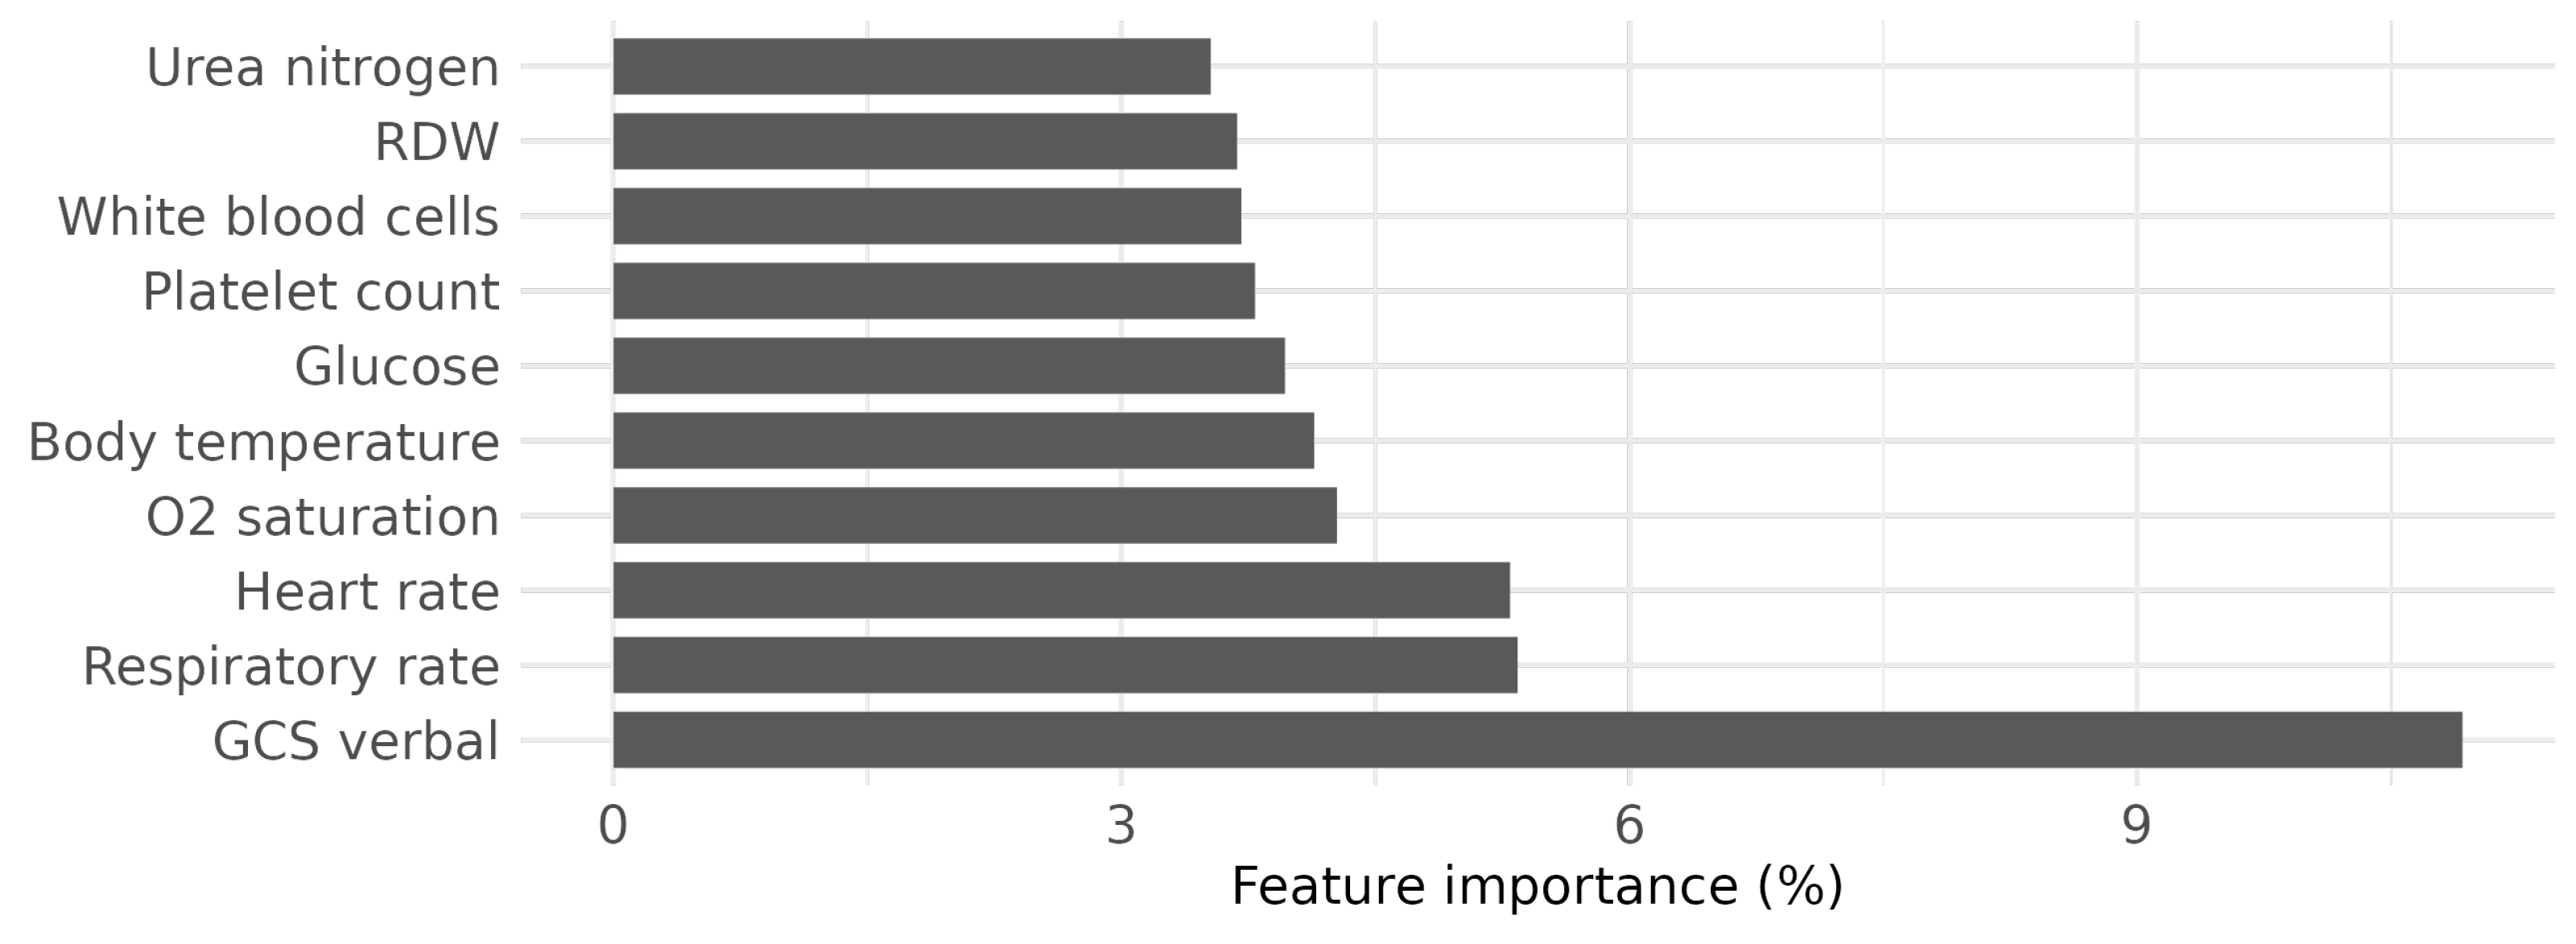
Table 1 summarizes all the features considered in the experiments, categorized into demographics, administrative, vital signs, and laboratory parameters. Demographic data include age and gender, neither of which are likely to change during hospitalization. Administrative data provide the LOS necessary for prediction as a ground truth label for each ICU stay. These data also comprise diagnoses, first care unit, admission type, and admission location, which can be viewed as structural representations of patient status specific to each hospital admission. Vital signs and laboratory parameters were measured several times during each ICU stay. We collected measurements within the first 24 h of ICU admission with the goal of developing a practical approach to classify (predict) ICU stays early after admission, while retaining data necessary for prediction. In addition, we only considered vital signs (laboratory parameters) with a completeness greater than 99% (95%) of all ICU stays, which means that, for instance, blood pressure is no longer included due to its high missing rate in the MIMIC-IV data. This ensures that fewer data are excluded due to missing values, as shown in Figure 1 for vital signs (A) and laboratory parameters (B). However, despite a high rate of missing values, the body temperature is still included here as an important vital sign [40].
As a result, the vital signs include heart rate, O 2 saturation pulse oxymetry, respiratory rate, body temperature, Glasgow Coma Scale (GCS) ocular response (eye), oral response (verbal), and motor response (motor). The selected laboratory parameters also include the anion gap, bicarbonate, chloride, creatinine, glucose, sodium, magnesium, potassium, phosphate, urea nitrogen, hematocrit, hemoglobin, mean corpuscular hemoglobin (MCH), mean corpuscular hemoglobin concentration (MCHC), mean corpuscular volume (MCV), red cell distribution width (RDW), red blood cells, white blood cells, and platelet count. All patients with at least one ICU visit are included in the cohort. Among ICU patients, we only select adults older than 18 years. In addition, we exclude patients with an LOS greater than 21 days to avoid extremely long stays, and less than one day since we consider data collected in the first 24 h for modeling. We also exclude patients who died during their stay in the ICU or who returned to the ICU within 48 h after being discharged from the ICU. To ensure the completeness of the selected data, we only consider ICU stays that have all the features required for the analysis, i.e., complete data. We finally specify a feasible range for each feature and exclude the extreme outliers outside this range to avoid, for instance, invalid negative values for heart rate. The flowchart in Figure 2 summarizes the sequential steps for selecting data that meet these conditions, with the size of the dataset indicated at each step.

2.3. Feature Engineering

First, we consider the diagnoses in the MIMIC-IV dataset that are coded according to the International Statistical Classification of Diseases and Related Health Problems (ICD) [41]. Approximately 55% of diagnoses are coded in ICD-9 and approximately 45% are coded in ICD-10. In order to capture diagnoses as a feature, we need to convert the ICD codes into a single version. For this purpose, we used the R package ‘touch’ (tools of utilization and cost in healthcare), which maps all ICD-9 codes to version 10 in four different cases: conversion of an ICD-9 code to (1) an ICD-10 code; (2) multiple ICD-10 codes; (3) a combination of ICD-10 codes; and (4) a non-ICD-10 code [42]. The first and last cases give unambiguous results, covering 73.89% and 2.00% of all hospital admissions with diagnoses coded in ICD-9, respectively, while the second and third cases (with 23.26% and only 0.67% coverage) require further processing. For example, in case two, ICD-9 = 5715 is converted into ICD-10 K740, K7460, and K7469, while case three maps the ICD-9 = 8603 to S271XXA+S21309A. In the latter case, we split the resulting combination of ICD-10 codes into multiple ones, similarly to in the second case. We then reduced the number of characters in the ICD-10 codes to maintain the same character length and searched for the least common factor by keeping the last letters. Finally, we verify that all ICD-10 codes are identical and replace the ICD-9 code with the truncated ICD code. If there is no match to the ICD-10 code, the ICD code is set to non-existent. The technical details of the conversion of the ICD codes are presented in the (Supplementary Materials). Once the ICD-9 to ICD-10 mapping is complete, we group the diagnoses into 22 chapters according to the categories specified by the WHO (https://icd.who.int/browse10/2019/en, accessed on 3 June 2023), and represent each ICD code by its corresponding group.
Vital signs and laboratory parameters were measured several times during each ICU stay. We represent these temporal parameters by their mean value over all measurements within the first 24 h of the ICU stay. In cases where no measurements were taken during this period, the parameters are declared as not available (NA). This single representation (mean) serves to reduce the complexity of the model, although it can also affect the model performance due to the lack of detailed information. Furthermore, we dichotomized ICU stays into short and long, defining a threshold of 4 days for the classification problem. Here, we classified LOS at the third quartile into short and long, as 75.2% of the data comprised LOSs of less than 4 days. For the regression, we left the LOS as a floating point number, rounding it to one decimal place.

2.4. Data Cleaning and Missing Data Handling

Data cleaning involves a more detailed examination of the data, with categorical and numerical variables treated separately. Missing and invalid values of categorical variables were determined and then set to non-existent. For numerical variables, we set specific ranges for each measurement, which are listed in Table 2 for vital signs. The ranges for the features were obtained from the literature or from a data-driven approach, taking into account the ranges present in the data.
For example, the maximum heart rate of 220 bpm (beats per minute) was taken as a reference [43], and 5 bpm added to be on the safe side. Regarding the minimum heart rate, we did not observe any patients with a heart rate lower than 25 bpm, so we took this as the lower limit. For the respiratory rate, we set the lower (upper) limit inspired by literature estimates as 8 (20) breaths per minute (brpm) for a lower (upper) respiratory rate bound [44]. We then reduced the lower limit by one unit and doubled the upper one. A patient can have an oxygen saturation of around 55% under certain conditions [45]; therefore, the lower limit for oxygen saturation has been set to 50%, reduced by 5% to leave more room for data. There are also few values in the saturation data above 100%, most likely due to specific treatments [46], so the upper limit was set based on the data with an (arbitrary) increase to 20%. We set the lower and upper temperature limits to 30 °C (86 °F) and 45 °C (113 °F). This is based on the observed body temperature being in the range of 33–39 °C, extended by the difference from the mean of 36.5 °C [47]. We did not observe any extreme outliers in the laboratory measurements and did not exclude any values in this respect.

2.5. Model

Four different classification and regression models for predicting LOS in the ICU are utilized and their performances are compared. The first is the common logistic/linear regression model (for classification/regression problems), which incorporates a linear combination of all features in modeling. Support vector machine (SVM) is the second, which determines the optimal hyperplane that separates different classes of data in an N-dimensional space, where N is the number of features used. The model computes the optimal hyperplane using a crucial kernel function, here the radial basis function, which performs well in classification problems even in the presence of nonlinear dependencies between features [29,48]. The next is random forest, an extension of decision trees where an ensemble of many possible trees is generated and selected using an optimization procedure. Random forest is commonly used for LOS prediction and typically shows quite a good performance [14]. The last one is the XGBoost, which is a tree-based method with an integrated end-to-end gradient boosting optimization that enables trees to optimize themselves [49]. These models are also widely used in LOS prediction with highly accurate results [50,51].

2.6. Evaluation

To evaluate the models, we randomly split the selected dataset into training and test datasets at a ratio of 80 to 20 percent. Different models are trained on the training dataset, and then their performance on the test dataset is evaluated using statistical metrics. Classifier performance is evaluated using common metrics such as accuracy, balanced accuracy, F1-score, and receiver operating characteristic—area under the curve (ROC AUC)—which are widely used to evaluate any binary classification. They are calculated from the confusion matrix with actual and predicted dimensions. The matrix elements denote true positives ( T P s ) and true negatives ( T N s ) as correctly predicted long and short LOS for each ICU stay. Incorrectly predicted long and short LOS are indicated by false positives ( F P ) and false negatives ( F N ), respectively. The accuracy is therefore directly calculated from the confusion matrix as ( T P + T N ) / ( T P + T N + F P + F N ) , and the F1-score as 2 T P / ( 2 T P + F P + F N ) . The balanced accuracy is the (arithmetic) mean of the true positive rate (TPR) and the true negative rate (TNR) equal to ( T P R + T N R ) / 2 , where TPR and TNR, also called sensitivity and specificity, are expressed as T P / ( T P + F N ) and T N / ( T N + F P ) , respectively. Similarly, the false positive rate (FPR) and the false negative rate (FNR) can be defined as F P / ( F P + T N ) and F N / ( F N + T P ) , as well as the predictive positive value (PPV) and predictive negative value (PNV) by T P / ( T P + F P ) and T N / ( T N + F N ) . AUC provides a single value metric as the area under the ROC, which displays the TPR versus the FPR for varying the threshold in the classification. As a more meaningful single measure of the confusion matrix, we also compute the Matthew correlation coefficient (MCC):
M C C = T P × T N F P × F N ( T P + F P ) ( T P + F N ) ( T N + F P ) ( T N + F N ) ,
which has the major advantage of being independent of the favorable class (i.e., positive or negative) [52].
Regarding the regression problem, we computed several metrics for each experiment, namely the root mean square error (RMSE), the mean absolute error (MAE), the mean absolute percentage error (MAPE), and the R 2 . The RMSE, which is commonly measured for regression, is defined by:
R M S E = 1 n LOS predicted LOS actual 2 ,
where n is the size of the (test) dataset, and LOS predicted and LOS actual are the predicted and actual LOS of the model [53]. The MAE measures the absolute error of the regression prediction as
M A E = 1 n LOS predicted LOS actual ,
with more applicability to normally distributed errors [54]. The MAPE is the next metric commonly used in the evaluation of regression models, with a more intuitive interpretation in terms of the relative error given by [55]:
M A P E = 1 n LOS predicted LOS actual LOS actual × 100 % ,
and the last is R 2 , also called the coefficient of determination, a common statistical measure of the linear correlation between variables, which is calculated by [56]:
R 2 = 1 ( LOS predicted LOS actual ) 2 ( LOS predicted LOS ¯ predicted ) 2 ,
where LOS ¯ predicted is the average over all predicted LOS of the model [57].

2.7. Setup

All machines employed in this study were running the Ubuntu operating system. The MIMIC-IV dataset is hosted in a PostgreSQL database, and data retrieval was performed using SQL queries. Data preparation and processing, model training, evaluation, and visualization were conducted using R. For visualization, the ggplot2 package was used [58], and tidyR and dplyR were the data-processing/handling packages [59,60].

3. Results

We first perform a feature analysis and measure the correlation between features and LOS to determine how a single feature affects LOS and is related to other features. Then, we present the classification and regression results of LOS prediction, and finally propose a practical stepwise framework with regression results based on a prior classification model and compare the performance of the models. To this end, we trained the classification and regression models on the training set and evaluated their performance on the test set to assess how well the models can generalize to data which have not yet been seen. We repeated each experiment 10 times, performing a random train/test split on the reshuffled data to reduce partitioning bias, and reported the mean of the scores. The standard deviations/standard errors are not presented for reader convenience as they are not significant (typically less than 1% for each setup). The hyperparameters were mainly set to their default values for the classification and regression models, since the primary objective of this study was to investigate how the performance of the stepwise approach can be improved compared to a baseline model. The technical details of the model training and evaluation are provided in the Supplementary Materials.

3.1. Feature Analysis

To facilitate data preparation, we have predefined specific ranges for temporal features with extreme outliers (see Table 2). These ranges were derived from the literature as well as from data-driven observations. However, it is not trivial to determine them because each feature may have several types of outliers. For example, feature values that fall outside a certain normal physiological range due to the patient’s condition, such as a significantly high heart rate in severe cardiovascular disease [61], versus those that are physiologically irrelevant, such as a body temperature above 70 °C (158 °F). Figure 3 illustrates the statistics of the vital signs as well as some laboratory parameters. For illustrative purposes, the extreme outliers of some features (e.g., body temperature) are not shown in the figure.
The respiratory rate (the number of breaths per minute) is an important vital sign that provides a good indication of a patient’s health condition. The mean respiratory rate in the MIMIC-IV dataset is 20.46 brpm with a range of 0–2,355,560. The lower and upper limits of this range are extremely abnormal, i.e., physiologically infeasible for a living human. The range we established in Table 2 is only based on the feature values observed in the dataset and may still be ambiguous; however, it does capture the reported (normal) range of 14–36 brpm for adults [62].
The extreme values of heart rate, commonly measured in any hospitalization, can indicate serious illness in a patient [63]. By examining the minimum and maximum heart rates of all patients in the MIMIC-IV dataset, we identified three heart rates below zero. The predefined upper limit of 225 bpm for the heart rate is also extremely deviated by 106 measurements. This results in a total of only 109 invalid outliers out of 6,463,819 measurements, i.e., the majority (>99.95%) of the heart rate data in the MIMIC-IV dataset remained within the range given in Table 2, which also contains the heart rates of fit people [64] and healthy people [65].
Oxygen saturation, another important vital sign, is well captured in the MIMIC-IV dataset according to the range specified in Table 2 (>99.96% of all data). There are 2346 (114) data points below (above) the lower (upper) limit of the specified range that remain physiologically impossible. The range of fluctuating oxygen saturation has been set much broader than normal because it is quite difficult to determine practical limits when considering various factors such as diseases or other medical conditions [45].
Body temperature has been shown to be an important vital sign, with an elevated body temperature independently associated with prolonged LOS [66]. The normal adult body temperature is reported to be approximately 36.5 °C (97.7 °F), regardless of the measurement method or location. However, in the MIMIC-IV dataset, the average patient body temperature is 37.1 °C (98.8 °F) because MIMIC contains data from patients in severe conditions. The increased body temperature may be due to a specific disease, or conversely, an elevated body temperature may cause a certain medical condition [66]. In the MIMIC-IV dataset, we identified invalid measurements for body temperature, e.g., a minimum of 99.9 °F ( 73.3 °C), which is obviously an erroneous record.
To explore the influence of features on LOS, we compute the correlation matrix of all features and LOS shown in Figure 4. The GCS has the highest correlation with LOS at 0.32 . The negative correlation means that the longer the LOS, the lower the GCS (3–15), because a higher score means that the patient is less comatose. However, the matrix shows that LOS is not strongly correlated with any single feature. Other features that are slightly correlated with LOS are temperature with 0.14 or respiratory rate with 0.13. Among the features, strong correlations are observed between sodium and chloride (0.70), creatinine and urea nitrogen (0.64), hematocrit and hemoglobin (0.96), hematocrit and red blood cells (0.81), and MCH and MCV (0.83). Such correlations reflect the underlying measurement parameters or the context of the biological system. For example, the calculation of MCH requires the amount of hemoglobin and the amount of red blood cells.

3.2. Classification

Table 3 summarizes the binary classification results, which show that the random forest algorithm achieves superior accuracy, F1 score, MCC, and AUC compared to the other algorithms. However, the performance of the models is not significantly different, as there are only small variations in the individual results of the different algorithms. We note that the data in this problem are imbalanced as a result of our definition of short/long stays at the third quartile (imbalance ratio 3:1), which noticeably affects the performance of the models. The balanced accuracy and MCC scores represent more appropriate measures of algorithm performance on imbalanced data [52,67].
In XGBoost, a feature importance matrix can be exported to give further insight into the influence of different features on the prediction performance. The visualization of the top 10 (important) features is shown in Figure 5. The GCS verbal has the highest importance for performance, consistent with its strong correlation with LOS (Figure 4). Vital signs ranked next, which were less than half as important as the GCS verbal, with no notable correlation with LOS. Laboratory measurements are placed in the last position, with glucose, platelets, and white blood cells at the top, while the remaining measurements are of decreasing importance to the model.

3.3. Regression

The results of the regression are presented in Table 4. Overall, SVM performs the best, with superior performance in terms of MAE and MAPE, although RF has a slightly better RMSE and R2. We note that, in the regression prediction, here, the full range of LOS is considered, i.e., 1–21 days. This leads to a challenge in predicting longer stays, because the mean prediction error (difference between predicted and actual LOS) grows exponentially with LOS. For example, with an LOS of 5 days, the mean error is approximately 1.5, while, with an LOS of 10, it increases to 6.5, i.e., more than 4 times worse.
This means that, given the hyperparameters and settings of the regression models, it is indeed rather unlikely to accurately predict a prolonged LOS based on data collected in the first 24 h of ICU admission. To test the performance of the regression models on a less variable dataset, we consider actual short ICU stays with LOSs up to 4 days. The results presented in parentheses in Table 4 show a huge improvement in all metrics, indicating relatively good predictions.
However, since the actual LOS is not known on the first day of admission, the latter approach is impractical for accurately predicting ICU LOS. In practice, we propose a stepwise approach to LOS prediction, where we first classify data based on ICU stays into short and long by a classifier, and then perform the regression on data with predicted short LOS. As such, the target dataset used for regression will contain some FN (data with actually long LOS predicted as short stay), making the modeling more complex while reflecting a real situation. We employed random forest and XGBoost models to classify ICU stays in the first step. These classifiers were selected by maximizing the geometric mean (G-mean) of the sensitivity and specificity of the classification equal to TPR × TNR . For the reference, the corresponding confusion matrices for random forest and XGBoost classifiers used prior to regression are displayed in Table 5.
XGBoost, for example, correctly classifies 29,976 out of 31,849 short stays with a TNR of 0.94. This means that 1873 short stays are missing because they are incorrectly classified as long stays. Similarly, only 617 stays are misclassified as short stays with an NPV of 0.98, while they are actually long stays. In the next step, the regression is performed based on the predicted short stays from the classifiers. There is a minor difference between the classification results of random forest and XGBoost, resulting in small discrepancies in the regression metrics. The results are summarized in Table 6, with random forest actually outperforming XGBoost. Although the regression results are still worse than those for the actual short stays reported in parentheses in Table 4, they are significantly improved. To more accurately predict the actual LOS for longer stays, we should move the data collection period forward and consider data from, e.g., the first four days or at least the fourth day.

4. Discussion

4.1. Data Preparation and Data Analysis

Data preparation involves the preprocessing and cleaning of the data and is therefore an important step prior to data analysis and modeling. We defined a reasonable range for each selected feature to avoid infeasible values that are physiologically irrelevant. We found that the majority of the data remained within the ranges we defined for the selected features, namely the vital signs. However, these defined ranges are conservative and may still have some room for error. These errors can be due to the data captured by the (primary) data sources, such as the measurement of body temperature in different parts of the body, or the dependence of heart rate on different factors such as age, gender, or patient fitness. Narrowing the ranges reduces the number of records in the dataset, thereby eliminating some potentially interesting data from patients with uncharacteristic patterns. Defining these ranges for the features is a challenging task because different medical conditions, diseases, comorbidities, or even demographics strongly influence the features. The primary means of gaining insight into patient details in MIMIC-IV is through the data stored in the database using a data-driven approach. We emphasize that a more systematic approach is needed to ensure high-quality data across a medically relevant range of values. This would involve dealing with missing data, which is not addressed in this study.

4.2. Temporal Feature and Diagnoses

Vital signs and laboratory parameters are usually measured several times during the first 24 h of a patient’s ICU admission. To represent such temporal data in the modeling, we used the mean of all measurements during this period (the first day of ICU admission). This single representation of temporal features simplifies the underlying complexity of the data and thus leads to information reduction. It is therefore important to select an appropriate measure for each feature in order to improve the performance in predicting LOS. To this end, we also explored several other measures, such as mean, median, standard deviation, minimum, and maximum, or a combination thereof, to represent the temporal features and evaluate their impact on improving the prediction result of LOS. Figure 6 depicts the performances of all classifiers in terms of balanced accuracy and MCC, provided that the temporal features are represented by single values or a combination. We found that models that only considered the mean performed quite well overall, with logistic regression and SVM achieving slightly better results when using both the mean and the maximum. The performance of the model, however, can be significantly improved by using a deep learning model that takes into account the detailed information contained in the temporal features.
Each patient admitted to the ICU is typically diagnosed with multiple conditions identified by ICD codes. We selected the top two diagnoses based on the ranking available in the dataset, which may not include the principal diagnoses (MIMIC documentation (https://mimic.mit.edu/docs/iv/modules/hosp/diagnoses_icd/, accessed on 3 June 2023)). This assumption comes from the hospital billing system, where the principal diagnosis may appear among the first five diagnoses listed on the bill because of the need to convert the patient’s complex conditions into a single coding system (e.g., ICD-10). The discrepancy between the principal diagnosis and the first diagnosis listed in the EHR actually depends on several factors, such as physician workload, expert experience, and the billing system itself [68]. We ultimately classified each ICD-10 code into 22 specific (coarse-grained) groups as described in Section 2. The diagnoses, included as input features in the modeling in this study, appear to have little impact on the classification performance. This is due to the fact that two selected diagnoses identified by ranking in the dataset are not necessarily the most important ones, or to the reduction in information by coarsening the diagnosis into chapters. We also note that the impact of ICD-9–10 conversion on the performance is minor, as only 2% of all hospital admissions with ICD-9 coded diagnoses did not have a unique converted ICD-10 code when the final code grouping was considered. Further research on diagnoses and their inclusion is warranted in future work to determine how the information contained in diagnosis coding can improve classification performance.

4.3. Model Evaluation

Many studies have focused on a specific disease, resulting in more specialized cohorts and features [27,28,29,30,31], and thus poorly comparable to the present study. However, another recent study has used the same setting (predicting ICU LOS using data collected within the first 24 h of admission) and achieved high accuracy, but with different features and cohort conditions which makes the comparison difficult [69]. In fact, they use additional procedure information, more demographic features such as marital status, the number of previous surgeries or smoking history, and free text diagnosis. We note that they also considered a wider range of LOSs and performed a multiclass classification (with three classes). However, their results show an AUC (macro AUC) of 0.77, which is still lower than the best AUC of the present work (0.80). This could be due to the fact that it is generally more difficult for the model to predict longer LOSs (>25) with a very limited amount of data, as well as the higher complexity due to the multiclass classification. Thus, model evaluation remains a key challenge for ML in healthcare due to the lack of common standard benchmarks.

5. Conclusions

Predicting hospital length of stay (LOS) is important for clinical resources and cost management; however, it is a challenging problem because of the multiple factors involved. In this study, we performed the predictive modeling of LOS for patients admitted to the ICU of the MIMIC-IV dataset. We prepared and processed the data with typical features, including demographic and administrative data as well as vital signs and laboratory measurements collected on the first day of the ICU stay. We also considered data with LOSs of up to three weeks to avoid extremely long stays and divided them into short and long stays in the upper quartile. We then performed binary classification using different models: logistic regression, SVM, random forest, and XGBoost. The models were evaluated on several metrics, averaged over 10 different experiments using a repeated random train/test split for each model. The results demonstrate that the random forest is superior to the other algorithms, while the accuracy is moderate, as many actual long LOSs are predicted to be short.
We also performed regression models to predict the actual LOS in the ICU. The results show the poor performance of the models when the entire dataset is considered with a maximum LOS of 21 days. This is mainly due to the fact that the models only incorporated data collected on the first day of ICU admission and are therefore unlikely to correctly predict a long LOS. To conclude the study, we proposed a practical approach for a realistic situation where the actual LOS on the first day of admission is not yet known. For this purpose, we first classified LOS as short or long stay, and then predicted the actual LOS only for data with a short predicted LOS. As a result, this approach significantly improved the performance of the models, with SVM and random forest outperforming other models. To predict an LOS longer than four days, we should shift the modeling window forward and consider, for example, data from the first four days or at least the fourth day.
Future work will focus on improving the classification performance by exploiting the embedded information in diagnosis data. Profiling the diagnosis codes and the consideration of interrelated diseases will have an impact on performance. Moreover, a deep learning model that incorporates detailed information contained in temporal features can greatly improve the performance of the model and requires further investigation.

Supplementary Materials

The following are available online at https://www.mdpi.com/article/10.3390/app13126930/s1.

Author Contributions

Conceptualization: L.H., S.S. and T.K.; Software: L.H.; Validation: L.H.; Data curation: L.H.; Writing—original draft preparation: L.H., S.S. and T.K.; Writing—review and editing: L.H., S.S. and T.K.; Visualization: L.H. and S.S.; Supervision: S.S. and T.K.; Project administration: T.K.; Funding acquisition: T.K. All authors have read and agreed to the published version of the manuscript.

Funding

This work was supported by the German Ministry for Research and Education as part of the SMITH consortium (T.K., grant no. 01ZZ1803K), and by the German Ministry of Health as part of the LEUKO-Expert consortium (L.H., grant no. ZMVI1-2520DAT94A). This work was conducted jointly by the Leipzig University Medical Center and the Mittweida University of Applied Sciences.

Institutional Review Board Statement

Not applicable.

Informed Consent Statement

Not applicable.

Data Availability Statement

The data used in this study are already publicly available. We also provide the source code for all methods through the publicly accessible https://gitlab.com/ul-mds/data-science/length-of-stay-prediction-mimic-iv, accessed on 3 June 2023.

Conflicts of Interest

The authors declare no conflict of interest. The funders had no role in the design of the study; in the collection, analyses, or interpretation of data; in the writing of the manuscript, or in the decision to publish the results.

Abbreviations

The following abbreviations are used in this manuscript:
AUCArea under the curve
bpmBeats per minute
brpmBreaths per minute
EHRElectronic health record
FPFalse positive
FPRFalse positive rate
FNFalse negative
FNRFalse negative rate
GCSGlasgow Coma Scale
ICDInternational Statistical Classification of Diseases and Related Health Problems
ICUIntensive care unit
LOSLength of stay
LRLogistic regression
LSTMLong short-term memory
MAEMean absolute error
MAPEMean absolute percentage error
MCCMatthew correlation coefficient
MCHMean corpuscular hemoglobin
MCHCMean corpuscular hemoglobin concentration
MCVMean corpuscular volume
MIMICMedical Information Mart for Intensive Care
MLMachine learning
NPVNegative predictive value
PPVPositive predictive value
RDWRed cell distribution width
RFRandom forest
RMSERoot mean squared error
RNNRecurrent neural network
ROCReceiver operating characteristic
SQLStructured query language
SVMSupport vector machine
TNTrue negative
TNRTrue negative rate
TPTrue positive
TPRTrue positive rate
WHOWorld Health Organization
XGBXGBoost (Extreme gradient boosting)

References

  1. Marshall, J.C.; Bosco, L.; Adhikari, N.K.; Connolly, B.; Diaz, J.V.; Dorman, T.; Fowler, R.A.; Meyfroidt, G.; Nakagawa, S.; Pelosi, P.; et al. What is an intensive care unit? A report of the task force of the World Federation of Societies of Intensive and Critical Care Medicine. J. Crit. Care 2017, 37, 270–276. [Google Scholar] [CrossRef] [PubMed]
  2. Weil, M.H.; Tang, W. From Intensive Care to Critical Care Medicine: A Historical Perspective. Am. J. Respir. Crit. Care Med. 2011, 183, 1451–1453. [Google Scholar] [CrossRef] [PubMed]
  3. Magunia, H.; Lederer, S.; Verbuecheln, R.; Gilot, B.J.; Koeppen, M.; Haeberle, H.A.; Mirakaj, V.; Hofmann, P.; Marx, G.; Bickenbach, J.; et al. Machine learning identifies ICU outcome predictors in a multicenter COVID-19 cohort. Crit. Care 2021, 25, 295. [Google Scholar] [CrossRef] [PubMed]
  4. Lorenzen, S.S.; Nielsen, M.; Jimenez-Solem, E.; Petersen, T.S.; Perner, A.; Thorsen-Meyer, H.C.; Igel, C.; Sillesen, M. Using machine learning for predicting intensive care unit resource use during the COVID-19 pandemic in Denmark. Sci. Rep. 2021, 11, 18959. [Google Scholar] [CrossRef] [PubMed]
  5. Robinson, G.H.; Davis, L.E.; Leifer, R.P. Prediction of Hospital Length of Stay. Health Serv. Res. 1966, 1, 287–300. [Google Scholar] [PubMed]
  6. Stone, K.; Zwiggelaar, R.; Jones, P.; Parthaláin, N.M. A systematic review of the prediction of hospital length of stay: Towards a unified framework. PLOS Digit. Health 2022, 1, e0000017. [Google Scholar] [CrossRef]
  7. de Vos, M.; Graafmans, W.; Keesman, E.; Westert, G.; van der Voort, P.H.J. Quality measurement at intensive care units: Which indicators should we use? J. Crit. Care 2007, 22, 267–274. [Google Scholar] [CrossRef] [Green Version]
  8. Lingsma, H.F.; Bottle, A.; Middleton, S.; Kievit, J.; Steyerberg, E.W.; Marang-van de Mheen, P.J. Evaluation of hospital outcomes: The relation between length-of-stay, readmission, and mortality in a large international administrative database. BMC Health Serv. Res. 2018, 18, 116. [Google Scholar] [CrossRef] [Green Version]
  9. Otto, R.; Blaschke, S.; Schirrmeister, W.; Drynda, S.; Walcher, F.; Greiner, F. Length of stay as quality indicator in emergency departments: Analysis of determinants in the German Emergency Department Data Registry (AKTIN registry). Intern. Emerg. Med. 2022, 17, 1199–1209. [Google Scholar] [CrossRef]
  10. Thomas, J.W.; Guire, K.E.; Horvat, G.G. Is patient length of stay related to quality of care? Hosp. Health Serv. Adm. 1997, 42, 489–507. [Google Scholar]
  11. Clarke, A. Length of in-hospital stay and its relationship to quality of care. BMJ Qual. Saf. 2002, 11, 209–210. [Google Scholar] [CrossRef] [PubMed]
  12. Brasel, K.J.; Lim, H.J.; Nirula, R.; Weigelt, J.A. Length of Stay: An Appropriate Quality Measure? Arch. Surg. 2007, 142, 461–466. [Google Scholar] [CrossRef] [PubMed] [Green Version]
  13. Halpern, N.A.; Pastores, S.M. Critical care medicine in the United States 2000–2005: An analysis of bed numbers, occupancy rates, payer mix, and costs. Crit. Care Med. 2010, 38, 65–71. [Google Scholar] [CrossRef] [PubMed]
  14. Alghatani, K.; Ammar, N.; Rezgui, A.; Shaban-Nejad, A. Predicting Intensive Care Unit Length of Stay and Mortality Using Patient Vital Signs: Machine Learning Model Development and Validation. JMIR Med. Inform. 2021, 9, e21347. [Google Scholar] [CrossRef]
  15. Robinsons, G.H.; Davis, L.E.; Johnson, G.C. The Physician as an Estimator of Hospital Stay. Hum. Factors J. Hum. Factors Ergon. Soc. 1966, 8, 201–208. [Google Scholar] [CrossRef]
  16. Gustafson, D.H. Length of stay: Prediction and explanation. Health Serv. Res. 1968, 3, 12–34. [Google Scholar]
  17. Nassar, A.P.; Caruso, P. ICU physicians are unable to accurately predict length of stay at admission: A prospective study. Int. J. Qual. Health Care 2016, 28, 99–103. [Google Scholar] [CrossRef] [Green Version]
  18. Gusmão Vicente, F.; Polito Lomar, F.; Mélot, C.; Vincent, J.L. Can the experienced ICU physician predict ICU length of stay and outcome better than less experienced colleagues? Intensive Care Med. 2004, 30, 655–659. [Google Scholar] [CrossRef]
  19. Bacchi, S.; Tan, Y.; Oakden-Rayner, L.; Jannes, J.; Kleinig, T.; Koblar, S. Machine learning in the prediction of medical inpatient length of stay. Intern. Med. J. 2022, 52, 176–185. [Google Scholar] [CrossRef]
  20. Iwase, S.; Nakada, T.A.; Shimada, T.; Oami, T.; Shimazui, T.; Takahashi, N.; Yamabe, J.; Yamao, Y.; Kawakami, E. Prediction algorithm for ICU mortality and length of stay using machine learning. Sci. Rep. 2022, 12, 12912. [Google Scholar] [CrossRef]
  21. Mamdani, M.; Slutsky, A.S. Artificial intelligence in intensive care medicine. Intensive Care Med. 2021, 47, 147–149. [Google Scholar] [CrossRef] [PubMed]
  22. Shillan, D.; Sterne, J.A.C.; Champneys, A.; Gibbison, B. Use of machine learning to analyse routinely collected intensive care unit data: A systematic review. Crit. Care 2019, 23, 284. [Google Scholar] [CrossRef] [PubMed] [Green Version]
  23. Gutierrez, G. Artificial Intelligence in the Intensive Care Unit. Crit. Care 2020, 24, 101. [Google Scholar] [CrossRef] [PubMed] [Green Version]
  24. Ellis, R.J.; Sander, R.M.; Limon, A. Twelve key challenges in medical machine learning and solutions. Intell.-Based Med. 2022, 6, 100068. [Google Scholar] [CrossRef]
  25. Harutyunyan, H.; Khachatrian, H.; Kale, D.C.; Ver Steeg, G.; Galstyan, A. Multitask learning and benchmarking with clinical time series data. Sci. Data 2019, 6, 96. [Google Scholar] [CrossRef] [Green Version]
  26. Sridhar, S.; Whitaker, B.; Mouat-Hunter, A.; McCrory, B. Predicting Length of Stay using machine learning for total joint replacements performed at a rural community hospital. PLoS ONE 2022, 17, e0277479. [Google Scholar] [CrossRef]
  27. Daghistani, T.A.; Elshawi, R.; Sakr, S.; Ahmed, A.M.; Al-Thwayee, A.; Al-Mallah, M.H. Predictors of in-hospital length of stay among cardiac patients: A machine learning approach. Int. J. Cardiol. 2019, 288, 140–147. [Google Scholar] [CrossRef] [PubMed]
  28. Sud, M.; Yu, B.; Wijeysundera, H.C.; Austin, P.C.; Ko, D.T.; Braga, J.; Cram, P.; Spertus, J.A.; Domanski, M.; Lee, D.S. Associations between Short or Long Length of Stay and 30-Day Readmission and Mortality in Hospitalized Patients with Heart Failure. JACC Heart Fail. 2017, 5, 578–588. [Google Scholar] [CrossRef]
  29. Alturki, L.; Aloraini, K.; Aldughayshim, A.; Albahli, S. Predictors of Readmissions and Length of Stay for Diabetes Related Patients. In Proceedings of the 2019 IEEE/ACS 16th International Conference on Computer Systems and Applications (AICCSA), Abu Dhabi, United Arab Emirates, 3–7 November 2019; pp. 1–8. [Google Scholar] [CrossRef]
  30. Morton, A.; Marzban, E.; Giannoulis, G.; Patel, A.; Aparasu, R.; Kakadiaris, I.A. A Comparison of Supervised Machine Learning Techniques for Predicting Short-Term In-Hospital Length of Stay among Diabetic Patients. In Proceedings of the 2014 13th International Conference on Machine Learning and Applications, Detroit, MI, USA, 3–6 December 2014; pp. 428–431. [Google Scholar] [CrossRef]
  31. Tsoukalas, A.; Albertson, T.; Tagkopoulos, I. From Data to Optimal Decision Making: A Data-Driven, Probabilistic Machine Learning Approach to Decision Support for Patients with Sepsis. JMIR Med. Inform. 2015, 3, e3445. [Google Scholar] [CrossRef] [Green Version]
  32. Osuagwu, U.L.; Xu, M.; Piya, M.K.; Agho, K.E.; Simmons, D. Factors associated with long intensive care unit (ICU) admission among inpatients with and without diabetes in South Western Sydney public hospitals using the New South Wales admission patient data collection (2014–2017). BMC Endocr. Disord. 2022, 22, 27. [Google Scholar] [CrossRef]
  33. Gentimis, T.; Alnaser, A.J.; Durante, A.; Cook, K.; Steele, R. Predicting Hospital Length of Stay Using Neural Networks on MIMIC III Data. In Proceedings of the 2017 IEEE 15th Intl Conf on Dependable, Autonomic and Secure Computing, 15th International Conference on Pervasive Intelligence and Computing, 3rd International Conference on Big Data Intelligence and Computing and Cyber Science and Technology Congress (DASC/PiCom/DataCom/CyberSciTech), Orlando, FL, USA, 6–10 November 2017; pp. 1194–1201. [Google Scholar] [CrossRef]
  34. Takekawa, D.; Endo, H.; Hashiba, E.; Hirota, K. Predict models for prolonged ICU stay using APACHE II, APACHE III and SAPS II scores: A Japanese multicenter retrospective cohort study. PLoS ONE 2022, 17, e0269737. [Google Scholar] [CrossRef] [PubMed]
  35. Zimmerman, J.E.; Kramer, A.A.; McNair, D.S.; Malila, F.M.; Shaffer, V.L. Intensive care unit length of stay: Benchmarking based on Acute Physiology and Chronic Health Evaluation (APACHE) IV. Crit. Care Med. 2006, 34, 2517–2529. [Google Scholar] [CrossRef] [PubMed]
  36. Rajkomar, A.; Oren, E.; Chen, K.; Dai, A.M.; Hajaj, N.; Hardt, M.; Liu, P.J.; Liu, X.; Marcus, J.; Sun, M.; et al. Scalable and accurate deep learning with electronic health records. NPJ Digit. Med. 2018, 1, 1–10. [Google Scholar] [CrossRef] [PubMed]
  37. Rocheteau, E.; Liò, P.; Hyland, S. Temporal pointwise convolutional networks for length of stay prediction in the intensive care unit. In Proceedings of the Conference on Health, Inference, and Learning, Virtual Event USA, 8–10 April 2021; pp. 58–68. [Google Scholar] [CrossRef]
  38. Johnson, A.E.W.; Bulgarelli, L.; Shen, L.; Gayles, A.; Shammout, A.; Horng, S.; Pollard, T.J.; Hao, S.; Moody, B.; Gow, B.; et al. MIMIC-IV, a freely accessible electronic health record dataset. Sci. Data 2023, 10, 1. [Google Scholar] [CrossRef]
  39. Johnson, A.; Bulgarelli, L.; Pollard, T.; Horng, S.; Celi, L.A.; Mark, R. MIMIC-IV. Type: Dataset. Available online: https://physionet.org/content/mimiciv/2.2/ (accessed on 3 June 2023).
  40. Lockwood, C.; Conroy-Hiller, T.; Page, T. Vital signs. JBI Rep. 2004, 2, 207–230. [Google Scholar] [CrossRef]
  41. World Health Organization. International Statistical Classification of Diseases and Related Health Problems; World Health Organization: Geneva, Switzerland, 2015. [Google Scholar]
  42. Wang, W.; Li, Y.; Yan, J. Touch: Tools of Utilization and Cost in Healthcare. Available online: https://cran.r-project.org/web/packages/touch/index.html (accessed on 3 June 2023).
  43. Tanaka, H.; Monahan, K.D.; Seals, D.R. Age-predicted maximal heart rate revisited. J. Am. Coll. Cardiol. 2001, 37, 153–156. [Google Scholar] [CrossRef] [Green Version]
  44. Hooker, E.A.; O’Brien, D.J.; Danzl, D.F.; Barefoot, J.A.; Brown, J.E. Respiratory rates in emergency department patients. J. Emerg. Med. 1989, 7, 129–132. [Google Scholar] [CrossRef]
  45. Beasley, R.; Chien, J.; Douglas, J.; Eastlake, L.; Farah, C.; King, G.; Moore, R.; Pilcher, J.; Richards, M.; Smith, S.; et al. Target oxygen saturation range: 92–96% Versus 94–98%: Target oxygen saturation range. Respirology 2017, 22, 200–202. [Google Scholar] [CrossRef] [Green Version]
  46. Mathew, T.M.; Sharma, S. High Altitude Oxygenation; StatPearls Publishing: Tampa, FL, USA, 2023. [Google Scholar]
  47. Geneva, I.I.; Cuzzo, B.; Fazili, T.; Javaid, W. Normal Body Temperature: A Systematic Review. Open Forum Infect. Dis. 2019, 6, ofz032. [Google Scholar] [CrossRef]
  48. Gutierrez, J.M.P.; Sicilia, M.A.; Sanchez-Alonso, S.; Garcia-Barriocanal, E. Predicting Length of Stay Across Hospital Departments. IEEE Access 2021, 9, 44671–44680. [Google Scholar] [CrossRef]
  49. Chen, T.; Guestrin, C. XGBoost: A Scalable Tree Boosting System. In Proceedings of the 22nd ACM SIGKDD International Conference on Knowledge Discovery and Data Mining, San Francisco, CA, USA, 13–17 August 2016; pp. 785–794. [Google Scholar] [CrossRef] [Green Version]
  50. Chen, Y. Prediction and Analysis of Length of Stay Based on Nonlinear Weighted XGBoost Algorithm in Hospital. J. Healthc. Eng. 2021, 2021, 4714898. [Google Scholar] [CrossRef] [PubMed]
  51. Chen, R.; Zhang, S.; Li, J.; Guo, D.; Zhang, W.; Wang, X.; Tian, D.; Qu, Z.; Wang, X. A study on predicting the length of hospital stay for Chinese patients with ischemic stroke based on the XGBoost algorithm. BMC Med. Inform. Decis. Mak. 2023, 23, 49. [Google Scholar] [CrossRef] [PubMed]
  52. Chicco, D.; Jurman, G. The advantages of the Matthews correlation coefficient (MCC) over F1 score and accuracy in binary classification evaluation. BMC Genom. 2020, 21, 6. [Google Scholar] [CrossRef] [PubMed] [Green Version]
  53. Willmott, C.; Matsuura, K. Advantages of the mean absolute error (MAE) over the root mean square error (RMSE) in assessing average model performance. Clim. Res. 2005, 30, 79–82. [Google Scholar] [CrossRef]
  54. Chai, T.; Draxler, R.R. Root mean square error (RMSE) or mean absolute error (MAE)?—Arguments against avoiding RMSE in the literature. Geosci. Model Dev. 2014, 7, 1247–1250. [Google Scholar] [CrossRef] [Green Version]
  55. Chicco, D.; Warrens, M.J.; Jurman, G. The coefficient of determination R-squared is more informative than SMAPE, MAE, MAPE, MSE and RMSE in regression analysis evaluation. PeerJ Comput. Sci. 2021, 7, e623. [Google Scholar] [CrossRef]
  56. Colin Cameron, A.; Windmeijer, F.A. An R-squared measure of goodness of fit for some common nonlinear regression models. J. Econom. 1997, 77, 329–342. [Google Scholar] [CrossRef]
  57. Kasuya, E. On the use of r and r squared in correlation and regression. Ecol. Res. 2019, 34, 235–236. [Google Scholar] [CrossRef]
  58. Wickham, H. ggplot2: Elegant Graphics for Data Analysis, 2nd ed.; Springer: Cham, Switzerland, 2016. [Google Scholar]
  59. Wickham, H.; Vaughan, D.; Girlich, M. Tidyr: Tidy Messy Data. 2023. Available online: https://tidyr.tidyverse.org (accessed on 3 June 2023).
  60. Wickham, H.; François, R.; Henry, L.; Müller, K.; Vaughan, D. Dplyr: A Grammar of Data Manipulation. 2023. Available online: https://dplyr.tidyverse.org (accessed on 3 June 2023).
  61. Fox, K.; Borer, J.S.; Camm, A.J.; Danchin, N.; Ferrari, R.; Lopez Sendon, J.L.; Steg, P.G.; Tardif, J.C.; Tavazzi, L.; Tendera, M. Resting Heart Rate in Cardiovascular Disease. J. Am. Coll. Cardiol. 2007, 50, 823–830. [Google Scholar] [CrossRef] [Green Version]
  62. Subbe, C.P.; Davies, R.G.; Williams, E.; Rutherford, P.; Gemmell, L. Effect of introducing the Modified Early Warning score on clinical outcomes, cardio-pulmonary arrests and intensive care utilisation in acute medical admissions: Forum. Anaesthesia 2003, 58, 797–802. [Google Scholar] [CrossRef]
  63. Magder, S.A. The ups and downs of heart rate. Crit. Care Med. 2012, 40, 239–245. [Google Scholar] [CrossRef] [PubMed]
  64. Nes, B.M.; Janszky, I.; Wisløff, U.; Støylen, A.; Karlsen, T. Age-predicted maximal heart rate in healthy subjects: The HUNT Fitness Study: Maximal heart rate in a population. Scand. J. Med. Sci. Sport. 2013, 23, 697–704. [Google Scholar] [CrossRef] [PubMed]
  65. Wohlfart, B.; Farazdaghi, G.R. Reference values for the physical work capacity on a bicycle ergometer for men—A comparison with a previous study on women: Physical work capacity on a bicycle ergometer. Clin. Physiol. Funct. Imaging 2003, 23, 166–170. [Google Scholar] [CrossRef] [PubMed] [Green Version]
  66. Diringer, M.N.; Reaven, N.L.; Funk, S.E.; Uman, G.C. Elevated body temperature independently contributes to increased length of stay in neurologic intensive care unit patients. Crit. Care Med. 2004, 32, 1489–1495. [Google Scholar] [CrossRef] [PubMed]
  67. Brodersen, K.H.; Ong, C.S.; Stephan, K.E.; Buhmann, J.M. The Balanced Accuracy and Its Posterior Distribution. In Proceedings of the 2010 20th International Conference on Pattern Recognition, Istanbul, Turkey, 23–26 August 2010; pp. 3121–3124. [Google Scholar] [CrossRef]
  68. Studney, D.R.; Hakstian, A.R. A comparison of medical record with billing diagnostic information associated with ambulatory medical care. Am. J. Public Health 1981, 71, 145–149. [Google Scholar] [CrossRef] [PubMed] [Green Version]
  69. Harerimana, G.; Kim, J.W.; Jang, B. A deep attention model to forecast the Length Of Stay and the in-hospital mortality right on admission from ICD codes and demographic data. J. Biomed. Inform. 2021, 118, 103778. [Google Scholar] [CrossRef]
Figure 1. The amount of missing data (percent) for (A) vital signs and (B) laboratory measurements collected during the first 24 h after ICU admission in the MIMIC-IV dataset. The vital signs (laboratory measurements) with less than 1% (5%) of all data missing are shown herein. Heart rhythm is not included in the final dataset as it is in free-text format.
Applsci 13 06930 g001
Figure 2. The sequential steps for selecting data from the MIMIC-IV dataset that meet the conditions specified in this study. The size of the dataset at each step is denoted by N, with the final cohort containing 41,473 ICU stays.
Applsci 13 06930 g002
Figure 3. Distribution (box plot) of several selected features, namely body temperature, chloride, creatinine, heart rate, MCV, O2 saturation, and respiratory rate before data cleaning. The box plots show the wide range of variation for few features, with some extreme outliers not shown for visualization purposes (e.g., for body temperature).
Applsci 13 06930 g003
Figure 4. Visualization of the correlation matrix between the features and LOS. For illustration purposes, those with at least a correlation of 0.3 are shown and the three different GCSs are combined into one.
Applsci 13 06930 g004
Figure 5. Percentage of the feature importance from the XGBoost model used for classification. The GCS verbal shows the highest performance importance, consistent with its strong correlation with LOS.
Applsci 13 06930 g005
Figure 6. Evaluation of different classifiers (logistic regression, SVM, random forest, XGBoost) in terms of (A) balanced accuracy and (B) MCC, where temporal features are represented by different measures including mean, maximum, mean and maximum, and mean and the standard deviation. The points and error bars indicate the mean and standard deviation of the results from 10 different experiments using repeated random train/test split.
Applsci 13 06930 g006
Table 1. The typical features (attributes) from the MIMIC-IV dataset are used in this study for predictive modeling. These data were collected in the first 24 h after admission to the ICU. They are divided into four categories: demographic, administrative, vital signs, and laboratory parameters.
Data CategoriesFeatures
DemographicAge, Gender
AdministrativeDiagnoses, First care unit, Admission type, Admission location, LOS
Vital signsHeart rate, O 2 saturation, Respiratory rate, Body temperature, Glasgow Coma Scale (eye, verbal, motor)
Lab parametersAnion gap, Bicarbonate, Chloride, Creatinine, Glucose, Sodium, Magnesium, Potassium, Phosphate, Urea nitrogen, Hematocrit, Hemoglobin, MCH, MCHC, MCV, RDW, Red blood cells, White blood cells, Platelet count
Table 2. Specified ranges for vital signs to avoid extreme outliers that are physiologically irrelevant.
MeasurementRangeUnit
Heart rate[25–225]bpm
Respiratory rate[7–40]brpm
Oxygen saturation[50–120]%
Body temperature[86–113]°F
Table 3. The binary classification results of the different models evaluated in terms of accuracy, F1-score, balanced accuracy, MCC, and AUC. The results of each evaluation score are averaged over 10 different experiments using repeated random train/test split. Random forest outperforms other models overall.
MethodAccuracyF1Balanced AccuracyMCCAUC
Logistic regression0.7850.4350.6090.3070.735
SVM0.7920.4380.6100.3260.740
Random forest0.8100.4420.6550.4100.800
XGBoost0.8020.4380.6710.4010.777
Table 4. Evaluation of the regression models in terms of RMSE, MAE, MAPE, and R2. The results of each evaluation score are averaged over 10 different experiments using repeated random train/test split. The main values represent the evaluation of the models trained on the entire dataset with the full range of LOS (1–21 days), while the values in parentheses represent the metrics for the models considering data with only actual short stays, i.e., LOSs between 1 and 4 days.
MethodRMSEMAEMAPER2
Linear regression2.89 (0.77)1.92 (0.64)70.65 (35.17)0.19 (0.28)
SVM2.91 (0.78)1.68 (0.61)48.37 (31.27)0.23 (0.32)
Random forest2.81 (0.75)1.87 (0.62)69.56 (34.54)0.24 (0.35)
XGBoost3.00 (0.83)1.99 (0.66)72.07 (36.35)0.19 (0.24)
Table 5. Confusion matrices for random forest (the main values) and XGBoost (the values in parentheses) classifiers used prior to regression. Note that these classifiers, given by the maximum G-mean, partition the entire dataset into short/long stays. The predicted short stays are then used for stepwise regression.
Predicted Long StaysPredicted Short Stays
Actual Long Stays9108 (9007)516 (617)
Actual Short Stays2469 (1873)29,380 (29,976)
Table 6. Evaluation of the stepwise regression in terms of RMSE, MAE, MAPE, and R². The results of each evaluation score are averaged over 10 different experiments using the repeated random train/test split. The regression models were trained on data with LOS initially predicted to be short (1–4 days) by a classification model. The regression results here are obtained using random forest (the main values) and XGBoost (the values in parentheses) as the prior classifiers.
MethodRMSEMAEMAPER2
Linear regression1.07 (1.14)0.74 (0.76)38.87 (39.53)0.20 (0.22)
SVM1.10 (1.16)0.71 (0.73)33.11 (33.49)0.23 (0.24)
Random forest1.07 (1.13)0.74 (0.76)39.29 (39.94)0.23 (0.25)
XGBoost1.17 (1.23)0.81 (0.83)41.68 (42.32)0.16 (0.18)
Disclaimer/Publisher’s Note: The statements, opinions and data contained in all publications are solely those of the individual author(s) and contributor(s) and not of MDPI and/or the editor(s). MDPI and/or the editor(s) disclaim responsibility for any injury to people or property resulting from any ideas, methods, instructions or products referred to in the content.

