Article

Optimization of Rollover Crashworthiness and Vehicle Mass Based on Unreplicated Saturated Factorial Design

1
School of Mechanical and Electronic Engineering, Wuhan University of Technology, Wuhan 430070, China
2
Technical Development Center, SAIC-GM-Wuling Automobile Company Limited, Liuzhou 540057, China
*
Author to whom correspondence should be addressed.
Appl. Sci. 2023, 13(12), 6963; https://doi.org/10.3390/app13126963
Submission received: 7 May 2023 / Revised: 24 May 2023 / Accepted: 7 June 2023 / Published: 9 June 2023

Abstract

:
In the realm of van design, researchers have been diligently working to enhance rollover crashworthiness while concurrently achieving lightweight body structures. Unlike front and side impacts, rollover crashworthiness is impacted by a greater number of structural dimensions and material parameters. As such, this paper implements an unreplicated saturated factorial design to conduct factor screening for vehicle rollover crashworthiness. This approach effectively and accurately resolves the screening challenges that arise from large numbers of factors, and eliminates dependence on traditional design experience. Consequently, it shortens the design cycle and reduces development costs. In addition, this paper establishes four Kriging approximate models that describe the specific energy absorption and total mass of the key body structure, the displacement of the roof, and the maximum angular velocity of the body’s center of mass. To address the multi-objective optimization problem of improving rollover crashworthiness while reducing mass, this paper combines the particle swarm optimization algorithm with the artificial immune algorithm. This hybrid algorithm converges rapidly, and the Pareto solution set exhibits superior uniformity and diversity. Finally, the shortest distance method is employed to identify the optimal design scheme that can enhance the rollover crashworthiness of vans and reduce the mass of body parts.

1. Introduction

Rollover collision is the most serious collision mode in traffic accidents. According to the National Highway Traffic Safety Administration (NHTSA), the death toll of rollover accidents in the United States accounted for 29.8% [1] in 2020. Due to their one-sided structure, vans have a higher center of mass and rollover rate than cars. Moreover, vans often carry more people, and their rollover accidents show the characteristics of mass casualties [2]. Although rollover accidents account for a relatively low proportion of car accidents, the death toll accounts for a relatively large proportion. Therefore, improving the passive safety of vans has become an important research topic [3]. Additionally, vehicle lightweighting can effectively save fuel consumption and reduce carbon dioxide emissions [4]. Therefore, balancing rollover crashworthiness and vehicle mass optimization of vans becomes critical.
In recent years, researchers have conducted extensive research on the simultaneous improvement of crashworthiness and weight reduction of vehicles. Cui et al. [5] proposed a new material performance index for the crashworthiness design of thin-walled structural parts to guide the selection of multi-material automotive body materials, improve the front crashworthiness, and reduce the body mass by 30.9 kg. Kiani et al. [6] used five different optimization algorithms to solve the mass minimization problem in the front impact, side impact, and side impact scenarios, successfully reducing the vehicle mass while improving the crashworthiness and NVH attributes of the vehicle. Wang et al. [7] carried out multi-objective optimization on the body thickness as well as the beam section shape and size. They also modified the structure with implicit parameterization technology, which reduced the total body mass by 32.41 kg, while the passive safety performance in frontal and side impact scenarios was almost unchanged. Lee et al. [8] proposed a collision optimization method that simultaneously considered side impact tests and roof extrusion tests. Topological optimization was used to design the B-pillar stiffener, which reduced the body mass while meeting the crashworthiness requirements. Belingardi et al. [9] and others applied composite materials to the bumper system to achieve lightweighting while ensuring the crashworthiness of the vehicle. Wang et al. [10] developed a control strategy for wire-controlled auxiliary braking based on body-attitude detection and the overall design of the system, achieving automatic speed reduction.
The above research mainly focused on frontal, side, and side impacts, and few studies have been conducted on rollover collisions. Compared with front and side crashes, which usually end within 200 milliseconds, a rollover crash may last more than one second, involving multiple crashes and a large number of body parts, which greatly increases the complexity of the research [11]. A rollover accident refers to an accident in which a vehicle turns over more than 90 degrees on its transverse longitudinal axis. Rollover collision can be divided into two categories: tripping rollover and non-tripping rollover [12]. Tripping rollover is more common, and this paper studies single-vehicle rollover accidents.
Due to the complexity of vehicle rollover collisions, crashworthiness is influenced by different potential factors, and factor screening of multivariable crashworthiness and the weight optimization process is particularly important. Factor screening in the optimization process can improve the development efficiency and save time and development costs. Craig et al. [13] proposed a factor screening method based on the response surface method, which uses D-optimal design for sampling and variance analysis to determine coefficients and confidence intervals. This method can be applied to full frontal collisions, but the operation process is complex. Hou et al. [14,15] applied the unreplicated saturated factorial design to the screening of multivariable crashworthiness design factors in the case of side impact to the vehicle body, proving the rationality of this method for screening the active factors involved in front and side impacts. Jin et al. [16] applied linear contribution analysis based on data statistics to the screening problem of multivariable crashworthiness design factors in SUV rollover crashes, selecting six factors with the highest contribution rates from 13 variables for parameter optimization. It is noteworthy that the relationship between variables and rollover crashworthiness is nonlinear.
Although the factor screening method has been used by many researchers in frontal and side vehicle impacts, the vehicle rollover impact problem involves a large number of parts of the entire vehicle. Currently, designers still rely on experience, and the number of effective factors screened in empirical design is few. How to carry out accurate and efficient factor screening to obtain better vehicle rollover crashworthiness is still a challenging problem. Therefore, this paper aims to solve the problem of factor screening in the process of multivariable crashworthiness and weight optimization design of vans under rollover impact, and to shorten the design cycle. This paper is organized as follows: In Section 2, the finite element model of the van is established and verified. Then, the definitions of statistical model, Kriging approximation model, and multi-objective optimization problem for unreplicated saturated factorial design are introduced. In Section 3, six active factors are selected through three unreplicated saturated factorial design methods, and the KRG model of the selected response is constructed using the optimal Latin hypercube design (OLHD) method. A hybrid optimization algorithm combining particle swarm optimization and artificial immune algorithm is applied to obtain Pareto solution sets with higher uniformity, diversity, and precision, realizing the crashworthiness and weight optimization of vans. Finally, the full text is summarized in Section 4.

2. Materials and Methods

2.1. Van Rollover Test and Model

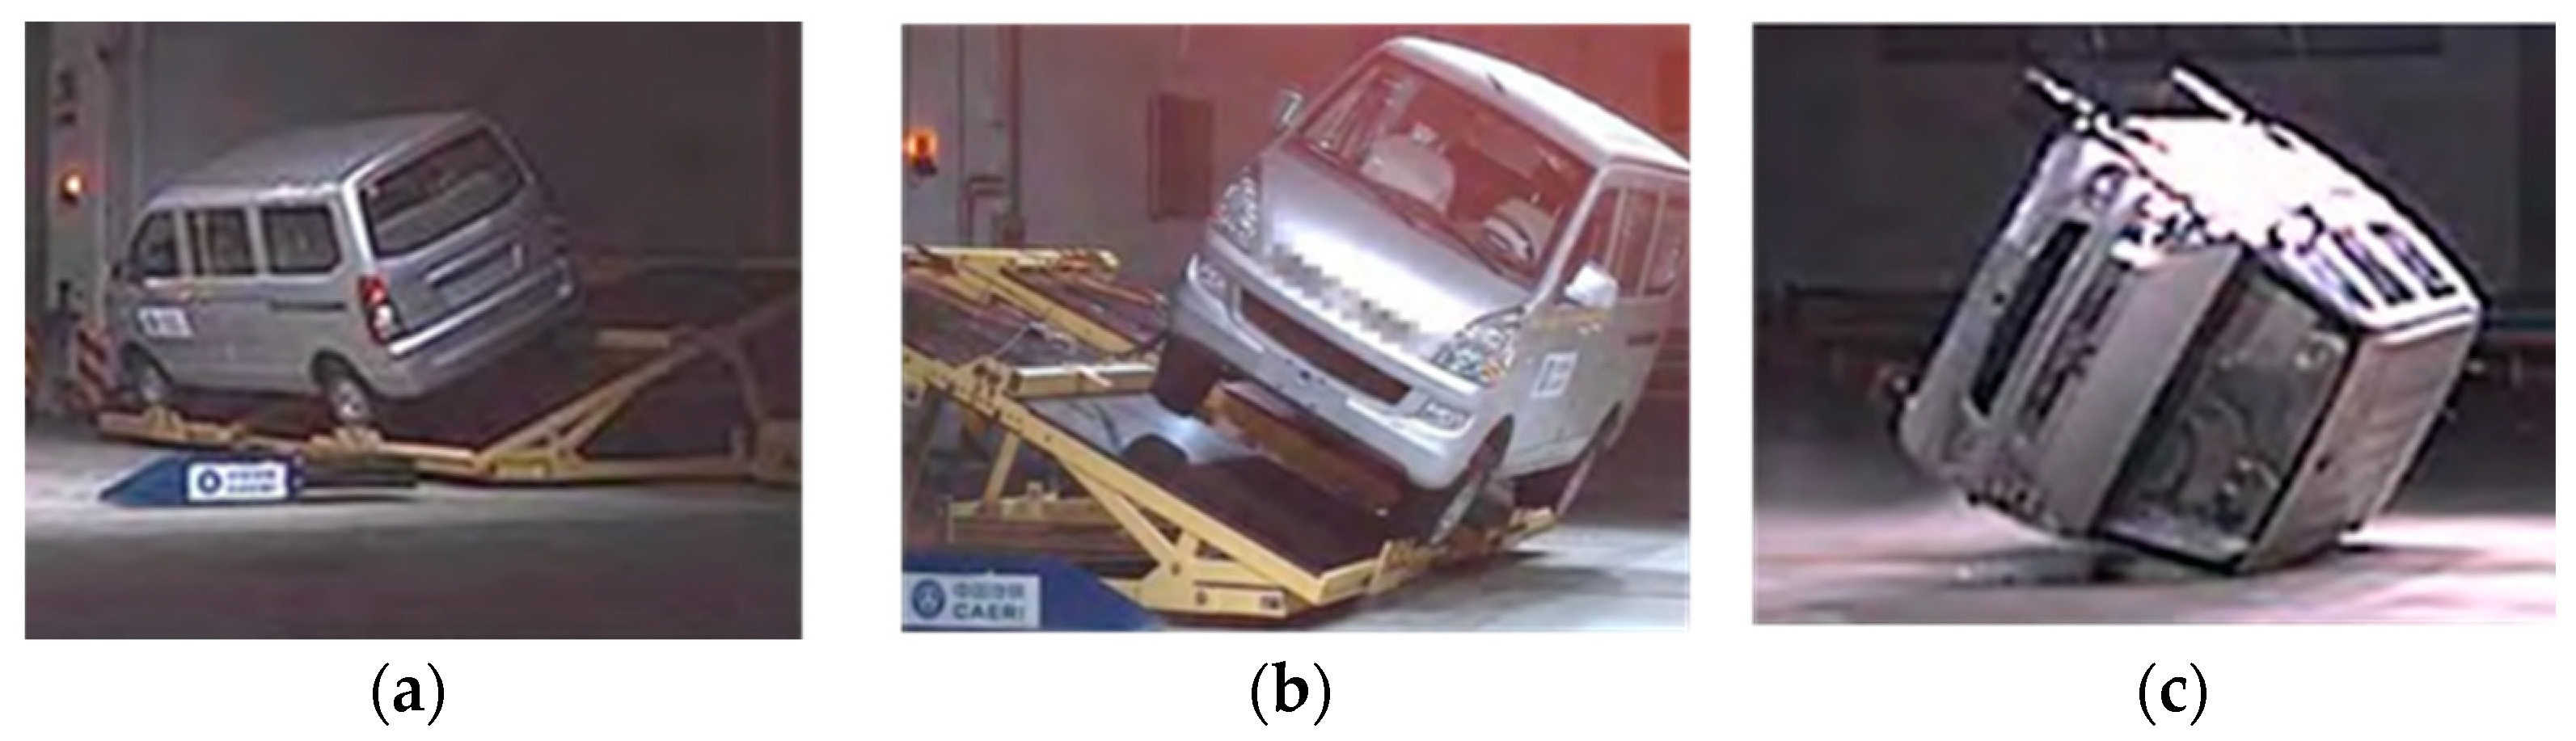
2.1.1. Platform Rollover Test

This test was conducted in accordance with the FMVSS 208 [17] regulation, which adopted a driver-side-first landing case. The main objective of the test was to evaluate whether the top structure of the vehicle had sufficient strength to ensure the integrity of the vehicle’s living space after an accident. The test also aimed to reproduce vehicle rollover accidents caused by physical inertia due to sudden braking, emergency lane change, or impact with a curb during driving.
Before conducting the test, the vehicle was prepared by marking the deformation points of key structures, such as A, B, and C pillars and door deformation points. The whole vehicle was counterweighted to ensure that the moment of inertia was consistent with the set value. Accelerometers were placed to benchmark subsequent simulations, and the chassis was painted to observe the movement attitude of chassis parts during the test. A test bench and ultra-high-speed camera were used to determine the rolling attitude of the vehicle and to record the entire dynamic rolling process.
The test process was divided into three stages. First, the test bench was accelerated to ensure that the instantaneous speed of the test vehicle at the moment of overturning reached 48 km/h. Second, the test bench braked and deceleration of the test bench occurred after impact, with the energy absorber reaching 20 g, and this lasted for at least 40 ms. Finally, the vehicle rolled over. The test bench decelerated and the test vehicle continued to move forward due to inertia, resulting in rollover. The platform rollover test process is shown in Figure 1.
In the event of a rollover accident, the roof structure of the van is critical to minimizing passenger injuries. Therefore, dynamic testing procedures are optimized, taking into account the FMVSS 216 [18] regulations that supplement static testing requirements, specifically the compressive strength of the test vehicle’s roof. The test method specified in FMVSS 216 is depicted in Figure 2, with results requiring that the roof intrusion not exceed 127 mm.

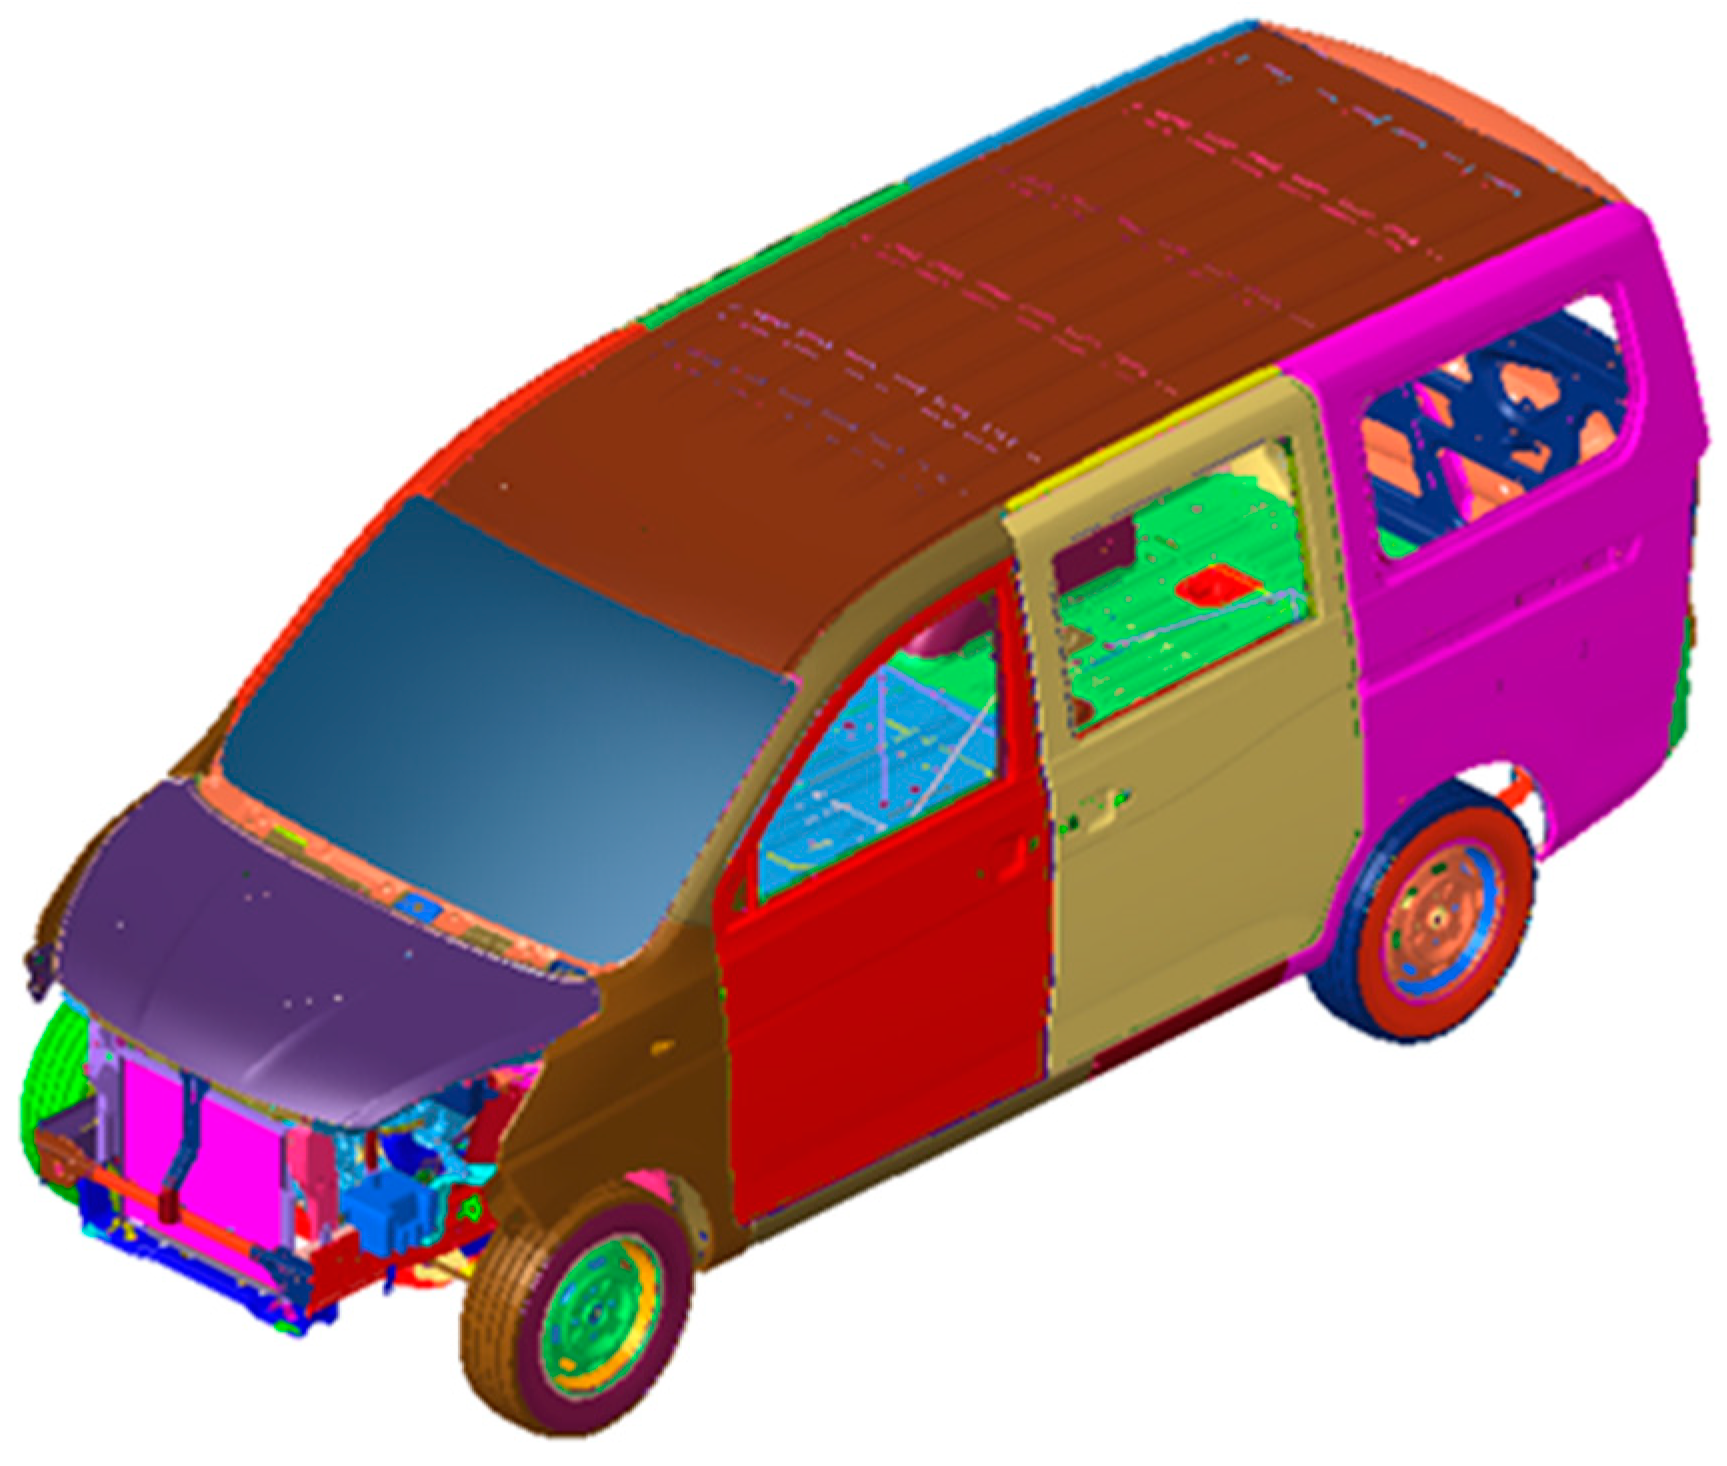
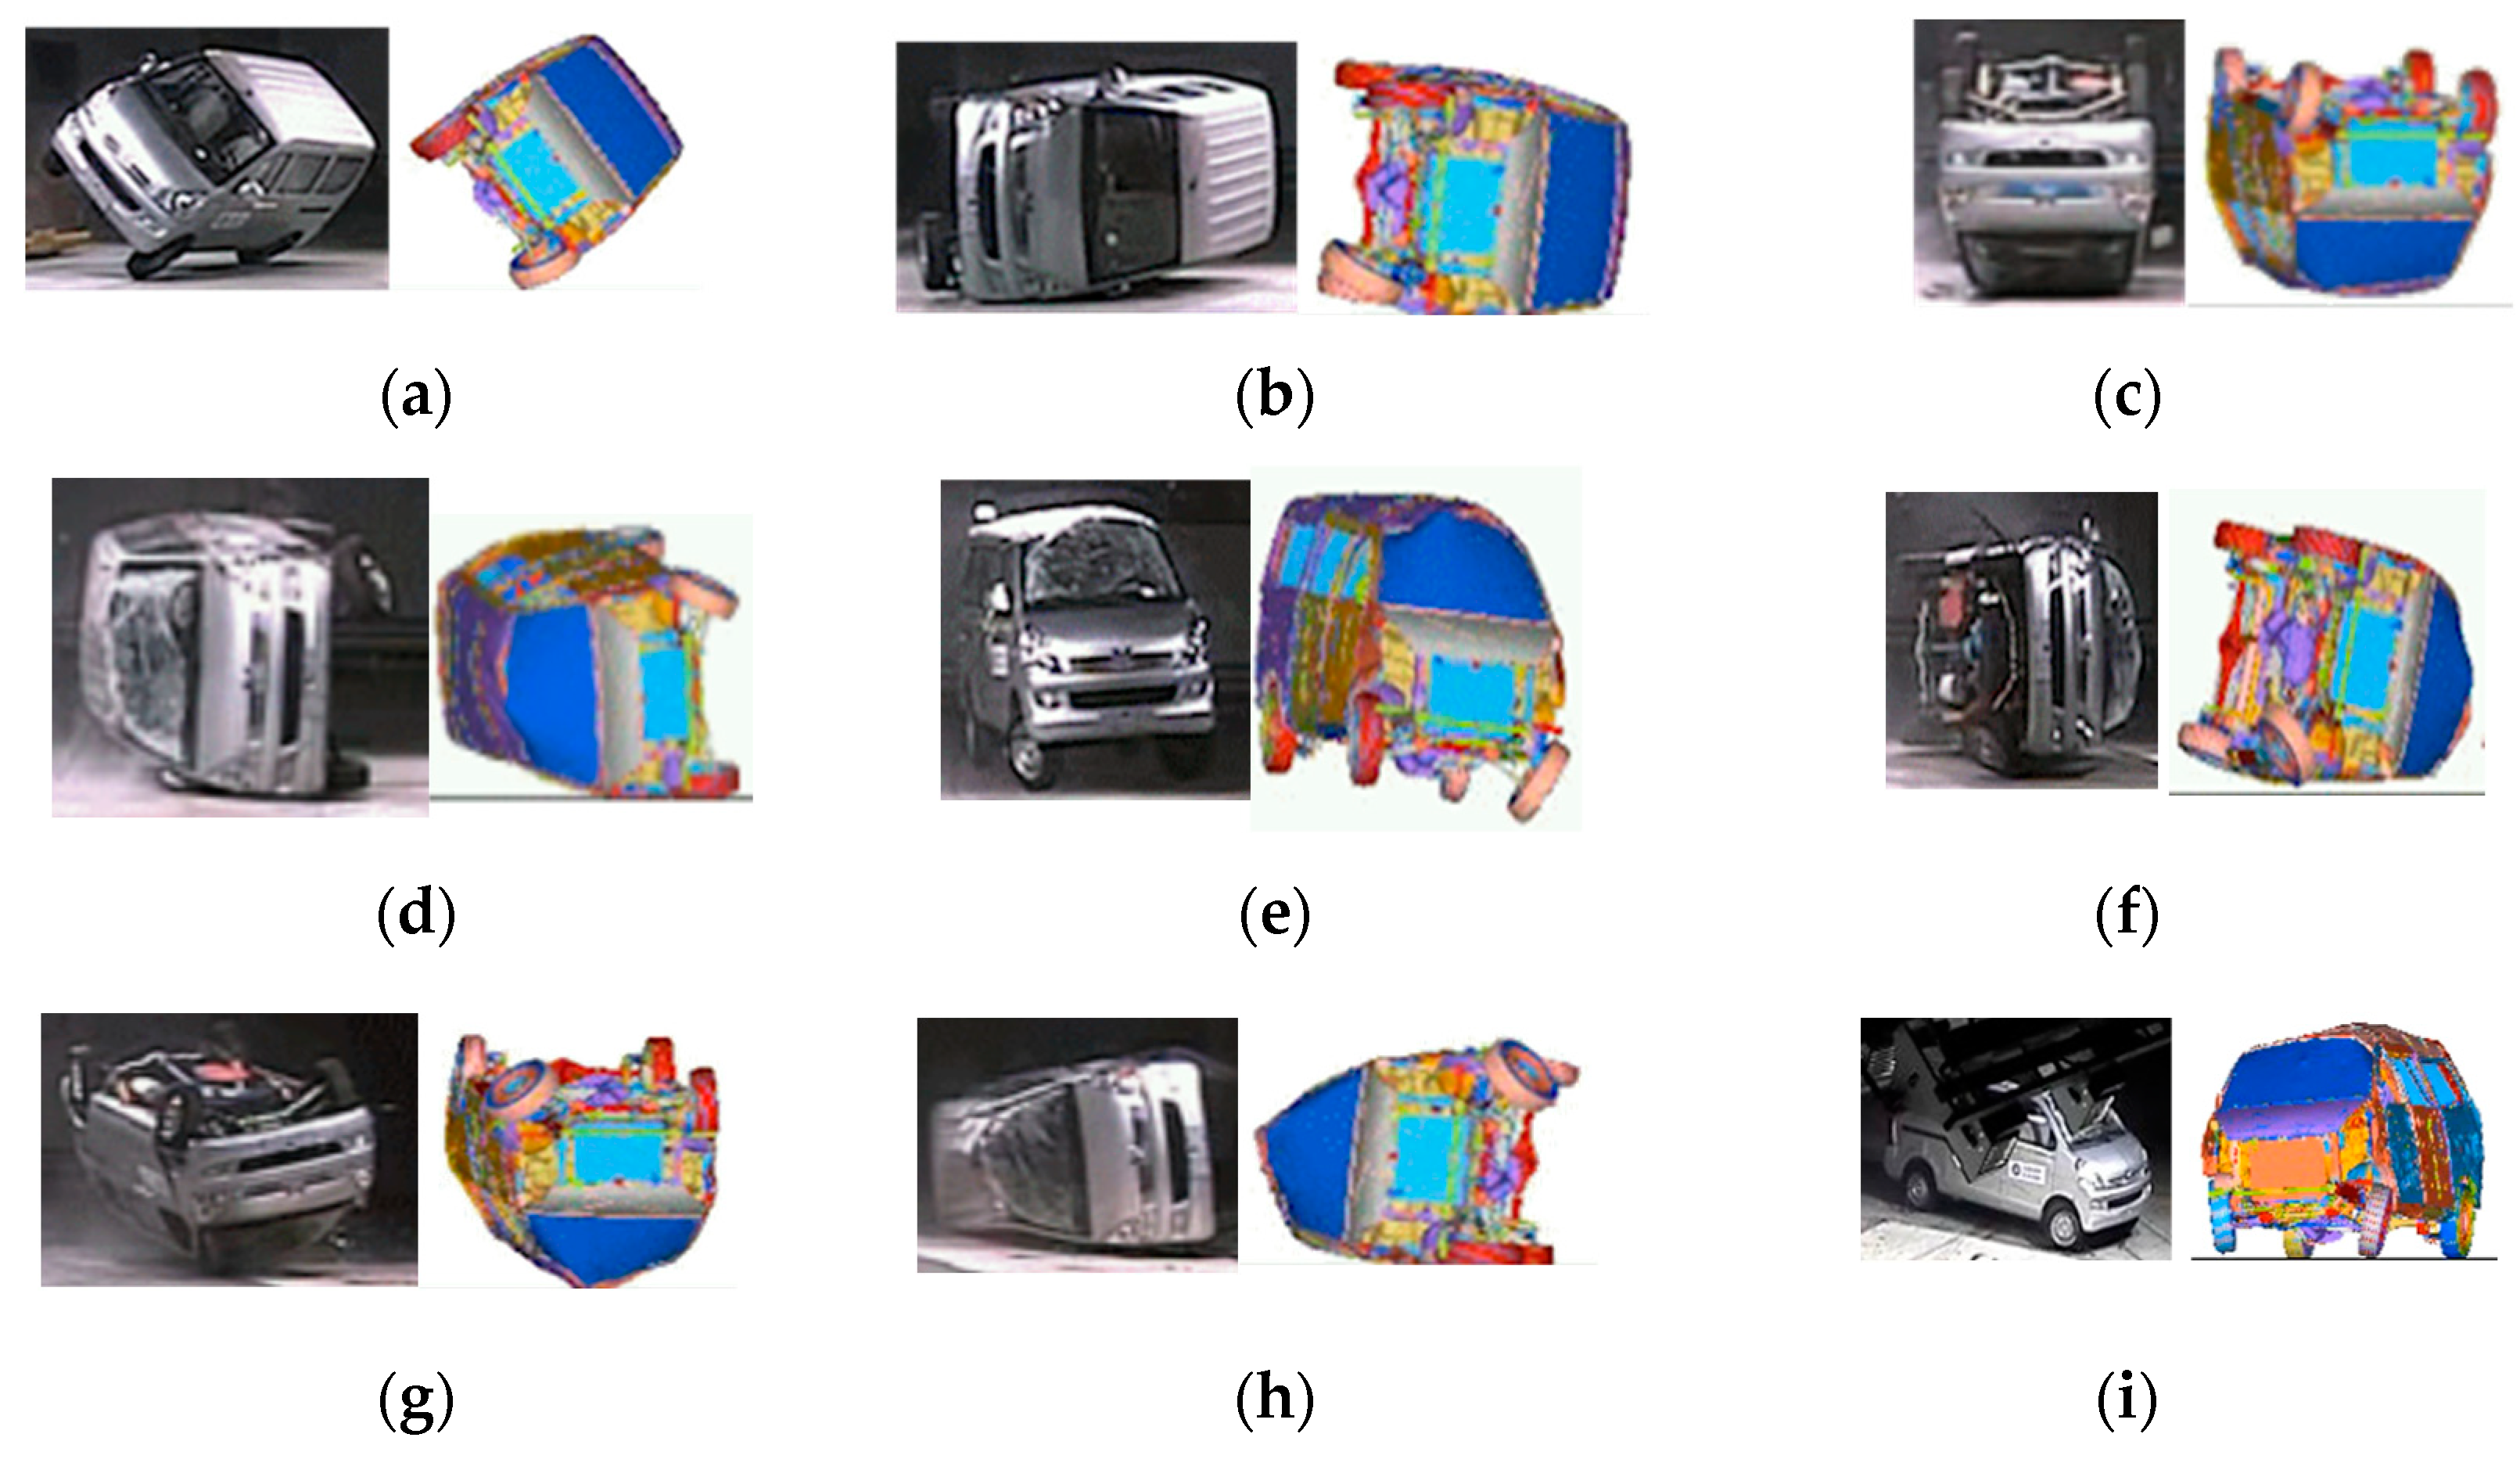
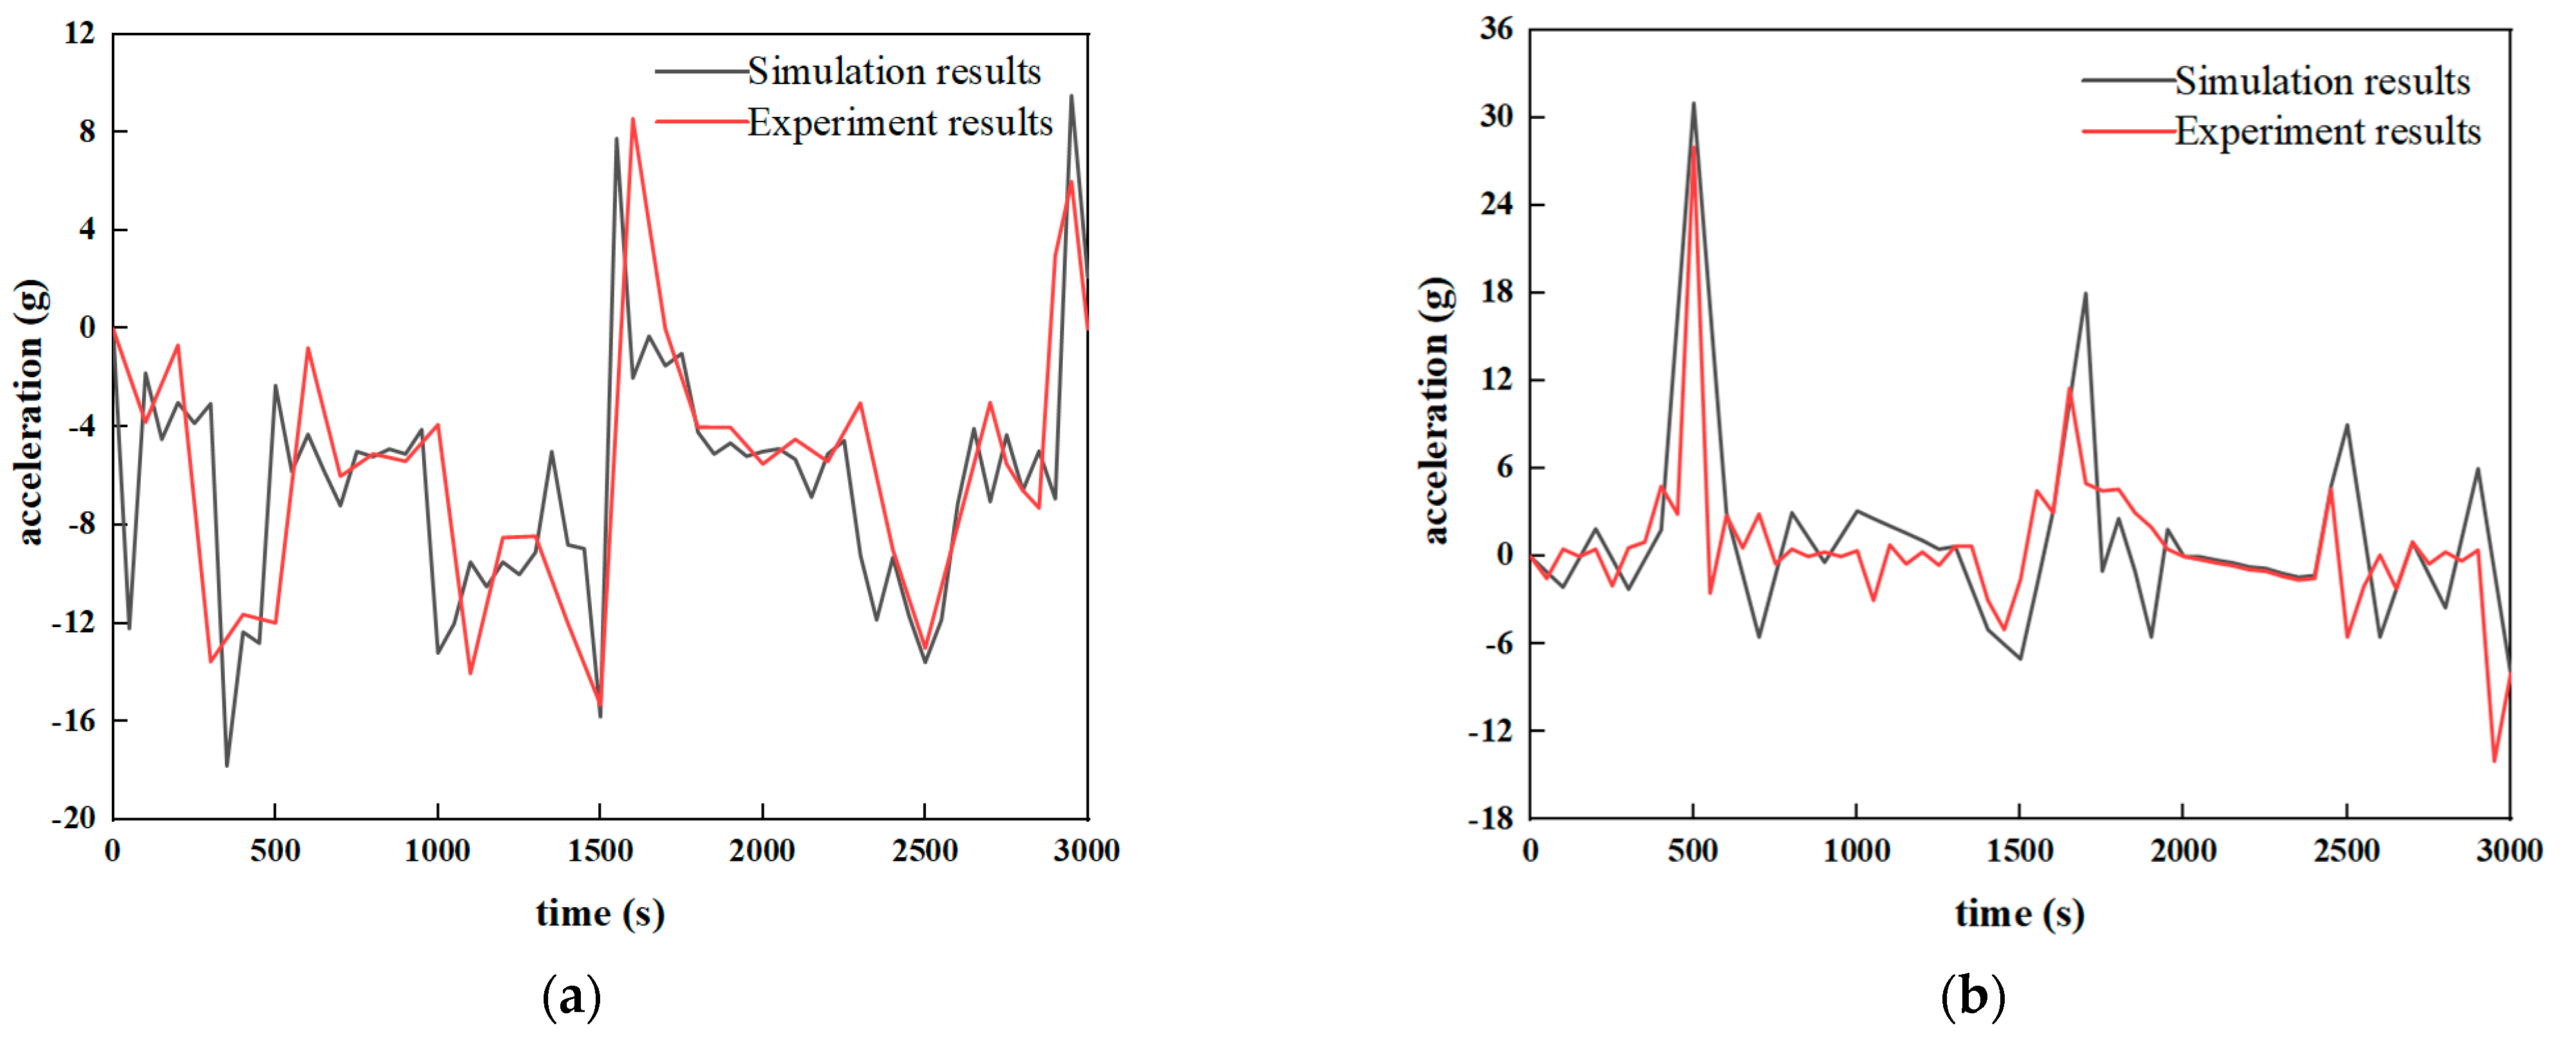
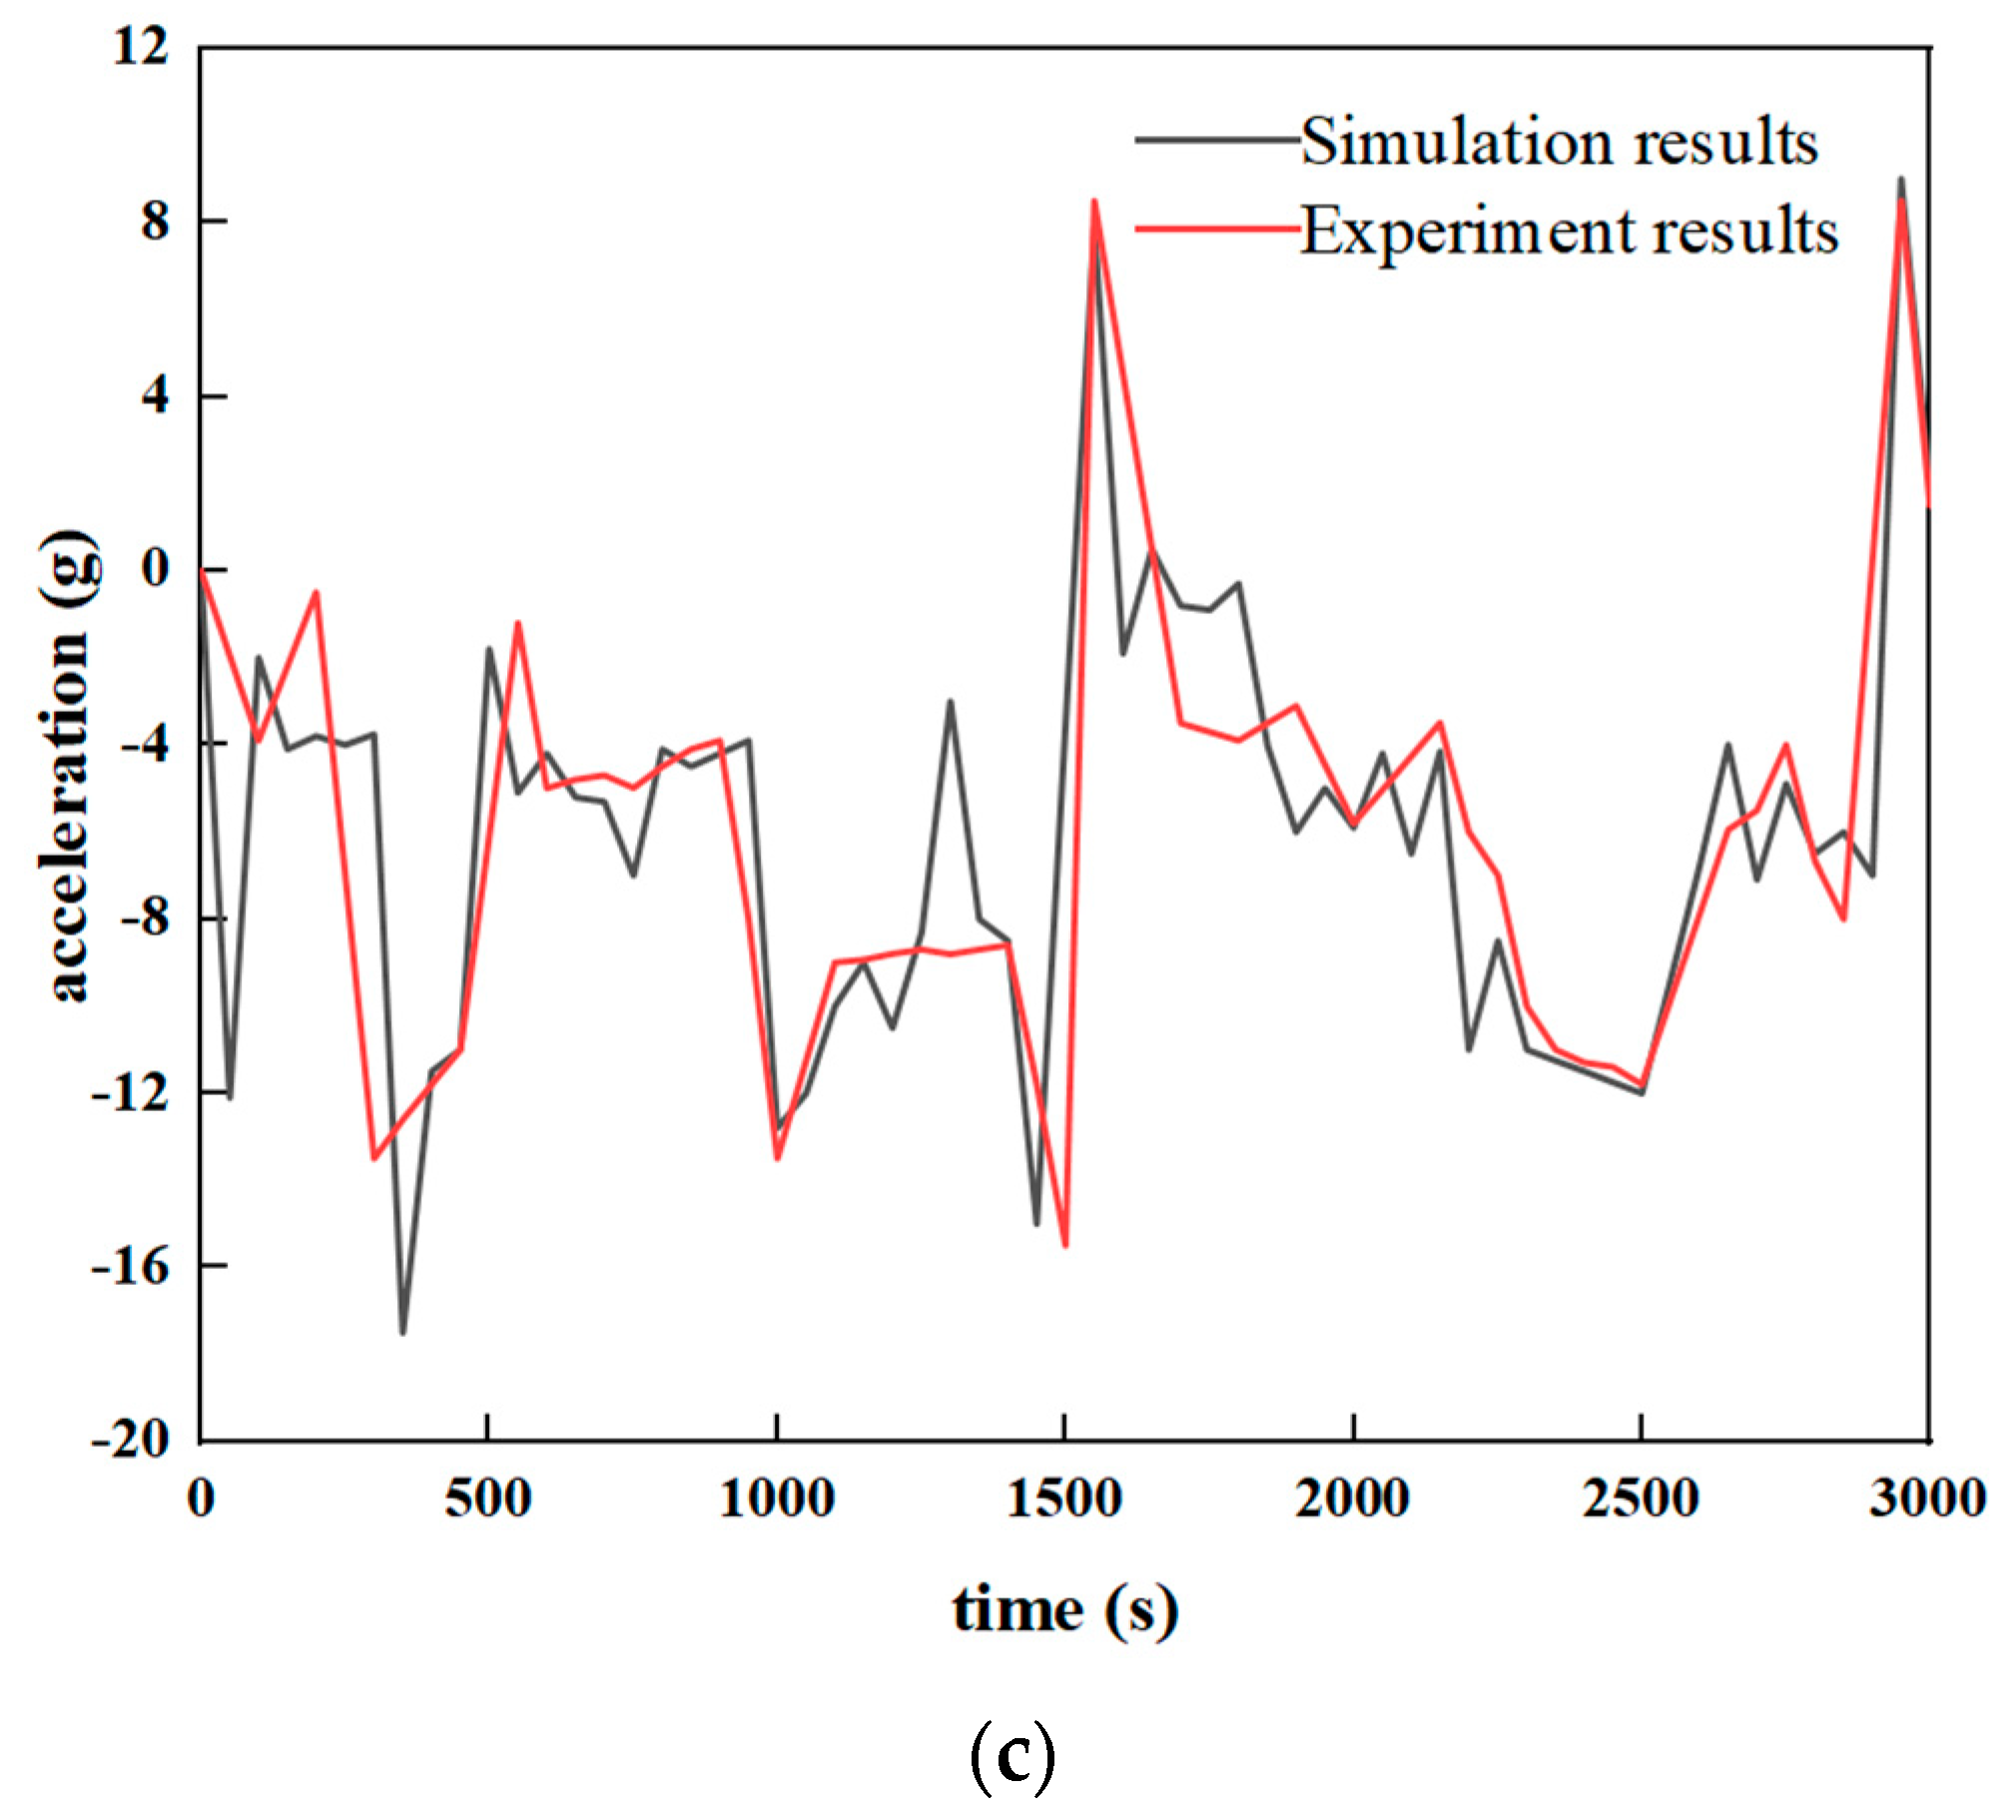
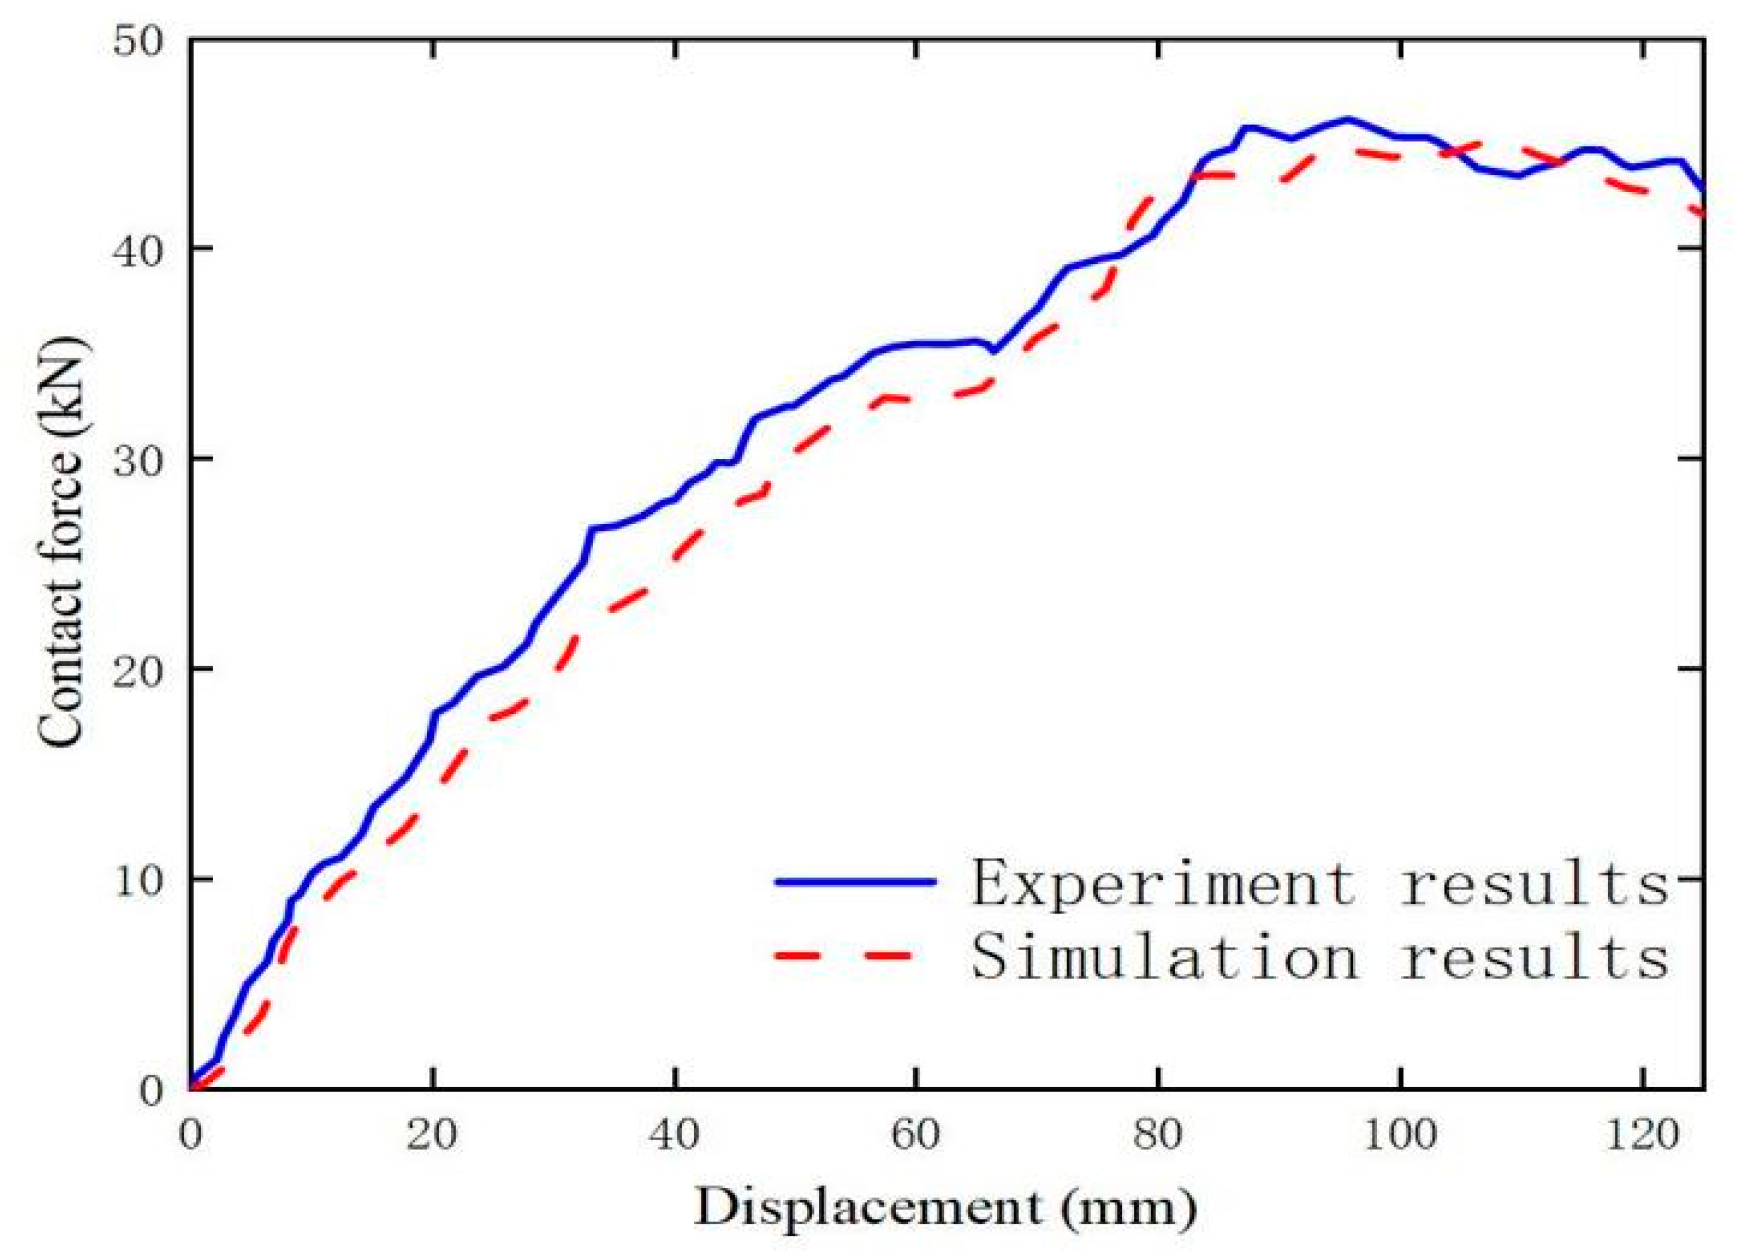
2.1.2. Establishment and Verification of the Van Rollover Model

The causes and conditions of rollover accidents vary greatly, and due to the high cost and lengthy cycle of platform rollover tests, this study developed a finite element model of a van for simulation analysis. The finite element model of the van is depicted in Figure 3. It comprised 743 components, including 993,356 elements and 1,042,370 nodes. According to FMVSS208 regulations, the van’s rolling condition platforms were established and the following parameters were set.
(1)
Two rigid floors and one rigid baffle were established. The tire material was set to Ogden hyper-elastic material. The car model was tilted around its vertical axis by 23°, and the baffle height was set to 0.1016 m. The lowest point of the tire was 0.2286 m away from the rigid floor, and the tire was in close contact with the rigid baffle.
(2)
Load setting: The velocity along the negative direction of the Y-axis was 13.33 m/s, and the gravitational acceleration was set to 9.8 m/s2.
(3)
Contact settings: In order to be closer to the experimental conditions, the tire was in contact with the stop surface and with the rigid ground on one surface; the vehicle body (except for the tire) was in contact with the rigid ground on two surfaces; and the vehicle was in self-contact.
(4)
Friction coefficient setting: The friction coefficient between the tire and the baffle was set to 0.2, the friction coefficient between the tire and the rigid ground 1 was 0.75, and the friction coefficient between the vehicle body (excluding the tire) and the rigid ground 2 was 0.4.
LS-DYNA was utilized to analyze the finite element model of the van, and the model was validated from three perspectives: key motion state benchmarking, acceleration benchmarking, and roof load displacement curve benchmarking.
The instant at which the test vehicle and the test bench began to move relative to each other was defined as t0 (measured in ms). The following key movement states were determined: rolling 1/4-week, 1/2-week, 3/4-week, 1-week, 5/4-week, 3/2-week, 7/4-week, and 2-weeks. The time errors for each movement state were as follows: 0.4%, −0.5%, −0.8%, 0.4%, 0.5%, 0.4%, 1.7%, 2.2%, and 2.4%, respectively. Figure 4 illustrates a comparison of the key motion states of the test (left) and simulation (right), which reveals that the motion attitude deviation between the test and simulation results was minimal.
In Figure 5, a comparison of the acceleration rates at the vehicle centroid in the test and in the simulation reveals that the trend of the three-way acceleration curve in both cases was essentially consistent, with peak values at each moment of ground impact. The level of fit was high, and although the peak values differed slightly, they fell within an acceptable range of ±5%.
Figure 6 depicts a comparison between the FE model calculation results of the van under top pressure test conditions and the corresponding test results. It can be observed that the FE model load displacement curve of the van aligns well with the test results, indicating the high reliability of the model. These three test benchmarks validate the efficacy of the FE model of the van in research on crashworthiness and weight optimization.

2.2. Unreplicated Saturated Factorial Design

In the initial stage of developing new products and improving product design, or in the production process (i.e., screening stage), people often use experiments based on factorial design to determine which of a large number of possible factors has a significant impact on the research process [19]. However, due to the fact that a fully implemented factorial design requires a large number of experiments (equal to the number of factors to be examined as an index), it cannot be applied when there are many factors to be examined or when the experiment is expensive or time-consuming. As an efficient factor design method that can reduce the number of experiments, unrepetitive saturated factorial design has been applied in many research fields [20].
When analyzing the unreplicated saturated factorial design methods, the statistical model which we utilized was as follows [21]:
y = i = 0 m x i β i + ε
(1)
Y = (y1, …, yn)T is the observation vector, and n is the number of tests;
(2)
βi, i = 0, …, m, are unknown parameters to be estimated; β0 is the general average, β1, …; βm represents the effect of factor; m = n − 1;
(3)
Column vector x0 = 1n is an n-dimensional vector whose elements are all 1, and the matrix X = (x1, …, xn)T is an orthogonal design matrix;
(4)
ε = (ε1, …, εn)T is the error vector, and assumes that:
a.
εi, i = 1, …, n are mutually independent random variables with the same mean 0 and the same variance σ2;
b.
εi, i = 1, …, n obey normal distribution, namely, ε~N (0, σ2In);
c.
There are, at most, r (1 ≤ r < m) non-zero factors in m factors, that is, β1, …, βm. The maximum number of r is non-zero.
The purpose is to use n observation values y1, …, yn to judge whether there are significant m effects with a certain method. That is, for hypothesis H0: β1 = β2 = … = βm = 0, H1, not all βm in βi are zero for inspection. If H0 is rejected, there are significant factors, and these determine which factors are significant.
In a saturated design, although all n effects (including the total average) can be estimated with n observations, there is no remaining degree of freedom to estimate the error variance, so it is impossible to use standard analysis of variance (F test or t test) to test the significance of the factors. In this paper, the normal or semi-normal probability graph method [22], the Dong93 method [23], and the Lenth method [24] are used to process the data of unreplicated saturated factorial design.

2.3. KRG Approximation Model

The initial conditions of the vehicle can have a significant impact on rollover results, and it is expensive to calculate the results using FE model test parameters that quantify rollover sensitivity [25]. By constructing an approximation model to replace the simulation model, the optimization efficiency can be improved. Compared with the traditional response surface model, the Kriging approximation model can not only describe highly nonlinear processes, but also remove numerical noise and smooth the target response [26,27]. When fitting highly nonlinear problems, the KRG approximation model easily obtains ideal results [28]. It consists of a regression function and a random process, and its prediction form is:
y ^ x = q T x η + z x
where qT(x) represents the regression basis function; η is the regression coefficient; and z(x) indicates a stochastic process where the mean value is 0 and the variance is σ2. The covariance of z(x) can be used to describe the correlation between any two points in the design space, and it can be expressed as follows:
C o v z x i z x j = σ 2 R x i , x j
where R(xi, xj) refers to the correlation function between any two input variables. Its selection was pivotal in constructing the Kriging (KRG) approximation model. The Gaussian correlation function, widely used in engineering, was also adopted, as expressed by:
R x i , x j = exp θ x i x j 2
where θ represents a correlation parameter that characterizes the input–output sensitivity of the function. Given that σ2 depends on the correlation parameter, the only unknown quantity in the Kriging approximation model is the correlation parameter. Once the relevant parameters are identified, the Kriging approximation model can be constructed.

2.4. Definition of Optimization Problem

Without loss of generality, a multi-objective optimization problem with n decision variables and m objective variables can be expressed as:
min y = F x = f 1 x , f 2 x , , f n x T s . t . g i x 0 , i = 1 , 2 , , q h j x = 0 , j = 1 , 2 , , p
where x = (x1, x2, …, xn) ∊ X ⊂ Rn is the n-dimensional decision vector, X is the n-dimensional decision space, y = (y1, y2, …, yn) ∊ Y ⊂ Rm is the m-dimensional target vector, and Y is the m-dimensional target space. Objective function F(x) defines m mapping functions from the decision space to the objective space; gi(x) ≤ 0, (i = 1, 2, …, q) defines q inequality constraints; and hj(x) = 0, (j = 1, 2, …, p) defines p equality constraints.
In general, the sub-objectives of a multi-objective optimization problem are contradictory. It is impossible to achieve the optimal values of multiple sub-objectives simultaneously, but only to coordinate and compromise among them. Therefore, the solution of the multi-objective optimization problem is not unique, but exists in a set of optimal solutions consisting of many Pareto optimal solutions.
In this study, the artificial immune particle swarm optimization (AI-PSO) algorithm was used to solve the multi-objective optimization problem. In the generated Pareto solution set, the sum of the distances between each non-inferior solution and all other non-inferior solutions in all objective function spaces was calculated, and the non-inferior solution with the shortest distance was selected as the optimization solution, that is, the method achieving the shortest distance. The crashworthiness and weight optimization process, based on unreplicated saturated factorial design, is shown in Figure 7.

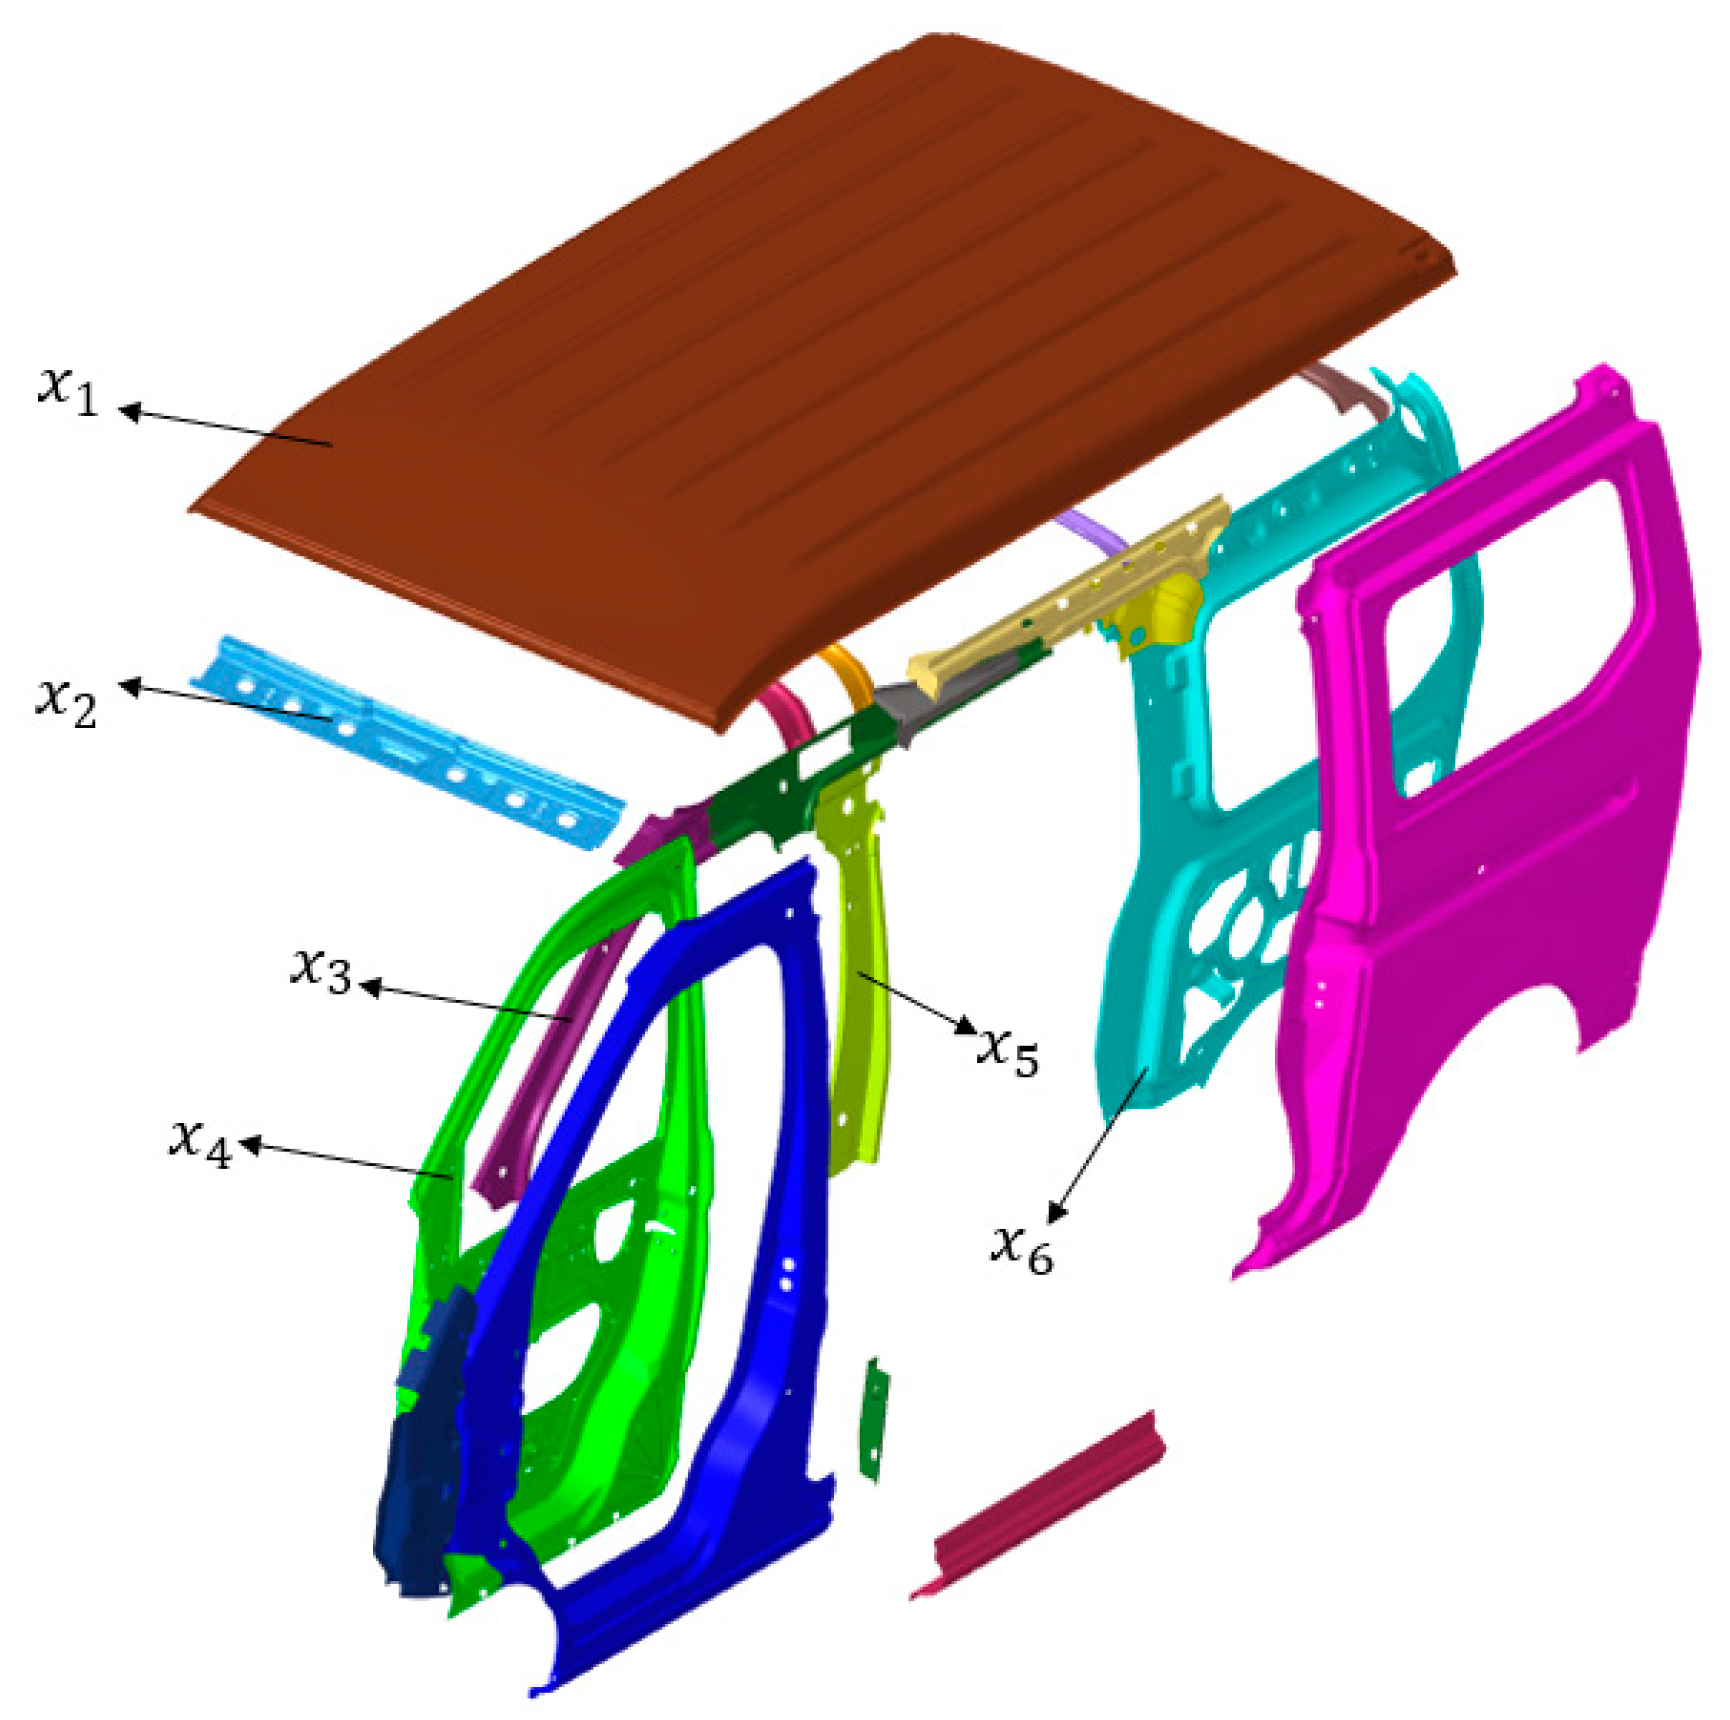
Analysis Factors and Design Objectives

Based on the results of the testing and simulation analysis, it is evident that the left and right sides of the A pillar of the vehicle, as well as the top cover, are the main areas where deformation and intrusion occur. The cross-beam structure located at the top of the vehicle serves as the primary supporting structure, and it is susceptible to bending failure and deformation during a rollover event, which can lead to encroachment on the passenger’s living space [29,30]. Therefore, the front stop cross-beam of the roof is considered to be the key structure for optimizing the crashworthiness and weight of the vehicle during a rollover event. To investigate the impact of changes in thickness on the crashworthiness of vehicles, the thicknesses of 19 body parts, including the A pillar and front bumper beam, were taken as the analysis variables in this paper. The initial thickness values are provided in Table 1, and the 19 analysis factors are depicted in Figure 8, considering symmetry.
In evaluating the crash performance of the vehicle, the relevant indicators for front and side crashes typically involve the crashworthiness and energy absorption characteristics of the structures. Hence, this paper primarily focuses on the evaluation indicators of rollover performance by considering the survival space invasion and energy absorption of structures. The displacement of the top cover serves as a measure of the invasion of the living space, which is recorded as “In”. According to FMVSS 216 regulations, the displacement of the top cover should not exceed 127 mm when the vehicle experiences a rollover event. Additionally, the average specific energy absorption (SEA) of key structures is an essential metric for evaluating the energy absorption efficiency of the whole vehicle, and, thus, its rolling performance. The higher the SEA value, the better the rolling performance of the vehicle. The calculation formula for SEA [31] is as follows:
S E A = E t M t
where the SEA is defined as the objective function for crashworthiness optimization, which is calculated by dividing the total energy (Et) by the total mass (Mt) of the corresponding structure. In this study, the maximum angular velocity of the body mass center during a rollover event (ω) and In, which serves as a measure of the invasion of the living space, are defined as constraint functions. The initial values for these 3 responses were SEA = 637.21 J/kg, ω = 4.6 rad/s, and In = 124.9 mm.

3. Results

3.1. Factor Screening

The Plackett–Burman design was utilized to conduct 20 tests on the 19 selected factors, and the specific data are presented in Table A1 (Appendix A). In this table, the values of “1” and “−1” denote the upper and lower limit values of the analysis factor, respectively. It is worth noting that the minimum thickness of the 19 parts was 0.7 mm, while the maximum thickness was 1.4 mm. Additionally, the upper limit value was 1.89 mm (1.4 × 135%), while the lower limit value was 0.455 mm (0.7 × 65%).
The response variables SEA, ω, and In in Table A1 (Appendix A) represent the observation vectors Y = (y1, …, yn)T. Considering the absence of interaction between factors, a two-level orthogonal saturated design can be assumed. Therefore, β ^ i = xi’y/xi’xi (0 ≤ i ≤ m) represents the best linear unbiased estimate (BLUE) of βi, and β ^ i is normally distributed, with an expectation of βi and a variance of τ2 = σ2/n. The following is a factor screening analysis from three aspects.

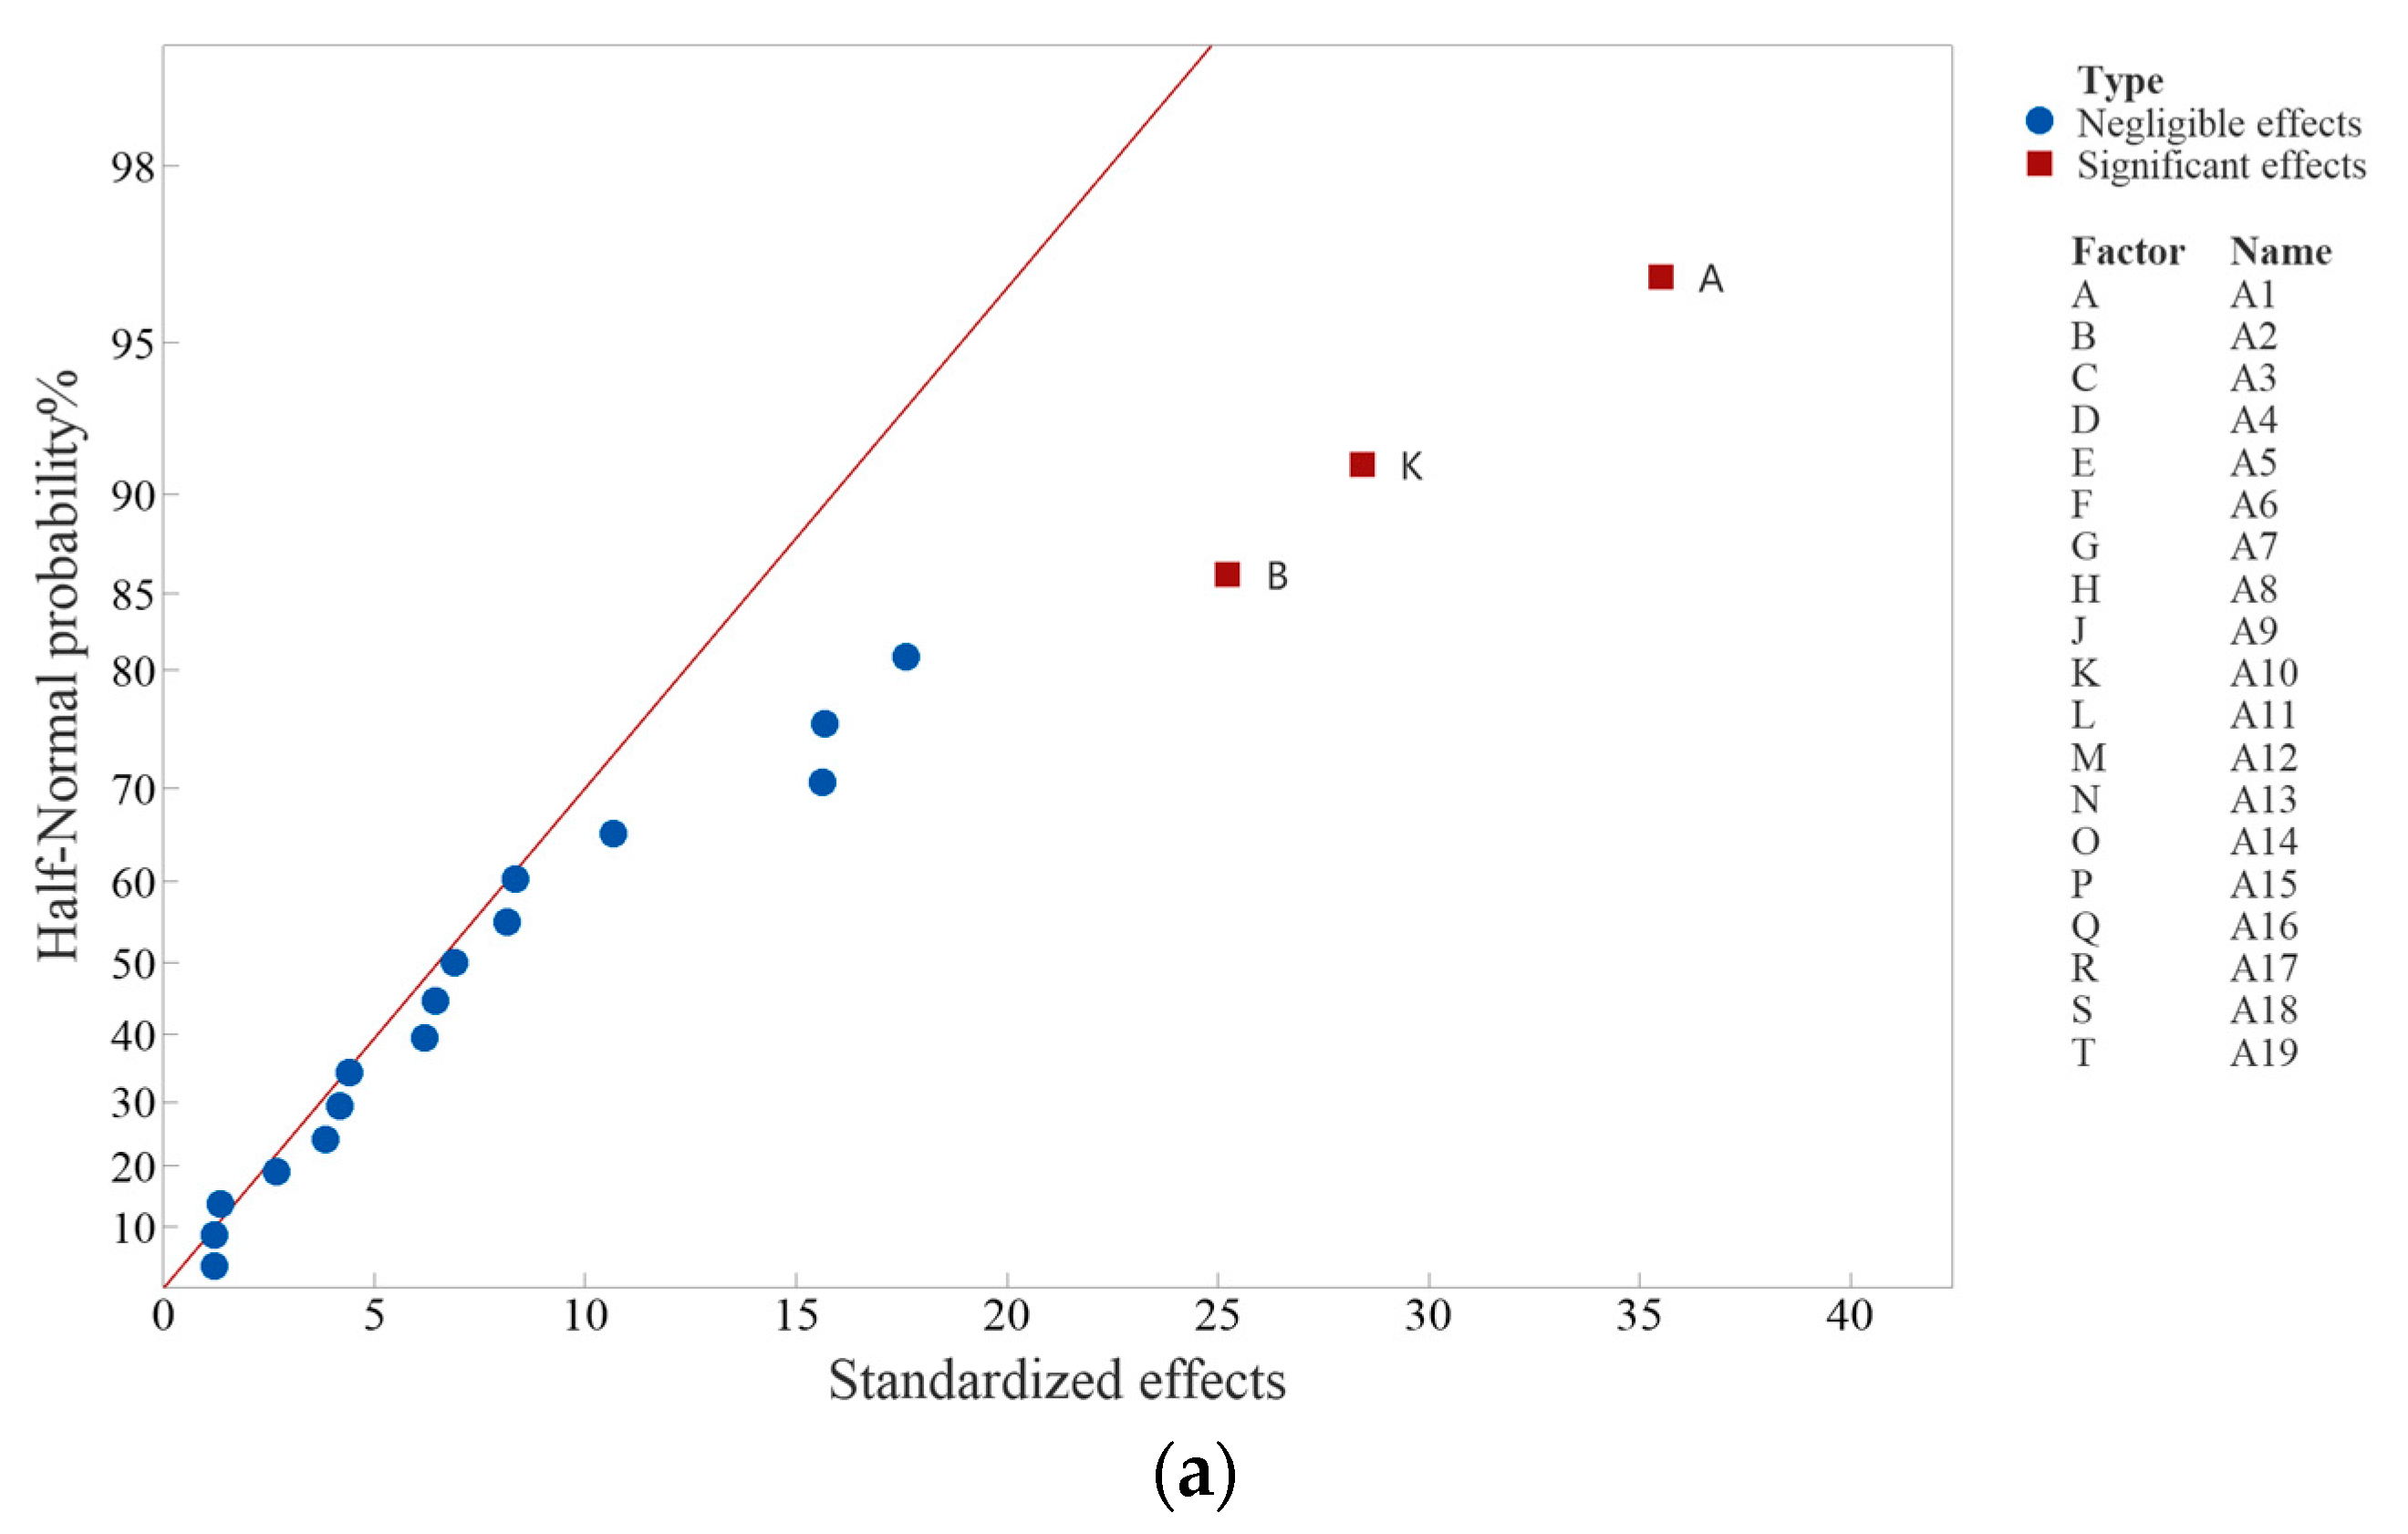
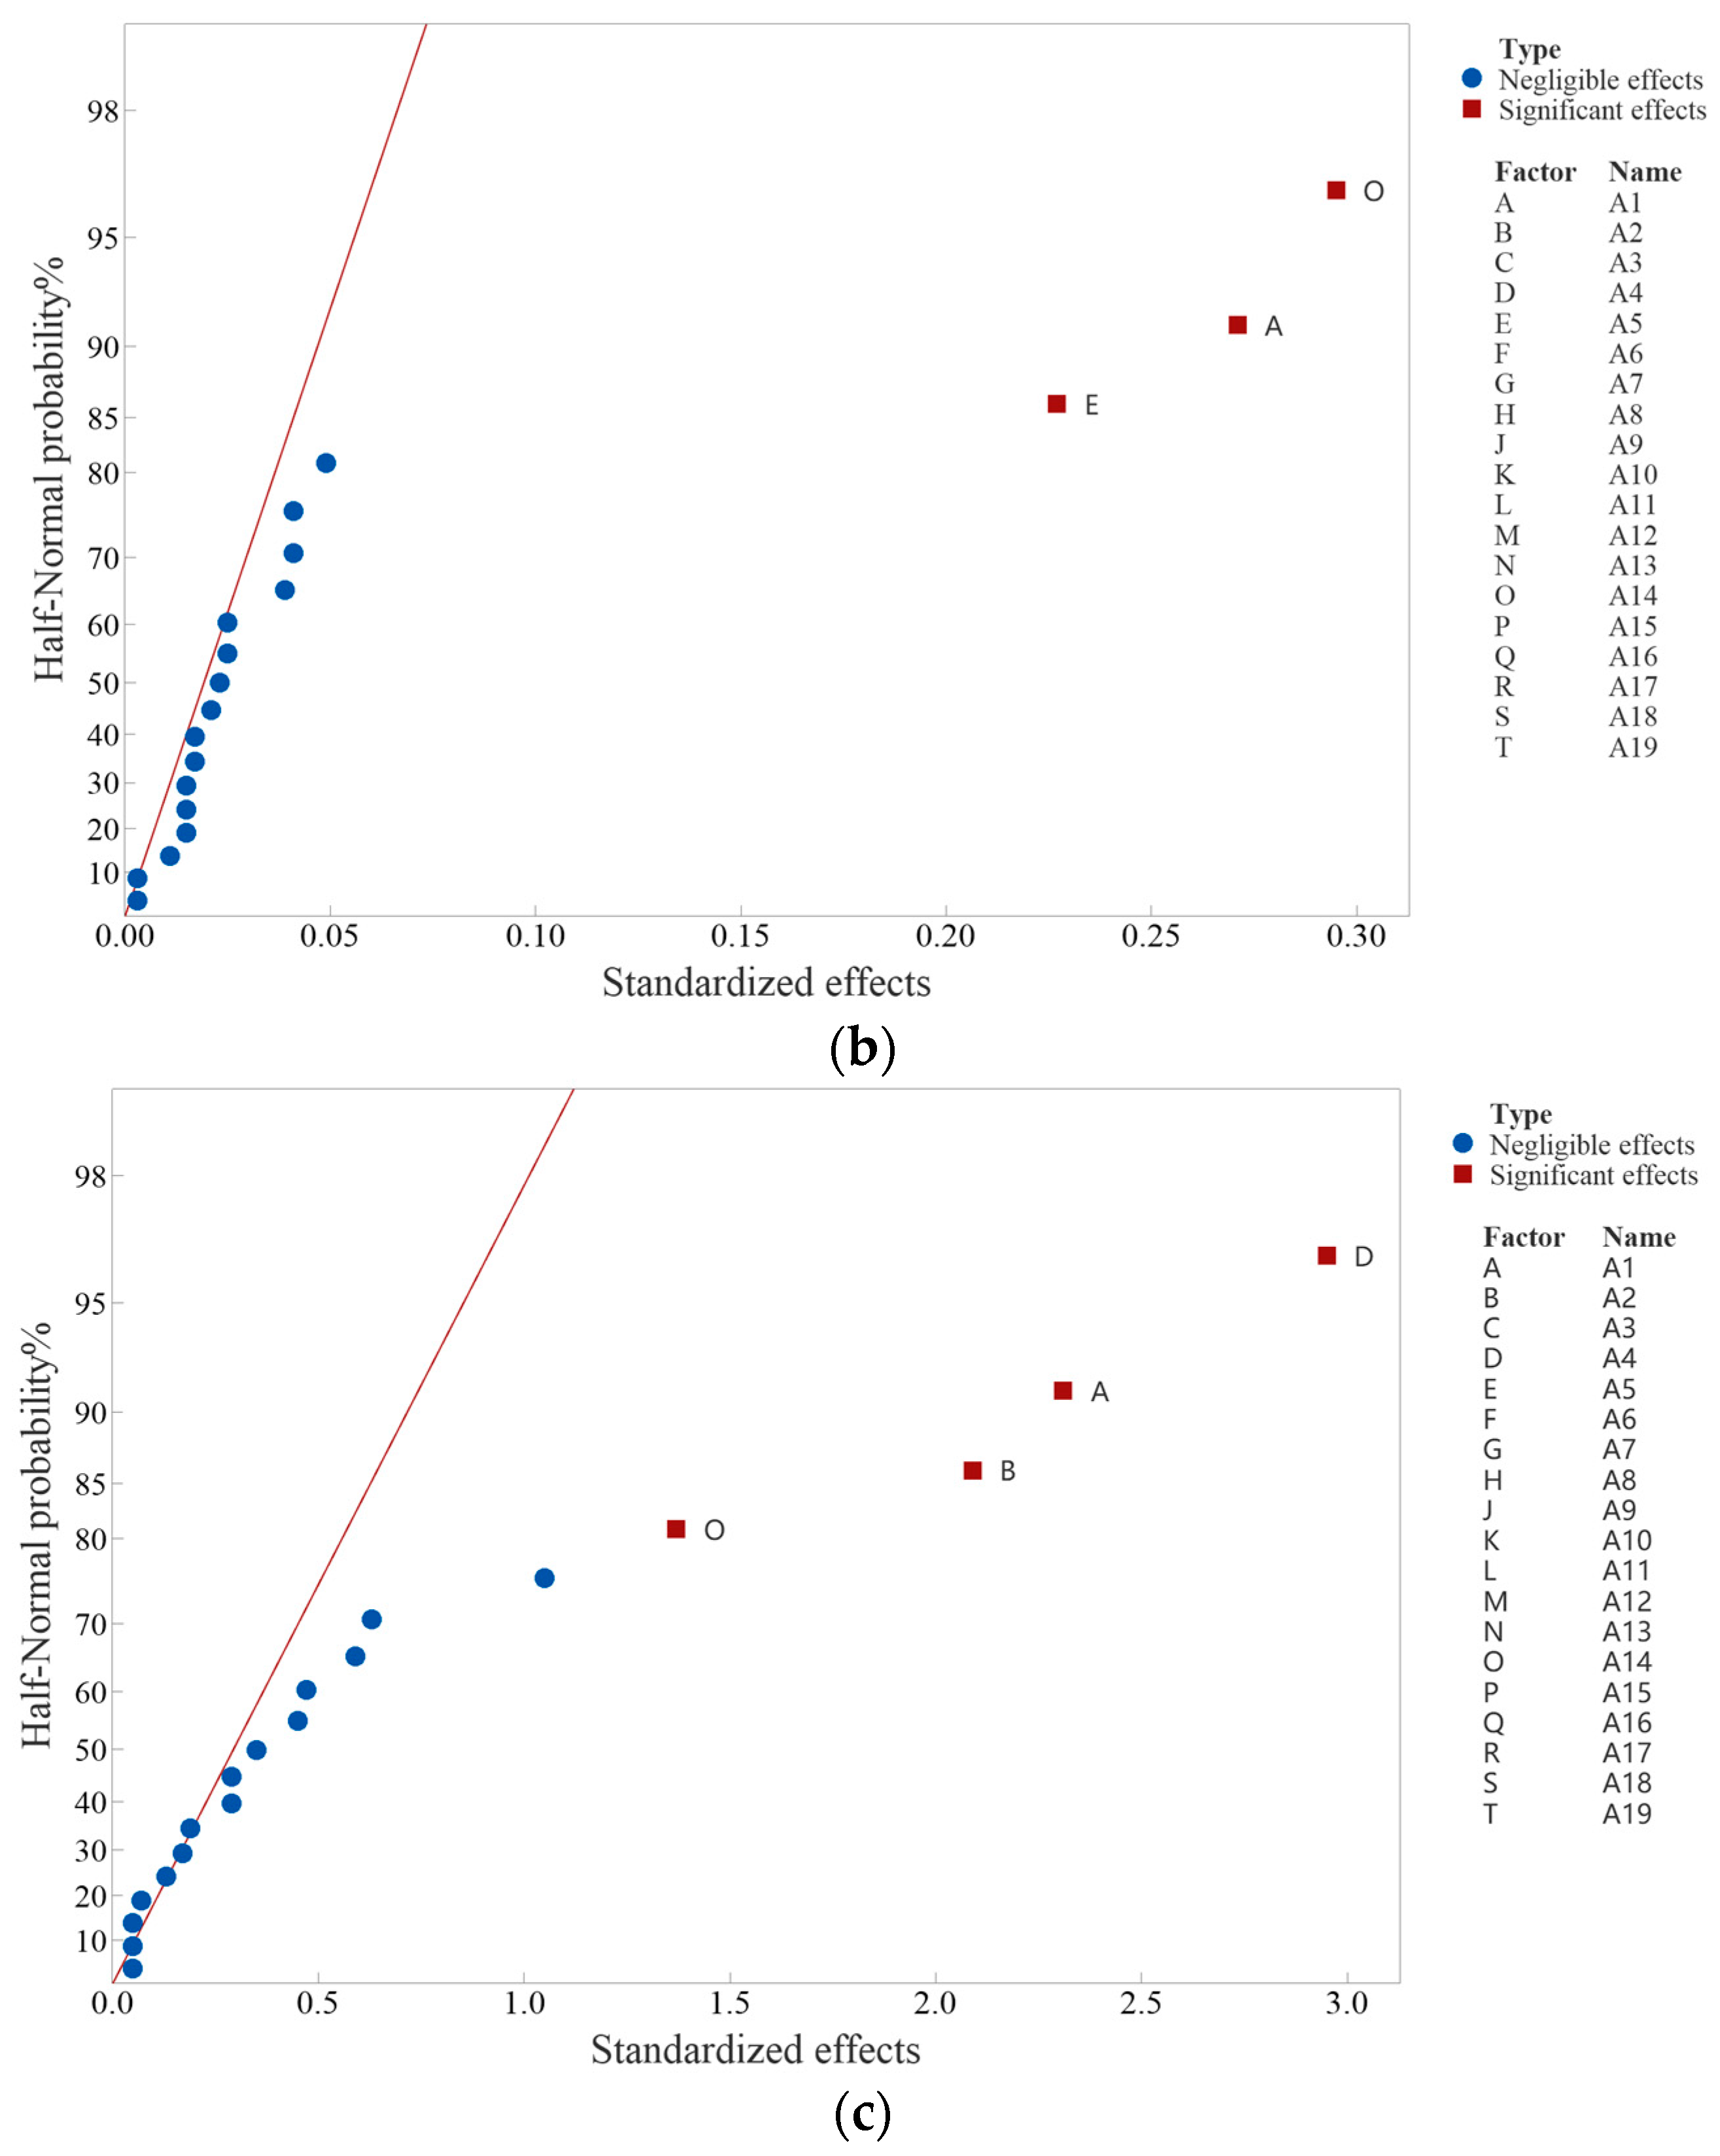
3.1.1. Semi-Normal Probability Diagram Method

The normal or semi-normal graph method is a graphical analysis approach proposed and refined by Daniel [22]. The method involves plotting the estimated effect values on a normal or semi-normal probability plot. In the plot, the points corresponding to non-significant effects should be approximately arranged in a straight line, while the points corresponding to significant effects should be far away from this straight line. This is because, assuming that the error is normal, independent, and of the same variance, the effect estimators are mutually independent. The estimator with zero effect follows the same normal distribution, with an expectation of zero. Therefore, the observed value on the (semi) normal probability plot should be located on a straight line passing through the origin. For the estimator with a non-zero effect, its expectation is non-zero, and it should deviate from the line passing through the origin.
Based on the data in Table A1 (Appendix A), the semi-normal probability plots for SEA, ω, and In are shown in Figure 9, and the factor screening results are presented in Table 2. While the graphical method has the advantage of intuition, it suffers from subjectivity. Thus, this study incorporates a numerical analysis method to assist with factor screening.

3.1.2. Lenth Method

The Lenth method is a widely used and representative direct analysis technique. This method utilizes a robust estimation of τ, known as the pseudo-standard error (PSE).
τ ^ L e n g t h = P S E = 1.5 median β ^ i < 2.5 s 0 ( β ^ i )
s 0 = 1.5 median 1 i m ( β ^ i )
A confidence limit was defined for a single comparison with 95% confidence:
M E = t 0.975 ; d × P S E
where t0.975;d is 0.975 quantile of t distribution with degree of freedom d = m/3. Additionally, another joint confidence limit was defined as:
SME = t γ , d × P S E
where γ is calculated as (1 + 0.951/m)/2. To test whether the factors beta-hat subscript i were active, β ^ i > SME was used. Based on the data in Table A1 (Appendix A), the factor screening results of the Lenth method are shown in Table A2 (Appendix A).

3.1.3. Dong93 Method

The Dong93 method is a direct analysis technique that aims to solve the problem of unreplicated saturated factorial designs, which cannot be analyzed using standard variance analysis due to the lack of an independent error variance estimate of τ. The method utilizes an estimate τ ^ of τ, which is used in the calculation of the statistics: t = β ^ i / τ ^ when conducting significance tests on the factor β ^ i . The rejection field takes the form of tr > tdf;1−α, where t r is the observed test statistic, df represents the degrees of freedom, and α is the significance level. However, due to the frequent non-independence of τ and β ^ i , the distribution of t r no longer follows an F-distribution, and its critical value is often obtained using Monte Carlo methods. To address this issue, Dong93 proposed using the adjusted standard error (ASE) to estimate τ.
τ ^ D o n g = A S E = 1 m i n a c t i v e β ^ i 2.5 S 0 β ^ i 2
where S 0 = 1.5 median 1 i m ( β ^ i ) , and minactive is the number of factors that satisfy β ^ i ≤ 2.5 S 0 . β ^ i > t γ , m i n a c t i v e × A S E can be used to test whether the factor β ^ i is active or not, γ = (1 + 0.981/m)/2.
Although the Dong93 method is a method intended for minimizing Error II [32], during the screening test phase, making Error I can result in the loss of important factors, which can significantly impact the subsequent optimization process. Therefore, this paper proposes an iterative approach to further improve the testing efficiency of the Dong93 method, as illustrated in Figure 10. By carrying out 10,000 iterations and counting the comparison results each time, the values of Error I and Error II before and after the ASE iteration were calculated based on the statistical results. The simulation results in Table 3 demonstrate that with the significance level α, the value of Error I decreased more significantly after each iteration. The factor screening results using the iterative Dong93 method are presented in Table 4. The iterative approach successfully avoided the loss error of the important factor A2 when using the Dong93 method.

3.1.4. Factor Screening Results

In unreplicated saturated factorial designs, the factor screening results obtained through numerical analysis provide objective verification of the results obtained through graphical analysis. The final screening results should be based on the semi-normal probability map [19]. For instance, taking the SEA response as an example, Table A2 (Appendix A) shows that the Lenth method indicates that there is no positive factor, suggesting that it makes Error I. However, Figure 9a shows that the actual positive factors should be A1, A2, and A10, which has also been verified by the Dong93 method after iteration. Based on the analysis, six positive factors were selected as the design variables (expressed as x1–x6) for the rollover crashworthiness and weight optimization. The corresponding relationships between the six positive factors and the design variables are shown in Table 5, and the six design variables are presented in Figure 11.

3.2. Multi Variable Crashworthiness and Weight Optimization of Vehicle Body

3.2.1. Optimization Objectives and Constraints

For the optimization of rollover crashworthiness and mass of vans, the selected objective functions are the specific energy absorption and the total mass M of the selected components (x1–x6), while the displacement of the top cover and the maximum angular velocity of the body centroid during rollover were considered as the constraint functions. The aim of the optimization process was to enhance the energy absorption of key structures, reduce the maximum angular velocity of the body center of mass, and minimize the mass of selected parts when the van rolled. This was subject to the constraint that the displacement of the top cover should not exceed 127 mm (FMVSS 216).
Based on the definition of multi-objective optimization discussed in Section 2.4, the multi-objective optimization model for the rollover crashworthiness and weight of vans can be expressed as follows:
f i n d x 1 , x 2 , x 3 , x 4 , x 5 , x 6 min S E A , M s . t .   I n 127   m m ω 4.6   r a d / s 0.455 x 1 0.945 0.52 x 2 1.08 0.78 x 3 1.62 0.4875 x 4 1.0125 0.65 x 5 1.35 0.455 x 6 0.945
The value range of x1–x6 was 1 ± 35% of their respective initial values, and the initial value of M was 61.917 kg.

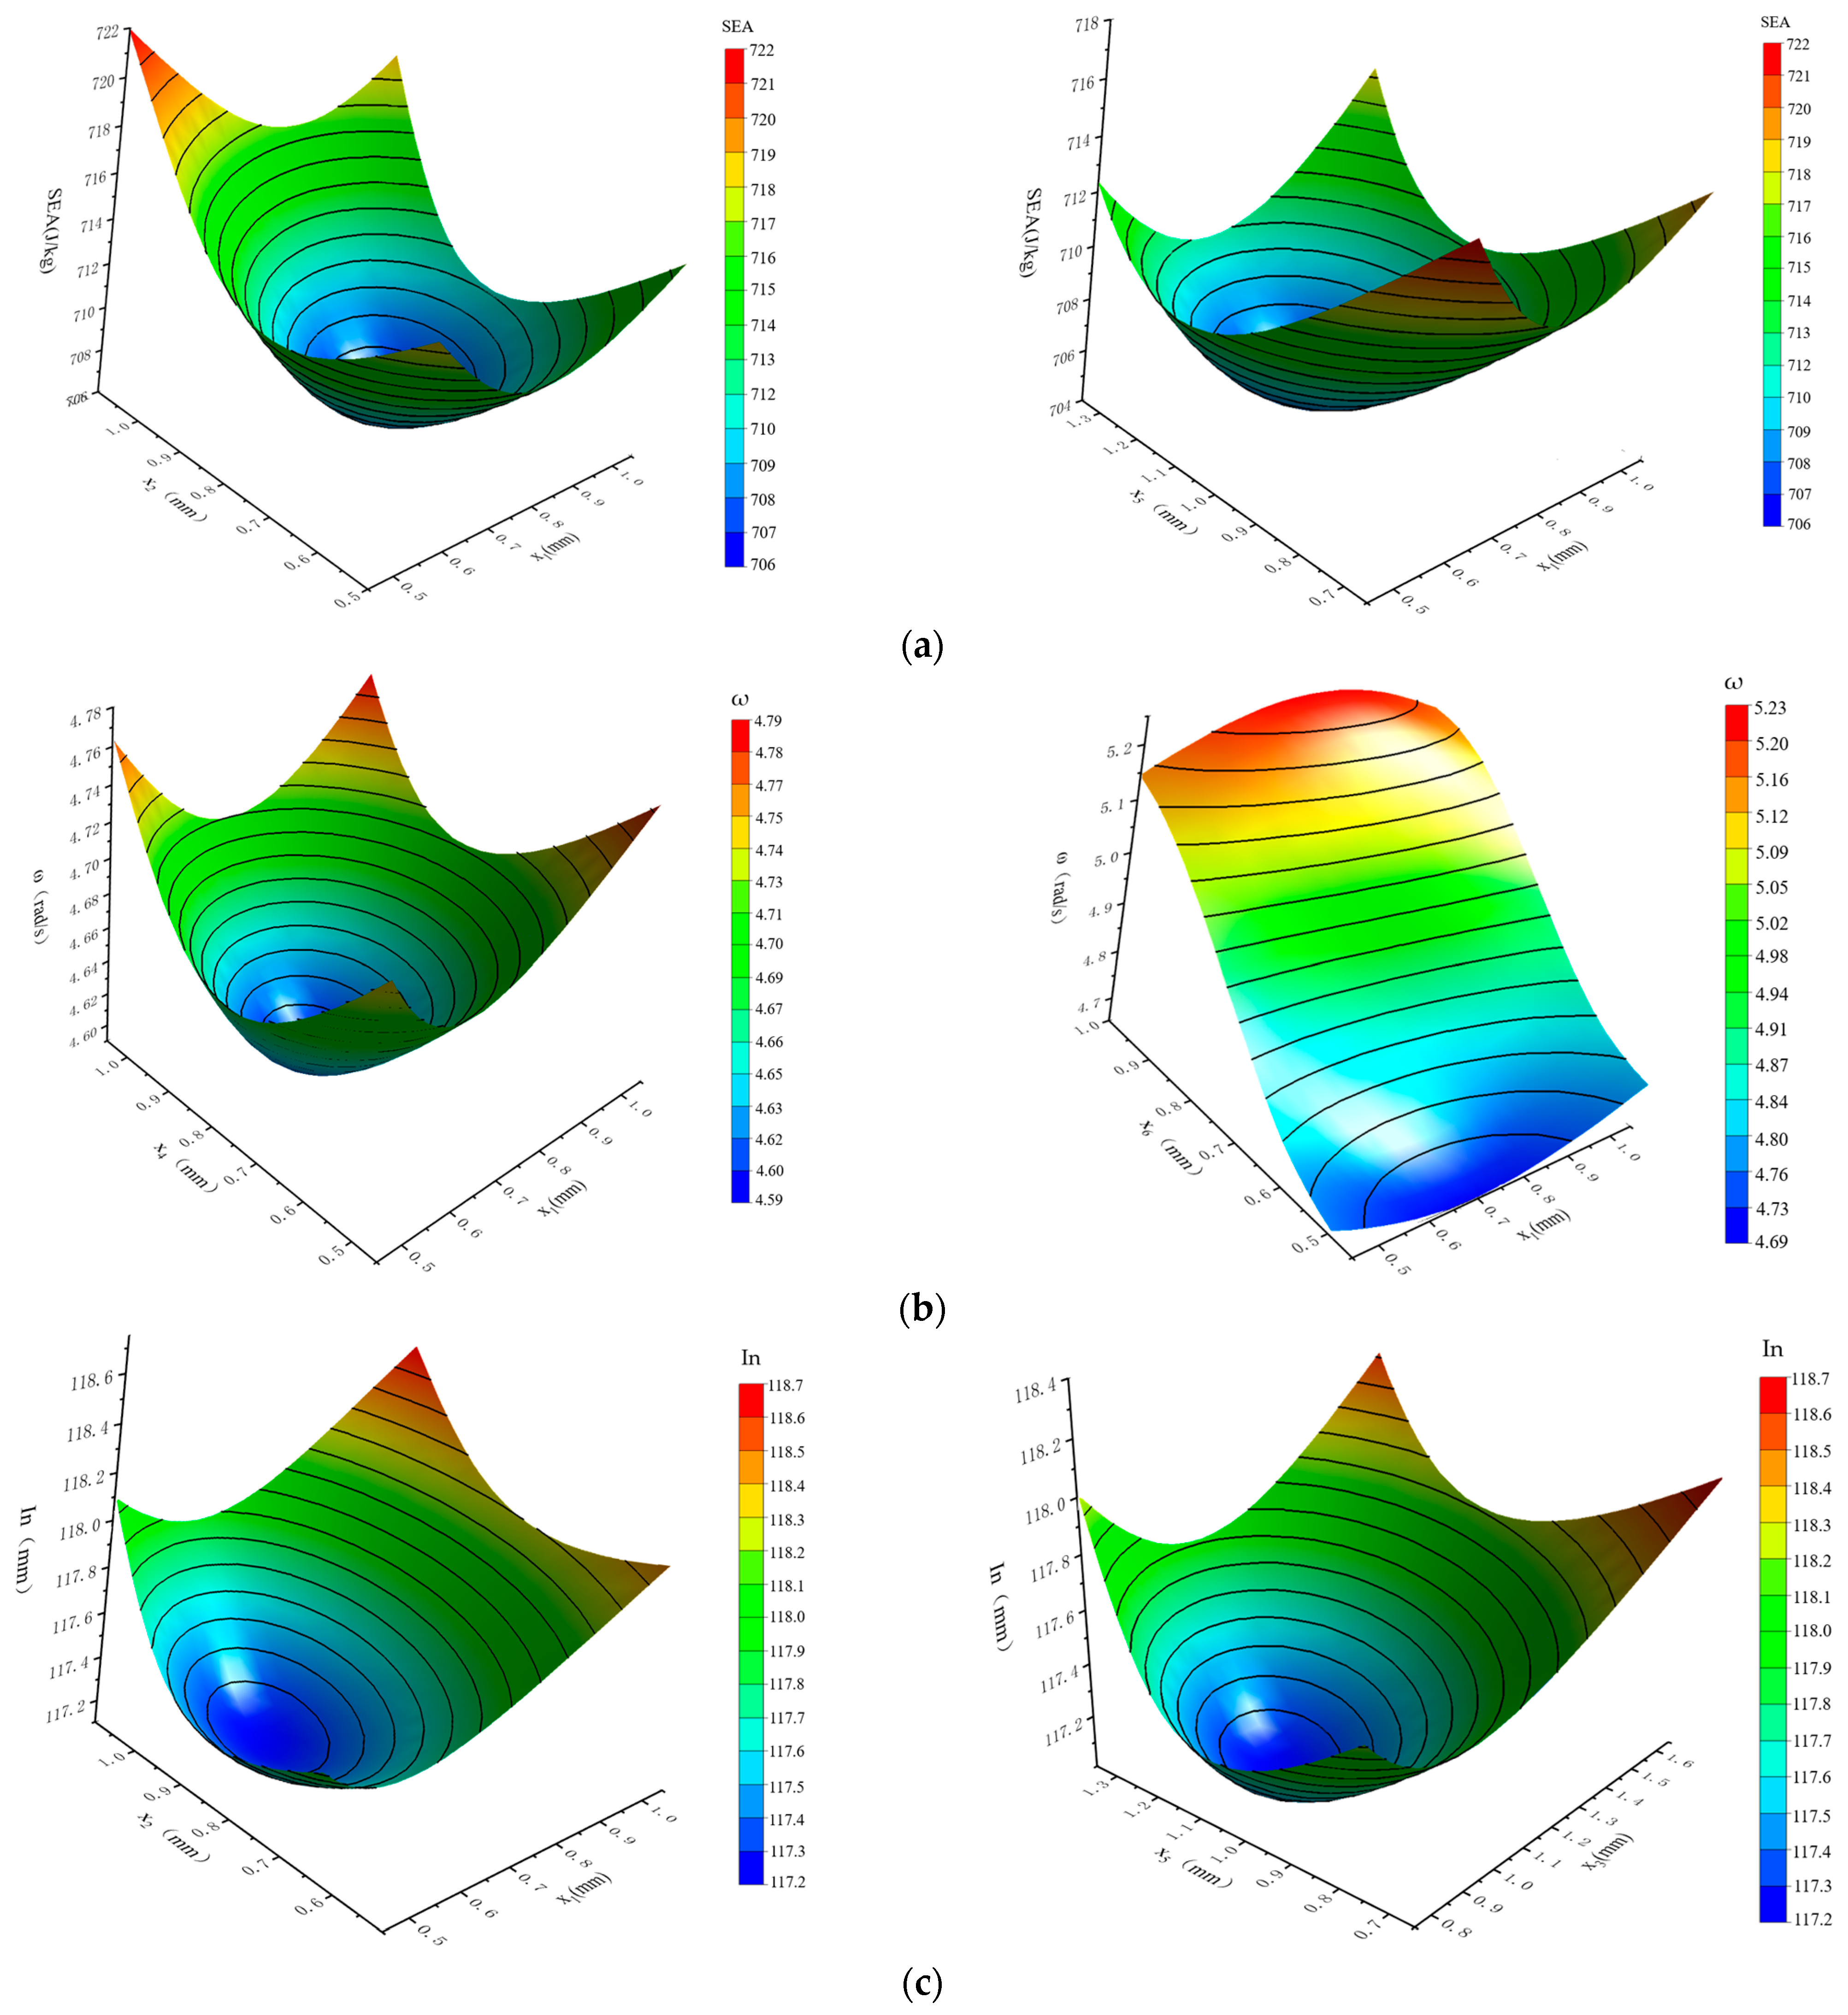
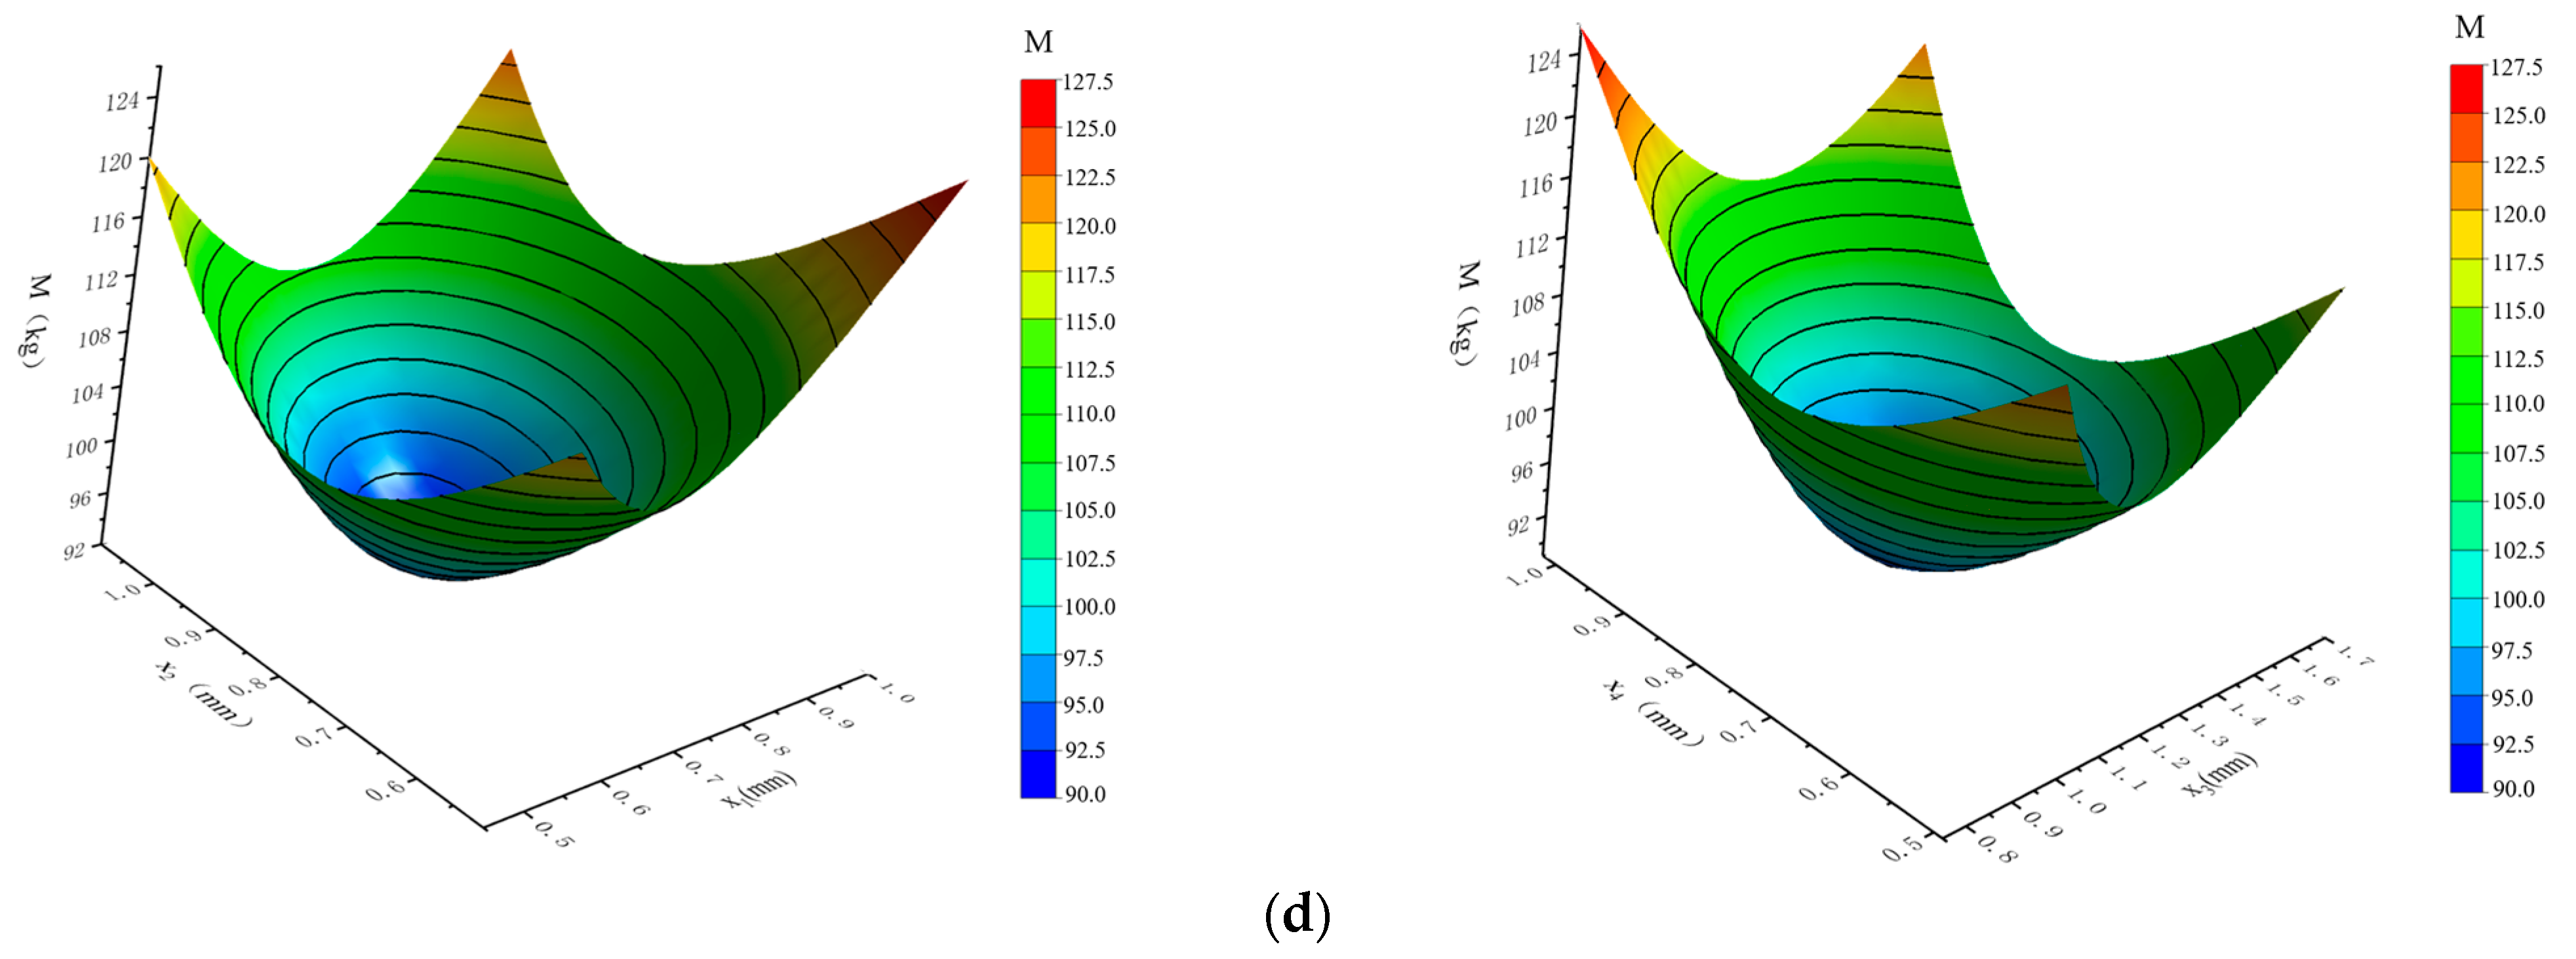
3.2.2. KRG Approximation Model of Objective Function

The optimal Latin hypercube test design (OLHD) is capable of generating more evenly spaced sample points in the design space [33]. In this study, 50 groups of data sample points were collected in the design space using the OLHD method. Simulation calculations were performed for these 50 sampling points, and the resulting solution outcomes are presented in Table A3 (Appendix A).
As the design variables in this study were of the same type, an isotropic fitting type was used to construct the Kriging (KRG) model, which had a faster convergence speed. The relationships between SEA, ω, In, M, and the variables x1–x6 are illustrated in Figure 12.
Table 6 presents the precision error analysis of the KRG approximation model constructed in this study. The overall accuracy of each KRG model was greater than 0.9, with the maximum error being less than 0.1. These results indicate that the model had a high level of accuracy, suitable for subsequent multi-objective optimization research.

3.2.3. Hybrid Algorithm for Roll Crashworthiness and Weight Optimization

Currently, the popular global optimization methods used for solving nonlinear vehicle collision problems are particle swarm optimization (PSO) [34] and the non-dominated sorting genetic algorithm (NSGA-II) [35]. However, despite the fast convergence rate of the PSO algorithm, it is prone to local optimal solutions [36]. On the other hand, NSGA-II has good convergence [37], but its population diversity and the non-uniformity of the Pareto distribution may impact decision-makers’ choices for the final solution [38]. Therefore, considering the strongly nonlinear objective function and the four approximate models proposed in this paper, we propose a hybrid approach that combines the artificial immune system (ARTIS) and PSO, known as the artificial immune particle swarm optimization (AI-PSO) algorithm, to optimize the rollover crashworthiness and weight.
ARTIS is a distributed model of an artificial immune system proposed by Hofmeyr, which consists of several nodes that simulate lymph nodes. Each node contains multiple detectors and can independently perform immune functions. Although the clonal selection algorithm based on this model is a common immune algorithm, it may not be efficient for solving the four approximate models due to the significant computation required for sorting and screening. To address this issue, PSO can be used to improve the clonal selection algorithm. By combining the strengths of the two algorithms, the resulting hybrid algorithm can achieve more effective optimization. This concept of a hybrid algorithm has been used in various research studies.
The basic PSO algorithm can be enhanced by incorporating cross-mutation operations from the artificial immune system and controlling particle flight speed. During the algorithm iteration, if the similarity of the particle swarm exceeded a certain threshold, cross-mutation operations were performed on the swarm with a certain probability. Additionally, if the particle velocity was less than a certain value, the particle was controlled in order for it to regain its flying speed and move away from the gathering point. The specific steps of the algorithm were as follows:
(1)
The learning factors c1 and c2, the number of particle populations M, and the maximum number of iterations were determined.
(2)
The initial population was randomly generated, the velocity and position of particles were initialized, and the iteration counter t was set to 1.
(3)
The optimal positions Pti of the particles and the optimal positions Ptg of the entire particle swarm were calculated.
(4)
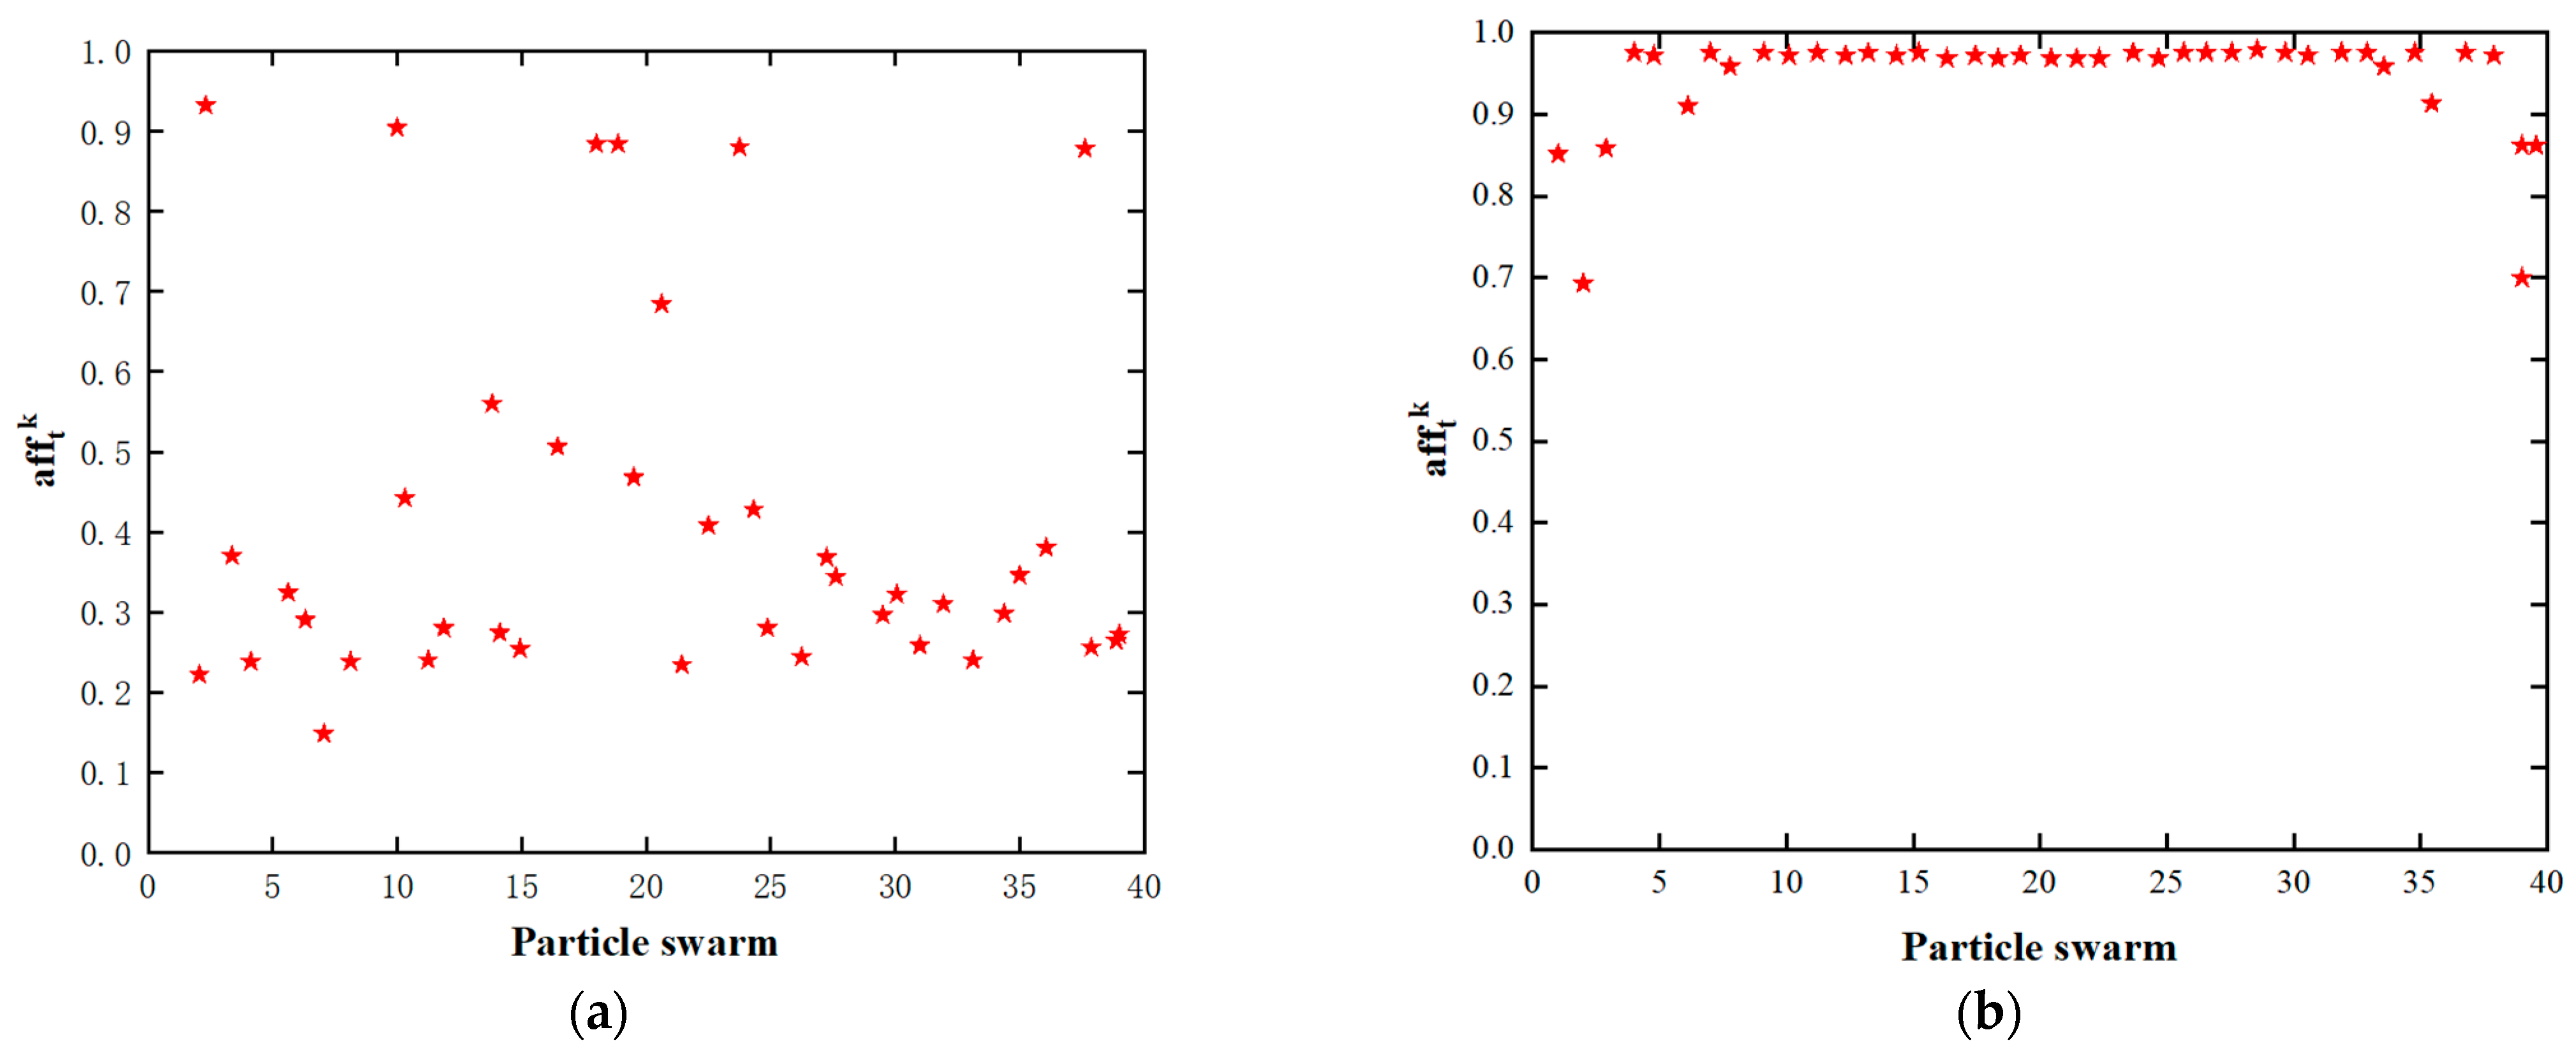
The particle position speed was updated using a formula, and the fitness afftk of each particle was calculated.
x i ( t + 1 ) = x i t + v i ( t + 1 )
v i ( t + 1 ) = X ( w v i ( t ) + c 1 r 1 ( p i ( t ) x i ( t ) ) ) + c 2 r 2 ( p g ( t ) x i ( t ) )
a f f k t = ( 1 + i = 1 m w i x 0 * ( i ) r j ( i ) 2 i = 1 m w i x 0 ( i ) r j ( i ) 2 ) 1
where X = 2 / 2 ϕ ϕ 2 4 ϕ , ϕ = c 1 + c 2 , r1, r2 are random numbers between 0 and 1.
(5)
The similarity of particles in the population ξ was calculated. If ξ ≥ ξom, cross-mutation operations were performed with a certain probability.
(6)
The velocity vti of each particle in the population was calculated. If vti was lower than the set value, we performed the speed control operation on the particle.
(7)
It was judged whether the termination condition had been met. If it had been met, the algorithm ended. If not, (3) was repeated.
The particle swarm size was set to Ns = 40, with learning factors c1 = 2.678 and c2 = 2.762, crossover probability Pc = 0.5, mutation probability Pm = 0.1, and maximum iteration number T = 200. The fitness of each particle in the first and last generation particle swarm is shown in Figure 13.

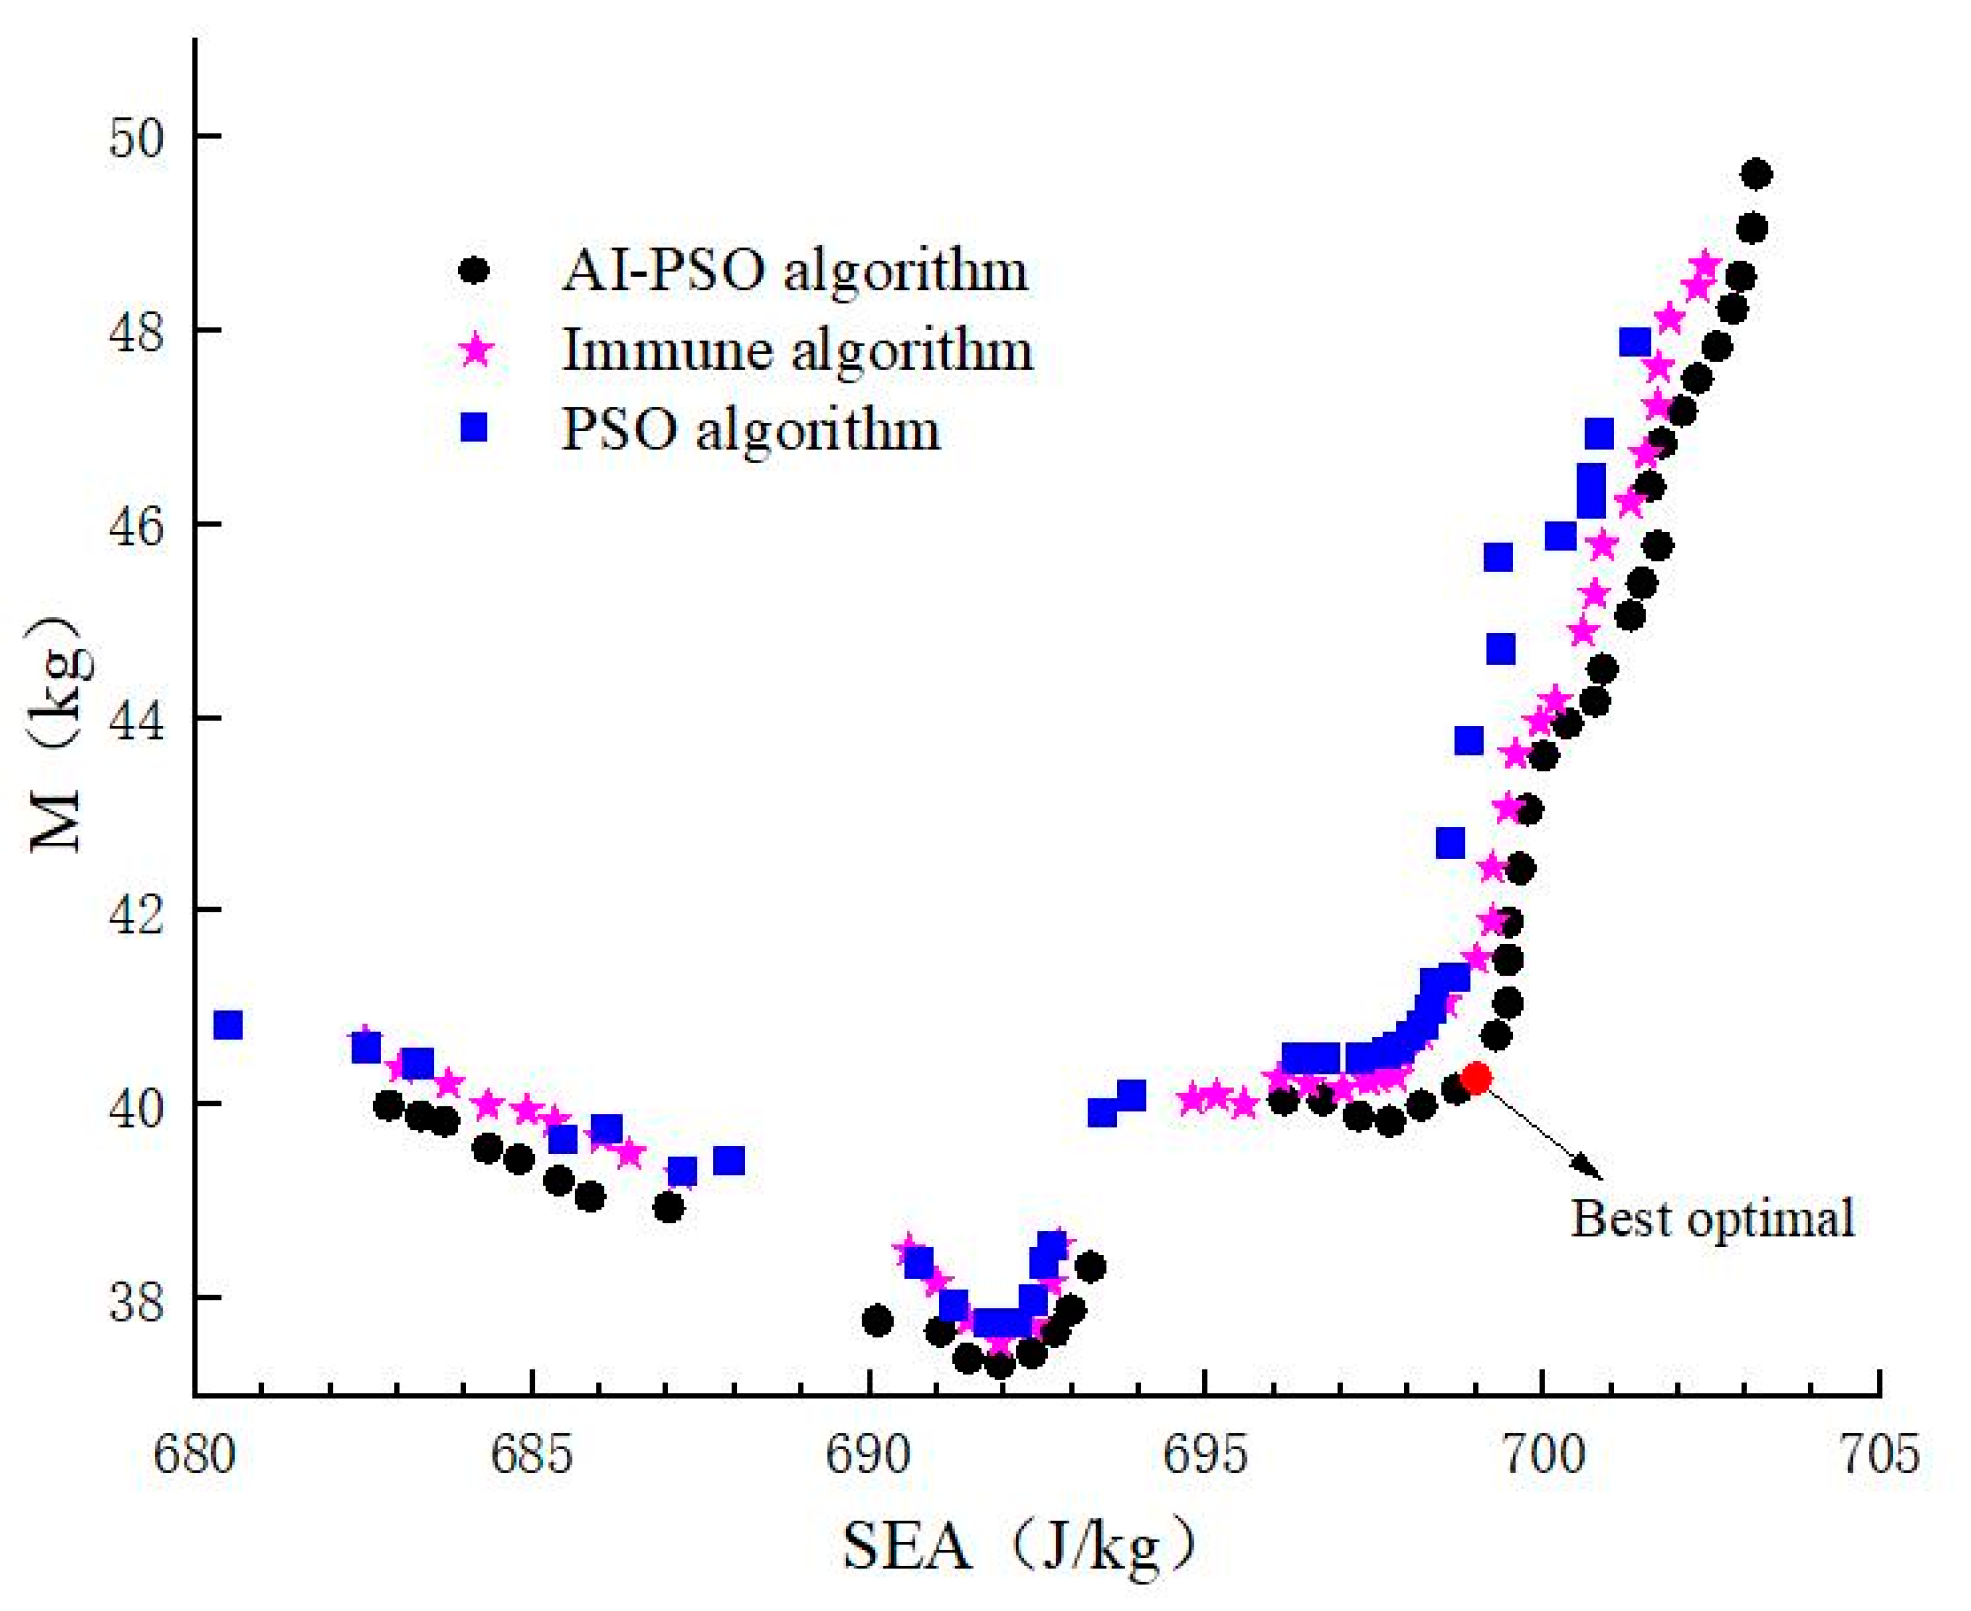
3.2.4. Optimization Results and Discussion

The Pareto solution set obtained through the application of the AI-PSO algorithm, immune algorithm, and PSO algorithm is illustrated in Figure 14. The hybrid optimization algorithm AI-PSO achieved a solution closer to the Pareto front, indicating the availability of an improved optimization scheme for the roll crashworthiness and weight of vans. Upon several generations, the PSO algorithm attained an optimal solution, which stabilized, and the group’s optimal fitness no longer increased along with the iteration numbers. The hybrid algorithm maintained its population diversity and particle speed throughout the iteration process. When near a local extreme point, the algorithm slightly perturbed the optimal local extreme value, thereby escaping the local extreme point and searching again. Consequently, this effectively addressed the issue of the PSO algorithm oscillating near local optimal solutions. The hybrid algorithm exhibited strong global search ability, with a more accurate and uniform Pareto solution set than that of the PSO algorithm. While the PSO algorithm delivered 29 solutions, the hybrid and immune algorithms delivered 60 solutions. Based on the global search outcomes of the PSO algorithm, the hybrid algorithm restricted the subsequent antibody mutation range, thus requiring 1/3 the computation time of the immune algorithm under similar iteration numbers. Overall, the AI-PSO hybrid algorithm effectively enhanced the precision, the Pareto solution set uniformity, and the computational efficiency of both the PSO algorithm and the immune algorithm.
None of the solutions in the Pareto solution set were able to fully satisfy the requirements for optimizing the van rollover crashworthiness and weight. However, the method with the shortest distance could be utilized to determine the best compromise solution, as shown in Table 7. The hybrid algorithm reduced the total van component weight by 21.572 kg while increasing the specific energy absorption of the key structure by 9.65%. Thus, the hybrid optimization algorithm minimized the vehicle’s weight and improved its van rollover crashworthiness. At this point, the top cover’s displacement was less than 127 mm, and the maximum angular velocity of the body center of mass was less than 4.6 rad/s, fulfilling the design requirements.

4. Conclusions

This paper introduced an unreplicated saturated factorial design as an effective factor screening method for the research of van rollover crashworthiness and weight optimization. The thickness values of 19 structural components of the vehicle’s body were taken as the design variables, and the key structure specific energy absorption, the maximum angular velocity of the rollover body center of mass, and the displacement of the roof were investigated as response values. Three unreplicated saturated factorial design methods, including the semi-normal probability graph method, the Lenth method, and the Dong93 method, were used to screen six activity factors. The iterative optimization of the Dong93 method successfully reduced the value of Error I. By combining graphical and numerical analysis methods, the problem of factor screening in the optimization of vehicle rollover crashworthiness was solved more objectively and effectively. Screening out more comprehensive positive factors using only one design shortened the entire roll crashworthiness research cycle and reduced the cost of the test.
Furthermore, a multi-objective optimization model for the roll crashworthiness and weight of vans was established, taking six activity factors as design variables. By using the optimal Latin hypercube design, the KRG model for SEA, In, M, and ω was constructed. A hybrid optimization algorithm combining particle swarm optimization and the artificial immune system method was applied to solve the multi-objective optimization problem established in this paper. This algorithm made full use of the population diversity of the artificial immune algorithm, added mutation and crossover operators to the PSO, and ultimately produced a more uniform Pareto solution set. The algorithm effectively improved the global search ability and optimization efficiency, and ultimately reduced the total weight of the selected parts by 34.84%. Meanwhile, the displacement of the top cover and the maximum angular velocity of the vehicle’s center of mass decreased by 8.17% and 8.70%, respectively, with the specific energy absorption of the key structure increasing by 9.65%. That is, the van’s rollover crashworthiness was enhanced significantly. These results indicate that the unreplicated saturated factorial design is effective in the design of vans in terms of roll crashworthiness and weight optimization, and it can be applied to the research of frontal crashes, side crashes, and roll crashes of other vehicles, breaking away from the dependence on traditional experience and the limitations on vehicle types.
Although rollover crashworthiness and weight optimization based on changes in the thickness values of body parts is a direct and effective method, the range and degree of its optimization are limited by the sizes of the parts themselves. If topology optimization or composite materials, such as carbon fiber composites, were applied to the design of the key parts selected in this paper, the rollover crashworthiness and weight optimization of vehicles would be improved to an even greater degree. This topic is worthy of further research.

Author Contributions

Conceptualization, D.Z.; methodology, D.Z.; software, M.D. and Y.L.; validation, Y.M.; formal analysis, M.D.; writing—original draft preparation, D.Z.; writing—review and editing, Y.M.; visualization, M.D.; funding acquisition, Y.M. All authors have read and agreed to the published version of the manuscript.

Funding

This research was funded by Wuhan University of Technology, grant 4501465542.

Institutional Review Board Statement

Not applicable.

Informed Consent Statement

Not applicable.

Data Availability Statement

The data presented in this study are available upon request from the corresponding author.

Conflicts of Interest

The authors declare no conflict of interest.

Abbreviations

The following abbreviations are used in this manuscript:
NVHNoise, vibration, harshness
OLHDOptimal Latin hypercube design
KRGKriging
FEFinite element
AI-PSOArtificial immune particle swarm optimization
SEASpecific energy absorption
PSEPseudo-standard error
ASEAdjusted standard error
PSOParticle swarm optimization
NSGA-IINon-dominated sorting genetic algorithm
ARTISArtificial immune system

Appendix A

Table A1. Plackett–Burman design based on L20 (219).
No.A1A2A3A4A5A6A7A8A9A10A11A12A13A14A15A16A17A18A19SEA (J/kg)ω (rad/s)In (mm)
1−111−111−1−1−1−11−11−11111−1635.64.50125.2
21−11111−1−111−111−1−1−1−11−1551.24.78132.5
3−11111−1−111−111−1−1−1−11−11636.74.51127.3
4−11−11−11111−1−111−111−1−1−1629.34.77127.1
5−11−11111−1−111−111−1−1−1−11601.54.80128.4
6−1−1−11−11−11111−1−111−111−1579.15.07130.2
71−1−1−1−11−11−11111−1−111−11541.05.05128.2
81111−1−111−111−1−1−1−11−11−1560.75.06130.3
911−1−111−111−1−1−1−11−11−111615.85.08127.1
101−1−111−111−1−1−1−11−11−1111561.24.78131.3
11111−1−111−111−1−1−1−11−11−11600.85.05128.2
12−1−1−1−11−11−11111−1−111−111636.14.52125.1
13−1−11−11−11111−1−111−111−1−1561.34.81128.5
14−1−1−1−1−1−1−1−1−1−1−1−1−1−1−1−1−1−1−1616.44.77127.7
1511−1−1−1−11−11−11111−1−111−1619.55.23127.6
161−111−1−1−1−11−11−11111−1−11603.95.24133.2
1711−111−1−1−1−11−11−11111−1−1561.75.08131.8
181−11−11111−1−111−111−1−1−1−1562.35.27131.1
19−1−111−111−1−1−1−11−11−11111616.95.10132.4
20−111−1−1−1−11−11−11111−1−111620.15.06126.3
Table A2. Factor screening results of the Lenth method.
SEAωIn
Var β ^ i SMEVar β ^ i SMEVar β ^ i SME
A135.4945.93A1 +0.2710.138A1 +2.312.11
A225.23A20.025A2 +2.09
A31.21A30.023A31.05
A410.67A40.015A4 +2.95
A56.43A5 +0.227A50.29
A64.41A60.041A60.13
A71.19A70.025A70.05
A817.61A80.039A80.47
A915.61A90.041A90.59
A1028.41A100.003A100.05
A114.17A110.003A110.63
A123.85A120.021A120.07
A136.19A130.049A130.29
A142.69A14 +0.295A141.37
A156.91A150.015A150.05
A161.35A160.011A160.17
A178.35A170.017A170.19
A188.13A180.017A180.35
A1915.69A190.015A190.45
Active factorsNoneActive factorsA1, A5, A14Active factorsA1, A2, A4
+ The positive factors are marked with a “+” sign in the upper right corner.
Table A3. Fifty sampling points and simulation results of OLHD.
Nox1x2x3x4x5x6SEA (J/kg)ω (rad/s)In (mm)M (kg)
11.0311.1731.3060.5610.5310.949690.04.30116.444.436
21.1530.8471.0820.8880.8671.459687.94.36116.353.755
31.0920.7651.6940.8470.8060.500675.34.28116.643.251
40.6021.2761.2241.1941.8160.786681.64.29115.044.714
50.8881.2961.3671.2141.6021.480682.64.36116.256.810
61.3980.7241.5920.6021.6630.745671.14.31117.249.379
71.1941.1121.7960.7242.0001.316673.04.34117.356.467
80.8270.5411.3881.3161.8470.806671.64.32115.347.486
91.2761.5001.4691.2761.6330.867675.34.34117.256.989
101.4180.5001.2861.1331.3881.031673.04.37116.855.437
111.0710.5611.4080.5411.5411.337679.74.33116.349.554
120.5611.1331.4490.6221.0820.561685.74.24115.135.346
130.8470.6021.8781.3780.8980.929672.14.33116.249.525
140.6221.0311.8161.3981.6941.112673.34.33115.751.282
150.5200.8271.3271.2961.0200.643681.74.29114.740.223
160.9901.4181.0410.6841.4800.765687.34.29115.944.673
171.4800.7451.9801.0711.1430.969667.04.36118.057.452
180.7450.9491.4290.5821.9690.888679.34.27115.542.335
191.2351.4801.1431.1120.8371.214688.04.36116.956.254
200.6841.4591.7550.8061.5711.010680.94.29116.146.645
210.7651.3571.7761.3371.2650.541675.04.29116.146.404
220.5000.8881.6730.7861.4491.439683.04.31115.446.412
230.8061.4391.6530.8270.6841.418689.04.33116.551.062
240.9290.6631.0610.7451.2040.724683.54.29115.341.072
251.4591.2141.6330.7041.0511.296679.84.35117.957.804
260.7240.6431.3471.3571.1121.378681.54.36115.451.578
271.1120.7041.2451.2550.5000.908682.04.34116.249.596
280.5411.1941.1020.9900.9291.153692.54.30114.943.818
291.2140.9691.2041.0311.9080.520673.54.31116.348.119
300.7040.7861.0000.9491.7551.255685.04.32114.946.929
311.2551.3981.7140.6431.2960.622676.94.29117.448.083
321.1731.3372.0001.2351.2961.276673.04.36117.760.206
330.8671.2551.2650.5001.4181.398689.54.31116.048.472
340.9081.3781.1841.1530.7140.582686.64.30115.844.441
351.3371.3161.7351.1730.5920.827677.44.34117.754.699
360.6631.1531.9180.9690.5610.847681.54.28116.143.567
370.7861.2351.5311.5000.7451.133682.74.35116.052.654
381.2960.8671.5711.481.2350.602669.24.34116.953.684
391.1331.0311.9591.0921.8780.684665.64.31117.151.764
401.010.8061.8371.0100.7761.500679.14.36116.955.262
411.3570.5821.5310.6630.6221.092679.64.34117.250.592
421.0311.0101.0201.4591.3570.990681.04.35115.853.100
430.9690.5201.8981.0311.7241.235668.84.34116.553.024
441.4390.9901.4901.4180.9591.357676.34.40117.563.240
450.9490.9291.9390.5201.1731.031677.34.29116.846.234
461.3781.0921.1220.8671.7861.194679.74.36116.956.436
470.6430.6221.5100.7650.6531.071685.44.29115.341.279
480.5820.6841.8570.9081.5100.663672.94.26115.439.999
491.5001.0711.1630.9290.9900.704680.14.33117.251.731
501.3160.9081.6121.4391.9391.173667.64.38117.261.633

References

  1. NHTSA. 2020 Traffic Safety Facts Annual Report; National Highway Traffic Safety Administration, U.S. Department of Transportation: Washington, DC, USA, 2022.
  2. Zuoping, Y.; Yong, W.; Juncheng, L. Research on crashworthiness of mini car based on refined multi rigid body model. China Mech. Eng. 2020, 31, 9. [Google Scholar]
  3. Qian, P. Virtual Test Research on Compression Resistance and Dynamic Rollover of Car Quasi-Static Roof; Hunan University: Changsha, China, 2012. [Google Scholar]
  4. Chu, G.; Lin, Y.; Song, W.; Zhang, L. Forming Limit of FSW Aluminum Alloy Blank Based on a New Constitutive Model. Metall. Mater. Trans. A 2017, 32, 275–283. [Google Scholar]
  5. Cui, X.T.; Zhang, H.W.; Wang, S.X.; Zhang, L.H.; Ko, J.H. Design of lightweight multi-material automotive bodies using new material performance indices ofthin-walled beams for the material selection with crashworthiness consideration. Mater. Des. 2011, 32, 815–821. [Google Scholar] [CrossRef]
  6. Kiani, M.; Yildiz, A. A Comparative Study of Non-traditional Methods for Vehicle Crashworthiness and NVH Optimization. Arch. Comput. Methods Eng. 2016, 23, 723–734. [Google Scholar] [CrossRef]
  7. Wang, C.Q.; Wang, D.F.; Zhang, S. Design and application of lightweight multi-objective collaborative optimization for a parametric body-in-white structure. Proc. Inst. Mech. Eng. Part D J. Automob. Eng. 2016, 230, 273–288. [Google Scholar] [CrossRef]
  8. Lee, Y.; Han, Y.H.; Park, S.O.; Park, G.J. Vehicle crash optimization considering a roof crush test and a side impact test. Proc. Inst. Mech. Eng. Part D J. Automob. Eng. 2019, 233, 2455–2466. [Google Scholar] [CrossRef]
  9. Belingardi, G.; Beyene, A.; Koricho, E.; Martorana, B. Alternative lightweight materials and component manufacturing technologies for vehicle frontal bumper beam. Compos. Struct. 2015, 120, 483–495. [Google Scholar] [CrossRef]
  10. Wang, R.; Xu, X.; Chen, S.; Guo, N.; Yu, Z. Vehicle Rollover Warning and Control Based on Attitude Detection and Fuzzy PID. Appl. Sci. 2023, 13, 4339. [Google Scholar] [CrossRef]
  11. Seyedi, M.; Jung, S.; Wekezer, J.; Kerrigan, J.R.; Gepner, B. Rollover crashworthiness analyses—An overview and state of the art. Int. J. Crashworthiness 2019, 25, 328–350. [Google Scholar] [CrossRef]
  12. Bose, D.; Kerrigan, J.R.; Foster, J.B.; Crandall, J.R.; Tobaru, S. Planar impacts in rollover crashes: Significance, distribution and injury epidemiology. Ann. Adv. Automot. Med. 2011, 55, 243–252. [Google Scholar]
  13. Craig, K.J.; Stander, N.; Dooge, D.A.; Varadappa, S. Automotive crashworthiness design using response surface-based variable screening and optimization. Eng. Comput. 2005, 22, 38–61. [Google Scholar] [CrossRef]
  14. Hou, S.; Dong, D.; Ren, L.; Han, X. Multivariable crashworthiness optimization of vehicle body by unreplicated saturated factorial design. Struct. Multidiscip. Optim. 2012, 46, 891–905. [Google Scholar] [CrossRef]
  15. Hou, S.; Liu, T.; Dong, D.; Han, X. Factor screening and multivariable crashworthiness optimization for vehicle side impact by factorial design. Struct. Multidiscip. Optim. 2013, 49, 147–167. [Google Scholar] [CrossRef]
  16. Jin, Z.; Zhang, S.; Weng, J. Immune particle swarm optimization of SUV rollover crashworthiness and weight. Struct. Multidiscip. Optim. 2021, 64, 1161–1174. [Google Scholar] [CrossRef]
  17. Federal Motor Vehicle Safety Standard No. 208; Occupant Crash Protection. U.S. Department of Transportation: Washington, DC, USA, 2004.
  18. Federal Motor Vehicle Safety Standard No. 216; Roof Crush Resistance. U.S. Department of Transportation: Washington, DC, USA, 1997.
  19. Montgomery, D.C. Design and Analysis of Experiments; Wiley: New York, NY, USA, 2005. [Google Scholar]
  20. Meng, T. The Comparison Research about Plackett-Burman Data Analysis Method for Supersaturated Designs; East China Normal University: Shanghai, China, 2008. [Google Scholar]
  21. Chen, Y.; Kunert, J. A new quantitative method for analyzing unreplicated factorial designs. Biom. J. 2004, 46, 125–140. [Google Scholar] [CrossRef]
  22. Daniel, C. Applications of Statistics to Industrial Experimentation; Wiley: New York, NY, USA, 1976. [Google Scholar]
  23. Dong, F. On the identification of active contrasts in unreplicated fractional factorials. Stat. Sin. 1993, 3, 209–217. [Google Scholar]
  24. Lenth, R.V. Quick and emsy analysis of unreplicated factorials. Technometrics 1989, 31, 469–473. [Google Scholar] [CrossRef]
  25. Seyedi, M.R.; Jung, S.; Wekezer, J. Characteristic Analysis of Modified Dolly Test: A Sensitivity Study of Initial Conditions on Rollover Outcomes. In Model Validation and Uncertainty Quantification; Springer: Cham, Switzerland, 2020. [Google Scholar]
  26. Li, T.Z.; Li, G.Y.; Chen, T.; Gao, H. Robustness design of occupant restraint system based on Kriging model. J. Mech. Eng. 2010, 46, 123–129. [Google Scholar] [CrossRef]
  27. Zheng, J.Z.; Chen, Y.S.; Lv, B.; Gao, H. A study on safety performance optimization of seat subsystem based on Kriging model. Automot. Eng. 2019, 41, 1301–1307. [Google Scholar]
  28. Liu, Z.; Lu, J.; Zhu, P. Lightweight design of automotive composite bumper system using modified particle swarm optimizer. Compos. Struct. 2016, 140, 630–643. [Google Scholar] [CrossRef]
  29. Borazjani, S.; Belingardi, G. Development of an innovative design of a composite-sandwich based vehicle roof structure. Compos. Struct. 2017, 168, 522–534. [Google Scholar] [CrossRef]
  30. Parent, D.P.; Kerrigan, J.; Crandall, J. Comprehensive Computational Rollover Sensitivity Study Part 2: Influence of Vehicle, Crash, and Occupant Parameters on Head, Neck, and Thorax Response; SAE Technical Paper 2011-01-1115; SAE International: Warrendale, PA, USA, 2011. [Google Scholar]
  31. Meric, D.; Gedikli, H. Energy absorption behavior of tailor-welded tapered tubes under axial impact loading using coupled FEM/SPH method. Thin-Walled Struct. 2016, 104, 17–33. [Google Scholar] [CrossRef]
  32. Tao, M. Comparative Study on Data Analysis Methods for Plackett Burman Saturation Design. Master’s Thesis, East China Teachers’ University, Shanghai, China, 2008. [Google Scholar]
  33. Gao, D.; Yao, B.; Chang, G.; Li, Q. Multi-Objective Optimization Design of Vehicle Side Crashworthiness Based on Machine Learning Point-Adding Method. Appl. Sci. 2022, 12, 10320. [Google Scholar] [CrossRef]
  34. Kennedy, J.; Eberhart, R. Particle swarm optimization. In Proceedings of the ICNN’95 International Conference on Neural Network, Perth, WA, Australia, 27 November–1 December 1995; IEEE Press: New York, NY, USA, 1995; pp. 1942–1948. [Google Scholar]
  35. Deb, K.; Agrawal, K.; Pratap, A.; Meyarivan, T. A fast elitist non-dominated sorting genetic algorithm for multi-objective optimiza-tion: NSGA-II. Lect Notes Comput. Sci. 2000, 1917, 849–858. [Google Scholar]
  36. Ciuprina, G.; Ioan, D.; Munteanu, I. Use of intelligent-particle swarm optimization in electromagnetics. IEEE Trans. Magn. 2002, 38, 1037–1040. [Google Scholar] [CrossRef]
  37. Xiao, W.; Cheng, A.; Li, S.; Jiang, X.; Ruan, X.; He, G. A multi-objective optimization strategy of steam power system to achieve standard emission and optimal economic by NSGA-II. Energy 2021, 232, 120953. [Google Scholar] [CrossRef]
  38. Yimin, M.; Donghui, S.X.; Juncheng, L. Optimization of front longitudinal beam of micro vehicle based on BB-MOPSO algorithm. Mech. Des. Manuf. 2017, 9, 211–215. [Google Scholar]
Figure 1. Platform rollover test process: (a) vehicle acceleration; (b) vehicle brake; (c) vehicle rollover.
Applsci 13 06963 g001
Figure 2. FMVSS 216 test method.
Applsci 13 06963 g002
Figure 3. FE model of van.
Applsci 13 06963 g003
Figure 4. Comparison of key motion states: (a) tire touchdown; (b) 1/4-week; (c) 1/2-week; (d) 3/4-week; (e) 1-week; (f) 5/4-week; (g) 3/2-week; (h) 7/4-week; (i) 2-week.
Applsci 13 06963 g004
Figure 5. Comparison of three-way acceleration curve between simulation and test at the center of mass: (a) X direction acceleration comparison; (b) Y acceleration; (c) Z acceleration.
Applsci 13 06963 g005aApplsci 13 06963 g005b
Figure 6. Load displacement curve.
Applsci 13 06963 g006
Figure 7. The flow chart for the crashworthiness design with unreplicated saturated factorial design.
Applsci 13 06963 g007
Figure 8. Nineteen analysis factors of van rollover.
Applsci 13 06963 g008
Figure 9. Semi-normal probability diagram of three responses: (a) specific energy absorption; (b) angular velocity; (c) head cover displacement.
Applsci 13 06963 g009aApplsci 13 06963 g009b
Figure 10. Iteration flowchart.
Applsci 13 06963 g010
Figure 11. Factor screening results.
Applsci 13 06963 g011
Figure 12. Three-dimensional post-processing display results of the KRG model: (a) SEA; (b) ω; (c) In; (d) M.
Applsci 13 06963 g012aApplsci 13 06963 g012b
Figure 13. Fitness distribution of each particle in the population: (a) First-generation particle swarm; (b) last-generation particle swarm.
Applsci 13 06963 g013
Figure 14. Rollover crashworthiness and weight optimization results for the van.
Applsci 13 06963 g014
Table 1. Initial thickness values of 19 parts.
Analysis FactorsA1A2A3A4A5A6A7A8A9A10A11A12A13A14A15A16A17A18A19
Initial values (mm)0.70.81.01.20.751.41.20.71.21.01.00.80.80.71.00.81.00.81.0
Upper boundary (mm)1.891.891.891.891.891.891.891.891.891.891.891.891.891.891.891.891.891.891.89
Lower boundary (mm)0.4550.4550.4550.4550.4550.4550.4550.4550.4550.4550.4550.4550.4550.4550.4550.4550.4550.4550.455
Table 2. Factor screening results of the semi-normal probability map.
ResponsesActive Factors
SEAA1, A2, A10
ωA1, A5, A14
InA1, A2, A4, A14
Table 3. Simulation results based on L20(219) design.
αBefore IterationAfter Iteration
Error IError IIError IError II
0.20.03180.00530.03220.0073
0.10.05580.00310.04050.0057
0.050.06680.00210.04530.0028
0.010.09870.00090.05910.0010
Table 4. Factor screening results of the Dong93 method before and after iteration.
ParametersS1minactiveASE t γ , m i n a c t i v e Active Factors
ResponsesSEAbefore10.3651710.5083.928A1, A10
after8.806168.8063.983A1, A2, A10
ωbefore0.0345160.0263.983A1, A5, A14
after0.0345160.0263.983A1, A5, A14
Inbefore0.525150.4214.047A1, A2, A4, A14
after0.525150.4214.047A1, A2, A4, A14
Table 5. Definition of crashworthiness and weight optimization design variables.
Active FactorsDesign VariablesInitial Value (mm)
A1x10.7
A2x20.8
A4x31.2
A5x40.75
A10x51.0
A14x60.7
Table 6. Precision error analysis results.
ResponsesMRER2Radj2
SEA0.04270.96030.9548
ω0.06160.94120.9330
In0.01350.94040.9320
M0.01510.95840.9526
Table 7. Rollover crashworthiness and weight optimization results for the van.
TermsM (kg)In (mm)ω (rad/s)SEA (J/kg)
Before optimization61.917124.94.6637.21
After optimization40.345114.74.2698.7
Optimization range34.84%8.17%8.70%9.65%
Disclaimer/Publisher’s Note: The statements, opinions and data contained in all publications are solely those of the individual author(s) and contributor(s) and not of MDPI and/or the editor(s). MDPI and/or the editor(s) disclaim responsibility for any injury to people or property resulting from any ideas, methods, instructions or products referred to in the content.

