
An Analysis of the Spatial and Temporal Evolution of the Urban Heat Island in the City of Zhengzhou Using MODIS Data
Abstract
:1. Introduction
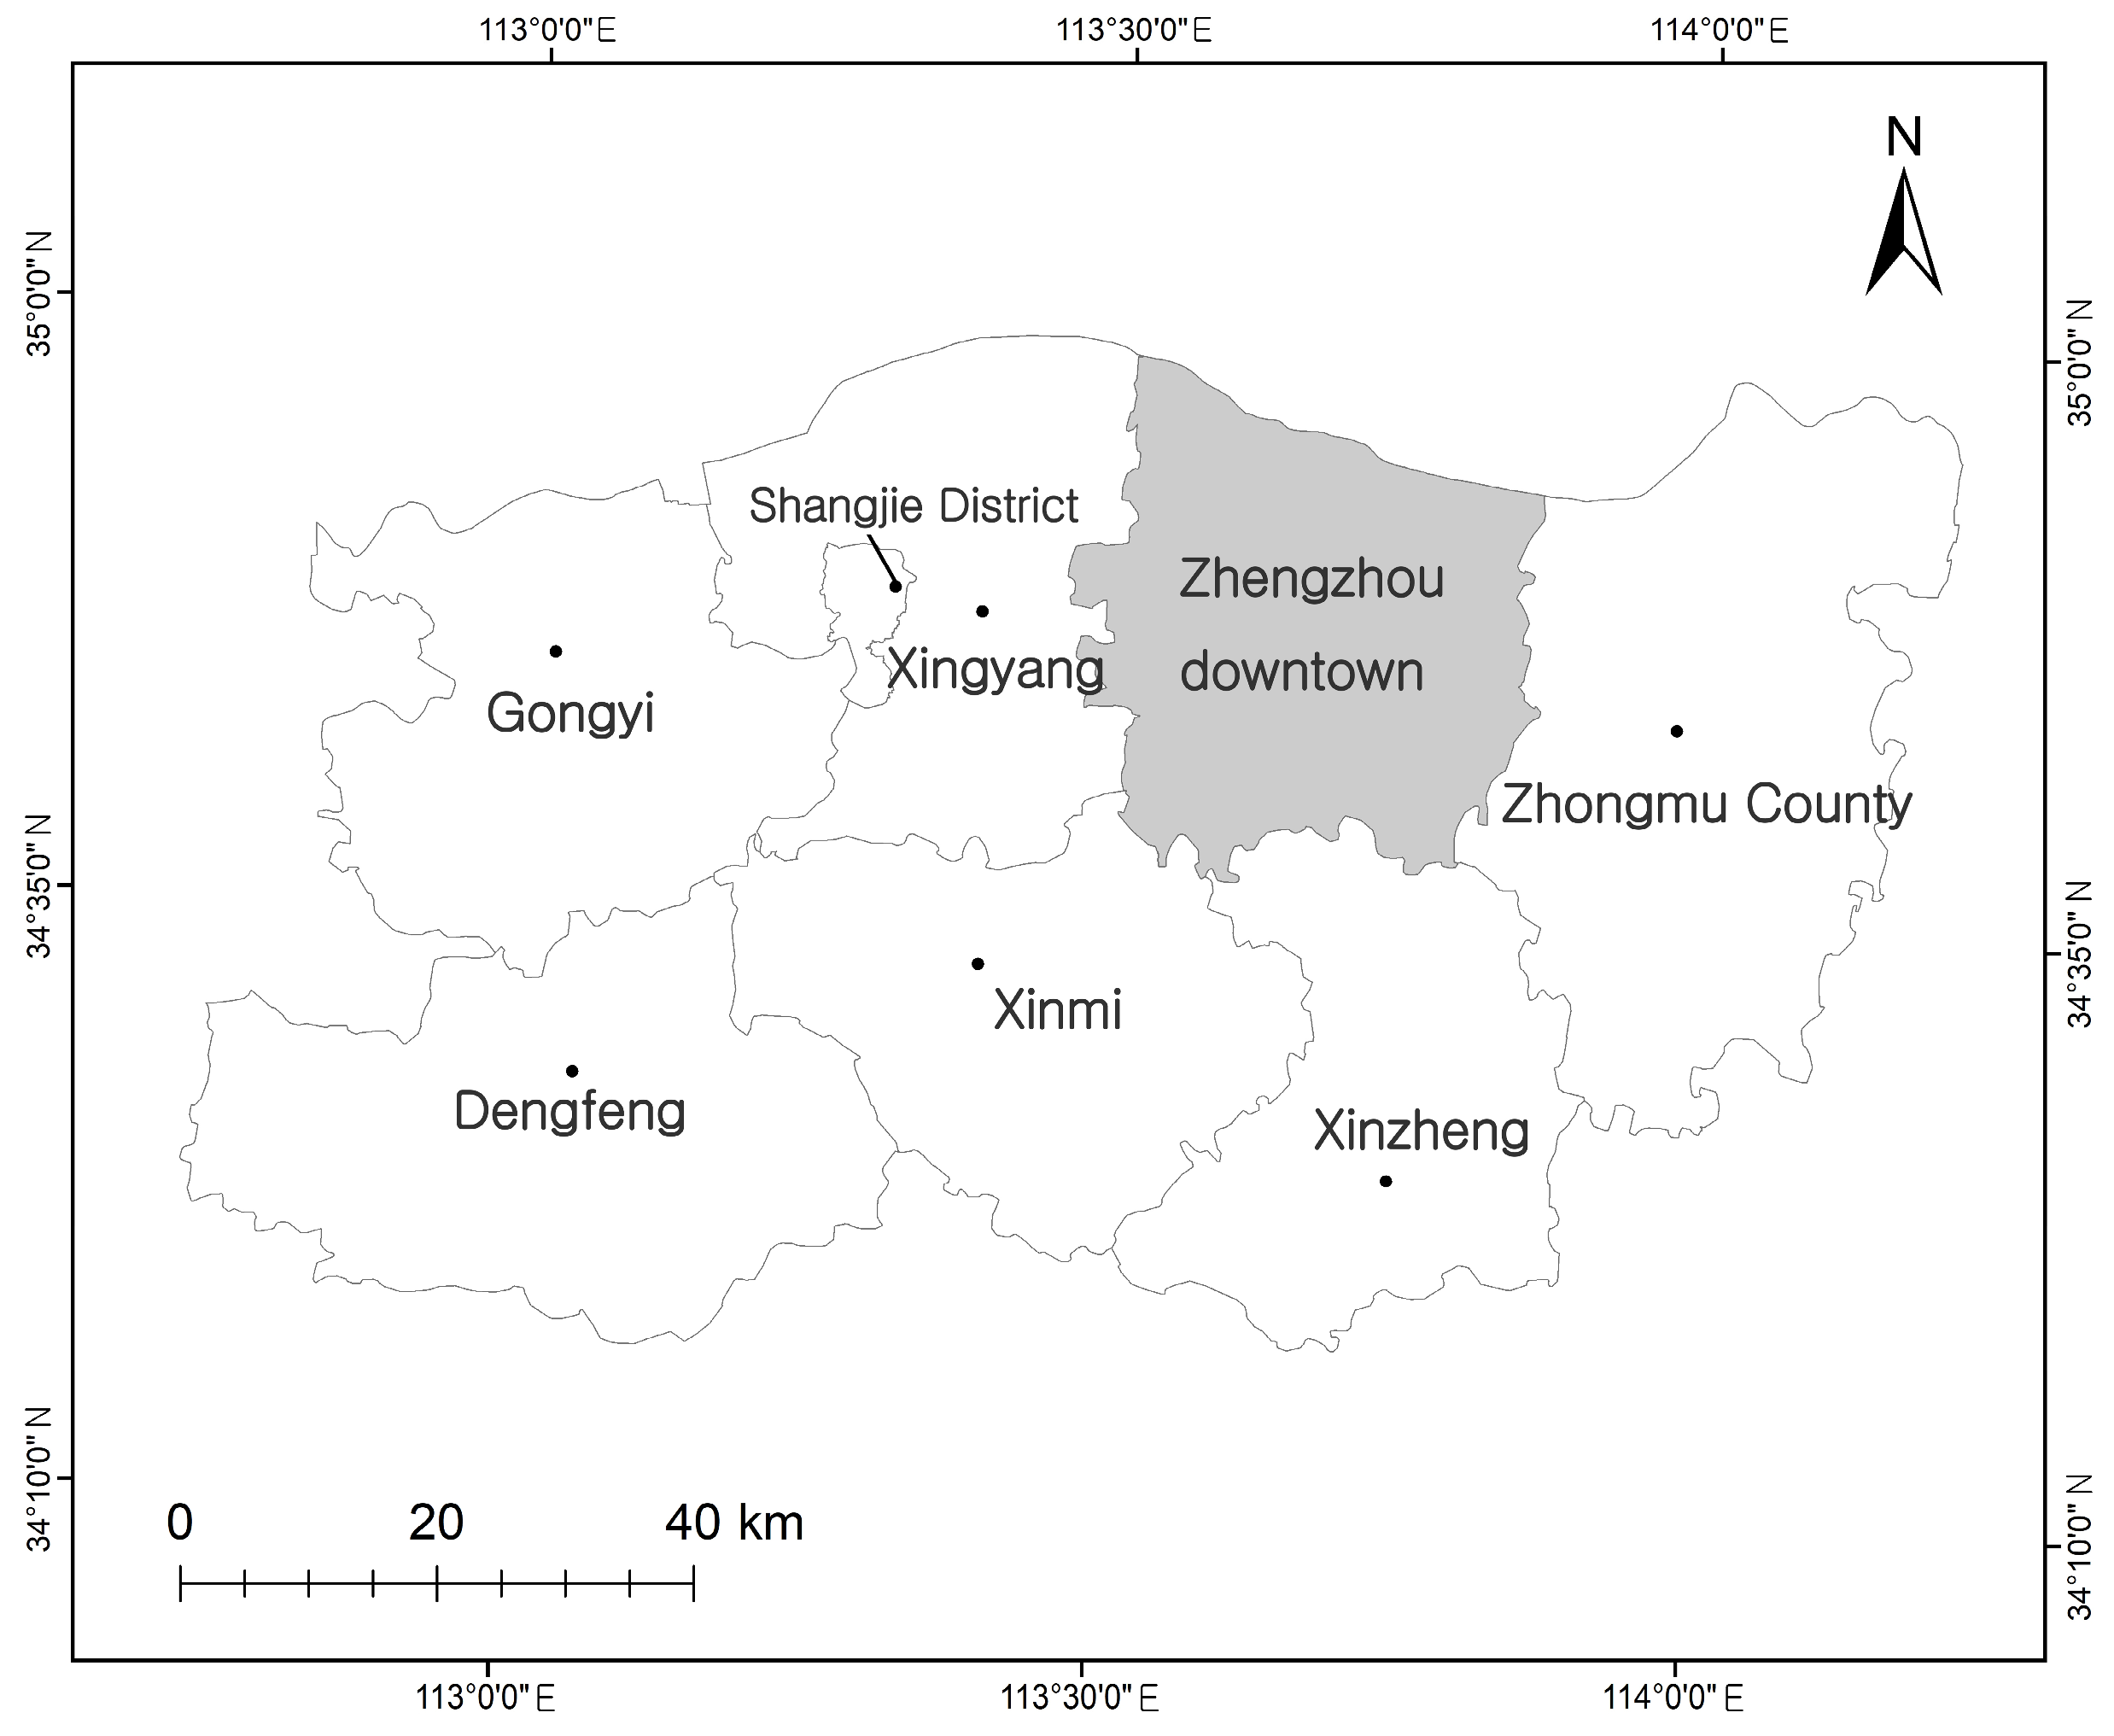
Study Area
2. Materials and Methods
2.1. Datasets
2.1.1. MYD11A2
2.1.2. MCD12Q1
2.2. Ground Surface Temperature
2.3. Urban Heat Island Intensity
2.4. Local Heat Island Intensity (LHII)
3. Results
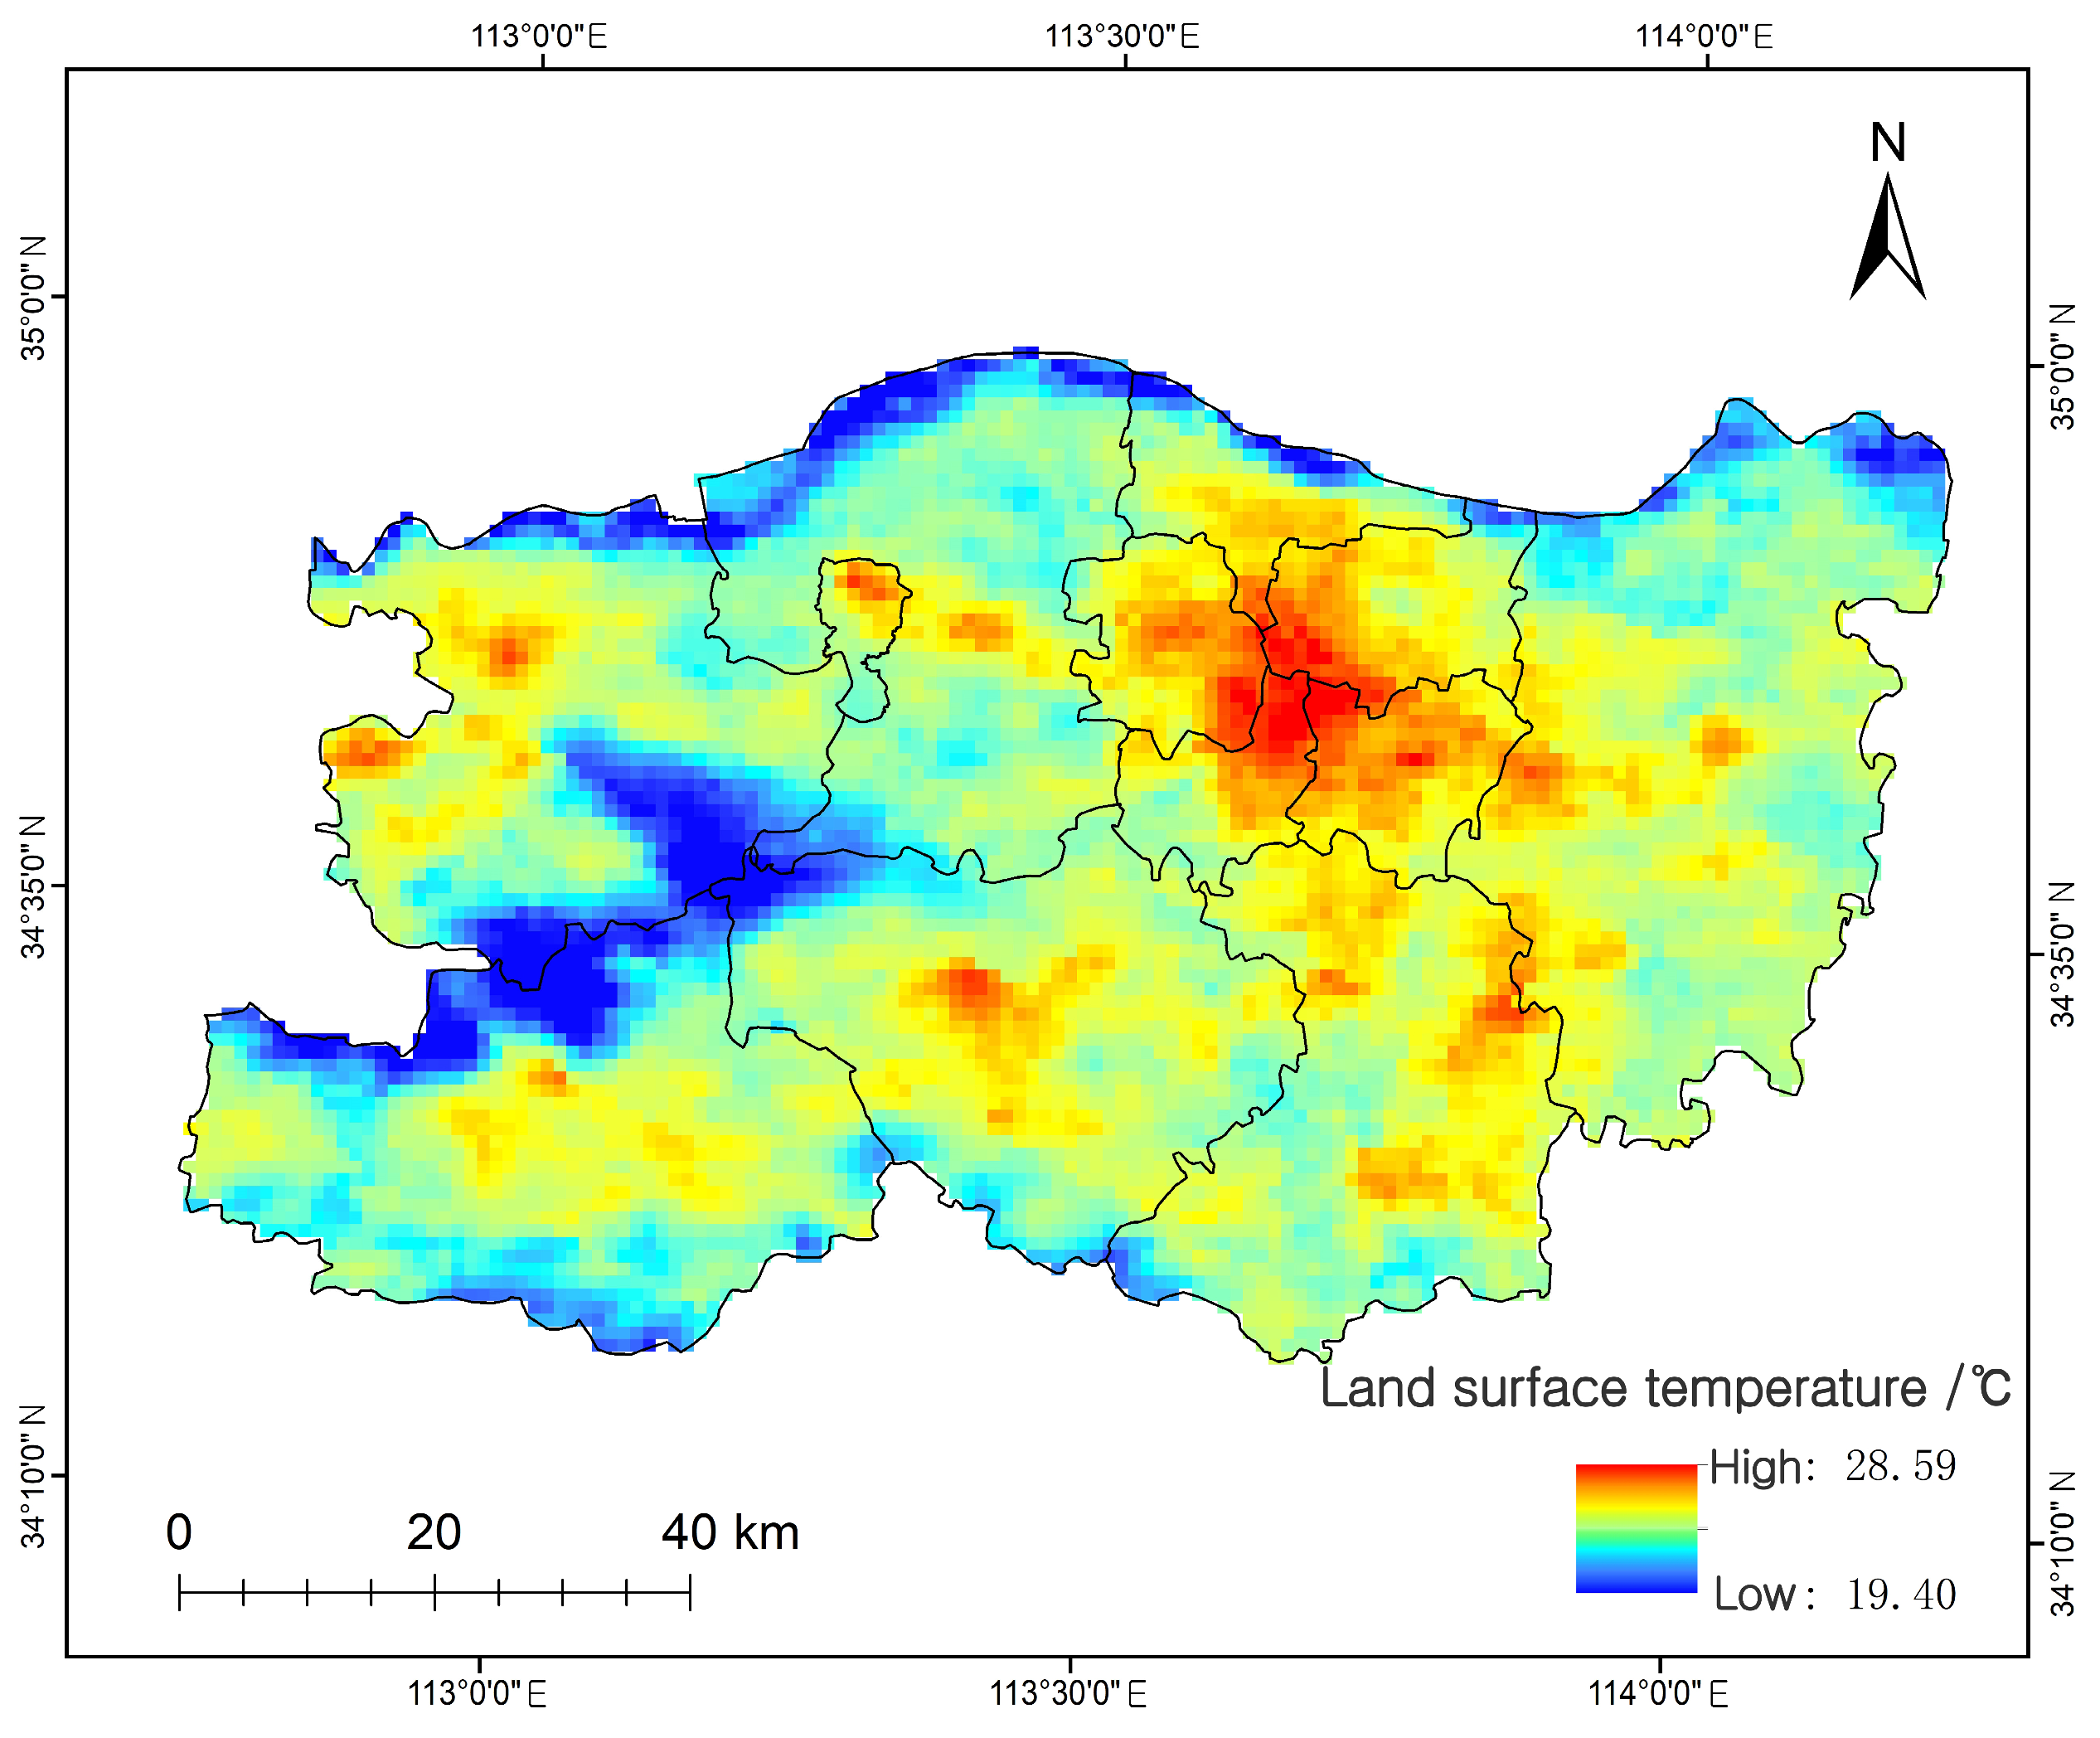
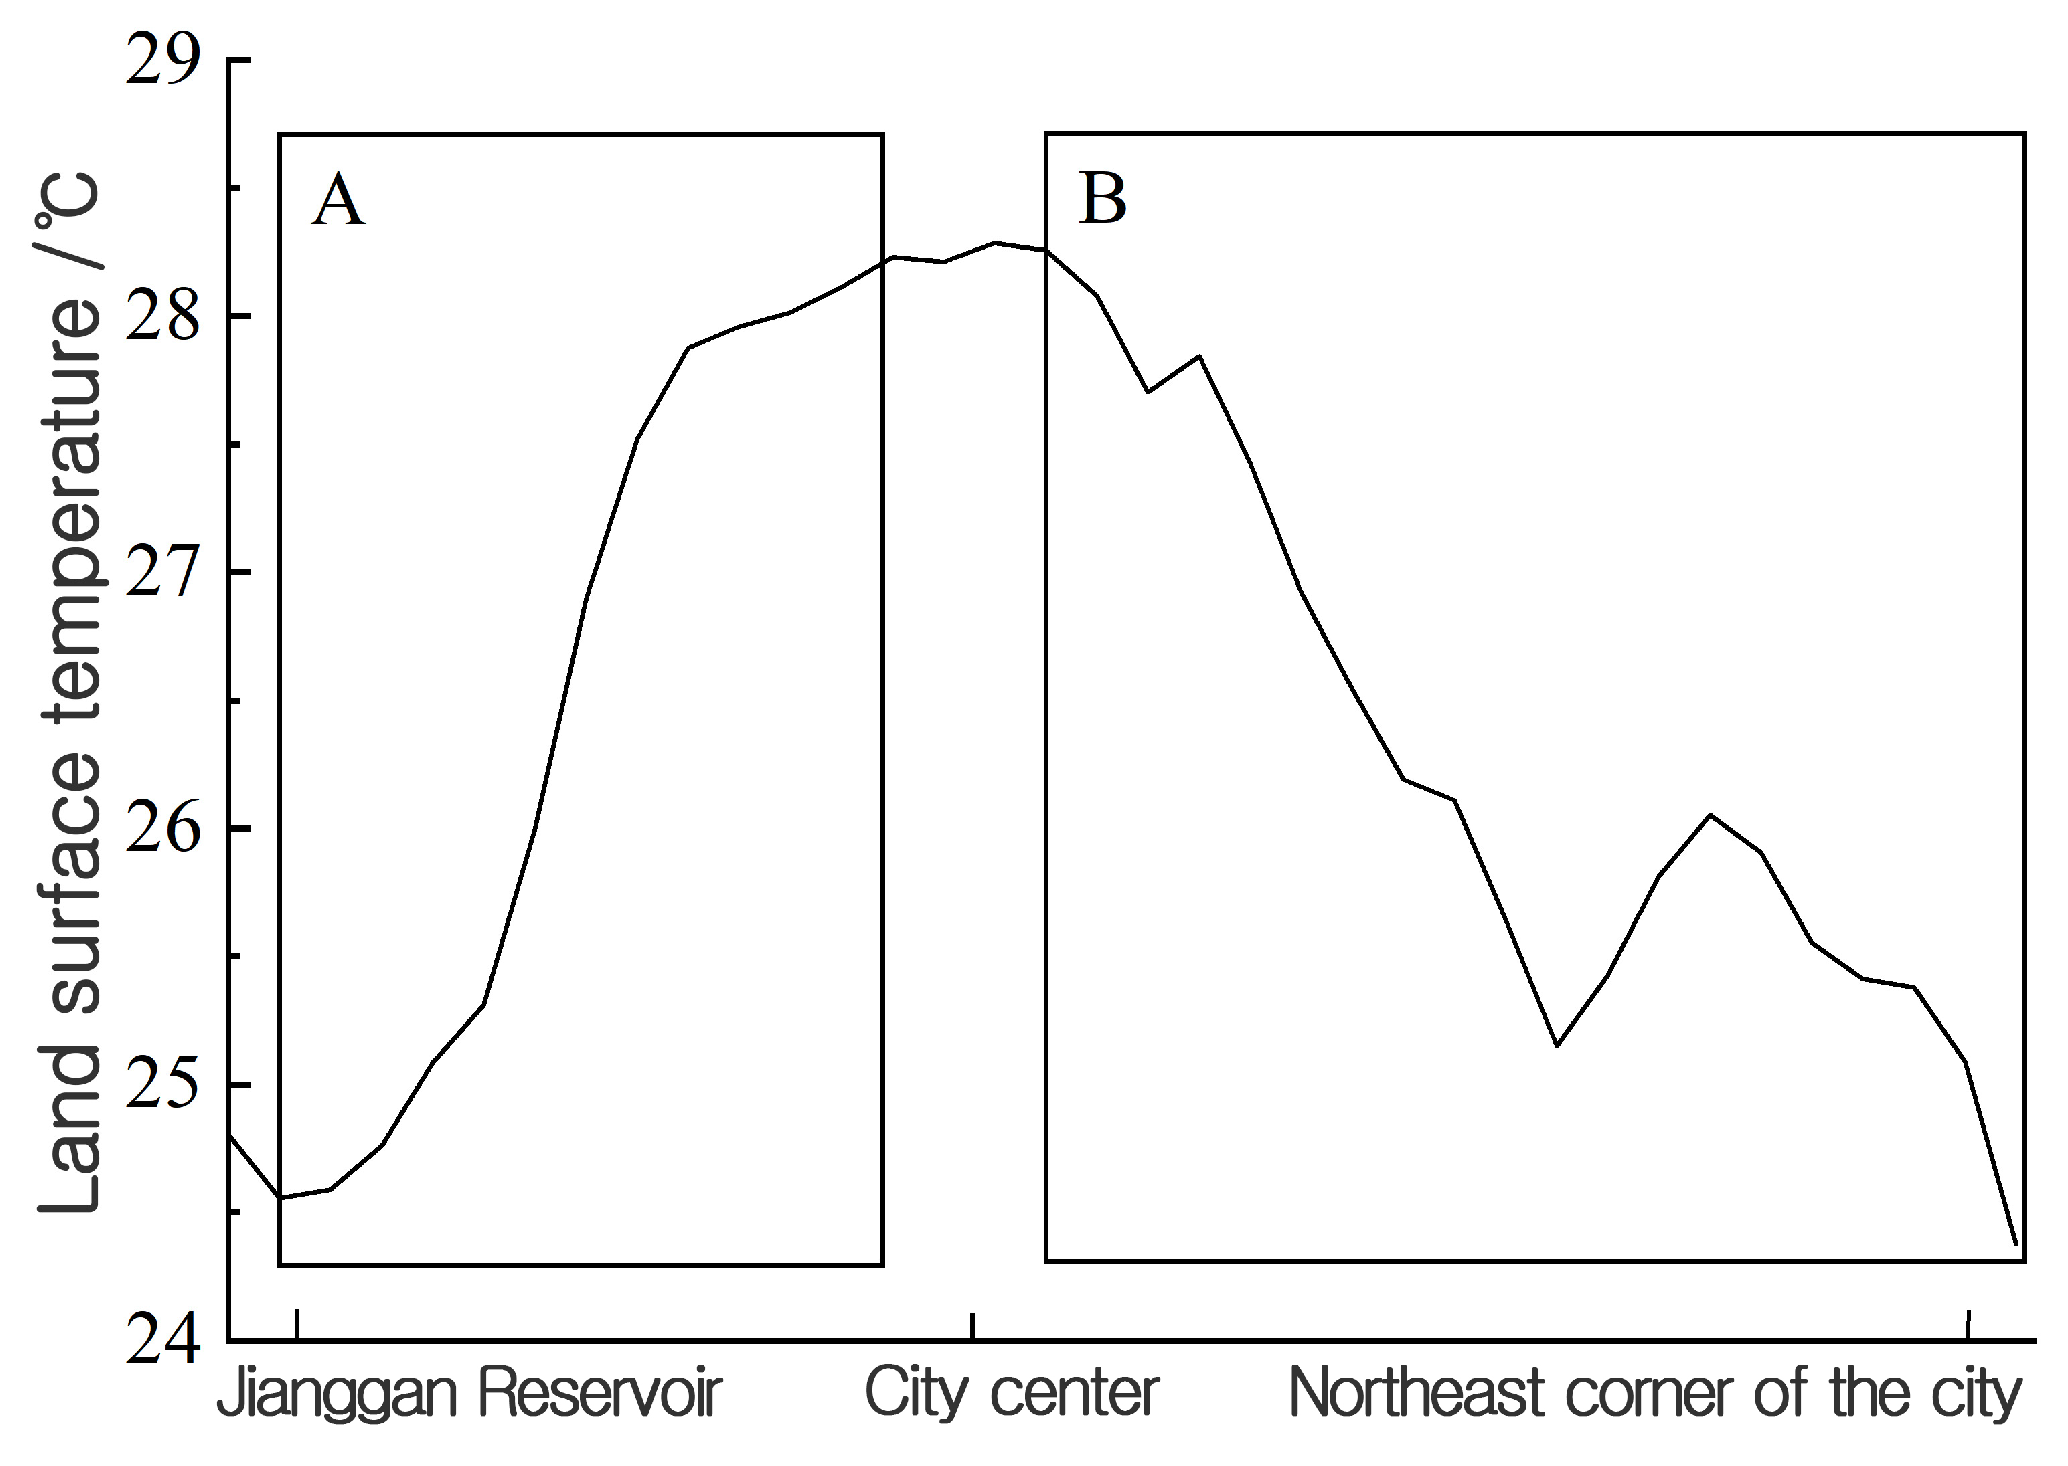
3.1. Current Status of Zhengzhou Heat Island Effect
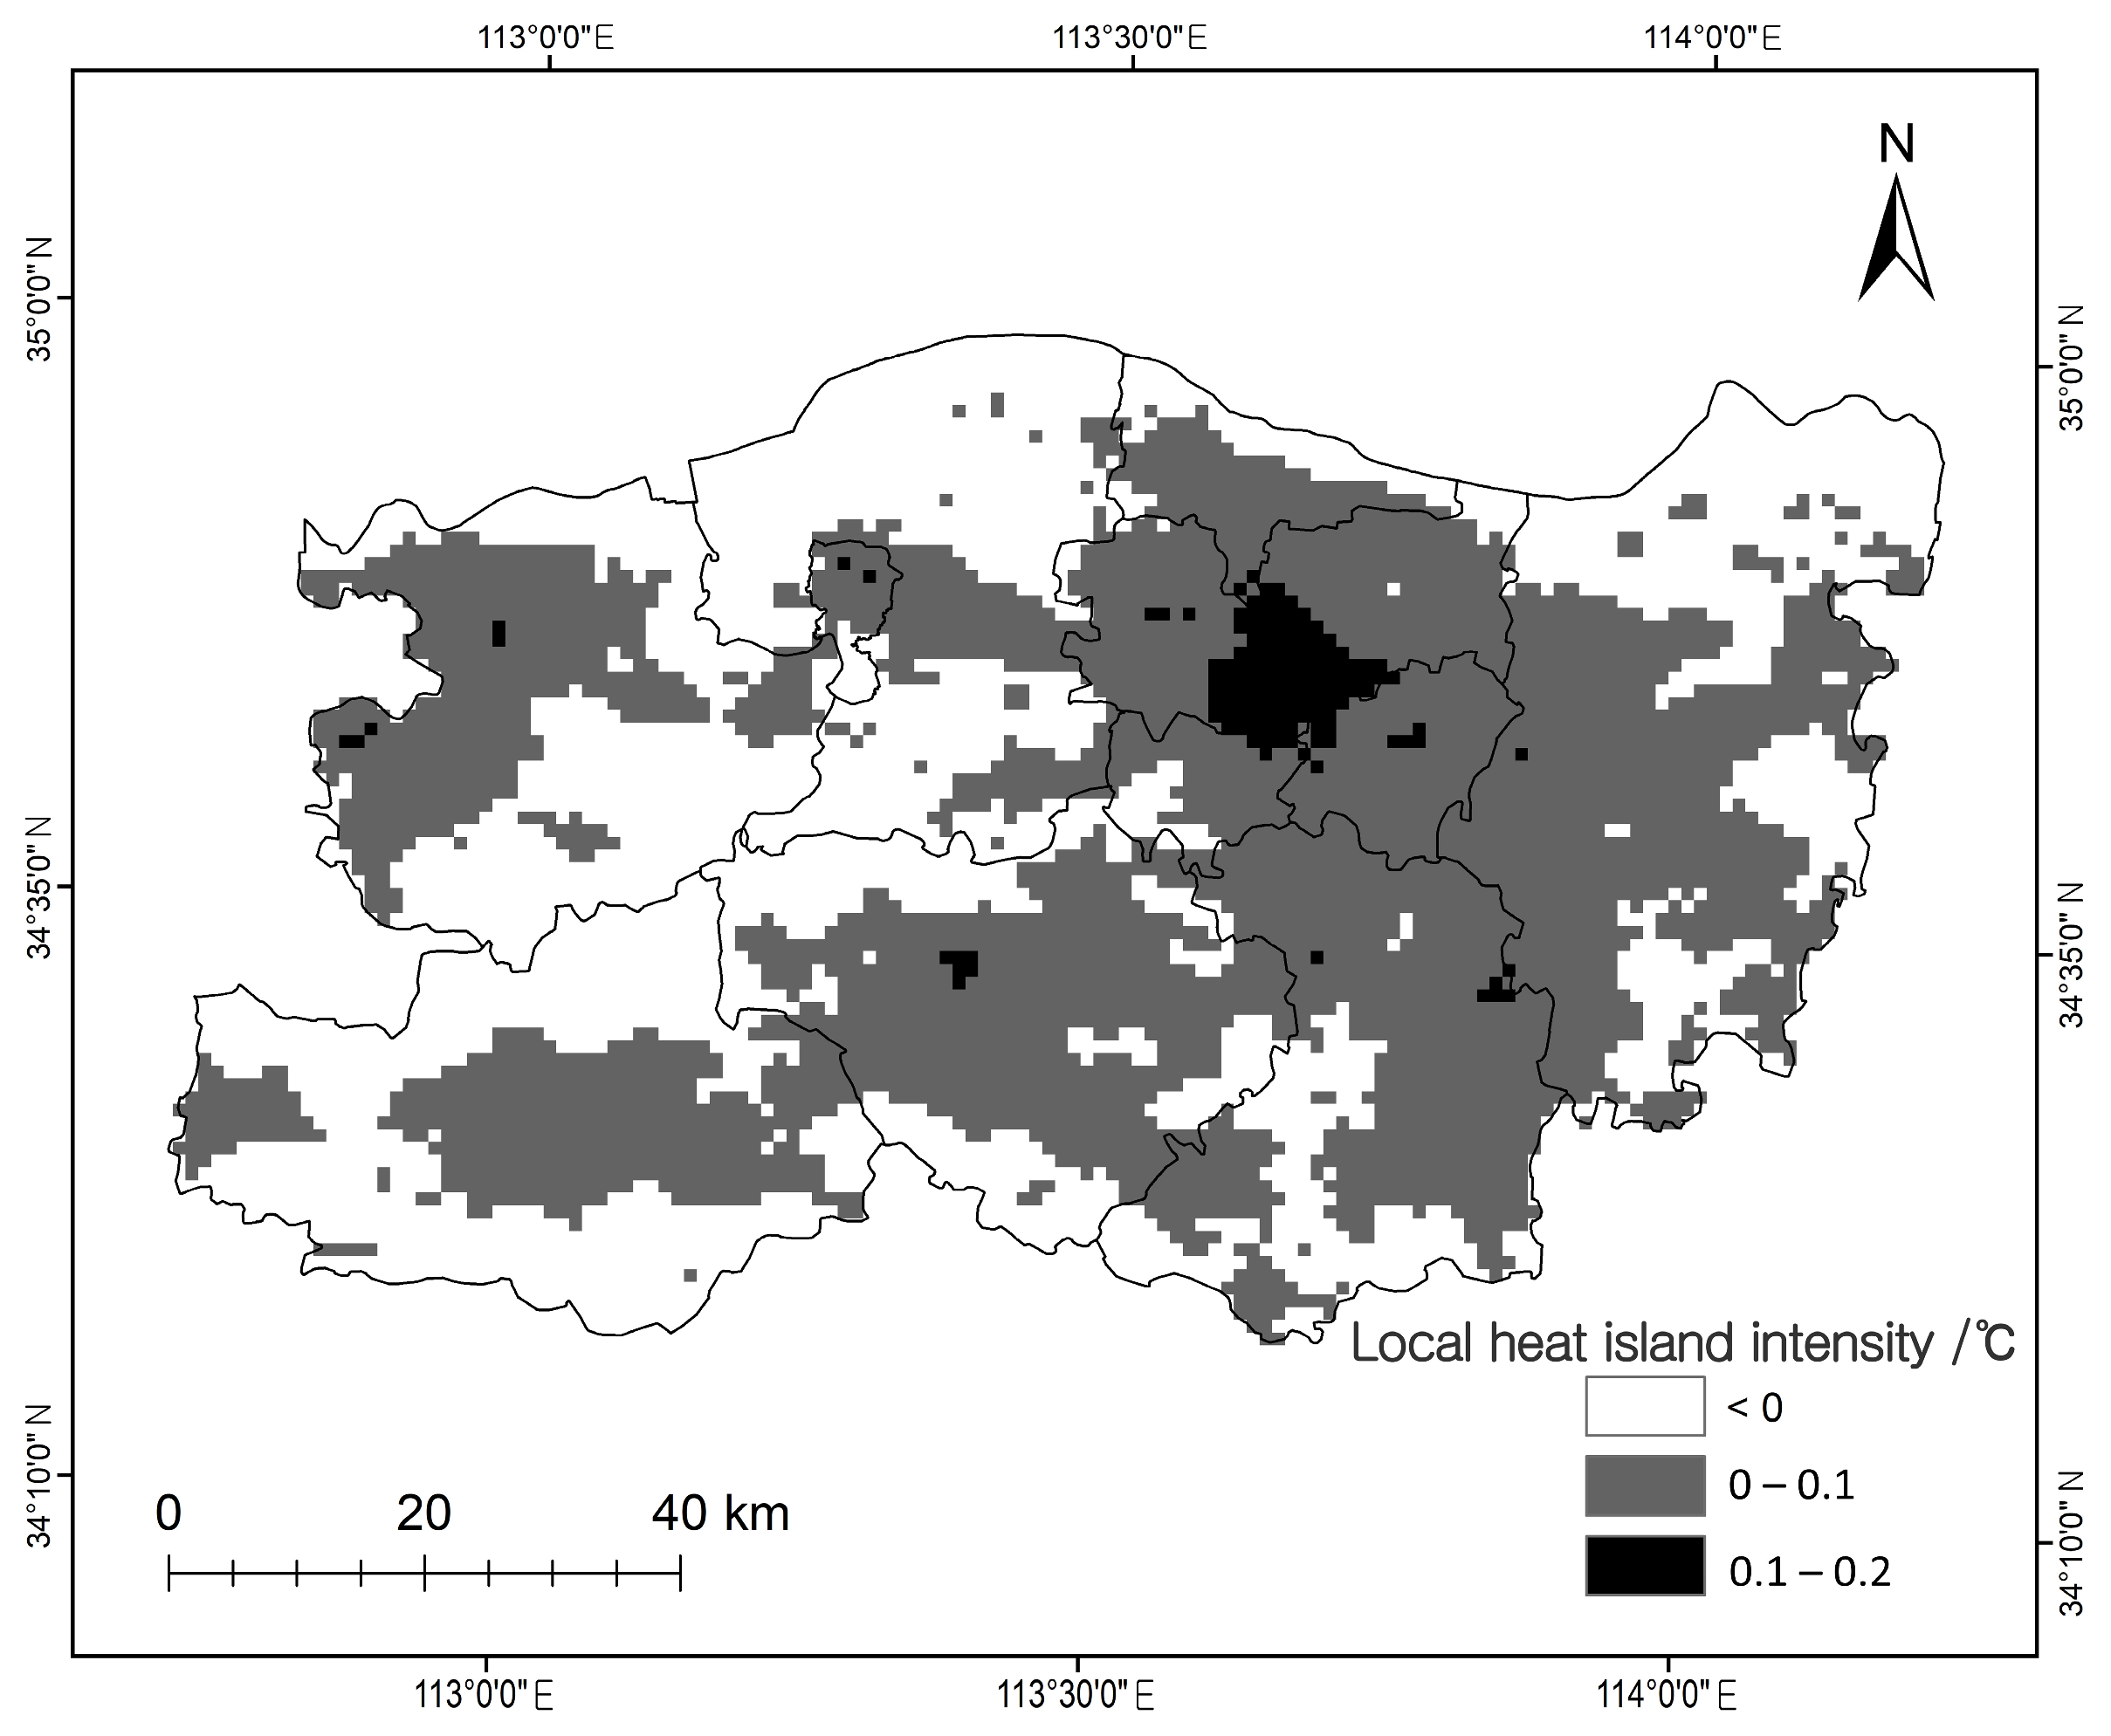
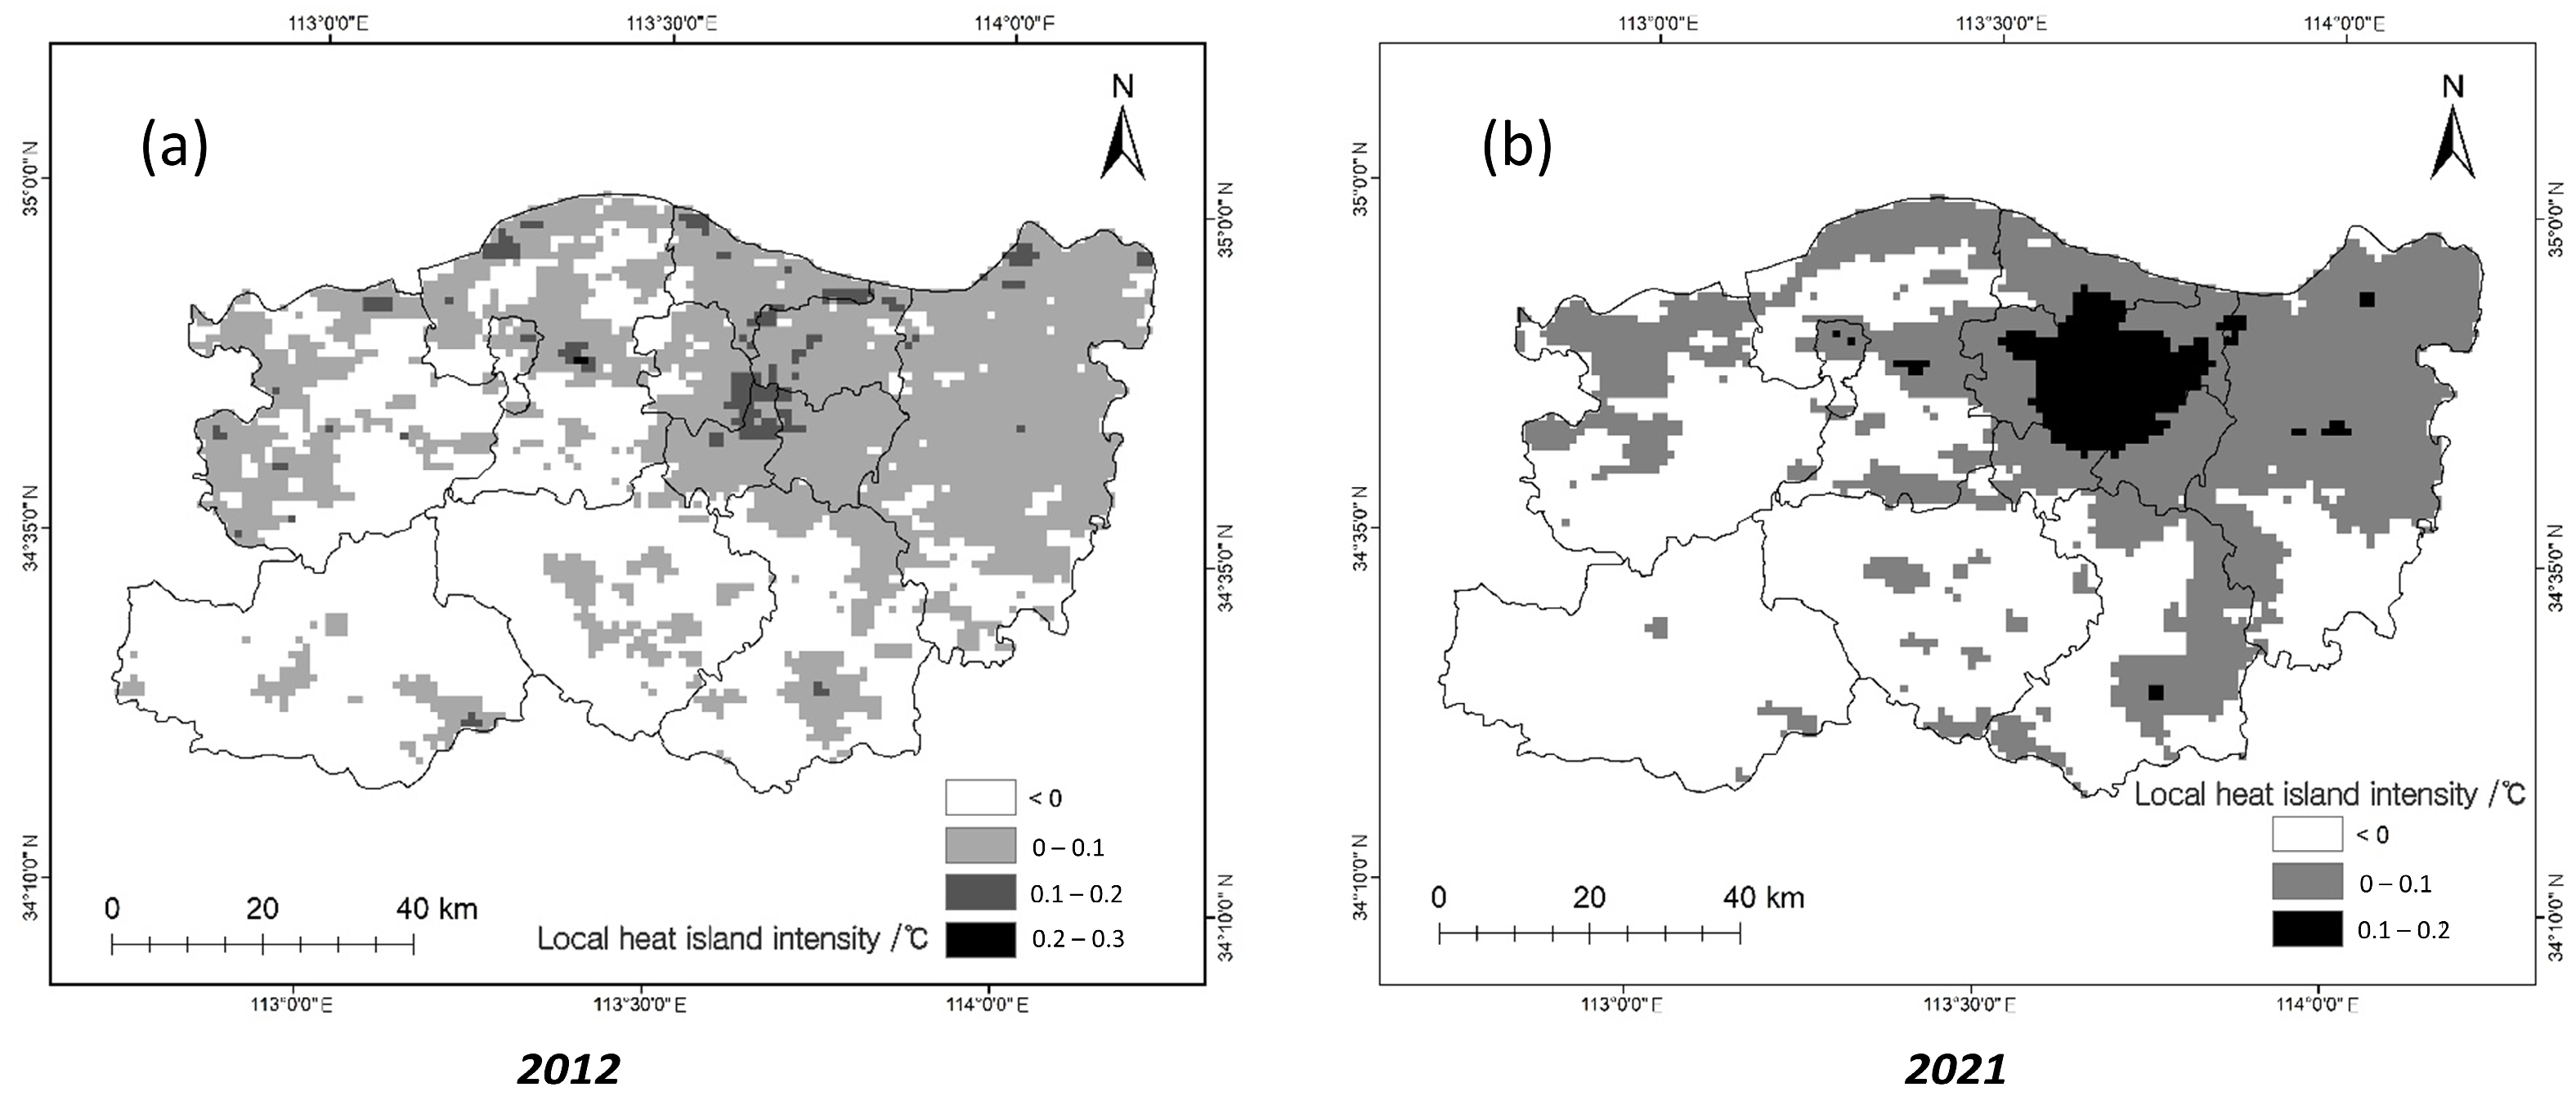
3.2. Local Heat Island Intensity (LHII) Distribution
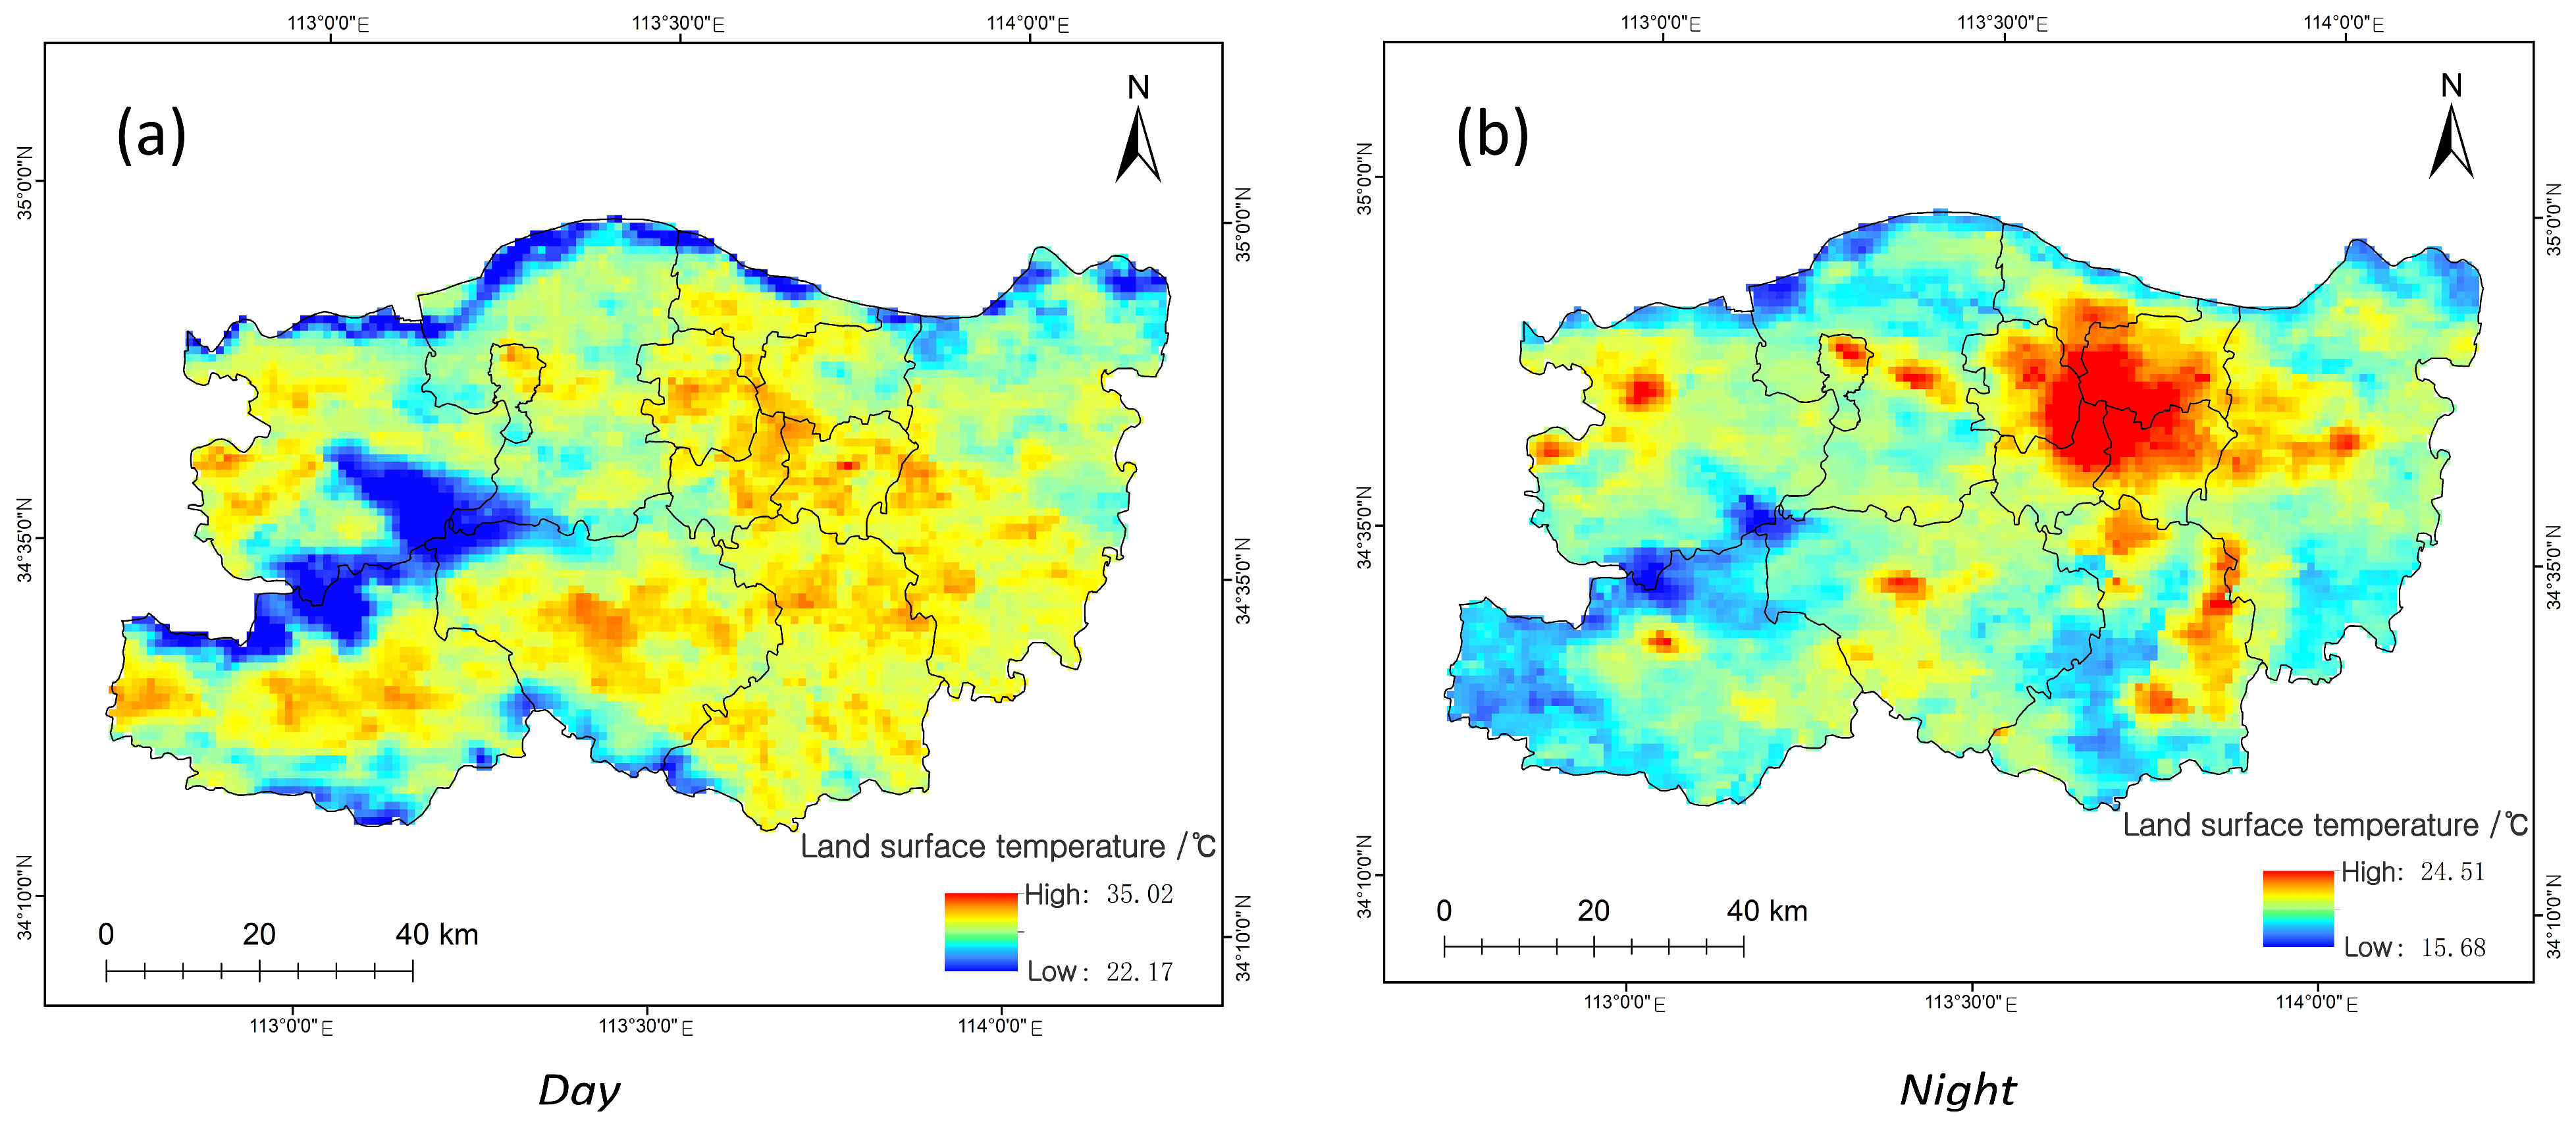
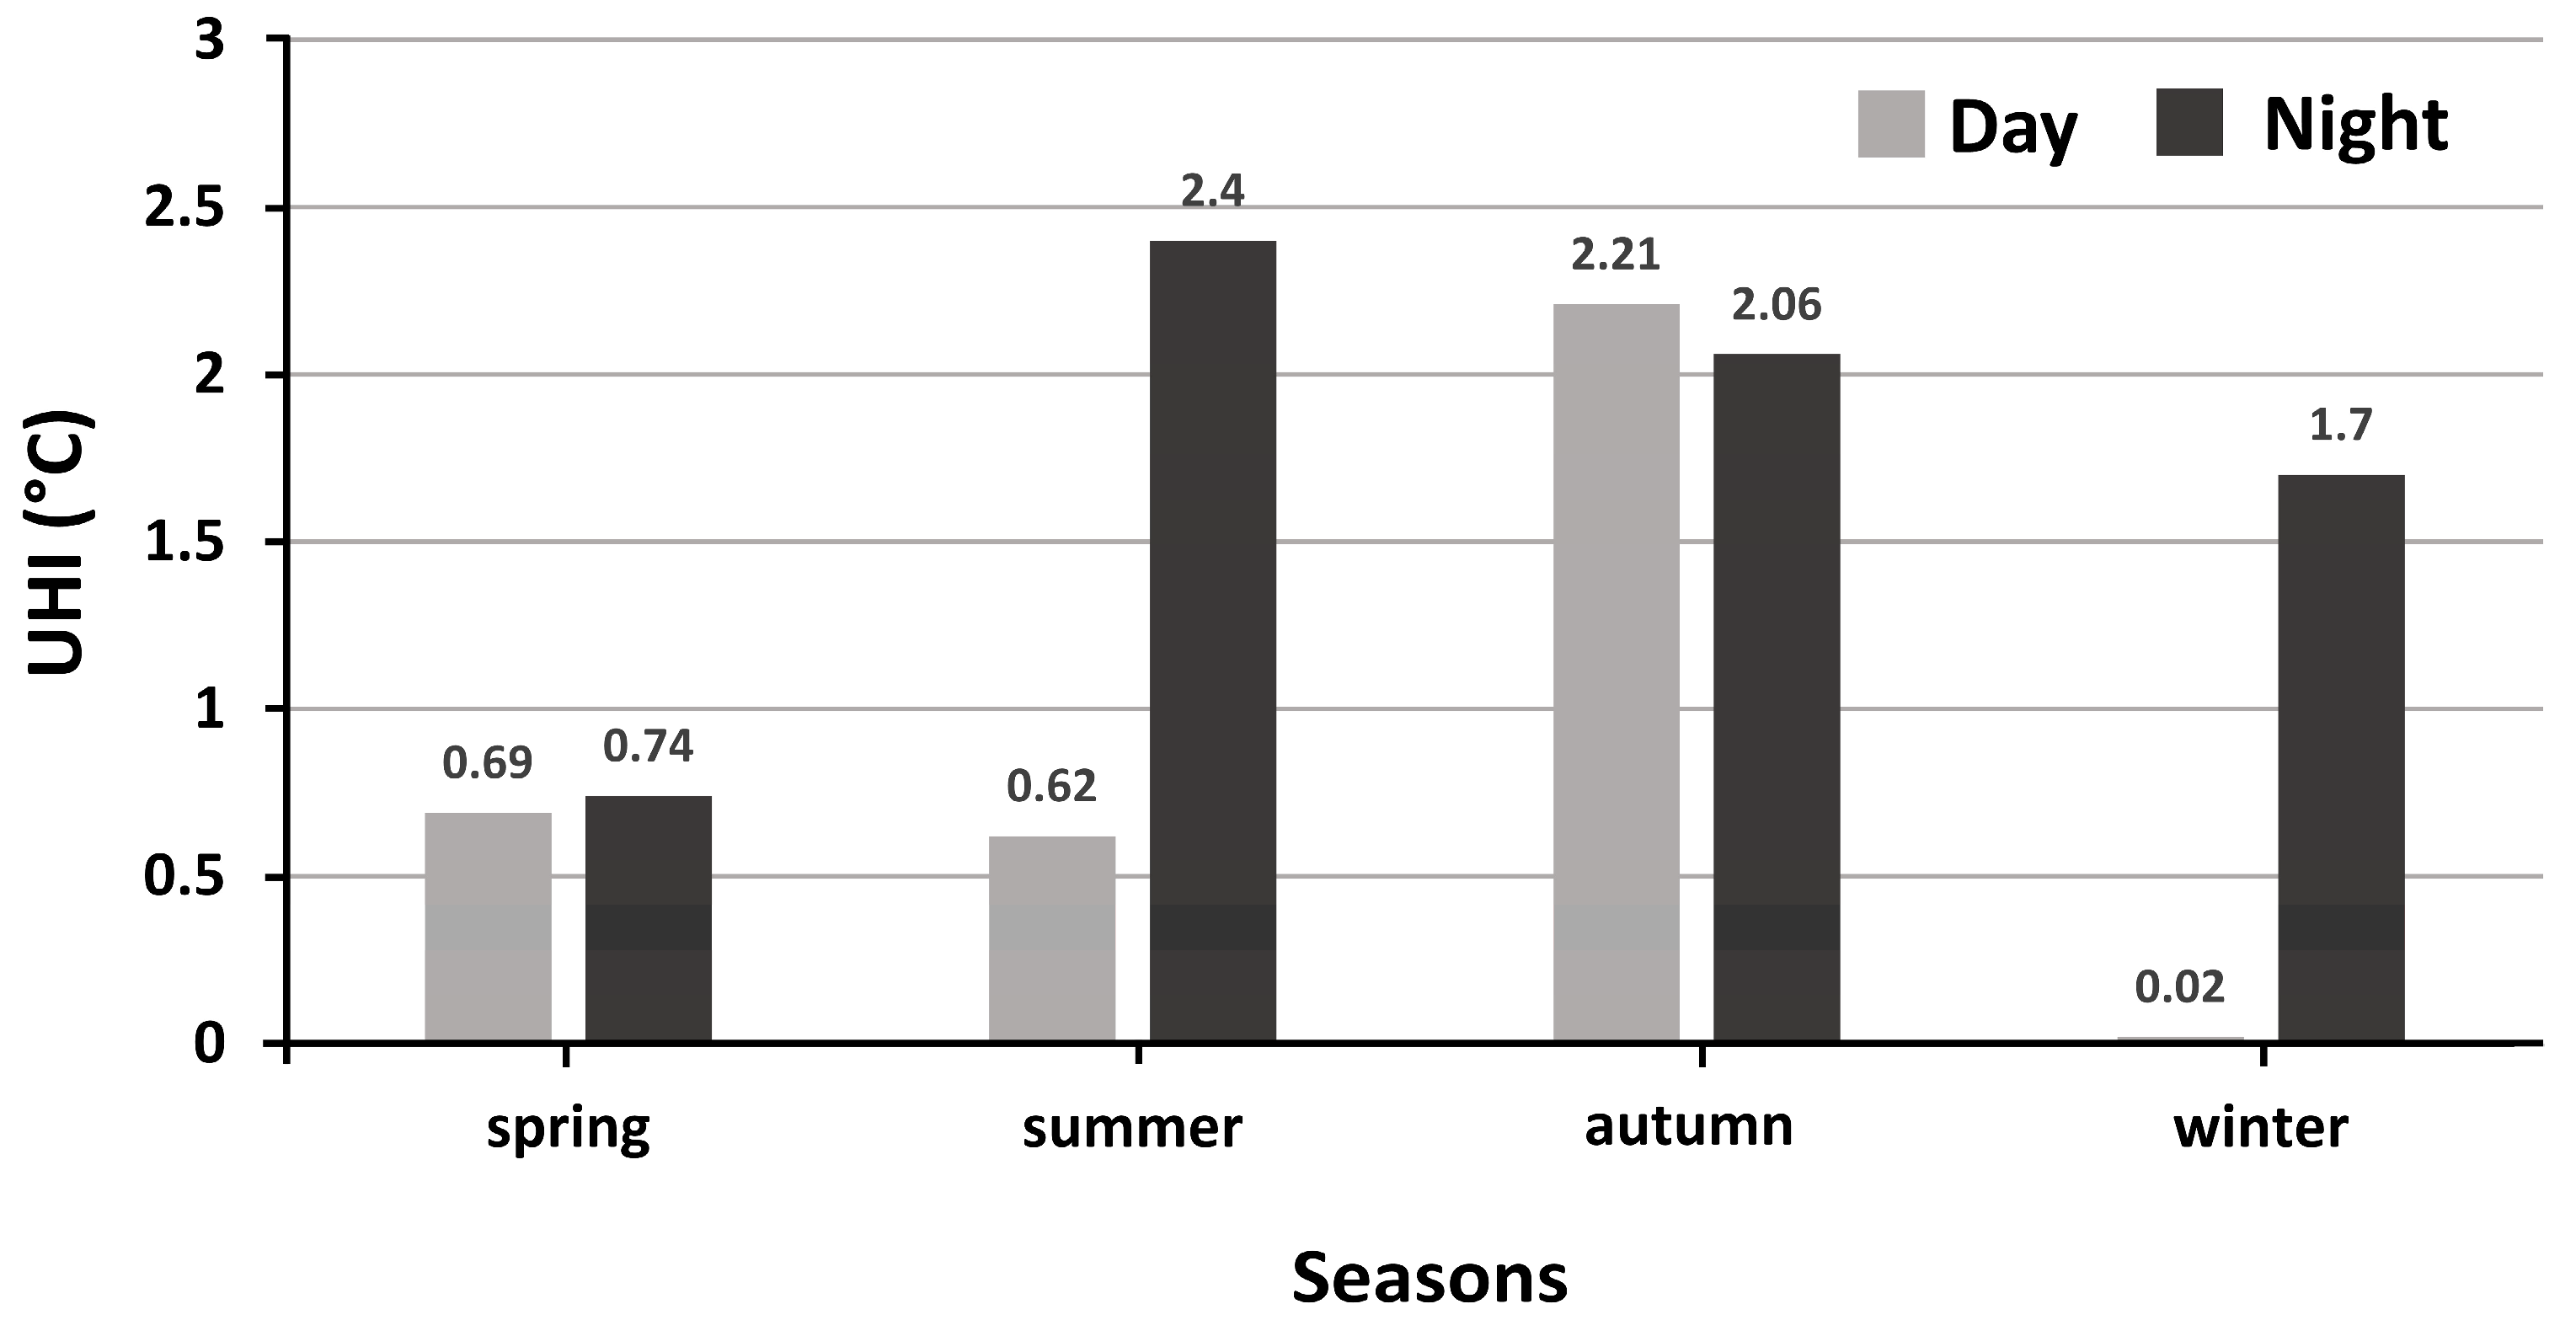
3.3. Day and Night Contrast
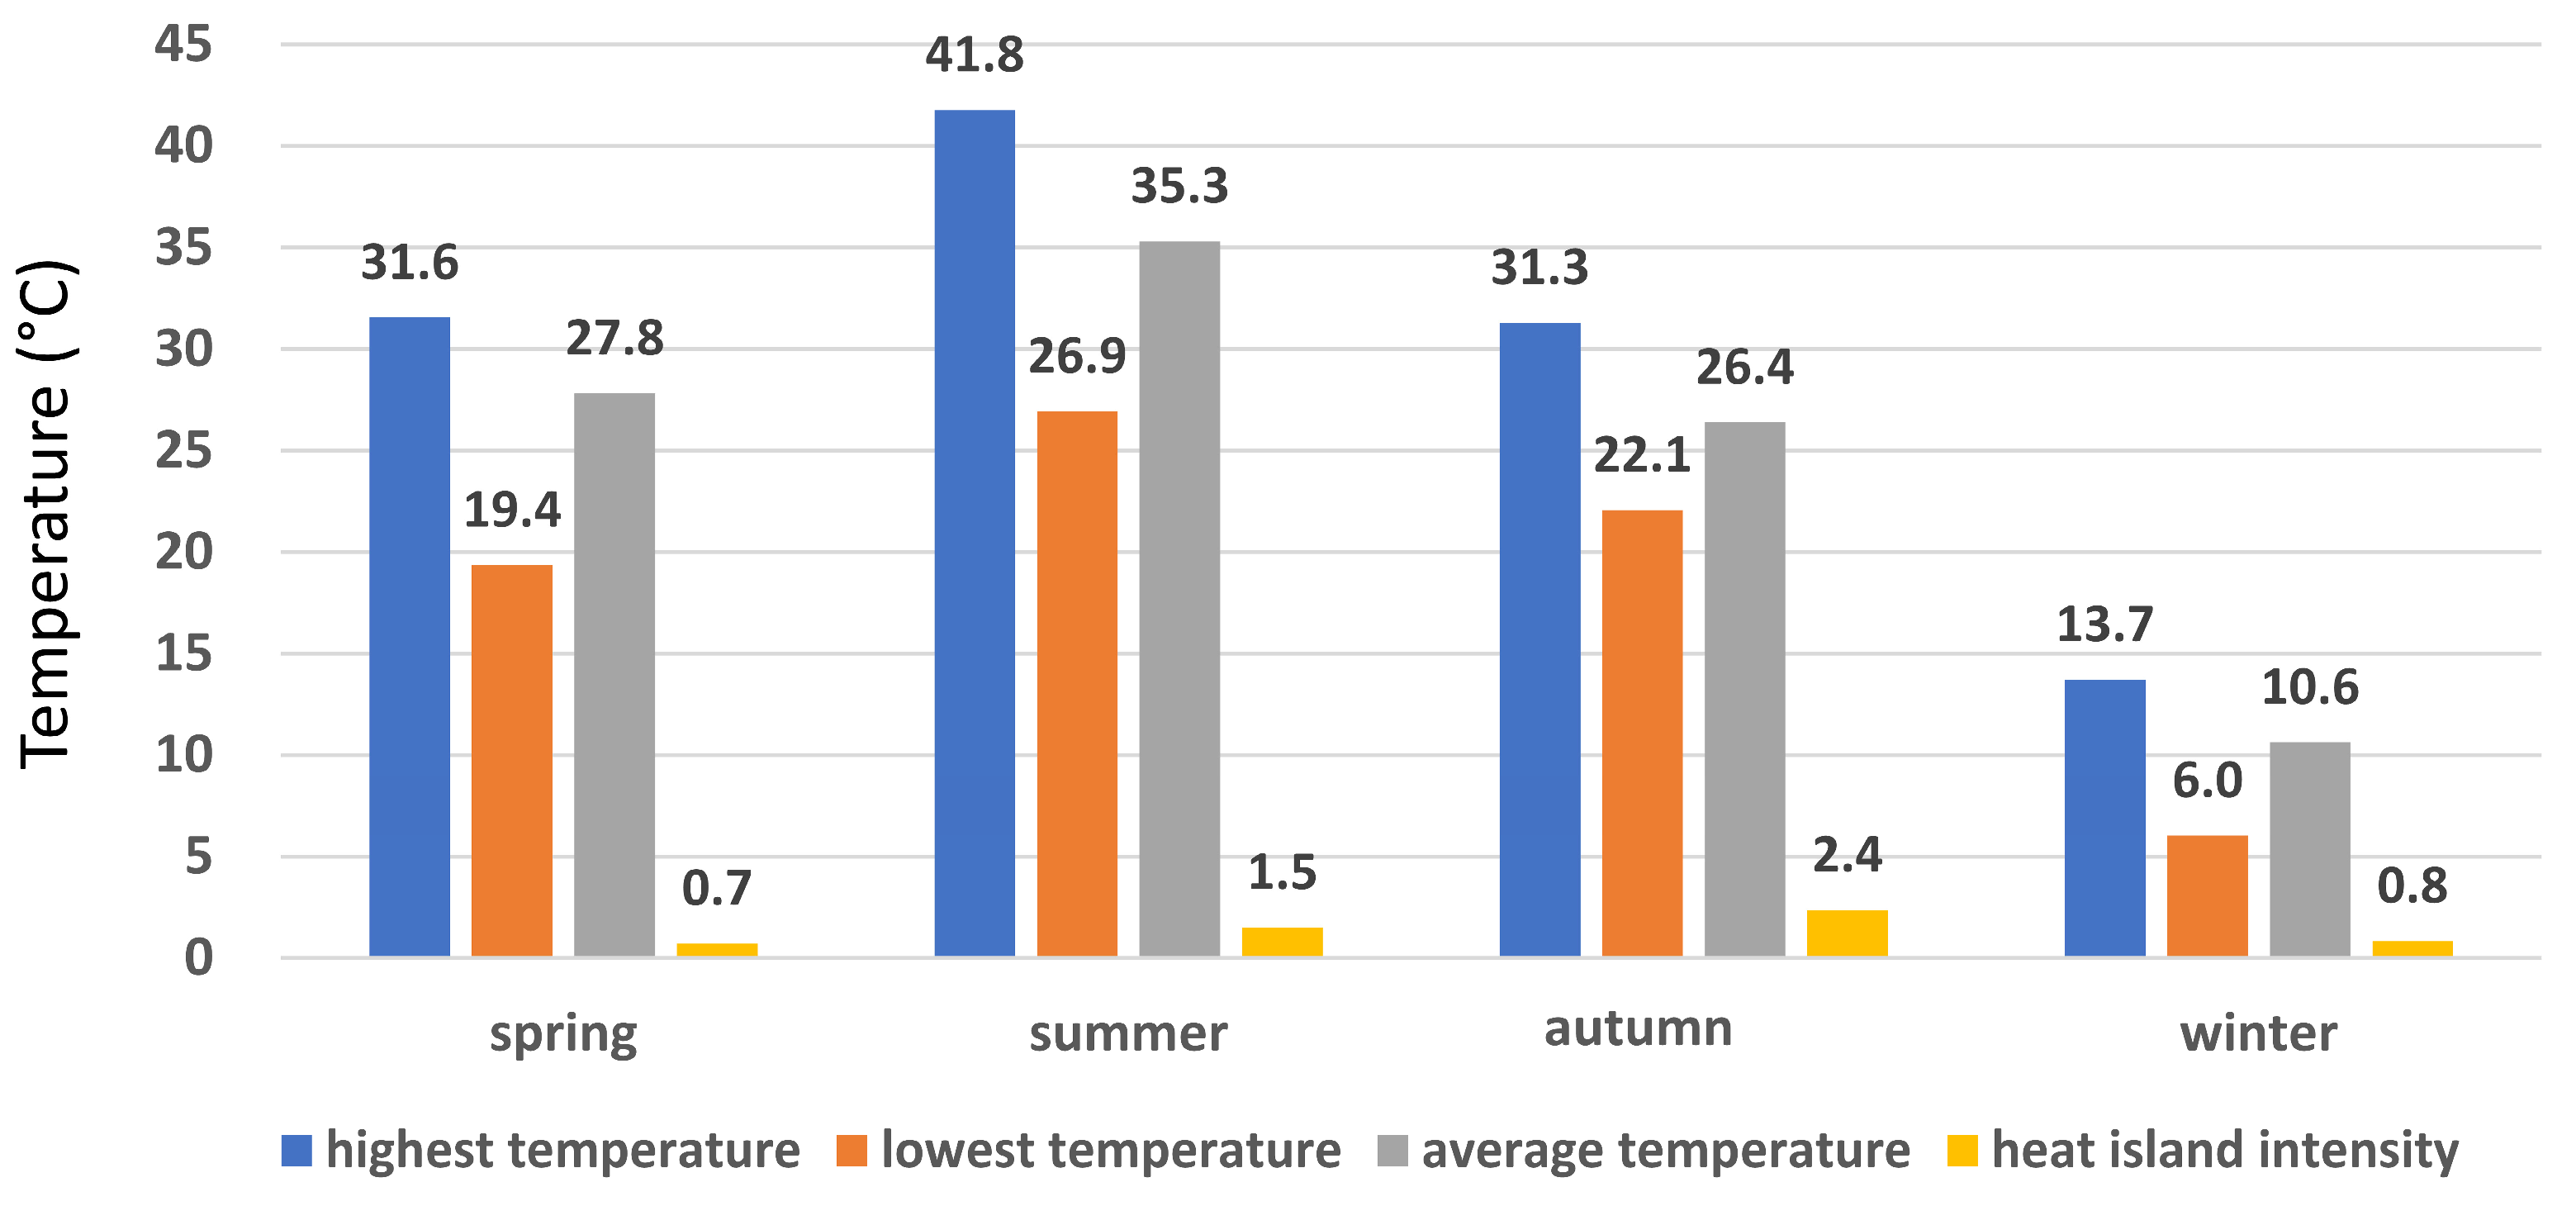
3.4. Change of Seasons
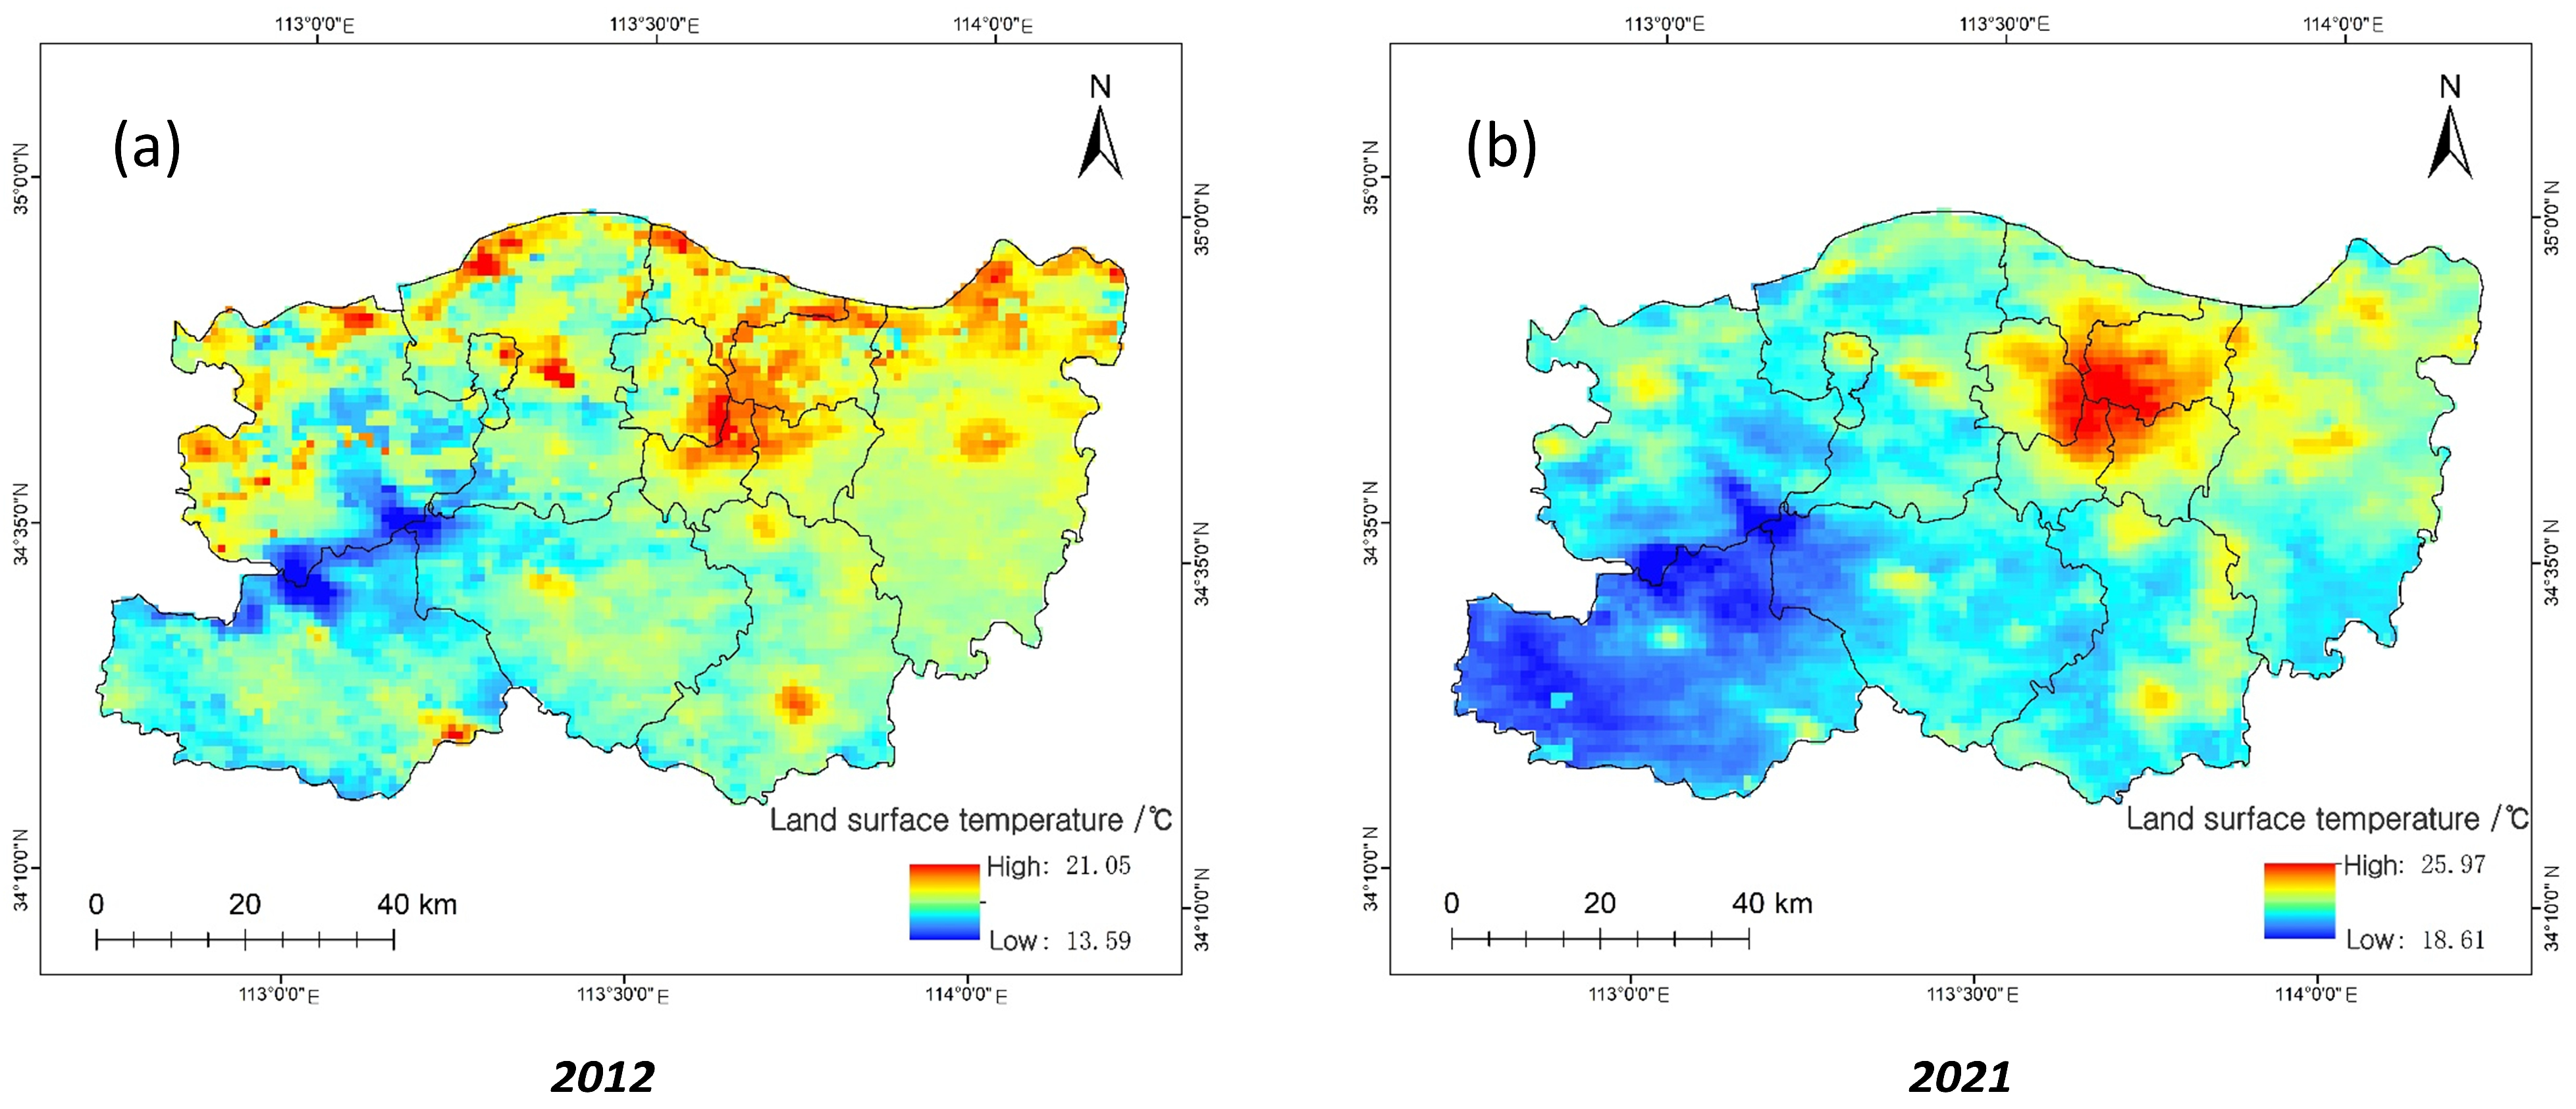
3.5. Interannual Variation
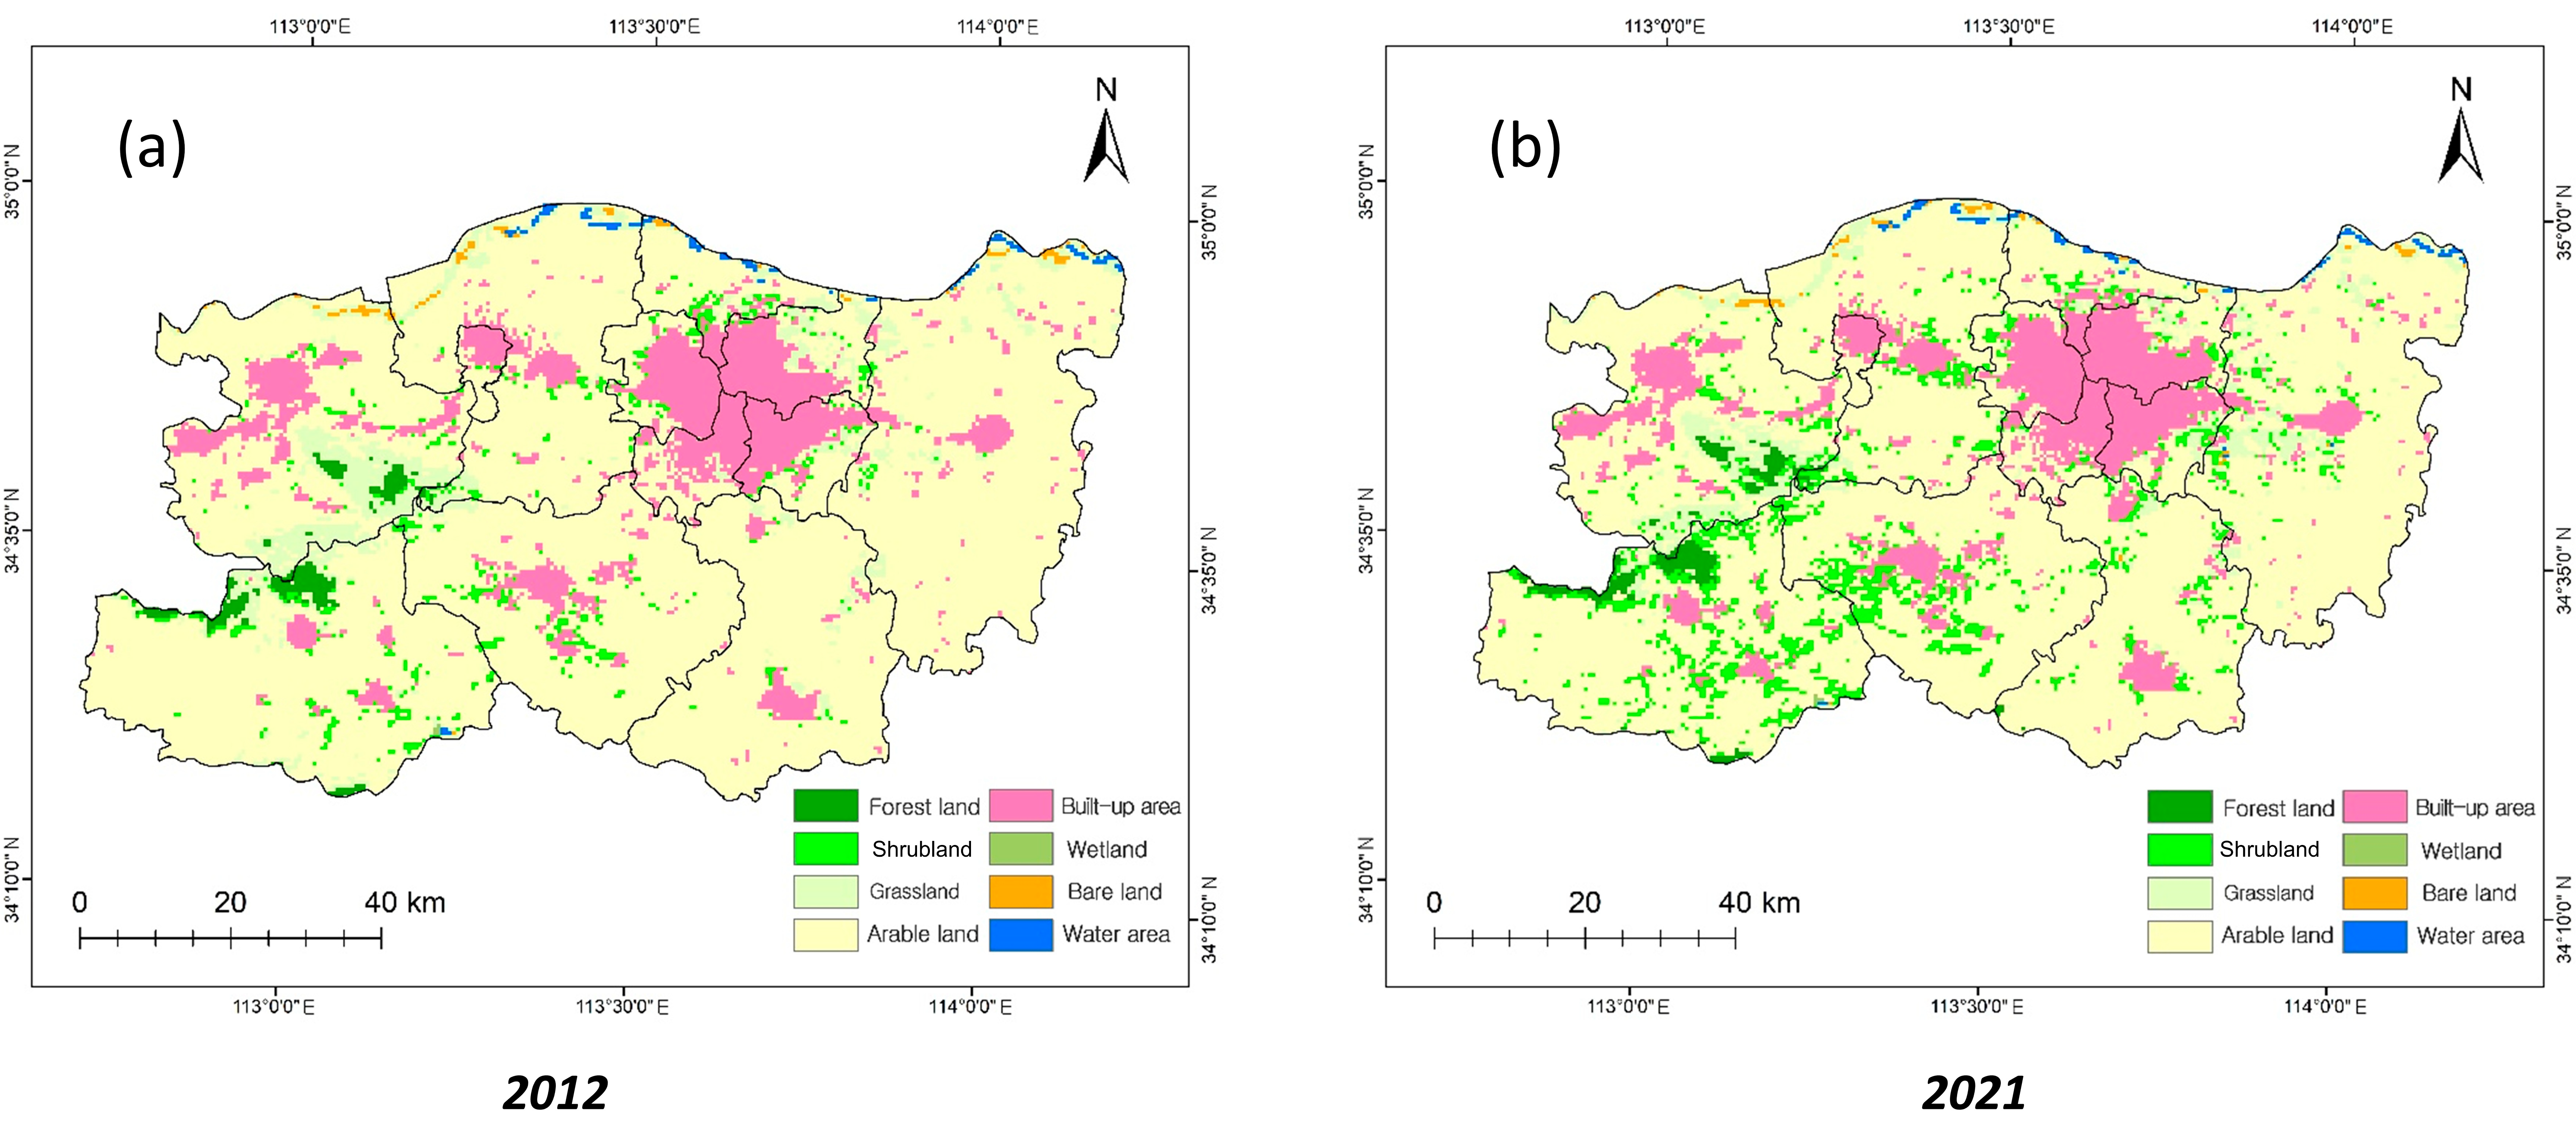
3.6. Spatiotemporal Variation in Land Cover in Zhengzhou
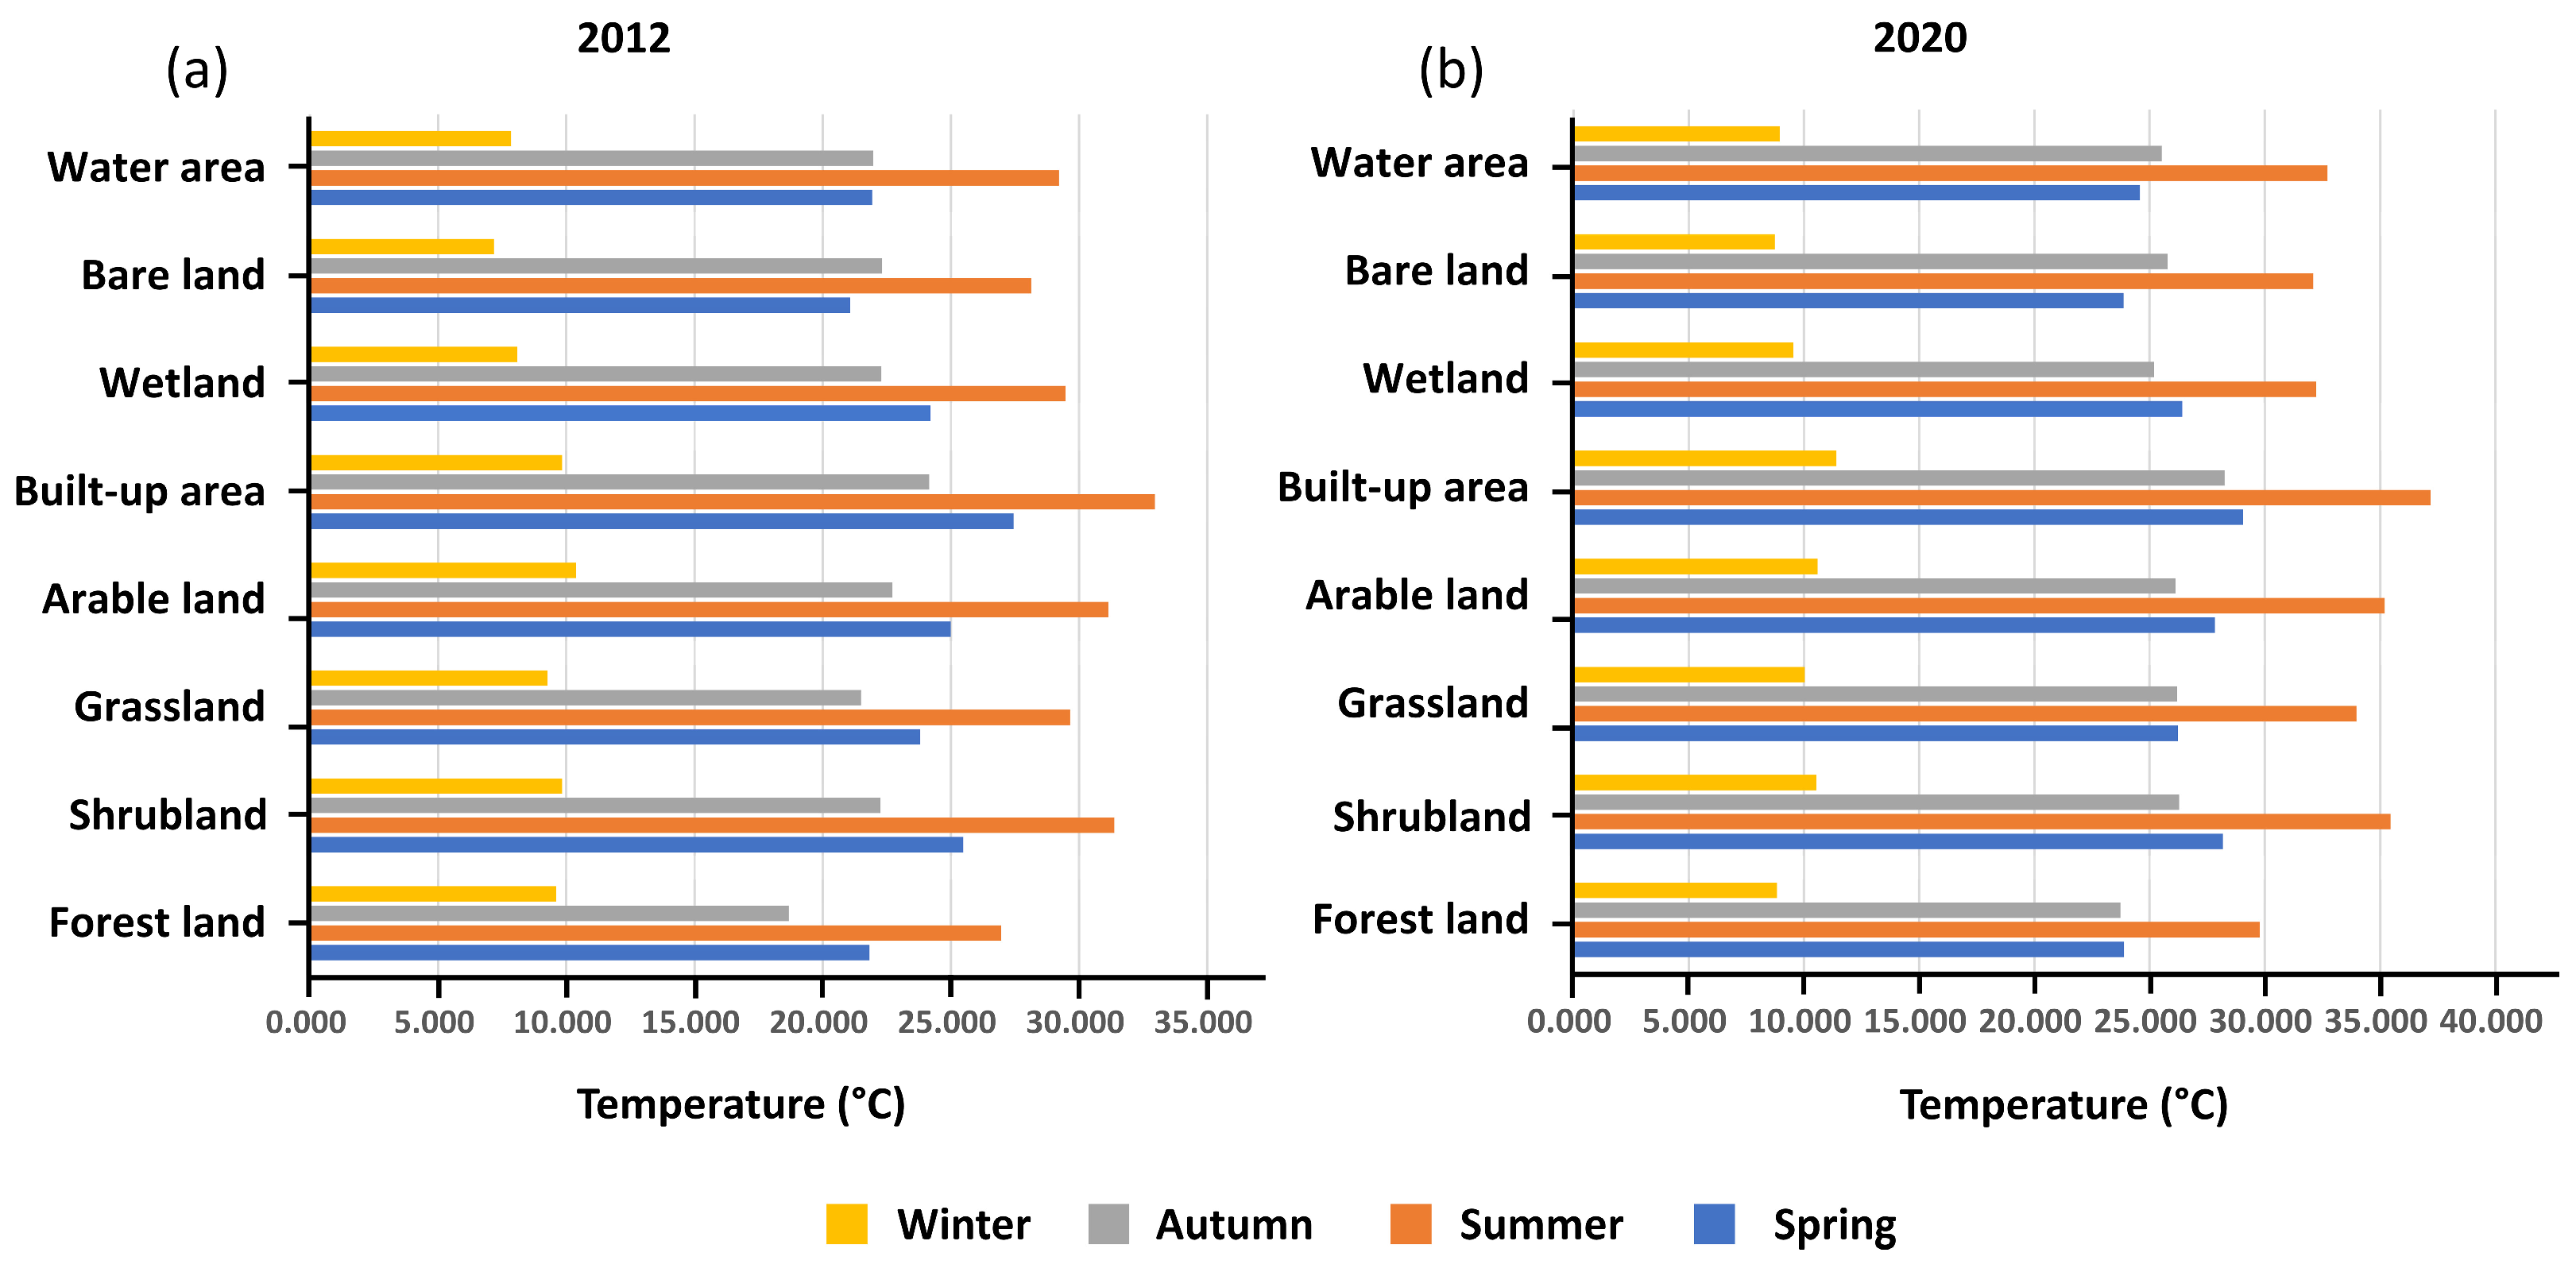
3.7. Annual Changes in Surface Temperature in Different Types of Land Use Areas in Zhengzhou
3.8. LST Variation among Different Land Types in the Four Seasons of 2012 and 2020
4. Discussion
- Emphasize policy guidance: In the future development of cities, urban planners and policymakers should prioritize the construction of cool cities. This entails implementing policies that focus on mitigating the urban heat island effect and promoting sustainable urban environments.
- Enhance urban blue-green infrastructure: It is crucial to invest in the development of urban blue-green infrastructure, as it serves as an urban cool island. The presence of blue-green spaces and the evapotranspiration process they facilitate play a significant role in alleviating the urban thermal environment.
- Increase surface greenery and reflectivity: Efforts should be made to enhance surface greenery, such as incorporating green roofs and vertical greening. Additionally, increasing surface reflectivity through the use of cooling pavement materials and cool infrastructure can help modify the thermal properties of urban areas, leading to a reduction in the urban heat island effect.
- Implement urban heat island monitoring systems: Establish comprehensive urban heat island monitoring systems to continuously assess and analyze temperature variations across different urban zones. These data can provide valuable insights for urban planning and facilitate targeted interventions.
5. Conclusions
Author Contributions
Funding
Institutional Review Board Statement
Informed Consent Statement
Data Availability Statement
Conflicts of Interest
References
- Gu, C.; Wu, L.; Cook, I. Progress in research on Chinese urbanization. Front. Archit. Res. 2012, 1, 101–149. [Google Scholar] [CrossRef] [Green Version]
- Leeson, G.W. The Growth, Ageing and Urbanisation of our World. J. Popul. Ageing 2018, 11, 107–115. [Google Scholar] [CrossRef] [Green Version]
- Lin, Z.; Xu, H. A study of Urban heat island intensity based on “local climate zones”: A case study in Fuzhou, China. In Proceedings of the 2016 4th International Workshop on Earth Observation and Remote Sensing Applications (EORSA), Guangzhou, China, 4–6 July 2016; pp. 250–254. [Google Scholar] [CrossRef]
- Grimm, N.B.; Faeth, S.H.; Golubiewski, N.E.; Redman, C.L.; Wu, J.; Bai, X.; Briggs, J.M. Global change and the ecology of cities. Science 2008, 319, 756–760. [Google Scholar] [CrossRef] [Green Version]
- Deilami, K.; Kamruzzaman, M.; Liu, Y. Urban heat island effect: A systematic review of spatio-temporal factors, data, methods, and mitigation measures School of Earth and Environmental Sciences, The University of Queensland, Australia School of Civil Engineering and Built Environment. Int. J. Appl. Earth Obs. Geoinf. 2018, 67, 30–42. [Google Scholar]
- Wang, J.; Huang, B.; Fu, D.; Atkinson, P.M. Spatiotemporal Variation in Surface Urban Heat Island Intensity and Associated Determinants across Major Chinese Cities. Remote Sens. 2015, 7, 3670–3689. [Google Scholar] [CrossRef] [Green Version]
- Gong, P.; Liang, S.; Carlton, E.J.; Jiang, Q.; Wu, J.; Wang, L.; Remais, J.V. Urbanisation and health in China. Lancet 2012, 379, 843–852. [Google Scholar] [CrossRef]
- Monteiro, F.F.; Gonçalves, W.A.; Andrade, L.D.M.B.; Villavicencio, L.M.M.; Silva, C.M.D.S. Assessment of Urban Heat Islands in Brazil based on MODIS remote sensing data. Urban Clim. 2021, 35, 100726. [Google Scholar] [CrossRef]
- Si, M.; Li, Z.-L.; Nerry, F.; Tang, B.-H.; Leng, P.; Wu, H.; Zhang, X.; Shang, G. Spatiotemporal pattern and long-term trend of global surface urban heat islands characterized by dynamic urban-extent method and MODIS data. ISPRS J. Photog. Remote Sens. 2022, 183, 321–335. [Google Scholar] [CrossRef]
- Zhang, Y.; Zhang, J.; Zhang, X.; Zhou, D.; Gu, Z. Analyzing the Characteristics of UHI (Urban Heat Island) in Summer Daytime Based on Observations on 50 Sites in 11 LCZ (Local Climate Zone) Types in Xi’an, China. Sustainability 2021, 13, 83. [Google Scholar] [CrossRef]
- Ellena, M.; Melis, G.; Zengarini, N.; Di Gangi, E.; Ricciardi, G.; Mercogliano, P.; Costa, G. Micro-scale UHI risk assessment on the heat-health nexus within cities by looking at socio-economic factors and built environment characteristics: The Turin case study (Italy). Urban Clim. 2023, 49, 101514. [Google Scholar] [CrossRef]
- Mohammad Harmay, N.S.; Choi, M. The urban heat island and thermal heat stress correlate with climate dynamics and energy budget variations in multiple urban environments. Sustain Cities Soc. 2023, 91, 104422. [Google Scholar] [CrossRef]
- Mumtaz, S.; Rana, J.N.; Choi, E.H.; Han, I. Microwave Radiation and the Brain: Mechanisms, Current Status, and Future Prospects. Int. J. Mol. Sci. 2022, 23, 9288. [Google Scholar] [CrossRef] [PubMed]
- Tran, H.; Uchihama, D.; Ochi, S.; Yasuoka, Y. Assessment with satellite data of the urban heat island effects in Asian mega cities. Int. J. Appl. Earth Obs. Geoinf. 2006, 8, 34–48. [Google Scholar] [CrossRef]
- Weng, Q.; Lu, D.; Schubring, J. Estimation of land surface temperature-vegetation abundance relationship for urban heat island studies. Remote Sens. Environ. 2004, 89, 467–483. [Google Scholar] [CrossRef]
- Pu, R.; Gong, P.; Michishita, R.; Sasagawa, T. Assessment of multi-resolution and multi-sensor data for urban surface temperature retrieval. Remote Sens. Environ. 2006, 104, 211–225. [Google Scholar] [CrossRef]
- Rajasekar, U.; Weng, Q. Urban heat island monitoring and analysis using a non-parametric model: A case study of Indianapolis. ISPRS J. Photog. Remote Sens. 2009, 64, 86–96. [Google Scholar] [CrossRef]
- Imhoff, M.L.; Zhang, P.; Wolfe, R.E.; Bounoua, L. Remote sensing of the urban heat island effect across biomes in the continental USA. Remote Sens. Environ. 2010, 114, 504–513. [Google Scholar] [CrossRef] [Green Version]
- Oke, T.R. Boundary Layer Climate, 2nd ed.; Routledge: Abingdon, UK, 1987. [Google Scholar] [CrossRef]
- Balling, R.C.; Skindlov, J.A.; Phillips, D.H. The Impact of Increasing Summer Mean Temperatures on Extreme Maximum and Minimum Temperatures in Phoenix, Arizona. J. Clim. 1990, 3, 1491–1494. [Google Scholar] [CrossRef]
- Kim, Y.H.; Baik, J.J. Maximum urban heat island intensity in Seoul. J. Appl. Meteorol. 2002, 41, 651–659. [Google Scholar] [CrossRef]
- Giridharan, R.; Ganesan, S.; Lau, S.S.Y. Daytime urban heat island effect in high-rise and high-density residential developments in Hong Kong. Energy Build. 2004, 36, 525–534. [Google Scholar] [CrossRef]
- Sharifi, E.; Lehmann, S. Comparative analysis of surface urban heat island effect in central sydney. J. Sustain. Dev. 2014, 7, 23–34. [Google Scholar] [CrossRef] [Green Version]
- Cai, G.; Du, M.; Xue, Y. Monitoring of urban heat island effect in Beijing combining ASTER and TM data. Int. J. Remote Sens. 2011, 32, 1213–1232. [Google Scholar] [CrossRef]
- Sharma, R.; Joshi, P.K. Identifying seasonal heat islands in urban settings of Delhi (India) using remotely sensed data—An anomaly based approach. Urban Clim. 2014, 9, 19–34. [Google Scholar] [CrossRef]
- Zhou, D.; Zhao, S.; Liu, S.; Zhang, L.; Zhu, C. Surface urban heat island in China’s 32 major cities: Spatial patterns and drivers. Remote Sens. Environ. 2014, 152, 51–61. [Google Scholar] [CrossRef]
- Rooba, S.M. Urban/suburban differences over Greater Cairo, Egypt. Atmósfera 2003, 16, 157–171. [Google Scholar]
- Cheval, S.; Dumitrescu, A.; Irașoc, A.; Paraschiv, M.-G.; Perry, M.; Ghent, D. MODIS-based climatology of the Surface Urban Heat Island at country scale (Romania). Urban Clim. 2022, 41, 101056. [Google Scholar] [CrossRef]
- Han, D.; Zhang, T.; Qin, Y.; Tan, Y.; Liu, J. A comparative review on the mitigation strategies of urban heat island (UHI): A pathway for sustainable urban development. Clim. Dev. 2022, 1–25. [Google Scholar] [CrossRef]
- Mirabi, E.; Davies, P.J. A systematic review investigating linear infrastructure effects on Urban Heat Island (UHIULI) and its interaction with UHI typologies. Urban Clim. 2022, 45, 101261. [Google Scholar] [CrossRef]
- Yang, Y.; Song, F.; Ma, J.; Wei, Z.; Song, L.; Cao, W. Spatial and temporal variation of heat islands in the main urban area of Zhengzhou under the two-way influence of urbanization and urban forestry. PLoS ONE 2022, 17, e0272626. [Google Scholar] [CrossRef]
- Li, H.; Jombach, S.; Tian, G.; Li, Y.; Meng, H. Characterizing Temporal Dynamics of Urban Heat Island in a Rapidly Expanding City: A 39 Years Study in Zhengzhou, China. Land 2022, 11, 1838. [Google Scholar] [CrossRef]
- Leading 200 Science Cities, Nature Index. Available online: https://www.nature.com/nature-index/supplements/nature-index-2022-science-cities/tables/overall (accessed on 7 June 2023).
- Wang, R.; Gao, W.; Peng, W. Downscale MODIS Land Surface Temperature Based on Three Different Models to Analyze Surface Urban Heat Island: A Case Study of Hangzhou. Remote Sens. 2020, 12, 2134. [Google Scholar] [CrossRef]
- Dian, C.; Pongrácz, R.; Incze, D.; Bartholy, J.; Talamon, A. Analysis of the urban heat island intensity based on air temperature measurements in a renovated part of Budapest (Hungary). Geogr. Pannonica 2019, 23, 4. [Google Scholar] [CrossRef] [Green Version]
- Mandal, J.; Patel, P.P.; Samanta, S. Examining the expansion of Urban Heat Island effect in the Kolkata Metropolitan Area and its vicinity using multi-temporal MODIS satellite data. Adv. Space Res. 2022, 69, 1960–1977. [Google Scholar] [CrossRef]
- Weng, Q. Thermal infrared remote sensing for urban climate and environmental studies: Methods, applications, and trends. ISPRS J. Photogramm Remote Sens. 2009, 64, 335–344. [Google Scholar] [CrossRef]
- Georgescu, M.; Moustaoui, M.; Mahalov, A.; Dudhia, J. Summer-time climate impacts of projected megapolitan expansion in Arizona. Nat. Clim. Chang. 2013, 3, 37–41. [Google Scholar] [CrossRef]
- Qiu, G.-Y.; Li, H.-Y.; Zhang, Q.-T.; Chen, W.; Liang, X.-J.; Li, X.-Z. Effects of Evapotranspiration on Mitigation of Urban Temperature by Vegetation and Urban Agriculture. J. Integr. Agric. 2013, 12, 1307–1315. [Google Scholar] [CrossRef]
- Han, M.; Fu, W.; Lu, D.; Zhang, C.; Hu, S.; Yan, Y. Quasi-Optical Mode Converter Based on All-Dielectric Metamaterial for High-Order Mode Vacuum Electronics Devices. IEEE Trans. Electron Devices 2023, 70, 2834–2839. [Google Scholar] [CrossRef]
- Li, Y.; Yuan, H.; Zhou, X.; Liang, J.; Liu, Y.; Chang, D.; Yang, D. Degradation of Benzene Using Dielectric Barrier Discharge Plasma Combined with Transition Metal Oxide Catalyst in Air. Catalysts 2022, 12, 203. [Google Scholar] [CrossRef]
- Bokaie, M.; Shamsipour, A.; Khatibi, P.; Hosseini, A. Seasonal monitoring of urban heat island using multi-temporal Landsat and MODIS images in Tehran. Int. J. Urban Sci. 2019, 23, 269–285. [Google Scholar] [CrossRef]
- Cao, A.; Li, Q.; Meng, Q. Effects of Orientation of Urban Roads on the Local Thermal Environment in Guangzhou City. Procedia Eng. 2015, 121, 2075–2082. [Google Scholar] [CrossRef] [Green Version]
- Mohajerani, A.; Bakaric, J.; Jeffrey-Bailey, T. The urban heat island effect, its causes, and mitigation, with reference to the thermal properties of asphalt concrete. J. Environ. Manag. 2017, 197, 522–538. [Google Scholar] [CrossRef] [PubMed]
- Park, M.; Hagishima, A.; Tanimoto, J.; Narita, K. Effect of urban vegetation on outdoor thermal environment: Field measurement at a scale model site. Build. Environ. 2012, 56, 38–46. [Google Scholar] [CrossRef]
- Zhang, J.; Khoshbakht, M.; Liu, J.; Gou, Z.; Xiong, J.; Jiang, M. A clustering review of vegetation-indicating parameters in urban thermal environment studies towards various factors. J. Therm. Biol. 2022, 110, 103340. [Google Scholar] [CrossRef] [PubMed]


Disclaimer/Publisher’s Note: The statements, opinions and data contained in all publications are solely those of the individual author(s) and contributor(s) and not of MDPI and/or the editor(s). MDPI and/or the editor(s) disclaim responsibility for any injury to people or property resulting from any ideas, methods, instructions or products referred to in the content. |
© 2023 by the authors. Licensee MDPI, Basel, Switzerland. This article is an open access article distributed under the terms and conditions of the Creative Commons Attribution (CC BY) license (https://creativecommons.org/licenses/by/4.0/).
Share and Cite
Dang, L.; Kim, S. An Analysis of the Spatial and Temporal Evolution of the Urban Heat Island in the City of Zhengzhou Using MODIS Data. Appl. Sci. 2023, 13, 7013. https://doi.org/10.3390/app13127013
Dang L, Kim S. An Analysis of the Spatial and Temporal Evolution of the Urban Heat Island in the City of Zhengzhou Using MODIS Data. Applied Sciences. 2023; 13(12):7013. https://doi.org/10.3390/app13127013
Chicago/Turabian StyleDang, Lei, and Soobong Kim. 2023. "An Analysis of the Spatial and Temporal Evolution of the Urban Heat Island in the City of Zhengzhou Using MODIS Data" Applied Sciences 13, no. 12: 7013. https://doi.org/10.3390/app13127013