Article

Comparison of Different Configurations for Shoreline Pond Electrode Station for HVDC Transmission Systems—Part I: Electric Field Study for Frames of Linear Electrode Arrangement Based on a Simplified Analytical Model

by
Vassiliki T. Kontargyri
1,2,*,
George J. Tsekouras
1,2,
John M. Prousalidis
3,
Costantinos D. Tsirekis
4,
Konstantinos Leontaritis
4,
John C. Alexandris
4,
Fotis D. Kanellos
5,
Panagiota M. Deligianni
1,4,
Panagiotis A. Kontaxis
1,2 and
Antonios X. Moronis
1
1
Department of Electrical and Electronics Engineering, University of West Attica, 250 Thivon Str., 12241 Athens, Greece
2
School of Electrical and Computer Engineering, National Technical University of Athens, Heroon Polytechniou 9, 15780 Athens, Greece
3
School of Naval Architecture and Marine Engineering, National Technical University of Athens, Heroon Polytechniou 9, 15780 Athens, Greece
4
Hellenic Indepedent Power Transmission Operator, Dyrrachiou 89 & Kifissou, 10443 Athens, Greece
5
School of Electrical and Computer Engineering, Technical University of Crete, University Campus, Akrotiri, 73100 Chania, Greece
*
Author to whom correspondence should be addressed.
Appl. Sci. 2023, 13(12), 7136; https://doi.org/10.3390/app13127136
Submission received: 17 May 2023 / Revised: 5 June 2023 / Accepted: 12 June 2023 / Published: 14 June 2023
(This article belongs to the Section Energy Science and Technology)

Abstract

:

Featured Application

The present paper evaluates 10 alternative shoreline pond electrode station designs using frames in a linear arrangement of electrodes for HVDC interconnections, against the typical design, according to CIGRE B4.61/2017 (parallel arrangement of electrode frames, with respect to the longitudinal axis of the breakwater), studying it from the point of view of electric field analysis (with emphasis on the near-field).

Abstract

During the design of a shoreline electrode station for High-Voltage Direct Current (HVDC) interconnections, the location of the electrodes plays a critical part, especially in the development of the near-electric field. The basic structure is their linear placement, in the form of successive frames, parallel to the longitudinal axis of the breakwater, as proposed by CIGRE and implemented in existing projects. However, this arrangement requires a considerable breakwater length, which may not be permissible, as in the case of Stachtoroi, one of the two electrode stations being built for the 1 GW, ±500 kV HVDC interconnection between Crete and mainland Greece. This troubled the preliminary study team of the electrode stations, which investigated other possible configurations. In this paper, configurations of linear placements of electrode frames are studied and compared at the preliminary study level in terms of electric field effects (especially the near-field), using an analytical simplified model and the superposition method, to determine the most appropriate arrangement of electrodes that will cover the respective requirements of CIGRE directives B4.61/2017. These arrangements are practically evaluated for two different electrode station locations at Korakia in Crete and at Stachtoroi in Aegina for the Crete–mainland-Greece interconnection, resulting in interesting alternative solutions.

1. Introduction

Depending on the design of the HVDC interconnection configuration, the question of the presence (or not) of a ground return current arises. Non-use of a metallic return conductor leads to a considerable reduction in construction costs for great interconnection lengths [1]. After all, this was the reason why the Hellenic Independent Power Transmission Operator (IPTO), in 2018–2019 during its study of the bi-directional interconnection, between the island of Crete and mainland Greece in the region of Attica (with nominal power characteristics of 1 GW, voltage ±500 kV DC using voltage source converters), opted for a bipolar heteropolar configuration, with a ground return (especially through the sea), since from a total length of approximately 380 km (the largest part of which (330 km) being underwater), the ground return conductor can be limited by, at least, 310 km [2,3]. Thus, around 200 million euros is saved, as the construction of two electrode stations in the sea is more economic. The latter is also confirmed by the study [4], where the limit of using a metal conductor, over using the ground, in HVDC interconnections is in the order of 20 km. The locations of the stations (the island of Stachtoroi in Attica and Korakia beach in Crete) meet a number of criteria, such as close proximity to the conversion stations, and sufficient distance from a residential area or an area with man-made facilities, to avoid unwanted repercussions resulting from their operation such as electrochemical corrosions, or regarding the possibility of issuing building/environmental permits [1].
In [2], the classic configuration of the shoreline electrode station was first proposed, with the electrodes placed in frames in a straight arrangement and the frames in turn placed parallel to the longitudinal axis of the breakwater. This is the basic configuration that has been implemented in the Muskrat Falls Project [5,6,7] and is recommended in the guidelines of CIGRE B4.61 675: 2017 [1] and in the literature [8,9,10]. However, this is not necessarily the case, as other underwater devices made of fibre-reinforced polymer concrete have been proposed, whose electrodes are not directly accessible [11]. In the present case [2], however, the following problems were identified:
  • Marginal positioning of the electrode stations: In both areas, but especially in the area of Stachtoroi, the necessary lengths of the electrode stations can only be ensured marginally by reaching the shores, requiring dredging of the pond under construction, etc.
  • Exchange of water within the pond: The construction of a rubble-mound dam, permeable to water through a suitable layering of rubble, does not ensure the complete exchange of water within the pond, due to the small waves in the Argosaronic gulf and the small tidal effect, in contrast to the Muskrat Falls Project [5,6].
  • Dam height: The initial height of the dam was significantly shorter than the expected maximum wave height, especially in the area of Korakia, so this naturally leads to an increase in the height of the dam and, by extension, to an increase in its other parameters.
Therefore, in this paper, various ways of positioning the frames, with a linear arrangement of electrodes in a shoreline station with emphasis on the near-field, are explored. Effects concerning the far-field, such as the effect of corrosion on the railway network and gas pipelines, due to the presence of a ground direct-current return from HVDC systems [12,13,14], are essentially independent of the positioning of the electrodes within the station; hence, they are not considered here. The determination of the electric field is mainly conducted through computational models, such as finite elements [7,8,15,16,17,18,19], the hemispheroidal model [16,20,21], finite volume elements [16,20,21], the inclined layer model [16], cross-platform finite element analysis, solver and multi-physics simulation (COMSOL) [4], and semi-analytical methods based on the complex images method with specialised interpolators (generalised pencil of functions) [19,22]. The above are usually based on the knowledge of the soil/sea resistivity throughout the area under study, which is obtained through geophysical–petrophysical–electric methods [5,6,7,15], such as magnetotelluric and electrical resistivity tomography [23,24], drillings, electric potential measurements in sea, electric soundings, and transient electromagnetic soundings [25], which are very costly and time-consuming to implement. Additionally, the acquisition of specialised software packages for the determination of field analyses (such as COMSOL [4] and CDEGS [12,13]), the training in them, and the respective simulation are also costly and time-consuming. Alternatively, it is performed through approximative analytical methods based on Green functions for soil/sea layers and the method of images [26] or using point sources of electric current, as formulated in CIGRE B4.61 675:2017 [1] or through its variation in IEC TS 62344:2013 [27], where, in the first case, the homogeneous soil occupies a hemisphere, the water forms a wedge, and the air occupies the rest of the area, whilst in the second, the soil–air roles are reversed. The second case is based on the Rusk methodology [8,28,29,30,31], taking into account the electrode resistance and the electric current intensity in water and soil, while the Uhlmann method disregards the effect of the soil and seabed [8,32]. In [2], the respective analytical methods of point current sources are unified. Furthermore, the addition of the breakwater to the analytical methods [1,27], as well as the use of a linear current source (instead of a point source), with a cylindrical water zone of specific height, were also proposed to the study of the near-electric field. The latter proved, in the preliminary study, to be the most appropriate method for the analytical approach to the problem, which, in combination with the superposition method for the utilisation of many electrodes, gives easy and fast results for the study of the near-electric field (in the present case), for the electrode stations of Stachtoroi and Korakia, regarding the HVDC interconnection of Crete and Attica.
In this paper, the preliminary study of shoreline pond electrode stations with electrode arrangements other than the typical one (where the vertical or inclined electrodes linearly placed form frames, and then the frames are placed linearly, parallel to the longitudinal axis of the breakwater) is carried out in order to address the space limitations of the specific locations (Stachtoroi and Korakia for the HVDC interconnection of Crete, Attica), covering the limits of the potential gradient for the protection of marine life and divers in marine electrodes in steady and transient states and of the absolute potential, in relation to remote earth, for the steady state. To calculate the electric field gradient, ground potential rise, and resistance to remote earth of electrode stations, the method proposed in [2] is used, which means that for the near-field, a linear current source is used for each electrode, which extends cylindrically in a sea/soil or dam zone of constant circumference. The respective mathematical background of a point current source, in the form of an appropriate wedge of sea on the ground, is used for the far-field (extension of [1,27]). In the case of more than one electrode, the application of this method is extended through superposition. The aforementioned method is applied to constructions that use the original frames, with an arrangement of the electrodes in placements, such as two parallel or vertical rows of frames with respect to the longitudinal axis of the breakwater, a perimeter placement around the pond under construction, a radial placement on a central base with guides (support posts/columns), and a perimeter placement around a central polygonal base. Arrangements common for offshore electrode stations [18], such as copper conductors placed above the seabed, are rejected due to the fact that the electrodes of existing stations do not function only as cathodes. Likewise, concrete boxes with electrode parts inside or a flat electrode mesh, based on a fiberglass structure, parallel over the seabed, are not preferred, because there is no direct visual supervision of their condition or it is not possible to easily replace them, for maintenance reasons. Interesting conclusions emerge from this study, since using the same number of electrodes, with a different placement of the frames of a linear arrangement of equidistant electrodes, achieves better field results, reducing the absolute potential and remote earth resistance of the electrode station. In the future, the above data will be supplemented by the second part of this study, which concerns frames of a non-linear arrangement of the electrodes, and the third part, which concerns the construction of civil engineering projects for the respective placement of the electrodes.

2. Analytical Methodology for the Calculation of Electric Field Strength

When configuring an electrode station, a representation of the electrode that is more accurate than that of a point source is required (especially when studying the near-electric field), compared to the point approach of CIGRE B4.61 675:2017 [1] and IEC TS 62344:2013 [27]. After all, in order to limit the electric current density of each electrode and for reasons of reliability alike, more than one electrode must be used. Taking into account the methods and results of [2], the proposed methodology for calculating the electric field gradient, ground potential rise, and resistance to remote earth of electrode stations is summarised in the following steps:
  • Determination of the minimum number of electrodes and layout configuration: the minimum number of necessary electrodes Nmin_el is determined, based on the maximum nominal current Itot flowing through the electrode station as follows:
N min _ e l = I t o t J e l × S p _ e l
where Jel is the electric current density limit per electrode and Sp_el is the area of the peripheral surface of the electrode. Let it be noted that the limits within which the electric current density will range are dependent upon the model and mode of operation, that is, steady operation (conditions of a duration equal to, or higher than, 10 s) and transient (durations shorter than 10 s are considered as such, for example, faults and brief overloads). Indicatively, the CIGRE B4.61 675:2017 [1], §5.1.3.5 and IEC TS 62344:2013 [27], §6.1.6 guidelines suggest that the electric current density be kept within the frame of 6 to 10 A/m2, with regard to sea, beach, and pond electrodes, to curtail chorine selectivity for parts in contact with the seawater. Moreover, the electric field strength in the vicinity is to be less than 1.25–2 V/m. Nonetheless, current densities are allowed to reach values up to 100 A/m2, when the electrodes are safely out of reach of persons and animals. Of course, the manufacturer’s guidelines must be taken into consideration [33], along with the type of operation [34].
In the case of configuring Νframe frames, with an equal number of electrodes per frame Nel_frame, Nel_frame is equal to the quotient of the total minimum number of necessary electrodes Nmin_el to the number of frames Νframe. If, for reasons of reliability and maintenance, an additional frame is necessary, a total of Νframe/ = (Νframe + 1) are placed. In addition, due to the linear arrangement of the electrodes in the frame, the electric current distribution is not uniform, as has been established in [6,7], so an incremental correction factor β of the electric current density was taken into account during the pre-study stage (in this case, equal to 6%) [2]. Therefore, the current densities in full load Jfu_lo and maintenance conditions Jmt are calculated as follows:
J f u _ l o = β + 1 × I t o t N f r a m e + 1 × N e l _ f r a m e × S p _ e l
J m t = β + 1 × I t o t N f r a m e × N e l _ f r a m e × S p _ e l
In place of the Itot current, the current intensity of either the steady or the transient state can be placed and the corresponding electric current densities of the electrodes can be obtained.
  • Calculation of electric field strength per electrode: The determination is made by combining two models proposed in [2]. In particular, for the near-field, a linear current source is considered (method “C” in [2]). Figure 1 presents a simplified structure, taking into account a zone for the effective height L in cylindrical coordinates. On the “left” part, the electrode is positioned at a distance dr1 from the dam, while the depth of the dam is td. Hence, the exterior radius of the dam is dr2 = dr1 + td. On the “right” part, the electrode is at a distance dr3 from the soil, provided the respective depth is ensured. The angle formed with the ground plane is θg.
Figure 1. Simplified model regarding the positioning of an electrode on the shore or in near-shore sea, assuming a linear electrode, in cylindrical coordinates and incorporating a dam–soil surface (based on model “C” and Figure 6, as in [2]).
Applsci 13 07136 g001
The following assumptions stand:
  • The electromagnetic field theory requires the continuity of the tangential electric field strength, as well as of the vertical current density, on the dividing surfaces.
  • The non-radial currents on the surfaces r = dr1, r = dr1, and r = dr3 are ignored.
  • The infinite layer of seawater–dam–soil has a constant active thickness L, while in reality, it grows significantly, e.g., at short distances, it has a thickness of the order of meters, as much as the height of the electrode, while at long distances, it is tens or hundreds of meters (making it too conservative and unsuitable for the far-field).
  • The seawater resistivity ρw, dam resistivity ρd, and soil resistivity ρs are considered constant, while in reality, they change (especially that of the soil). If the most unfavourable values are taken (e.g., considering the ground resistivity as infinite), the most conservative result is obtained.
  • The materials of soil, dam, and seawater segments do not form uniform surfaces; their shape varies in different directions, as shown in Figure 1. However, it is a quite satisfactory approach.
From the respective solution in cylindrical coordinates, as presented in detail in §2.3 of [2], the radial components of the electric field strength in the ground Εrs, in the dam Εrd, in the water in general Εrw, and in the water in the “left” Εrw_l or in the “right” part Εrw_r are derived, given the total electrode current Iel, as follows:
E r w _ l = E r s = I e l r × L × 2 × π θ g ρ w + θ g ρ s   : r > m a x d r 2 , d r 3   o r   d r 3 < r < d r 1
E r w = ρ w × I e l 2 × π × r × L   : r < m i n d r 1 , d r 3   o r   d r 2 < r < d r 3
E r w _ r = E r d = I e l r × L × 2 × π θ g ρ d + θ g ρ w   : d r 1 < r < m i n d r 2 , d r 3
E r s = E r d = I e l r × L × 2 × π θ g ρ d + θ g ρ s   : m a x d r 1 , d r 3 < r < d r 2
For the far-field, a point current source is considered (method “B” of [2], which is identical to “A” outside the dam). Practically unifying the considerations of CIGRE B4.61 675: 2017 [1], §5.5.3.1 and Figure 5.35 and IEC TS 62344: 2013 [27], §6.1 and Figure 5, the dam is added according to Figure 2, where an electrode is placed on the shore (or on the seabed, in shallow waters), at the centre of the coast. The bottom of the sea is considered to be inclined, with respect to the horizon, forming an angle θw. The electrode is at a distance dr1 from the dam, while the depth of the dam is td. Therefore, the exterior radius of the dam is dr2 = dr1 + td as in the near-field calculation method. The ground has an angle θs, while the remainder is occupied by air. In addition to assumptions 1, 2, 4, the following are also made:
6.
The soil does not form a wedge and the water is also not a uniform wedge, with its shape varying in different directions. Nonetheless, this approach is better than those of IEC TS 62344: 2013 and CIGRE B4.61 675: 2017.
7.
The electrodes are situated in areas that are protected, such as a shore or a cave, while the exposed side of the sea is limited to an angle φ (rad) smaller than π rad. The analysis can be improved using the multiplier π/φ to the calculated distance of the remote earth.
8.
The actual inclination varies, both axially and radially. The analysis can be made, on the safe side, by considering different inclinations of the seabed or always considering the worst-case scenario, e.g., assuming the average inclination, not as the initial inclination from the coast but as the distance of interest, which is usually relatively small.
From the respective solution in spherical coordinates, as presented in detail in §2.2 of [2], the radial components of the electric field strength in the soil Εrs/, in the dam Εrd/, and in the water Εrw/, given the total electrode current intensity Iel, are derived as follows:
E r s / = E r w / = I e l 2 × r 2 × θ w ρ w + θ s ρ s : r d r 1   o r   r d r 2
E r s / = E r d / = I e l 2 × r 2 × θ w ρ d + θ s ρ s : d r 1 < r < d r 2
At the points where the electric field intensities from the two models are numerically identical, going from the smaller to the greater distances, the transition from the line source model to the point source is made (which usually takes place on the outer side of the dam). This is because at close range, the electric field strength on the part of the electrode is better described by the linear current source, while at far range, the water wedge of constant inclination better describes the physical model, compared to a very limited water zone, which ignores the volume of water to the bottom, which may extend to great depths.
  • Configuration of electrode frames: First, the electrodes are placed at suitable distances forming a frame, e.g., in Figure 3, each frame is made up of a number of electrodes Νel_frame (13 in this case), with a diameter equal to del (twice the radius rel), which are vertically placed in series with each other at a distance p (measuring from each bar centre). The upper edge of the frame/electrodes is at depth hu, the middle of the frame/electrodes is at depth hm, the lower edge of the frame/electrodes is at depth hd, while the seabed depth is hsb. Therefore, the water zone of the near-field intensity calculation method L has a height equal to the length of the electrodes Lel, while the total frame length f and the respective vertical suspension depths are calculated as follows:
f = N e l _ f r a m e 1 × p
h m = h u + 0.5 × L e l
h d = h u + L e l
Figure 3. Typical scheme of a frame consisting of 13 electrodes arranged in series and suspended vertically, at fixed distances between successive electrodes.
Applsci 13 07136 g003
In the case of suspension with an inclination λ (base:height), the water zone of the near-electric field strength calculation method L and the respective depths of vertical suspension are calculated as follows:
L = L e l × c o s a t a n λ
h m = h u + 0.5 × L e l × c o s a t a n λ
h d = h u + L e l × c o s a t a n λ
The height above the upper edge of the electrode hu is such that the entire electrode is always submerged in the water, regardless of ripples outside the breakwater (for the classic design case). If a breakwater is not used, it must take an appropriate value so that the electrode is not found outside the water or, even better, outside the breaking wave water (which presents lower density/conductivity). In a different geometric design, the respective sizes have to be recalculated, e.g., in the case of the Muskrat Falls project [6,7], where the successive electrodes were placed at unequal distances from each other, in order to limit the uneven distribution of the electric current between them.
  • Formation of an electrode station of frames: The electrode frames are placed in appropriate positions, forming the electrode station. Figure 4 shows the basic form, due to the previous experience in near-shore electrodes [1,2,5,6,7,8,9,10], where the frame is similar to Figure 3 and the respective frames are placed in series, forming an imaginary axis parallel to the longitudinal axis of the breakwater from the inner/protected side. Listed are:
    The width of the dam td on the xOx/ axis;
    The distance of the imaginary axis of the electrode station from the axis of the dam dr1 on the axis xOx/;
    The frame length f;
    The estimated width of the critical frame zone dfv, vertical to the dam (along the xOx/ axis), resulting from single-frame simulations;
    The distance between consecutive frames on the dam, estimated to ensure the critical zone for diver drops for repairs sc (on yOy/), resulting from single-frame simulations;
    The width dstv of the electrode station critical zone, vertical to the dam (on the xOx/ axis), resulting from the electrode station simulations;
    The length of the electrode station critical zone cbd on the dam and below the centre of the dam (on the yOy/ axis), resulting from the electrode station simulations;
    The length of the electrode station critical zone cud on the dam and above the centre of the dam (on the yOy/ axis), resulting from the electrode station simulations.
Figure 4. First electrode station configuration—Plan view of six frames in linear arrangement, having each one placed parallel to the dam axis (similar to Figure 8 in [2]).
Applsci 13 07136 g004
It is clarified that the critical zone (whether it concerns a single frame or the electrode station) is then calculated based on the permissible upper limits of the electric field strength, in relation to the most unfavourable developing electric field strength, as determined by the interaction of all the electrodes for any operating scenario. For the case of Figure 4, the typical length of the electrode station stat−I is equal to:
s t a t I = N f r a m e / × p + N f r a m e / + 1 × s c
while the width of the respective structure is equal to the diameter of a single electrode del. In fact, though, the surface Scr−I that can be exposed to critical electric field values (not necessarily all at the same time) is equal to:
S c r I = 2 × d s t v + d e l × c b d + c u d
  • Calculation of the electrode station electric field strength: Initially, the area of concern is the water surface, which is arranged in a suitable canvas of two-dimensional Cartesian coordinates, upon which the electrode is set a particular position. Upon this canvas, of steps dstep_x and dstep_y, the electric field strength is measured. Practically, Figure 4 includes the entire respective area, extending on the Ox semi-axis up to 150 km, while on the yOy’ axis up to a few kilometres. The aforementioned steps are not constant, but vary, since the canvas grows gradually sparser while moving away from the electrode. The calculation of the radial electric field strength Er is then determined, employing the applied method. In this, the corresponding electrode is used as the point of reference and the electric current is the product of the electric current density Jfu_lo or Jmt, and the respective peripheral surface of the electrode Sp_el. The electric field strength of the k-th electrode is analysed in its components Εx−k and Εy−k, on xOx’ and yOy’ axes (as in Figure 5), utilising the coordinates (xk, yk) of the electrode (x,y) of the point of interest (canvas points) and the corresponding distance rk:
r k = x k x 2 + y k y 2
E x k = E r k × x x k r k
E y k = E r k × y y k r k
Figure 5. Basic principle of electric field strength analysis of an electrode in xOx’ and yOy’ axes (similar to Figure 9 in [2]).
Applsci 13 07136 g005
Through superposition, all the electric field strengths of each single electrode are added up on the axes xOx’ and yOy’, as follows:
E x = k = 1 N f r a m e / × N e l _ f r a m e E x k
E y = k = 1 N f r a m e / × N e l _ f r a m e E y k
E = E x 2 + E y 2
The calculation of the absolute electric potential is performed numerically along the main directions xOx’ and yOy’ at various points of the canvas with respect to either “infinity”:
V x = x E x × d x
V y = y E y × d y
Similarly, from the respective potential difference for specific lengths, the respective average electric field strength values are calculated:
E m e a n x , y = V x V x + 1 × s i g n x 1   m 2 + V y V y + 1 × s i g n y 1   m 2
The resistance of remote earth is determined from the comparison of all operation scenarios:
R e a r t h = max s c e n a r i o V x r e l I t o t
Thus, all the variables required for the preliminary study are calculated.
  • Determination of areas ensuring electric field strength and voltage limits according to IEC TS 62544:2013 and CIGRE B4.61 675:2017: In order for the operating conditions of the electrode station to be safe—under any operating conditions—whether it concerns the specialised maintenance staff, or people and living beings, in the areas of direct access, limits are set for the electric field strength, touch voltage, step voltage, metal-to-metal touch voltage, and absolute voltage with respect to remote earth. In particular, taking the most unfavourable limits from the general guidelines of IEC TS 62544:2013 [27] (p. 32) and CIGRE B4.61 675:2017 [1] (p. 65), as well as recommendations about the pipe-to-soil potential difference based on the applied provisions of cathodic protection [35], the necessary conditions that must be met (as they are also summarised in §2.5. of [2]) are as follows:
    • Electric field strength (potential gradient) for continuous operating conditions in water should be smaller than or equal to 1.25 V/m (for marine mammals, while it could be up to 2.5 V/m when concerning humans).
    • Electric field strength (potential gradient) for transient operating conditions in water should be smaller than or equal to 15 V/m.
    • Potential difference between metal equipment and soil for continuous operating conditions should be smaller than or equal to 4 V. Practically, on the safe side, it could be taken as the corresponding limit for the absolute potential with respect to remote earth.
    • Metal-to-metal touch voltage, touch voltage, and step voltage for continuous operating conditions should be smaller than or equal to 5 V.
    • Metal-to-metal touch voltage, touch voltage, and step voltage for transient operating conditions should be smaller than or equal to 30 V.
Conditions (4) and (5) concern the area controlled exclusively by the IPTO; therefore, conditions (1) to (3) need to be checked when designing the electrode stations.
The first step is common to all configurations, as well as the second one, since it is only affected by the characteristics of the respective area. The following steps should be recalculated, each time, based on each frame and electrode station configuration.

3. Electrode Station Configuration

3.1. General Data

The preliminary basic design is based on the use of a rubble-mound breakwater, as shown in Figure 11 and Figure 12 of [2], for the cases of Stachtoroi in the Argosaronic Gulf and Korakia in Crete, respectively, regarding the HVDC interconnection between Crete and Attica in mainland Greece. The basic characteristics of the HVDC interconnection and the electrode stations are listed in Section 3.4 of [2]. In this case, those that directly concern the study of the electric field of the electrode stations are the following:
  • At monopolar steady-state operation, each pole has a nominal power of 500 MW at a nominal voltage of 500 kV. Hence, the nominal current of the station is at 1000 A.
  • The maximum transient current of the station reaches a peak value of 12,800 A, with a duration of 0.5 s during fault clearing.
  • The fully reversible electrode to be used is a high-silicon iron, tubular, type 4884 SZ, Centertec Z series, by ANOTEC, conforming to ASTM A518 G3, with a connection resistance of 1 mΩ, weight of 143 kg, diameter of 122 mm (=2∙rel), length of 2130 mm (=Lel), and maximum electric current density up to 20 A/m2 for successful reversible operation of the electrode, according to the manufacturer [33].
  • The electrodes are suspended vertically, in order to obtain the largest possible water zone, when analysing the near-electric field and also because it is the structurally easier suspension mode in the case of concrete breakwaters with vertical walls.
  • In the area of Stachtoroi (Argosaronic Gulf, Attica), the angle θg on the plan view of Figure 1 is taken to be equal to 210° based on the location of the electrode station (see Figure 11 in [2]), while the respective water angle θw of Figure 2 is equal to 0.272° (see the worst-case scenario for the Aegina region of Table 1 in [2]). The available dam length is about 50 m.
  • In the area of Korakia (Crete), the angle θg on the plan view of Figure 1 is taken to be equal to 248° based on the location of the electrode station (see Figure 12 in [2]), while the respective water angle θw of Figure 2 is equal to 2.29° (see the worst-case scenario/far region of Table 1 in [2]). The available dam length is about 70 m.
  • The seawater electrical resistivity takes a value of 0.25 Ω∙m, despite the fact that its value ranges from 0.167 to 0.212 Ω∙m for both areas. In this way, the uncertainty that can arise from salinity reduction, due to freshwater inflow to seawater, is addressed, especially in the Korakia region where there are also two small dry rivers. In addition, the electrodes will always be placed at a greater depth than the breaking wave water can reach (which has a significantly greater electrical resistivity equal to 2.00 Ω∙m).
  • The dam electrical resistivity takes a value of 100 Ω∙m due to the water circulation openings in the breakwater [5,6].
  • For reasons of reliability, the number of linearly positioned frames Nframe is 5, adding an extra one as reserve. Therefore, the total number of electrodes required Nmin_el is 67 as a result of the application of Equation (1), assuming a total electric current, Ιtot_st, of 1100 A at steady state and under overload conditions. Hence, for each frame, the necessary electrodes, Nel_frame, are 13, amounting to a total of 78 (including those in the reserve). Considering the increment factor β (=6.1%) [2] and implementing Equations (2) and (3), the final current density values Jfu_lo_st (under full-load conditions) and Jmt_st (under periodic maintenance) result as equal to 18.33 A/m2 and 22.00 A/m2, respectively. In the transient state, for a current Itot−tr of 12.8 kA, the final current density values Jfu_lo_tr (under full-load conditions) and Jmt_tr (under periodic maintenance) result as equal to 213.28 A/m2 and 255.93 A/m2, respectively.
  • The soil electrical resistivity takes the infinitive value, for the sake of simplifying the calculation process, giving more unfavourable/safe results.
  • The water zone that corresponds to an arc of angle θg, on the floor plan in Figure 1, is disregarded to simplify the calculation, giving more unfavourable/safe results.
  • The breakwater/dam of Figure 1 is disregarded in order to simplify the respective calculation. This affects the electric field strength calculation along with that of the absolute potential, concerning radii within or up to the breakwater. The absolute potential on the dam can be calculated approximately as the product of the respective electric field strength of the seawater and the ratio of the electrical resistivities ρdw.
The last three assumptions were also made during the study of the basic form of the electrode stations in Section 5.1 in [2]. Furthermore, from the respective study, using a single source (Tables 2–7, Section 4 in [2]), it was found that in the present case, the worst scenario in terms of electric field strength limits is the application of the steady-state current, and this is the reason why only this is examined next. In addition, from the respective study of a straight frame of 13 electrodes at equal distances, ranging from 0.2 m to 1.5 m (Tables 9–11, Section 5 in [2]), it was found that increasing the distance between the electrodes reduces slightly the maximum electric field strength and the necessary safety distance, in terms of electric field strength limits, in front of the dam in the open sea. On the other hand, the necessary length of the dam increases significantly, while the estimated area of the critical zone (i.e., the zone formed by the six frames, within which the electric field strength may be beyond the require limits, depending on the loading) varies significantly. Balancing between the opposing results, and for reasons of electrode repairability by a diver/worker, a distance p between electrodes equal to 0.5 m is chosen.

3.2. Basic Electrode Station Configuration—Straight Frames in Series, Each Placed Parallel to the Longitudinal Axis of the Dam (1st Configuration)

The usual configuration is the placement of straight frames in series, parallel to the longitudinal axis of the protective dam, at equal distances between them, as already presented in Figure 4 and analysed in Section 5 in [2]. This positioning is very simple in form, but presents a number of problems, especially regarding the violation of the electric field strength limits, both between the frames during the maintenance phase and in front of the dam in the open sea area, in the cases where the dam length is limited. In addition, it was found in paragraph 5.4 in [2] that the most unfavourable results are observed during the steady state in the maintenance phase of a frame, which is when one of the six frames is out of service.

3.3. Second Electrode Station Configuration—Straight Frames in Series, Each Vertically Placed on the Longitudinal Axis of the Dam

On the basic form of Figure 4, without changing the arrangement of the frame of Figure 3 (except that it is now vertical to the dam), the first modification is made, according to which the frames are placed one after the other vertically to the axis of the protective dam, on its inner side, as shown in Figure 6, on which the following are marked:
  • The width of the dam td along the xOx/ axis;
  • The distance of the closest electrode from the axis of the dam dr1 along the axis xOx/;
  • The total frame length f;
  • The estimated width of the critical frame zone dfv vertical to the frame and parallel to the dam along the yOy/ axis, which matches the distance between successive frames, which is estimated to ensure the critical zone for a diver drop for repair, as obtained from single-frame simulations;
  • The estimated length of the critical frame zone sc along the frame length, vertical to the dam here, by xOx/, as obtained from single-frame simulations;
  • The width dstv of the electrode station critical zone vertical to the dam (along the xOx/ axis), as obtained from the electrode station simulations;
  • The length of the electrode station critical zone cbd on the dam and below its centre (along the yOy/ axis), as obtained from the electrode station simulations;
  • The length of the electrode station critical zone cud on the dam and above its centre (along the yOy/ axis), as obtained from the electrode station simulations.
The total length of the electrode station stat−II is obtained as follows:
s t a t I I = N f r a m e / × d e l + N f r a m e / + 1 × d f v
The width of the respective structure is the length of an electrode frame f. In reality, however, the surface Scr−II that can be subjected to critical electric field values (not necessarily all of it at the same time) is equal to:
S c r I I = 2 × d s t v + f × c b d + c u d
This arrangement approximates the typical arrangement of near-shore submerged electrodes but is characterised by greater demands on the suspension-lifting-positioning systems of the electrodes due to the greater torque developed, owing to the larger lever-arm (before, the electrode was at a distance dr1 from the dam, while the farthest electrode is now at (dr1 + f)). Additionally, it extends over a larger area of the pond, i.e., the latter is utilised to a greater extent for the removal of chlorine, yet greater costs are required for the dredging of the respective basin.

3.4. Third Electrode Station Configuration—Straight Frames in Two Overlapping Rows, Each Placed Parallel to the Longitudinal Axis of the Dam in Alignment with Each Other

On the basic form of Figure 4, without changing the arrangement of the frame of Figure 3, the second modification is made, according to which the frames are placed in two rows, parallel to the axis of the dam on its inner side and aligned between the rows, as shown in Figure 7. In addition to the elements listed in Figure 4, the widths dstv_Ox and dstv_Ox/ of the critical zone of the electrode station vertical to the dam (along the semi-axes Ox and Ox/, respectively) are additionally mentioned, as obtained from the simulations of the electrode station. The total length of the electrode station stat−IIΙ is given as follows:
s t a t I I I = N f r a m e / 2 × f + N f r a m e / 2 + 1 × s c
while the width of the respective structure is equal to:
w s t a t I I I = 2 × d e l + d f v
In fact, however, the surface Scr−III that can be subjected to critical electric field values (not necessarily all of it at the same time) is equal to:
S c r I I I = w s t a t I I I + d s t v _ O x + d s t v _ O x / × c b d + c u d
This arrangement approximates the typical arrangement of near-shore submerged electrodes but is characterised by greater demands on the suspension-lifting-positioning systems of the electrodes due to the greater torque developed, owing to the larger lever-arm (before, the electrode was at a distance dr1 from the dam, while the farthest row of frames is now at (dr1 + dfv + del)). In addition, it extends over a larger area of the pond, but also a larger area of dredging of the respective basin is required, compared to the first configuration, while, on the contrary, with regard to the second configuration, the respective area of exploitation and dredging is more limited.

3.5. Fourth Electrode Station Configuration—Straight Frames in Two Successive Rows, Each Parallel to the Longitudinal Axis and Non-Overlapping on the Vertical Axes of the Dam

On the basic form of Figure 4, without changing the arrangement of the frame of Figure 3 and taking into account the unfavourable results of Section 4.4, a fourth configuration is made, according to which the frames are placed in two rows, parallel to the axis of the protective dam on its inner side, but in such a way that the frames of the nearest row do not “overshadow”/cover the frames of the farthest row on the vertical axis of the dam, as shown in Figure 8.
To achieve this, the distance between two successive frames of the same row ℓsfc must be the larger of (a) the total frame length f and (b) the distance between successive frames on the barrier sc, estimated to ensure the critical diver drop zone for repairs (along the yOy/ axis according to the field study of a single frame). Thus, it should hold that:
s f c = m a x f , s c
Figure 8 shows the relevant quantities analysed in Figure 6 and Figure 7, as well as the distance between two consecutive frames of the same row ℓsfc. The total length of the station stat−IV now measures:
s t a t I V = N f r a m e / 2 × s f c + 2 × s c + f
The width of the respective structure is identical to that of the third configuration, as given by Equation (31). Similarly, the surface Scr−IV that can be subjected to critical electric field values (not necessarily all of it at the same time) is given by Equation (32).
This configuration approximates the typical one of near-shore submerged electrodes but is characterised by greater demands on the suspension-lifting-positioning systems of the electrodes due to the greater torque developed, owing to the larger lever-arm (before, the electrode was at a distance dr1 from the dam, while the row of the farthest frames is now at (dr1 + dfv + del), as is also the case in the third configuration). Compared to the third configuration, it is advantageous because it is easier to access/withdraw the non-overlapping frames. Nonetheless, it spans at a larger area of the pond and dredging extent of the respective basin, compared to the first and third configurations, comparable to the second one.

3.6. Fifth Electrode Station Configuration—Straight Frames in Two Successive Rows, Each Vertical to the Longitudinal Axis of the Dam and Aligned with Each Other

On the basic form of Figure 4, without changing the arrangement of the frame of Figure 3 (except that it is now vertical to the dam), a fifth configuration is made, according to which the frames are placed in two rows vertically to the axis of the protective dam on the inner side and aligned between the rows, as shown in Figure 9, analysed in Figure 6 through Figure 8. The total length of the electrode station stat−V is equal to:
s t a t V = N f r a m e / 2 × d e l + N f r a m e / 2 + 1 × d f v
while the width of the respective structure is:
w s t a t V = 2 × f + s c
In fact, though, the surface Scr−V that can be subjected to critical electric field values (not necessarily all of it at the same time) is equal to:
S c r V = w s t a t V + d s t v _ O x + d s t v _ O x / × c b d + c u d
This configuration differs significantly from the typical near-shore submerged electrode configuration due to the two rows of frames, which are, moreover, placed vertically to the dam axis. In addition, it is characterised by greater demands on the suspension-lifting-positioning systems of the electrodes due to the greater torque developed, owing to the larger lever-arm (before, each electrode was at a distance dr1 from the dam, while the farthest electrode located in a second-row frame is now at (dr1 + wstat−V)). Additionally, it extends over a larger area of the pond and requires a greater extent of dredging of the respective basin, compared to the previous configurations and, especially, to the first one.

3.7. Sixth Electrode Station Configuration—Straight Frames in Two Successive Rows, Each Vertical to the Longitudinal Axis of the Dam and Non-Overlapping on the Vertical One

On the basic form of Figure 4, without changing the arrangement of the frame of Figure 3 (except that it is vertical to the dam), a sixth configuration is made, according to which the respective frames are placed in two rows, vertical on the axis of the dam on its inner side, and with no overlapping between the rows. The frames of one row are placed in the intermediate distance of the gap formed by the other row, as shown in Figure 10, with the parameters analysed in Figure 6 through Figure 9. The total length of the electrode station stat−VI is equal to:
s t a t V Ι = N f r a m e / 2 × d e l + N f r a m e / 2 + 1.5 × d f v
The width of the respective structure is given by Equation (36). The respective surface Scr−VΙ is determined by Equation (37).
This configuration differs significantly from the typical one of near-shore submerged electrodes, due to the two rows of frames and their vertical placement on the dam axis. In addition, it is characterised by greater demands on the electrode suspension-lifting-positioning systems due to the greater torque developed, owing to the larger lever-arm (before, each electrode was at a distance dr1 from the dam, while the farthest electrode located in a second-file frame is now at (dr1 + wstat−V), as with the fifth configuration). Compared to the fifth configuration (as was also the case between the third and fourth configurations) it is easier to access/withdraw the electrodes due to the non-overlapping frames. Additionally, it extends over a larger area of the pond and requires a greater extent of dredging of the respective basin, compared to the previous configurations and especially compared to the first one.

3.8. Seventh Electrode Station Configuration—Straight Frames in Perimeter Placement to the Protective Dam, Adapting to the Outline of the Pond under Construction

On the basic form of Figure 4, without changing the frame arrangement of Figure 3, a seventh configuration is made, according to which the frames are placed at such a distance from each other, as the maximum dsc, between the estimated width of the critical zone of frame dfv (vertical to the longitudinal axis of the frame) and the estimated length (distance between two consecutive frames placed consecutively along their longitudinal axis) sc, i.e., two distances (that are obtained from single-frame simulations) estimated to ensure the critical zone so a diver can drop for repairs. Therefore, it holds that:
d s c = m a x d f v , s c
In addition, for the maintenance work on the frames, it is necessary to construct a suitable quay wall (over the embankment area) along the coast, with a dr4 pavement width (specifically, 4 m). The frames will be separated from the inner side of the dam and from the quay wall by a distance dr1 (specifically, 1 m) so that they can be properly suspended. That is, for the case of Korakia in Figure 12 in [2], the permissible area for placing the frames of Figure 11 within the green dotted lines, the dredging area within the solid brown lines, and the embankment area between the shoreline and burgundy solid lines are obtained. The dashed red lines delineate the inner side of the pavement of the quay wall. The total contour is about 192.5 m long. Similarly, for the case of Stachtoroi in Figure 11 in [2] (excluding the T-shaped part of the dam), the permissible area for placing the frames in Figure 12 (with the corresponding colours) is obtained, where the total length of the contour is about 123 m. In both cases, if the resulting polygon was a “circle”, then the six frames would easily be placed at equal distances from each other. However, due to the unequal angles of the polygon, an attempt is made to place them in such a way as to maximise the approximately equal distances between them and be greater than dsc.
Figure 13 and Figure 14, respectively, for the cases of Korakia and Stachtoroi, show:
  • The dam width td;
  • The distance of the imaginary axis of each frame from the axis of the dam dr1;
  • The total frame length f;
  • The widths dOx and dOx/ of the electrode station critical zone vertical to the damn and along the semi-axes Ox and Ox/ from the beginning of the axes, as obtained from the simulations of the electrode station;
  • The lengths dOy and dOy/ of the electrode station critical zone parallel to the dam and along the semi-axes Oy and Oy/ from the beginning of the axes, as obtained from the simulations of the electrode station.
In the present case, there is no point in finding the length and width of the electrode station, as it covers the entire contour of the pond under construction. The respective surface Scr−VΙI is equal to:
S c r V Ι Ι = d O x + d O x / × d O y + d O y /
This configuration significantly increases the available placement length of the frames, anticipating improved field results. In addition, the systems for suspension-lifting-positioning would be typically of the order of dr1. However, in addition to the dredging operations in the entire pond, dredging and rock removing operations are also required along the entire shoreline of the pond perimeter, resulting in greater costs and environmental impacts. An additional problem in both areas is the use of a rubble-mound barrier to form the pond, which reduces the usable area of the pond to some extent. The latter can be solved if a dam is formed from solid artificial blocks, in the form of modular rectangular parallelepipeds or other such heavy structures (about 10 t and more) (see solutions in Figure 10b,c in [2]).

3.9. Eighth Electrode Station Configuration—Straight Frames Adapted to a T-Shaped Protective Dam

Due to the problem of the limited pond at Stachtoroi and, in addition, to the desire for the least possible interventions on the shore, the configuration of the dam at Stachtoroi was initially proposed in the form of Figure 11 in [2]. In this case, the eighth configuration is made, according to which the straight frames of Figure 3 are placed in such a way that they are separated from each other by, at least, the distance dsc of Equation (39). In addition, the access corridor to the frames must be of a suitable width dr4 to construct the road necessary for maintenance reasons (specifically, 4 m). Additionally, each frame is separated from the dam by a distance equal to dr1 (specifically, 1 m) for suspending the frame. That is, in the present case, the permissible placement area of the frames of Figure 15 (within the green dotted lines) and the dredging area, within the solid burgundy lines, are obtained. The total length of the contour is about 89 m. The contour cannot be considered to be a “circle”, but if the corresponding frames were placed in a row, then equal distances between them would be required. In order to make better use of the pond, it is accepted that the “T” section of the dam can be moved according to the needs of the electrode placement design, so in the present case, a 2 m shift to the north-east side is required.
In Figure 16, the respective parameters of Figure 13 and Figure 14 are shown. As in the seventh configuration, there is no point in finding the length and width of the electrode station, as it extends to the entire contour of the dam under construction, while the respective surface Scr−VIΙI is calculated through Equation (40). Compared to the seventh configuration, its main advantage is that interventions are limited only to the T-shaped dam against the shoreline perimeter and it also presents less demand for pond dredging, with the expected disadvantage of worse electric field results.

3.10. Ninth Electrode Station Configuration—Straight Frames Adapted Radially to a Central Base with Guides

The formation of the pond is an important intervention in the environment (especially in small islands protected as “Natura areas”, as in the case of Stachtoroi) and there are certain considerations to avoid respective constructions. In addition, due to the production of gases, during the operation of the station, owing to sea life (such as small fish/spawns and phytoplankton), which will enter through the permeable barrier into the pond, but also due to the water cycle (through its evaporation from the pond and runoff from the land side/increase of fresh water), which alter water salinity, the exchange of water within the pond is necessary, which, owing to the thickness of the rubble-mound barrier, is not fully ensured. Hence, an initial thought is to have a structure with large gaps, which allows the exchange of water. However, if the frames are close to the surface, it would lead to greater mechanical stress due to the waves, as well as to the presence of a breaking wave, whose water presents much greater resistivity, which would lead to worse results in terms of electric field. Therefore, the next approach is to place the straight frame at such a depth that it is always out of reach of the breaking waves (below 3 m at Stachtoroi and 10 m at Korakia, according to a respective sea wave behaviour assessment study conducted by IPTO) and rises above the surface with an appropriate suspension system. One option is for the straight frames to be placed radially in relation to the central base (as in Figure 17 and Figure 18), and the other, for them to be placed perimetrically to the base, as is analysed in Section 3.11. There can be other configurations, with the placement of frames in a linear arrangement, parallel or vertical to a respective line, in one or more rows, etc., but, in terms of field analysis, they are identical/similar to previous cases (with the only difference being the developing absolute potentials and the remote earth resistance of the electrode station, due to the absence of a dam).
Figure 17 shows the cross-section of the arrangement of vertical straight frames of length f in the sea around a central base of “gross” radius RK1 (where gross radius means the radius of the structure, along with the necessary distance dr1 from the structure), which are radially mounted and laterally supported, apart from the base, with an equal number of radius RO frame guides, constituting the ninth configuration. The upper frame level is at depth hu, which is greater than the depth reached by the breaking wave water, while the seabed is at a depth hsb, greater than the sum of the upper frame level hu and the frame/electrode rod height Lel. Figure 18 presents the respective plan view of the proposed arrangement, as well as:
  • The formed angle θf between successive frames;
  • The minimum distance dsc determined through Equation (39);
  • The widths dOx and dOx/ of the electrode station critical zone, along the semi-axes Ox and Ox/ from the beginning of the axes, which coincides with the centre of the central base, as obtained from the electrode station simulations;
  • The lengths dOy and dOy/ of the electrode station critical zone, along the semi-axes Oy and Oy/ from the beginning of the axes, as obtained from the electrode station simulations.
It is noted that, due to the simplifying assumptions of the electric fields, in the present case, there will be no differentiation between dOx, dOx/, dOy, and dOy/. Taking into account, from analytical geometry, that to ensure a distance dsc between two consecutive points located on an arc θf on a circle of radius RK1 with Nframe/ total points, it must hold that:
θ f = 360 ° N f r a m e /
d s c / 2 R K 1 = s i n θ f 2 R K 1 d s c 2 × s i n 180 ° / N f r a m e /
Therefore, through the implementation of Equation (42), for six frames, it holds that:
R K 1 d s c
The respective surface Scr−VIΧ is calculated through Equation (40).
It is a completely different solution that places the electrodes at a greater depth and limits the intervention on the coast, requiring, however, a more special civil engineering project. In terms of field results, the risk to the diver can be practically reduced when maintaining a frame under conditions of full load of the electrode station, by appropriately increasing the RK1 dimension from the centre of the base. The suspension-lifting-positioning systems of the electrodes will have a lever-arm typically of the order of (RK1 + f/2) if a common system is installed, or of the order of f/2 when one system per frame is installed. The construction of the central base and the guides can be made of unreinforced concrete, or of solid artificial blocks of modular connections, or other such heavy structures (of about 10 t or heavier), although the construction of small-radius guides may entail risks of overturning, etc. Further additional difficulties exist in the case of a great seabed inclination in the construction area of the central base. In the case of a large radius RK1, a cavity of radius R1 can be placed internally, which will limit both the construction material used and the absolute potential developed by the respective construction. Furthermore, it requires an underwater interconnection of the central ground conductor of the electrode station on the central base, with the corresponding inverter of the HVDC interconnection (whereas previous configurations do not face this problem to same extent, due to the protective dam).

3.11. 10th Electrode Station Configuration—Straight Frames Adapted Perimetrically to a Central Base

The configuration of a central base, with radial placement of the electrode frames, presents the construction problem of the auxiliary guides of the frames, in the form of a cantilever. An alternative approach is to place the electrode frames tangential to the central base, reducing at the same time the requirements of the frame suspension-lifting-positioning system. Of course, in this case too, the requirement applies that the straight frames be placed at such a depth that they are always out of reach of the breaking wave. Figure 19 shows the view of the arrangement of vertical straight frames of length f in the sea around a central base of a polygon, inscribed in a circle of gross radius RK2 (where gross radius means the radius of the structure, along with the necessary gap dr1, from the construction), which are placed perimetrically and which constitutes the ninth configuration. The upper frame level is at depth hu, which is greater than the depth reached by the breaking wave water, while the seabed is at hsb, which is greater than the sum of the upper frame level hu and the frame/electrode rod height Lel.
Accordingly, Figure 20 shows the respective plan view of the proposed arrangement for six electrode frames. The formed angle θf between successive frames (according to Equation (41)) and the minimum distance dsc (according to Equation (39)) can be seen, as well as the widths dOx and dOx/ of the critical zone of the electrode station, along the semi-axes Ox and Ox/ from the beginning of the axes (which is the centre of the central base), and the lengths dOy and dOy/ of the critical zone of the electrode station, along the semi-axes Oy and Oy/ from the beginning of the axes, as obtained from the electrode station simulations.
With the help of Figure 21, the necessary “gross” radius RK2 of the central base is calculated as follows: The Nframe/ frames are placed in a circle of centre O and radius RK2 in such a way that the edges of each frame lie on this circle, while the frames are distributed per arc of angle θf. So, in the present case, without loss of generality, the following apply:
A B = C D = E F = G H = I J = K L = b 1 f
B C = D F = F G = H I = J K = L A = b 2 d s c
O A = O B = O C = O D = O E = O F = O G = O H = O I = O J = O K = O L = R K 2
However, observing the angles formed in Figure 21, where θ1 is the arc angle corresponding to any frame and θ2 is the arc angle corresponding to the distance between two consecutive frames, it follows that:
θ f = M O R = M O B + B O C + C O R = θ 1 2 + θ 2 + θ 1 2 = θ 1 + θ 2
The points M, N, Q, and R are the points of intersection of the respective perpendicular bisectors, which are also bisectors on the isosceles triangles OAB, OBC, OCA, and OCD, respectively.
Applying the sine definition in the triangles OBM and OBN, the following result, respectively:
s i n M O B = s i n θ 1 2 = B M O B = b 1 / 2 R K 2 θ 1 = 2 × a s i n b 1 2 × R K 2 2 × a s i n f 2 × R K 2
s i n B O N = s i n θ 2 2 = B N O B = b 2 / 2 R K 2 θ 2 = 2 × a s i n b 2 2 × R K 2 2 × a s i n d s c 2 × R K 2
From the combination of Equations (47)–(49), the following equation is determined, given the frame length f, the minimum distance between consecutive frames dsc, and the arc angle between consecutive frames θf (from relation (39)), which can be solved through numerical analysis, with respect to the radius RK2:
θ f = 2 × a s i n f 2 × R K 2 + 2 × a s i n d s c 2 × R K 2
Alternatively, the necessary “gross” radius RK2 of the central base (so as not to apply a numerical analysis) is calculated as follows: Initially, the angle θ3 is calculated through the angles of the quadrilateral OMPR as supplementary to θf:
θ 3 = B P C = M P R = A P D = 360 o P R O R O M O M P = 360 o 90 o θ f 90 o = 180 o θ f
Applying the law of cosines for the angle θ3 of the BPC triangle, the length 1 is calculated:
B C 2 = B P 2 + C P 2 2 × B P × C P × c o s B P C b 1 2 = 1 2 + 1 2 2 × 1 × 1 × c o s θ 3 b 1 2 = 2 × 1 2 2 × 1 2 × c o s 180 o θ f 1 = b 1 2 × 1 + c o s θ f d s c 2 × 1 + c o s θ f
Applying the law of cosines for the angle θ3 of the APC triangle, the length 2 is calculated:
A C 2 = A P 2 + C P 2 2 × A P × C P × c o s A P C 2 2 = b 1 + 1 2 + 1 2 2 × b 1 + 1 × 1 × c o s θ 3 2 2 = b 1 + 1 2 + 1 2 2 × b 1 + 1 × 1 × c o s 180 o θ f 2 = b 1 + 1 2 + 1 2 + 2 × b 1 + 1 × 1 × c o s θ f f + 1 2 + 1 2 + 2 × f + 1 × 1 × c o s θ f
Through the definition of sine in OAC triangles, the “gross” radius RK2 of the central base is obtained:
s i n A O Q = s i n θ f 2 = O Q O A = 2 / 2 R K 2 R K 2 = 2 2 × s i n θ f / 2
So, through the successive application of Equations (52)–(54), the calculation of RK2 is carried out directly. Then, by choosing an appropriate value of the gross radius RK2/ of the central base, through the definition of sine in the OBM triangle, the final angle θ1/ is obtained:
s i n M O B = s i n θ 1 / 2 = B M O B = b 1 / 2 R K 2 / θ 1 = 2 × a s i n b 1 2 × R K 2 / 2 × a s i n f 2 × R K 2 /
Therefore, the distance of any frame dOfr, from the centre O of the arrangement (with the help of the definition of cosine on the final angle θ1//2), is equal to:
c o s M O B = c o s θ 1 / 2 = O M O B = d O f r R K 2 / d O f r = R K 2 / × c o s θ 1 / 2
The respective surface Scr−Χ is calculated through Equation (40).
Essentially, it is a variation in the central base solution, with the placement of the straight frames around the perimeter, instead of radially. There is the requirement of a special civil engineering project, but without cantilever-shaped frame guides (first advantage compared to the previous solution) and with a larger base radius (main disadvantage compared to the previous solution), which can be made of unreinforced concrete or solid artificial blocks of modular connections or other such heavy structures (about 10 t and above), at least for the perimeter. Internally, it can be filled with other inert materials if required. As for the field results, they are expected to be satisfactory. The suspension-lifting-positioning systems of the electrodes will have a lever-arm, typically of the order of RK2 + dr1 (if a common system is installed), or of the order of dr1 if one system per frame is installed. Moreover, additional difficulties exist in the case of a steep seabed inclination in the area of construction of the central base. In the case of a large radius RK2, a cavity of radius R1 can be formed internally, which limits both the construction material used and the absolute potential developed by the relevant device. Additionally, similar to the ninth configuration, the underwater interconnection of the central ground conductor of the electrode station on the central base is required, with the corresponding HVDC interconnection converter (whereas configurations 1 through 8 have this problem in a more limited manner).

4. Application of the Analytical Methodology for the Calculation of Electric Field Strength in the Electrode Station Various Configurations

4.1. General Remarks

To determine the electric field strength, in the area close to the electrode station, the superposition methodology is employed. In particular, in the configuration of straight frames parallelly positioned to the axis of the dam (Figure 4) and for each electrode positioned at (x, y) coordinates of Figure 5, the theorem of superposition is employed via Equation (4) through Equation (9). Moreover, of particular consideration is the examination of current intensity densities, during periodic maintenance at the steady state, since it is then that the least favourable results are observed concerning safety distance and with regard to the point electric field criterion of 1.25 V/m. The whole array is adapted on an appropriate simulation canvas that, in the basic configuration, is 60 m (on the Ox semi-axis) by 160 m (on the yOy’ axis—parallel to the frame), as in Figure 4, or even larger in case the configuration extends to a larger area. The step is 0.05 m by 0.05 m. The simulation involves the uniform loading of the station (be it 6-frame or 5-frame), by setting, in turn, the respective frames out of operation, thus determining the electric field strength all over the Oxy, as well as the area where it reaches values higher than Elimit_S = 1.25 V/m. The results include the following, depending on the mode of operation:
  • The electric current density Jst with respect to the peripheral surface;
  • The width of the electrode station critical zone dstv, perpendicular to the dam (on the xOx’ axis);
  • The length of the electrode station critical zone cud on the dam above the centre of the dam (on the yOy’ axis);
  • The length of the electrode station critical zone cbd on the dam below the centre of the dam (on the yOy’ axis);
  • The distance sbc between the lowermost rod of the electrode station on the dam, which is connected to the power supply and the nearest point of protection (electrode not connected to power supply for maintenance purposes, dam end);
  • The distance suc between the uppermost rod of the electrode station on the dam, which is connected to the power supply and the nearest point of protection (electrode not connected to the power supply for maintenance purposes, dam end);
  • The distance of the lowermost rod of the electrode station bc on the dam from the centre of the dam that is connected to the power supply (on yOy’);
  • The distance of the uppermost rod of the electrode station uc on the dam from the centre of the dam, connected to the power supply (by yOy’);
  • The distance ypr between the nearest point of protection (electrode not connected to power supply for maintenance purposes, dam end) from the centre of the dam that is connected to the power supply (on yOy’);
  • The safety margin Dypr in relation to an initial preliminary study of a frame under the same conditions (where negative values indicate a requirement for a greater safety distance);
  • The maximum electric field strength of the arrangement Emax.
To calculate the electrode-station-to-remote-earth resistance Rel and the maximum value of the absolute potential Vrel_max, the corresponding simulation is extended to a canvas of 150 km (Ox axis) by 160 m (yOy’ axis—parallel to the dam axis) and with a step of 0.10 m up to 100 m, 1.0 m from 100 to 200 m, 5.0 m from 200 to 1000 m, 10 m from 1000 to 10,000 m, and 100 m from 10 km to 150 km on the Ox axis, and by 0.10 m on the yOy’ axis, as in Figure 4. In case larger dimensions are required in the near-field, the respective canvas is suitably modified.

4.2. Basic Electrode Station Configuration—Straight Frames in Series, Each Placed Parallel to the Longitudinal Axis of the Dam (1st Configuration)

From the respective study of the electric field, according to Section 5.4 in [2], for the Korakia area, the values of the corresponding geometric quantities for vertical electrodes are td = 5.0 m at sea level and 18.0 m at a depth of 2.60 m; dr1 = 1.0 m; f = 6.0 m; dfv = 10.90 m; sc = 8.53 m, which, for reasons of location, was reduced to 6.5 m; dstv = 50.3 m; cbd = cud = 67.80 m; p = 0.50 m; hu = 1.50 m; hm = 2.57 m; hd = 3.63 m; and hsb = 5.00 m. The difference between the estimated width of the frame critical zone dfv and the actual required width dstv of the electrode station critical zone is very large (5 times larger), as is the difference between the distance sc and the actual required length (as determined by the calculation (cud − 3∙ℓf)/3.5 = 14.23 m), which is almost double. The electrode-station-to-remote-earth resistance Rel and the maximum value of the absolute potential Vrel_max, amount to 19.51 Ω and 22.77 kV, respectively. The worst results occur during maintenance of the first or sixth frame.
From the respective study of the electric field, for the area of Stachtoroi, according to Section 5.4 in [2], the values of the corresponding geometric quantities for vertical electrodes are: td = 5.0 m at sea level and 16.0 m at a depth of 3.0 m; dr1 = 1.0 m; f = 6.0 m; dfv = 7.95 m; sc = 5.80 m, which, for reasons of location, was reduced to 4.50 m; dstv = 36.3 m; cbd = cud = 52.30 m; p = 0.50 m; hu = 1.00 m; hm = 2.07 m; hd = 3.13 m; and hsb = 3.50 m. The difference between the estimated width of the frame critical zone dfv and the actual required width dstv of the electrode station critical zone is again large (4.5 times larger), as is the difference between the distance sc and the actual required length (as determined by the calculation (cud − 3∙f)/3.5 = 9.8 m), which is 1.5 times larger than required. The electrode-station-to-remote-earth resistance Rel and the maximum value of the absolute potential Vrel_max, amount to 14.82 Ω and 17.30 kV, respectively. The worst results occur during maintenance of the first or sixth frame.
Essentially, it turns out that the estimation of the electric field strength through a single frame is not sufficient and the placement of the electrodes inside the respective pond, parallel to the axis of the dam, is marginally performed, achieving (in the area of the frame that does not operate for maintenance reasons/fault) electric field strengths of the order of 3 V/m, which are higher than the 2.5 V/m required by [1], for the unprotected diver next to the electrode. The corresponding easement area in front of the dam extends to 45 m in order to ensure an electric field strength of less than 1.25 V/m, which is set as a limit of non-disturbance of all kinds of marine mammals, according to [1,27,35]. However, this arrangement is the most typical of near-shore submerged electrodes and is distinguished for the easy suspension-lifting-positioning system of electrodes due to their proximity to the dam.

4.3. Second Electrode Station Configuration—Straight Frames in Series, Each Vertically Placed on the Longitudinal Axis of the Dam

The respective configuration of the electrode station is conducted according to Figure 6, where the straight frame has the characteristics of the basic configuration (Νel_frame = 13, p = 0.50 m, f = 6.00 m). In the case of Korakia, the distance between the frames dfv along yOy/ is 10.9 m, with the consequence that the total necessary estimated length of protective dam st−II, behind which the arrangement will be placed, is 77.0 m (of which 3.5 m, on each outer side, can be considered as on the shore). Accordingly, for the case of Stachtoroi, the distance between the frames dfv along the yOy/ axis is 8.0 m, with the consequence that the total necessary estimated length of protective dam st−II, behind which the arrangement will be placed, is 56.7 m (of which 3.4 m, on each outer side, can be considered as on the shore). From the respective simulation, the results of Table 1 are obtained. Indicatively, Figure 22 shows the electric field strength and the area of developing electric field strength greater than 1.25 V/m, for the worst-case scenario of the Korakia area, with five frames operating (one of the two extreme ones out of operation, under maintenance conditions).
From the study of the respective results, for the area of Korakia, the following emerges:
  • The deviation at the extremes of the array reaches up to 27.3 m, depending on the loading method (especially when the five frames are loaded consecutively). However, in the area of the non-operating frame, the electric field strength rises slightly over 2.5 V/m; therefore, no issues arise (regarding safety) when maintaining the frames, provided the diver has taken the appropriate measures.
  • The deviation in the maximum developing electric field strength of the electrode station, compared to a single frame (24.98 V/m against 24.06 V/m, according to Table 10 in [2]), is of the order of 3.8%, which is limited and smaller than that of the first configuration (24.98 V/m versus 26.09 V/m of Table 12 in [2]). However, the necessary distances are observed here.
  • The critical zone of the dam extends beyond it by 42.7 m on the outer side (with a crest width of 5 m and a suspension distance of at least 1 m) along the xOx/ axis (perpendicular to the dam), which is slightly better than that of the first configuration (against 44.3 m).
  • The critical zone of the dam extends beyond it by 62 m (i.e., 31 m on either side) along the yOy/ axis (parallel to the dam axis) in the coastal area. This is partly due to the fact that the initially estimated required length of the assumed electrode station is 77.0 m (along the yOy/ axis), the corresponding actual required length is 131.5 m (from the results of the superposition model, according to Table 1), while the available length is only 70 m.
  • The developed absolute potentials and the corresponding values of the electrode station resistance, with respect to remote earth, are slightly better (22.48 kV, 19.26 Ω) compared to the initial configuration (22.77 kV and 19.5 Ω, according to Table 15 in [2]).
From the study of the respective results, for the area of Stachtoroi, the following emerges:
  • The deviation at the extremes of the array reaches up to 20.6 m, depending on the loading method (especially when the five frames are loaded consecutively). However, in the area of the non-operating frame, the electric field strength rises slightly over 2.5 V/m; therefore, no issues arise (regarding safety) when maintaining the frames, provided the diver has taken the appropriate measures.
  • The deviation in the maximum developing electric field strength of the electrode station compared to a single frame (19.08 V/m against 17.96 V/m, according to Table 11 in [2]) is of the order of 6.2%, which is limited and smaller than that of the first configuration (19.08 V/m versus 19.73 V/m of Table 14 in [2]). However, the necessary distances are observed here.
  • The critical zone of the dam extends beyond it by 29.7 m on the outer side (with a crest width of 5 m and a suspension distance of at least 1 m) along the xOx/ axis (perpendicular to the dam), which is practically identical to the value of the first configuration (against 30.3 m).
  • The critical zone of the dam extends beyond it by 48 m (i.e., 24 m on either side) along the yOy/ axis (parallel to the dam axis) in the coastal area. This is partly due to the fact that the initially estimated required length of the assumed electrode station is 56.7 m (along the yOy/ axis), the corresponding actual required length is 97.8 m (from the results of the superposition model, according to Table 1), while the available length is only 50 m.
  • The developed absolute potentials and the corresponding values of the electrode station resistance, with respect to remote earth, are slightly worse (18.40 kV, 15.76 Ω) compared to the initial configuration (17.30 kV and 14.82 Ω, according to Table 15 in [2]).
Summing up, the second configuration only slightly improves the overall results, providing, most importantly, a better exploitation of the water within the protective barrier and achieving slightly better safety conditions for the diver during the maintenance phase at the expense of a more complex construction.

4.4. Third Electrode Station Configuration—Straight Frames in Two Overlapping Rows, Each Placed Parallel to the Longitudinal Axis of the Dam in Alignment with Each Other

The corresponding configuration of the electrode station is carried out according to Figure 7, where the straight frame has the characteristics of the basic configuration (Νel_frame = 13, p = 0.50 m, f = 6.00 m). In the case of Korakia, the distance between the frames dfv (on the xOx/ axis) is 11.0 m, with the consequence that the total width, according to Equation (31), amounts to 11.25 m. The distance between the frames (on the yOy/ axis) is equal to sc, taken here as 10.0 m (against the estimated 8.53 m, according to Table 10 in [2]), due to length availability. Therefore, the total necessary estimated length of protective dam, behind which the array will be situated, by Equation (30), will be equal to 58.0 m. Accordingly, for the case of Stachtoroi, the distance between the frames dfv (on the xOx/) is 8.0 m, resulting in a total width, according to Equation (31), of 8.25 m. The distance between the frames (on the yOy/) is equal to sc, taken here as 6.0 m (against the estimated 5.788 m, according to Table 11 in [2]), due to length availability. Therefore, the total necessary estimated length of the protective dam, behind which the array will be situated, according to Equation (30), will be equal to 42.0 m. From the relevant simulation, the results of Table 2 are obtained, which include, depending on the mode of operation:
  • The current density Jst with respect to the peripheral surface;
  • The width dstv_Ox of the electrode station critical zone, vertical to the dam (along the semi-axis Ox);
  • The width dstv_Ox/ of the electrode station critical zone, vertical to the dam (along the semi-axis Ox/);
  • The length of the electrode station critical zone cud on the dam above the centre of the dam (on the yOy’ axis);
  • The length of the electrode station critical zone cbd on the dam below the centre of the dam (on the yOy’ axis);
  • The maximum electric field strength within the area of the frame that is out of operation Eoff;
  • The maximum electric field strength of the arrangement Emax.
Due to the more complicated shape, it is preferred, in the present case, to give the broader limits of the straight rectangles, which fully contain the corresponding zones above 1.25 V/m, and to investigate—in the specific frames under maintenance—what occurs in terms of electric field strength. Indicatively, Figure 23 shows the electric field strength and the area of developing electric field strength greater than 1.25 V/m, for the worst-case scenario of the Korakia area, with five frames operating (with one of the first or fifth frames out of operation, under maintenance conditions).
From the study of the results for the region of Korakia, the following emerges:
  • The deviation at the extremes of the array (along the yOy/ axis) reaches up to 42.2 m, depending on the loading method (especially when the five frames are loaded consecutively), while, along the xOx/ axis, it reaches up to 49.25 m (especially when the five frames are loaded, except for one of the extreme ones, i.e., 1st, 2nd, 5th, or 6th). However, in the area of the non-operating frame, the electric field strength rises slightly over 2.5 V/m; therefore, no issues arise (regarding safety) when maintaining the frames, provided the diver has taken the appropriate measures.
  • The deviation in the maximum developing electric field strength of the electrode station compared to a single frame (26.12 V/m against 24.06 V/m according to Table 10 in [2]) is of the order of 8.6%, practically identical to that of the first configuration (26.12 V/m versus 26.09 V/m of Table 12 in [2]) and worse compared to that of the second configuration (26.12 V/m against 24.98 V/m of Table 1). However, the necessary distances are observed here.
  • In Figure 23b, the areas between the electrode frames are marked, where the strength of the electric field is significantly reduced below 1.25 V/m. However, this does not occur in the area of the frame that has been turned off, although it does not exceed the value of 3.0 V/m.
  • The critical zone of the dam extends beyond it by 43.3 m (with a crest width of 5 m and a suspension distance of at least 1 m) along the xOx/ axis (perpendicular to the dam), which is slightly better than that of the first configuration (44.3 m).
  • The critical zone of the dam extends beyond it by 52.2 m (i.e., 26.1 m on either side) along the yOy/ axis (parallel to the dam axis) in the coastal area. Although the initially estimated required length of the assumed electrode station is 58.0 m (along the yOy/ axis), the corresponding actual required length is 122.2 m (from the results of the superposition model, according to Table 2), while the available length is only 70 m.
  • The developed absolute potentials and the corresponding values of the electrode station resistance, with respect to remote earth, are quite worse (26.98 kV, 23.12 Ω) compared to the original configuration (22.77 kV and 19.5 Ω, according to Table 15 in [2]).
  • In field behaviour results, there is a similarity in the case of single-frame non-operation, among the 1st, 2nd, 5th, and 6th frames, as well as between the 3rd and 4th, through an appropriate mirroring consideration. However, when determining the absolute potentials, there is a slight variation since the integration is always carried out on the Ox semi-axis.
From the study of the results for the region of Stachtoroi, the following emerges:
  • The deviation at the extremes of the array (along the yOy/ axis) reaches up to 24.7 m depending on the loading method (especially when the five frames are loaded consecutively), and along the xOx/ axis, it reaches up to 36.18 m (especially when the five frames are loaded, except for one of the extreme ones, i.e., 1st, 2nd, 5th, or 6th). However, in the region of the non-operating frame, the corresponding electric field strength rises slightly over 2.5 V/m; therefore, no issues arise (regarding safety) when maintaining the frames, provided the diver has taken the appropriate measures.
  • The deviation in the maximum developing electric field strength of the electrode station compared to a single frame (20.03 V/m against 17.96 V/m, according to Table 11 in [2]) is of the order of 11.5%, which is significantly greater than those in the two previous configurations (19.73 V/m for the first configuration according to Table 14 in [2] and 19.08 V/m for the second configuration according to Table 1), despite the fact that the necessary distances are observed.
  • The critical zone of the dam extends beyond it by 30.8 m (with a crest width of 5 m and a suspension distance of at least 1 m) along the xOx/ axis (perpendicular to the dam), which is slightly longer than that of the first configuration (30.3 m).
  • The critical zone of the dam extends beyond it by 41.4 m (i.e., 20.7 m on either side) along the yOy/ axis (parallel to the dam axis) in the coastal area. Despite the fact that the initially estimated required length of the assumed electrode station is 42.0 m (along the yOy/ axis), the corresponding actual required length is 91.4 m (from the results of the superposition model, according to Table 2), while the available length is only 50 m.
  • The developed absolute potentials and the corresponding values of the electrode station resistance, with respect to remote earth, are quite worse (21.48 kV, 18.40 Ω) compared to the initial configuration (17.30 kV and 14.82 Ω, according to Table 15 in [2]).
  • In field behaviour results, there is a similarity in the case of single-frame non-operation, among the 1st, 2nd, 5th, and 6th frames, as well as between the 3rd and 4th, through an appropriate mirroring consideration. However, when determining the absolute potentials, there is a slight variation since the integration is always carried out on the Ox semi-axis.
Summing up, the third configuration presents more unfavourable field results compared to the previous configurations, which do not create a problem for the diver during maintenance, with the benefit of a more compact positioning of the electrode frames in a limited pond. An additional disadvantage is the more complex station structure due to the second row of frames at a distance from the dam.

4.5. Fourth Electrode Station Configuration—Straight Frames in Two Successive Rows, Each Parallel to the Longitudinal Axis and Non-Overlapping on the Vertical Axes of the Dam

The respective configuration of the electrode station is performed according to Figure 8, where the straight frame has the characteristics of the basic configuration (Νel_frame = 13, p = 0.50 m, f = 6.00 m). In the case of Korakia, the distance between the two rows of frames dfv (on xOx/) is 11.0 m (against the estimated 10.90 m according to Table 10 in [2]); consequently, the total width, by Equation (31), will be 11.25 m, as is also the case in the third configuration. The estimated necessary distance between the frames sc (on yOy/) is equal to 8.53 m (according to Table 10 in [2]), and applying Equation (33), the distance between two consecutive frames of the same row ℓsfc is determined as equal to max{6, 8.53} = 8.53 and, due to length availability, is set as equal to 9.0 m. Therefore, the total necessary estimated length of the protective dam (behind which the arrangement will be placed), according to relation (34), will be equal to 66.0 m. Accordingly, for the case of Stachtoroi, the distance between the two rows of frames dfv (on the xOx/) is 8.0 m (against the estimated 7.951 m, according to Table 11 in [2]); consequently, the total width, through Equation (31), will be 8.25 m, as is also the case in the third configuration. The estimated necessary distance between the frames sc (on yOy/) is equal to 5.788 m (according to Table 11 in [2]), and applying Equation (33), the distance between two consecutive frames of the same row ℓsfc is determined as equal to max{6, 5.778} = 6.0 and, due to length availability, is set equal to 6.0 m. Therefore, the total necessary estimated length of the protective dam (behind which the arrangement will be placed), according to Equation (34), will be equal to 47.6 m. From the respective simulation, the results of Table 3 are obtained, with the corresponding parameters of Table 2. Indicatively, Figure 24 shows the electric field strength and the area of developing electric field strength greater than 1.25 V/m for the most unfavourable case of the Korakia area, with five frames of operation (except for the non-operating fifth frame, under maintenance conditions).
From the study of the results for the region of Korakia, the following emerges:
  • The deviation at the extremes of the array (along the yOy/ axis) reaches up to 29.4 m, depending on the loading method, and along the xOx/axis, it reaches up to 49.0 m (especially when the five frames are loaded, except for the sixth or first). However, in the area of the non-operating frame, the electric field strength is 3.1 V/m (slightly above 2.5 V/m); therefore, no issues arise (regarding safety) when maintaining the frames, provided the diver has taken the appropriate measures.
  • The deviation in the maximum developing electric field strength of the electrode station compared to a single frame (26.14 V/m against 24.06 V/m, according to Table 10 in [2]) is of the order of 8.6%. That is, it is slightly higher compared to the first configuration (26.14 V/m against 26.09 V/m, according to Table 12 in [2]), almost identical compared to the third (26.14 V/m against 26.12 V/m according to Table 2), and much higher than that of the second (26.14 V/m against 19.26 V/m according to Table 1).
  • In Figure 24b, regions between the electrode frames are shown, where the electric field strength is significantly reduced below 1.25 V/m. However, this does not occur in the area of the frame that is set out of operation, although it does not exceed the value of 3.1 V/m.
  • The critical zone of the dam extends beyond it by 43.0 m (with a crest width of 5 m and a suspension distance of at least 1 m) along the xOx/ axis (perpendicular to the dam), which is slightly better than those in the first (44.3 m) and third configurations (43.3 m) and slightly worse than that of the second (42.7 m).
  • The critical zone of the dam extends beyond it by 54.8 m (i.e., 27.4 m on either side) along the yOy/ axis (parallel to the dam axis) in the coastal area. Despite the fact that the initially estimated required length of the assumed electrode station is 66.0 m (along the yOy/ axis), the respective actual required length is 124.8 m (from the results of the superposition model in Table 3), while the available length is only 70 m.
  • The developed absolute potentials and the corresponding values of the electrode station resistance, with respect to remote earth, are quite worse (26.14 kV, 22.40 Ω) compared to the first (22.77 kV and 19.5 Ω according to Table 15 in [2]) and second configurations (22.48 kV and 19.26 Ω of Table 1) and slightly better than that of the third (26.98 kV and 23.12 Ω of Table 2).
  • In field behaviour results, there is a similarity in the case of single-frame non-operation, among the 1st, 2nd, 5th, and 6th frames, as well as between the 3rd and 4th, through an appropriate mirroring consideration. However, when determining the absolute potentials, there is a slight variation since the integration is always performed on the Ox semi-axis.
From the study of the results for the region of Stachtoroi, the following emerges:
  • The deviation at the extremes of the array (along the yOy/ axis) reaches up to 22.5 m, depending on the loading method, and along the xOx/ axis, it reaches up to 36.95 m (especially when the five frames are loaded, except for the sixth or first). However, in the area of the non-operating frame, the respective electric field strength is slightly above 2.5 V/m; therefore, no issues arise (regarding safety) when maintaining the frames, provided the diver has taken the appropriate measures.
  • The deviation in the maximum developing electric field strength of the electrode station compared to a single frame (20.14 V/m against 17.96 V/m, according to Table 11 in [2]) is of the order of 12.14%, which is significantly greater than those in previous configurations (19.73 V/m for the first configuration according to Table 14 in [2], 19.08 V/m for the second one according to Table 1, and 20.03 V/m for the third configuration according to Table 2).
  • The critical zone of the dam extends beyond it by 31.0 m (with a crest width of 5 m and a suspension distance of at least 1 m) along the xOx/ axis (perpendicular to the dam), which is slightly longer than the first configuration (30.3 m).
  • The critical zone of the dam extends beyond it by 42.54 m (i.e., 21.3 m on either side) along the yOy/ axis (parallel to the dam axis) in the coastal area. Although the initially estimated required length of the assumed electrode station is 47.6 m (along the yOy/ axis), the respective actual required length is 92.54 m (from the results of the superposition model in Table 3), while the available length is only 50 m.
  • The developed absolute potentials and the corresponding values of the electrode station resistance, with respect to remote earth, are quite worse (21.58 kV, 18.49 Ω) against the first (17.30 kV and 14.82 Ω according to Table 15 in [2]) and second configurations (18.40 kV and 15.76 Ω of Table 1), and slightly better than those in the third configuration (21.48 kV and 18.40 Ω of Table 2).
  • In field behaviour results, there is a similarity in the case of single-frame non-operation, among the 1st, 2nd, 5th, and 6th frames, as well as between the 3rd and 4th, through an appropriate mirroring consideration. However, when determining the absolute potentials, there is a slight variation since the integration is always carried out on the Ox semi-axis.
Summing up, the fourth configuration presents similar field results compared to the third. It has the advantage of the non-overlapping frames, regarding suspension/approach capabilities, with respect to the dam, while having the same disadvantage as the third configuration (in terms of more complex station construction), due to the second row of frames at a distance from the dam.

4.6. Fifth Electrode Station Configuration—Straight Frames in Two Successive Rows, Each Vertical to the Longitudinal Axis of the Dam and Aligned with Each Other

The respective configuration of the electrode station is carried out according to Figure 9, where the straight frame has the characteristics of the basic configuration (Νel_frame = 13, p = 0.50 m, f = 6.00 m). In the case of Korakia, the distance between the two rows (on the xOx/) is equal to sc, taken here as equal to 9.0 m (against the estimated 8.53 m according to Table 10 in [2]); consequently, the total width according to Equation (36) will be 21.0 m. The distance between the frames (on the yOy/ axis) is equal to dfv, which is taken here to be 11.0 m (against the estimated 10.9 m according to Table 10 in [2]) due to length availability; thus, the total necessary estimated length of the protective dam (behind which the arrangement will be placed), according to Equation (35), will be equal to 44.366 m. Accordingly, for the case of Stachtoroi, the distance between the two rows (on the xOx/ axis) is equal to sc, which is taken here as 6.0 m (against the estimated 5.788 m, according to Table 11 in [2]); consequently, the total width according to Equation (36) will be 18.0 m. The distance between the frames (on the yOy/ axis) is equal to dfv, taken here as 8.0 m (against the estimated 7.951 m according to Table 11 in [2]) due to length availability. Therefore, the total necessary estimated length of the protective dam (behind which the arrangement will be placed) according to Equation (35) will be equal to 32.366 m. From the respective simulation, the results of Table 4 are obtained, with the corresponding parameters of Table 2. Indicatively, Figure 25 shows the electric field strength and the area of developing electric field strength greater than 1.25 V/m for the most unfavourable scenario, for the area of Korakia, with five frames operating (sixth frame out of operation, under maintenance conditions).
From the study of the results for the region of Korakia, the following emerges:
  • The deviation at the extremes of the array (along the yOy/ axis) reaches up to 36.2 m, and along the xOx/ axis up to 46.7 m (especially when five frames are loaded, except the 1st, 2nd, 5th, or 6th). However, in the area of the non-operating frame, the respective electric field strength is 3.3 V/m; therefore, no issues arise (regarding safety) when maintaining the frames, provided the diver has taken the appropriate measures.
  • The deviation in the maximum developing electric field strength of the electrode station compared to a single frame (26.29 V/m against 24.06 V/m, according to Table 10 in [2]) is of the order of 9.3%, slightly higher compared to the 1st, 3rd, and 4th configurations (26.09 V/m according to Table 12 in [2], 26.12 V/m according to Table 2, and 24.14 V/m according to Table 3, respectively) and much higher compared to the 2nd configuration (19.26 V/m according to Table 1).
  • In Figure 25b, regions between the electrode frames are shown, where the electric field strength decreases significantly below 1.25 V/m. However, this does not occur in the area of the frame that is set out of operation, although it does not exceed the value of 3.3 V/m.
  • The critical zone of the dam extends beyond it by 40.6 m (with a crest width of 5 m and a suspension distance of at least 1 m) along the xOx/ axis (perpendicular to the dam), which is better than those in all previous configurations (1st→44.3 m, 2nd→42.7 m, 3rd→43.3 m, 4th→43.0 m).
  • The critical zone of the dam extends beyond it by 46.7 m (i.e., 23.4 m on either side) along the yOy/ axis (parallel to the dam axis) in the coastal area. Despite the fact that the initially estimated required length of the assumed electrode station is 44.4 m (along the yOy/ axis), the corresponding actual required length is 116.7 m (from the results of the superposition model, according to Table 4), while the available length is only 70 m.
  • The developed absolute potentials and the corresponding values of the electrode station resistance, with respect to remote earth, are quite worse (25.71 kV, 22.02 Ω) compared to the first (22.77 kV and 19.5 Ω, according to Table 15 in [2]) and second configurations (22.48 kV and 19.26 Ω of Table 1) but slightly better compared to the third (26.98 kV and 23.12 Ω of Table 2) and fourth (26.14 kV and 22.40 Ω of Table 3).
  • In field behaviour results, there is a similarity in the case of single-frame non-operation, among the 1st, 2nd, 5th, and 6th frames, as well as between the 3rd and 4th, through an appropriate mirroring consideration. However, when determining the absolute potentials, there is a slight variation since the integration is always carried out on the Ox semi-axis.
From the study of the results for the region of Stachtoroi, the following emerges:
  • The deviation at the extremes of the array (along the yOy/ axis) reaches up to 27.17 m and along the xOx/ axis up to 33.91 m (especially when five frames are loaded, except the 1st, 2nd, 5th, or 6th). However, in the area of the non-operating frame, the corresponding electric field strength is 3.3 V/m; therefore, no issues arise (regarding safety) when maintaining the frames, provided the diver has taken the appropriate measures.
  • The deviation in the maximum developing electric field strength of the electrode station compared to a single frame (20.16 V/m against 17.96 V/m, according to Table 11 in [2]) is of the order of 12.2%, which is significantly greater than those in the previous configurations (19.73 V/m for the first configuration according to Table 14 in [2], 19.08 V/m for the second configuration according to Table 1, 20.03 V/m for the third configuration according to Table 2, and 20.14 V/m for the fourth configuration according to Table 3).
  • The critical zone of the dam extends beyond it by 27.9 m (with a crest width of 5 m and a suspension distance of at least 1 m) along the xOx/ axis (perpendicular to the dam), which is better than those in all previous configurations (1st→30.3 m, 2nd→29.7 m, 3rd→30.8 m, 4th→31.0 m).
  • The critical zone of the dam extends beyond it by 36.7 m (i.e., 18.4 m on either side) along the yOy/ axis (parallel to the dam axis) in the coastal area. Although the initially estimated required length of the assumed electrode station is 33.4 m (along the yOy/ axis), the corresponding actual required length is 86.7 m (from the results of the superposition model, in Table 4), while the available length is only 50 m.
  • The developed absolute potentials and the corresponding values of the electrode station resistance, with respect to remote earth, are considerably worse (20.35 kV, 17.43 Ω) compared to the first (17.30 kV and 14.82 Ω according to Table 15 in [2]) and second configurations (18.40 kV and 15.76 Ω according to Table 1) and slightly better compared to the third (21.48 kV and 18.40 Ω according to Table 2) and fourth (21.58 kV and 18.49 Ω according to Table 3).
  • In field behaviour results, there is a similarity in the case of single-frame non-operation, among the 1st, 2nd, 5th, and 6th frames, as well as between the 3rd and 4th, through an appropriate mirroring consideration. However, when determining the absolute potentials, there is a slight variation since the integration is always carried out on the Ox semi-axis.
Summing up, the fifth configuration has an advantage over the other configurations, in terms of the 10% smaller critical zone in front of the dam. However, there are no significant improvements in developing absolute potentials and respective electrode station resistance values (with respect to remote earth). In addition, it has much greater demands regarding the suspension-lifting-positioning systems of the electrodes, as well as the greater extent of dredging of the respective pond, compared to the first configuration.

4.7. Sixth Electrode Station Configuration—Straight Frames in Two Successive Rows, Each Vertical to the Longitudinal Axis of the Dam and Non-Overlapping on the Vertical One

The respective configuration of the electrode station is according to Figure 10, where the straight frame has the characteristics of the basic configuration (Νel_frame = 13, p = 0.50 m, f = 6.00 m). In the case of Korakia, the distance between the two rows (on the xOx/) is equal to sc, which is taken here as equal to 9.0 m (against the estimated 8.53 m according to Table 10 in [2]); consequently, the total width according to Equation (36) will be 21.0 m. The distance between the frames (on the yOy/) is equal to dfv, which is taken here as equal to 11.0 m (against the estimated 10.9 m according to Table 10 in [2]) due to length availability; thus, the total necessary estimated length of the protective dam (behind which the arrangement will be placed) according to Equation (38) will be equal to 49.866 m. Accordingly, for the case of Stachtoroi, the distance between the two rows (on the xOx/ axis) is equal to sc, which is taken here as equal to 6.0 m (against the estimated 5.788 m according to Table 11 in [2]); consequently, the total width according to Equation (36) will be 18.0 m. The distance between the frames (along the yOy/ axis) is equal to dfv, taken here as equal to 8.0 m (against the estimated 7.951 m according to Table 11 in [2]) due to length availability. Therefore, the total necessary estimated length of the protective dam (behind which the arrangement will be placed) according to Equation (38) will be equal to 36.366 m. From the respective simulation, the results of Table 5 are obtained, with the corresponding parameters of Table 2. Indicatively, Figure 26 shows the electric field strength and the area of developing electric field strength greater than 1.25 V/m for the most unfavourable scenario for the area of Korakia, with five frames operating (sixth frame out of operation, under maintenance conditions).
From the study of the results for the region of Korakia, the following emerges:
  • The deviation at the extremes of the array (along the yOy/ axis) reaches up to 33.96 m, and along the xOx/ axis up to 46.7 m (especially when loading five frames, except for the first or sixth). However, in the area of the non-operating frame, the corresponding electric field strength is 3.42 V/m; therefore, no issues arise (regarding safety) when maintaining the frames, provided the diver has taken the appropriate measures.
  • In Figure 26b, regions between the electrode frames are shown, where the electric field strength decreases significantly below 1.25 V/m. However, this does not occur in the area of the frame that is set out of operation, although it does not exceed the value of 3.42 V/m.
  • The deviation in the maximum developing electric field strength of the electrode station compared to a single frame (26.25 V/m against 24.06 V/m, according to Table 10 in [2]) is of the order of 9.1%, slightly higher compared to the 1st, 3rd, and 4th configurations (26.09 V/m according to Table 12 of [2], 26.12 V/m according to Table 2, and 24.14 V/m according to Table 3, respectively), much higher compared to the 2nd (19.26 V/m according to Table 1), and slightly lower compared to the 5th (26.29 V/m according to Table 4).
  • The critical zone of the dam extends beyond it by 40.7 m (with a crest width of 5 m and a suspension distance of at least 1 m) along the xOx/ axis (perpendicular to the dam), which is better than those in all previous configurations (1st→44.3 m, 2nd→42.7 m, 3rd→43.3 m, 4th→43.0 m), except for the 5th, with which it is practically identical (40.6 m).
  • The critical zone of the dam extends beyond it by 46.78 m (i.e., 23.9 m on either side) along the yOy/ axis (parallel to the dam axis) in the coastal area. Although the initially estimated required length of the assumed electrode station is 48.87 m (along the yOy/ axis), the respective actual required length is 117.78 m (from the results of the superposition model according to Table 4), while the available length is only 70 m. It is practically identical to that of the fifth configuration.
  • The developed absolute potentials and the corresponding values of the electrode station resistance, with respect to remote earth, are quite worse (25.94 kV, 22.23 Ω) compared to the first (22.77 kV and 19.5 Ω according to Table 15 in [2]) and second configurations (22.48 kV and 19.26 Ω of Table 1), slightly worse than those in the fifth configuration (25.71 kV, 22.02 Ω), and slightly better compared to the third (26.98 kV and 23.12 Ω of Table 2) and fourth (26.14 kV, 22.40 Ω).
  • In field behaviour results, there is a similarity in the case of single-frame non-operation, between the 1st and 6th, the 2nd and 5th, as well as between the 3rd and 4th, through an appropriate mirroring consideration. However, when determining the absolute potentials, there is a slight difference since the integration is always carried out on the Ox semi-axis.
From the study of the results for the region of Stachtoroi, the following emerges:
  • The deviation at the extremes of the array (on the yOy/ axis) reaches up to 25.56 m, and along the xOx/ axis up to 33.98 m (especially when loading five frames, except for the first or sixth). However, in the area of the non-operating frame, the respective electric field strength is 3.37 V/m; therefore, no issues arise (regarding safety) when maintaining the frames, provided the diver has taken the appropriate measures.
  • The deviation in the maximum developing electric field strength of the electrode station compared to a single frame (20.12 V/m against 17.96 V/m, according to Table 11 in [2]) is of the order of 12.0%, which is significant and greater than in most configurations (19.73 V/m for the first according to Table 14 in [2], 19.08 V/m for the second according to Table 1, and 20.03 V/m for the third according to Table 2), while, practically, it is identical to those in the fourth and fifth configurations (20.14 V/m according to Table 3 and 20.16 V/m according to Table 4, respectively).
  • The critical zone of the dam extends beyond it by 27.98 m (with a crest width of 5 m and a suspension distance of at least 1 m) along the xOx/ axis (perpendicular to the dam), which is better than those in almost all previous configurations (1st→30.3 m, 2nd→29.7 m, 3rd→30.8 m, 4th→31.0 m) and practically identical to that of the 5th configuration (27.9 m).
  • The critical zone of the dam extends beyond it by 37.48 m (i.e., 18.74 m on either side) along the yOy/ axis (parallel to the dam axis) in the coastal area. Although the initially estimated required length of the assumed electrode station is 36.4 m (along the yOy/ axis), the corresponding actual required length is 87.5 m (from the superposition model results in Table 5), while the available length is only 50 m.
  • The developed absolute potentials and the corresponding values of the electrode station resistance, with respect to remote earth, are considerably worse (20.51 kV, 17.57 Ω) compared to the first (17.30 kV and 14.82 Ω, according to Table 15 in [2]) and second configurations (18.40 kV and 15.76 Ω, according to Table 1), slightly worse compared to the fifth (20.35 kV and 17.43 Ω according to Table 4), and slightly better compared to the third (21.48 kV and 18.40 Ω according to Table 2) and the fourth configurations (21.58 kV and 18.49 Ω according to Table 3).
  • In field behaviour results, there is a similarity in the case of single-frame non-operation, between the 1st and 6th, the 2nd and 5th, as well as between the 3rd and 4th, through an appropriate mirroring consideration. However, when determining the absolute potentials, there is a slight difference since the integration is always conducted on the Ox semi-axis.
Summing up, the sixth configuration has an advantage over the other configurations in terms of the 10% smaller critical zone in front of the dam and is practically identical to the results of the fifth configuration. With respect to the fifth configuration, it has slightly worse field results and requires a larger extent of dredging of the corresponding pond and a similar suspension-lifting-positioning system of the electrodes, having the advantage of easier access/lifting due to the non-overlapping frames.

4.8. Seventh Electrode Station Configuration—Straight Frames in Perimeter Placement to the Protective Dam, Adapting to the Outline of the Pond under Construction

This configuration is adapted to the topography of the pond under construction, maintaining, in any case, that the straight frame has the characteristics of the basic configuration (Νel_frame = 13, p = 0.50 m, f = 6.00 m). For the case of Korakia, the respective configuration of the electrode station is conducted according to Figure 13. Based on Table 10 in [2], the minimum estimated length sc is taken as equal to 9.0 m (against the original 8.53 m). The minimum estimated width is equal to dfv, which is taken as equal to 11.0 m (against the estimated 10.9 m). Therefore, from the application of Equation (39), it follows that the minimum distance between the frames dsc is equal to 11.0 m. If the outline were a “circle”, then the equal distances between successive frames would be 26.08 m (=(192.5 − 6 × 6)/6). However, due to the angles of the formed polygon of Figure 13, after tests, the minimum distances between the frames are chosen equal to 20 m for frames on a straight line, and 19 m for the rest, which is, however, much larger than the dsc. Accordingly, for the case of Stachtoroi, the configuration of the electrode station is carried out according to Figure 14. Based on Table 11 in [2], the minimum estimated length sc is taken as equal to 6.0 m (against the original 5.788 m). The minimum estimated width is equal to dfv, which is taken to be equal to 8.0 m (against the estimated 7.951 m). Therefore, from the application of Equation (39), it follows that the minimum distance between the frames dsc is equal to 8.0 m. If the outline were a “circle”, then the equal distances between successive frames would be 14.5 m (=(123 − 6 × 6)/6). However, due to the angles of the formed polygon of Figure 14, after tests, the minimum distances between the frames are chosen equal to 12 m for frames on a straight line, and 10 m for the rest, which is, however, greater than dsc. From the respective simulation, the results of Table 6 are obtained, where the following parameters are listed:
  • The current density Jst with respect to the peripheral surface;
  • The width dOx of the electrode station critical zone, vertical to the dam (along the Ox semi-axis), from the beginning of the axes;
  • The width dOx/ of the electrode station critical zone, vertical to the dam (along the semi-axis Ox/), from the beginning of the axes;
  • The length dOy of the electrode station critical zone, parallel to the dam (along the semi-axis Oy), from the beginning of the axes;
  • The length dOy/ of the electrode station critical zone, parallel to the dam (along the semi-axis Oy/), from the beginning of the axes;
  • The maximum electric field strength, within the region of the frame that is not operating Eoff;
  • The maximum electric field strength of the array Emax.
It is pointed out that in the present cases, the boundaries of the canvas have been extended considerably (e.g., in the near-field for Korakia, it is 140 m × 140 m, and for Stachtoroi, it is 100 m × 120 m). Indicatively, Figure 27 shows the electric field strength and the region of developing electric field strength greater than 1.25 V/m for the most unfavourable scenario for the area of Korakia, with five frames operating (except for the second frame, under maintenance conditions), while Figure 28 presents the respective case for Stachtoroi, also with five frames operating (except for the first frame, under maintenance conditions).
From the study of the results for the region of Korakia, the following emerges:
  • The length of the critical zone (along the Oy semi-axis) reaches up to 55.80 m (i.e., there is an inland deviation of 24.8 m) when the station is fully loaded, with the third frame not operating (the distance between the shores, which bridges the complete dam, has a length of 62 m, while, due to its arched form, it reaches 70 m). The length of the critical zone (along the Oy/ semi-axis) reaches up to 62.92 m, that is, there is an inland deviation of 31.92 m when the station is fully loaded, with the sixth frame out of operation. The width of the critical zone (along the Ox/ semi-axis) reaches 74.04 m. That is, there is a zero inland deviation up to 20 m when the station is fully loaded, with the second frame out of operation, due to the formed bay in Korakia (according to Figure 11). So, practically, the zone of influence extends inland laterally up to 32 m (along the yOy/ axis), while along the semi-axis Ox/, it is limited within the sea.
  • The width of the critical zone (along the Ox semi-axis) reaches up to 44.60 m when the station is fully loaded, with the fifth frame out of operation. The critical zone, outside the dam, extends by 31.6 m (with crest width of 5 m, with a suspension distance of at least 1 m, and with a distance of extreme frames on the dam along the Ox semi-axis equal to 7 m), which is better than those in all previous configurations.
  • The deviation in the maximum developing electric field strength of the electrode station compared to a single frame (24.84 V/m against 24.06 V/m according to Table 10 in [2]) is of the order of 3.2%, which is small and generally smaller than those in all previous configurations.
  • In Figure 27b, regions between the electrode frames are shown, where the electric field strength decreases significantly below 1.25 V/m. However, this does not occur in the area of the frame that has been set out of operation, although it does not exceed the value of 1.55 V/m, which is below 2.5 V/m, in all cases; therefore, no issues arise (regarding the safety of the diver) when maintaining the frames.
  • The developed absolute potentials and the corresponding values of the electrode station resistance, with respect remote earth, are much better (21.87 kV, 18.74 Ω) compared to all previous configurations.
  • In the field behaviour results, there are no longer similarities in the case of a single frame not operating, due to the asymmetry of the array layout. A critical role in the effect beyond the dam is played by the first and second frames of Figure 13, since, when these two frames are not loaded, the critical zone outside the dam is significantly reduced. A correspondingly adverse effect (in the critical zone outside the dam) is the non-operation of the fifth frame (as it does not negate part of the electric field of the sixth frame), with the consequence that the most unfavourable value then appears, regarding the critical zone beyond the dam.
From the study of the results for the region of Stachtoroi, the following emerges:
  • The length of the critical zone (along the Oy semi-axis) reaches up to 44.94 m (i.e., there is an inland deviation of 17.44 m) when the station is fully loaded, with the fourth frame out of operation (the distance between the shores bridging the complete dam is 55 m long). The length of the critical zone (along the Oy/ semi-axis) reaches 51.61 m, that is, there is an inland deviation of 24.11 m during the full loading of the station, with the first frame out of operation. The width of the critical zone (along the Ox/ semi-axis) reaches 48.12 m. That is, an inland deviation occurs up to 26 m (distance between the inner face of the dam and the coast 22.5 m) during the full loading of the station, with the first frame out of operation, due to the formed bay at Stachtoroi (according to Figure 12). So, practically, the influence zone within the land extends laterally up to 25 m in total.
  • The width of the critical zone (along the Ox semi-axis) reaches 32.55 m when the station is fully loaded and with the fourth frame out of operation. The critical zone outside the dam extends 26.6 m (with a crest width of 5 m and a suspension distance of at least 1 m), which is better than all other configurations.
  • The deviation in the maximum developing electric field strength of the electrode station compared to a single frame (19.49 V/m against 17.96 V/m according to Table 11 in [2]) is of the order of 8.5%, which is significant, slightly greater than that in the second configuration (19.08 V/m according to Table 1) and smaller than those in all other configurations.
  • In Figure 28b, areas between the electrode frames are shown, where the electric field strength decreases significantly below 1.25 V/m. However, this does not occur in the area of the frame that is out of operation, although it does not exceed the value of 2.26 V/m, which is below 2.5 V/m in all cases; therefore, no issues arise (regarding the safety of the diver) when maintaining the frames.
  • The developed absolute potentials and the corresponding values of the electrode station resistance, with respect to remote earth, are slightly worse (17.84 kV, 15.29 Ω) compared to the first configuration (17.30 kV and 14.82 Ω according to Table 15 in [2]) and better over all other configurations.
  • In the field behaviour results, there are no longer similarities in the case of a single frame not operating, due to the asymmetry of the array layout. A critical role in the effect beyond the dam is played by the second frame of Figure 14, since, when it is not loaded, the critical zone outside the dam is significantly reduced. The non-operation of the fourth frame has a correspondingly adverse effect in the critical zone outside the dam (since it does not negate part of the electric field of the third frame), with the consequence that the most unfavourable value then appears, regarding the critical zone beyond the dam.
Summing up, the seventh configuration has an advantage over the other configurations as it greatly improves the field results, and, most importantly, presents no risk to the diver when maintaining the non-operating frame under full-load conditions of the electrode station. Its main disadvantage is the large requirements for dredging operations in the entire pond, as well as dredging and embankment along the entire shoreline surrounding the pond, and the construction of a concrete or caisson breakwater and quay walls.

4.9. Eighth Electrode Station Configuration—Straight Frames Adapted to a T-Shaped Protective Dam

This configuration adapts to the topography of the pond under construction, which has a limited coastline, maintaining, in any case, that the straight frame has the characteristics of the basic configuration (Νel_frame = 13, p = 0.50 m, f = 6.00 m). For the case of Stachtoroi, the respective configuration of the electrode station is carried out according to Figure 16. The minimum distance between the frames dsc is equal to 8.0 m according to Equation (39), as already calculated in Section 4.8. If the frames were placed in a row, then the equal distances between consecutive frames would be 8.92 m (=(89.5 − 6 × 6)/6). However, due to the angles of Figure 16, after tests, the minimum distances between the frames are chosen as equal to 9 m for frames on a straight line and 8 m for the rest, which are greater than or equal to dsc. From the respective simulation, the results of Table 7 are obtained, where the respective parameters of Table 6 are listed. It is pointed out that in the present case, the limits of the canvas have been extended considerably, as in the seventh configuration. Indicatively, Figure 29 shows the electric field strength and the area of developing electric field strength greater than 1.25 V/m for the most unfavourable scenario for the area of Stachtoroi, with five frames operating (except for the sixth frame, under maintenance conditions).
From the study of the results for the region of Stachtoroi, the following emerges:
  • The length of the critical zone (along the Oy semi-axis) reaches 43.75 m (i.e., there is an inland deviation of 16.25 m) when the station is fully loaded, with the fourth frame out of operation (the distance between the shores bridging the complete straight dam is 55 m long). The length of the critical zone (along the semi-axis Oy/) reaches 55.85 m (i.e., there is a 28.35 m inland deviation) when the station is fully loaded, with the first frame out of operation. The width of the critical zone (along the half-axis Ox/) reaches 46.48 m, that is, an inland deviation of up to 24 m occurs (distance between the inner face of the dam and the coast equal to 22.5 m) when the station is fully loaded, with the fist frame out of operation, due to the T-shaped dam at Stachtoroi (according to Figure 16). So, in practice, the zone of influence of an equivalent electric field strength of water equal to 1.25 V/m within the land extends laterally from 16 to 28 m in total.
  • The width of the critical zone (along the Ox semi-axis) reaches 34.08 m when the station is fully loaded, with the first frame out of operation. The critical zone outside the dam extends 28.1 m (with a crest width of 5 m and a suspension distance of at least 1 m), which is better than all the aforementioned configurations, except for the seventh (against which it performs slightly worse, as the respective value is equal to 26.6 m).
  • The deviation in the maximum developing electric field strength of the electrode station compared to a single frame (19.69 V/m against 17.96 V/m according to Table 11 in [2]) is of the order of 9.6%, which is significant, a little higher than in the second (19.08 V/m, according to Table 1) and seventh configurations (19.49 V/m, according to Table 6) and lower than in all other configurations.
  • In Figure 29b, regions between the electrode frames are shown, where the electric field strength decreases significantly below 1.25 V/m. However, this does not occur in the area of the frame that has been set out of operation, although it does not exceed the value of 2.28 V/m, which is below 2.5 V/m in all cases; therefore, no issues arise (regarding the safety of the diver) when maintaining the frames. It is pointed out that, especially in the case of non-supply of the fifth frame (due to the mutual negation of electric fields from the neighbouring frames), the electric field strength is below 0.82 V/m.
  • The developed absolute potentials and the corresponding values of the electrode station resistance, with respect to remote earth, are slightly worse (18.31 kV, 15.69 Ω) compared to the first (17.30 kV and 14.82 Ω according to Table 15 in [2]) and seventh configurations (17.84 kV and 15.29 Ω according to Table 6), while they are better compared to all other configurations.
  • In field behaviour results, there are no longer similarities in the case of single-frame non-operation, due to the asymmetry of the array layout. The 1st, 4th, and 6th frames of Figure 16 play a critical role in the effect outside the dam, since, when one of them is not loaded, the critical zone outside the dam increases significantly.
Summing up, the eighth configuration has an advantage over the other configurations (except for the seventh) as it significantly improves the field results and, most importantly, presents no danger to the diver during the maintenance of the unpowered frame under full-load conditions of the electrode station. However, in relation to the seventh configuration, it presents fewer requirements for dredging operations in the entire pond and does not require dredging and embankment on the shoreline, but the issue of concrete or caisson breakwater formation and quay walls inside the pond remains (compared to configurations 1 through 6).

4.10. Ninth Electrode Station Configuration—Straight Frames Adapted Radially to a Central Base with Guides

This configuration uses the standard straight frame of the basic configuration (Νel_frame = 13, p = 0.50 m, f = 6.00 m). For the case of Korakia, the minimum distance between the frames dsc has already been calculated equal to 11.0 m, according to Equation (39), while for the case of Stachtoroi, it is equal to 8.0 m. From the respective simulation, the results of Table 8 are obtained, where the respective parameters of Table 6 are listed, having as an additional element the absolute potential on the beginning of the axes O VO. It is pointed out that the maximum absolute potential Vrel_max is calculated for y, in which the maximum value of all Vmax(y) occurs, where each one has resulted from its respective integration (along a semi-axis parallel to Ox). Additionally, in the present cases, the boundaries of the canvas have been extended significantly (e.g., in the near-field at Korakia, it is 140 m × 140 m, and at Stachtoroi, it is 120 m × 120 m). In addition, various outer RK1 and inner R1 central base radii are examined. Indicatively, Figure 30 shows the electric field strength and the region of developing electric field strength greater than 1.25 V/m for the most unfavourable scenario of Korakia, with five frames operating (except for the sixth frame, under maintenance conditions).
From the study of the results for the region of Korakia, the following emerges:
  • The length of the critical zone, from the centre of the arrangement, reaches up to 58.26 m in all directions depending on the way of uneven loading of the station. Proper placement of the array at the 12.0 m isobath ensures that its centre will be more than 60 m from land, and a slight dredging will ensure that the frames will be at a depth of more than 10 m, ensuring they are kept away from breaking wave water.
  • The deviation in the maximum developing electric field strength of the electrode station compared to a single frame (26.13 V/m against 24.06 V/m, according to Table 10 in [2]) is of the order of 8.6%, which is significantly greater than that in the seventh configuration (24.84 V/m of Table 6) and smaller compared to the previous ones.
  • In Figure 30b, regions between the electrode frames are shown, where the electric field strength decreases significantly below 1.25 V/m. However, this does not occur in the area of the frame that is set out of operation, although it does not exceed the value of 2.59 V/m (which is slightly above 2.5 V/m). Practically, no issues arise (regarding the safety of the diver) when maintaining the frames. If it is desired that the frames be below the limit of 2.5 V/m, the respective radius of the central base should be 12 m, while for below 1.25 V/m, it should be 26 m (as it has been established after successive tests with base radii from 11.0 m and above, with a step of 0.5 m).
  • The developing maximum absolute potentials and the corresponding values of the electrode station resistance, with respect to remote earth, are much better (11.10 kV, 9.51 Ω) compared to all other configurations. It behaves even better during symmetrical operation.
  • The developing absolute potentials at the centre O of the central base take smaller absolute values than the respective maximum absolute potentials, due to field interactions, where the largest values appear near the operating frames.
  • In field behaviour results, there are now similarities in the case of single-frame non-operation, due to the symmetry of the array layout. Any differences occurring in electric field strength are due to the use of Cartesian coordinates and the simulation step. In terms of determining the absolute potential, the path of integration plays a crucial role.
From the study of the results for the region of Stachtoroi, the following emerges:
  • The length of the critical zone, from the centre of the arrangement, reaches up to 43.57 m in all directions depending on the way of uneven loading of the station. The arrangement can be placed at the isobath of 5.5 m (3.0 m for breaking wave water + 2.13 m electrode height), but to ensure that the centre of the arrangement is more than 44 m from the land, it can be placed in the position of Figure 31, at an isobath of the order of 14 m. Due to the large inclination of the seabed, the frames can reach 10 m on the shallow side, which meet the requirements of non-contact with breaking wave water. Alternatively, the arrangement can be placed closer to the shore in such a way that the nearest electrode frames touch the 5.5 m isobath, thus limiting the inland effect to about 10 m, while the central base placement depth is limited to an average depth of 8.2 m.
  • The deviation in the maximum developing electric field strength of the electrode station compared to a single frame (19.92 V/m against 17.96 V/m, according to Table 11 in [2]) is of the order of 10.9%, which is significant and greater than those in the 2nd (19.08 V/m of Table 1), 7th (19.49 V/m of Table 6), and 8th configurations (19.69 V/m of Table 7), while it is smaller than the rest of the configurations. Increasing the radius of the central base results in a small decrease.
  • In the area of the frame that is set out of operation, electric field strengths greater than 1.25 V/m are observed, although they do not exceed the value of 2.48 V/m, which is below 2.5 V/m; therefore, no issues arise (regarding the safety of the diver) when maintaining the frames. If it is desired that the frames be below the limit of 1.25 V/m, the respective radius of the central base should be 19 m (as it has been established after successive tests with base radii from 9.0 m and above, with a step of 0.5 m).
  • The developed absolute potentials and the corresponding values of the electrode station resistance, with respect to remote earth, are significantly better (7.21 kV, 6.18 Ω) over all previous configurations. It behaves even better during symmetrical operation.
  • The developing absolute potentials at the centre O of the central base take smaller absolute values than the respective maximum absolute potentials due to the field interactions, where the largest values appear near the operating frames, as was also the case at Korakia.
  • In field behaviour results, there are now similarities in the case of single-frame non-operation, due to the symmetry of the array layout, and the same conclusions apply as in the case of Korakia.
Summing up, the ninth configuration gives quite improved results, in terms of absolute potential and electrode station resistance (with respect to remote earth), ensuring that there is practically no danger to the diver during single-frame maintenance under full-load conditions of the electrode station. Increasing the radius of the central base ultimately leads to the development of smaller electric field strengths, and (in most cases) also absolute potentials and electrode station resistances, with respect to remote earth. However, in the latter, the existence of a cavity—within the base—plays an important role for large outer radii.

4.11. Tenth Electrode Station Configuration—Straight Frames Adapted Perimetrically to a Central Base

This configuration uses the standard straight frame of the basic configuration (Νel_frame = 13, p = 0.50 m, f = 6.00 m). For the case of Korakia, the minimum distance between the frames dsc has already been calculated as equal to 11.0 m according to Equation (39). From Equation (52), the distance 1, equal to 6.3508 m, is calculated, and from Equation (53), the distance 2 is calculated as equal to 16.4727 m, which is identical to the minimum “gross” radius of the central base RK2 (by Equation (54)), due to the six frames. Therefore, the selected “gross” radius of the central base RK2 is equal to 16.5 m, which also includes the distance dr1 at which each frame is positioned, away from the central base (specifically, 1 m), for the suspension of the frame. For the case of Stachtoroi, the minimum distance between the frames dsc has already been calculated equal to 8.0 m according to Equation (39). From Equation (52), the distance 1, equal to 4.6188 m, is calculated and, from Equation (53), the distance 2 is calculated as equal to 13.5329 m, which is identical to the minimum “gross” radius of the central base RK2 (according to Equation (54)), due to the six frames. Therefore, the selected “gross” radius of the central base RK2 is equal to 14.0 m, which includes the distance dr1. From the respective simulation, the results of Table 9 are obtained, where the corresponding parameters of Table 8 are listed. Additionally, the boundaries of the canvas have been extended as in the case of the ninth configuration. In addition, various outer RK2 and inner R1 central base radii are examined. Indicatively, Figure 32 shows the electric field strength and the area of developing electric field strength greater than 1.25 V/m for the most unfavourable scenario for the Korakia area, with five frames operating (sixth frame out of operation, under maintenance conditions).
From the study of the results for the region of Korakia, the following emerges:
  • The length of the critical zone, from the centre of the arrangement, reaches up to 58.54 m in all directions depending on the way of uneven loading of the station (which is, practically, the same as the results in radially adapted frames to a central base). Proper placement of the arrangement at the 12.0 m isobath ensures that its centre will be more than 60 m from land, and a slight dredging ensures that the frames will be at a depth of more than 10 m, ensuring they are kept away from breaking wave water.
  • The deviation in the maximum developing electric field strength of the electrode station compared to a single frame (24.94 V/m against 24.06 V/m, according to Table 10 in [2]) is of the order of 3.74%, which is small, slightly larger compared to the seventh configuration (24.84 V/m of Table 6) and smaller compared to all previous ones.
  • In Figure 32b, regions between the electrode frames are shown, where the electric field strength decreases significantly below 1.25 V/m. However, this does not occur in the area of the frame that is set out of operation, although it does not exceed the value of 2.21 V/m, which is below 2.5 V/m. Therefore, no issues arise (regarding the safety of the diver) when maintaining the frames. If it is desired that the frames be below the limit of 1.25 V/m, the respective radius of the central base should be 28.5 m (as it has been established after successive tests, with base radii from 16.5 m and above, with a step of 0.5 m).
  • The developing maximum absolute potentials and the corresponding values of the electrode station resistance, with respect to remote earth, are quite better (16.83 kV, 14.42 Ω) compared to all other configurations, except for the ninth (11.10 kV, 9.51 Ω). It also behaves very well during symmetrical operation.
  • The developing absolute potentials at the centre O of the central base take smaller absolute values than the corresponding maximum absolute potentials, due to field interactions, where the largest values appear near the operating frames (as it also occurred in the ninth configuration).
  • In field behaviour results, there are now similarities in the case of single-frame non-operation due to the symmetry of the array layout. Any occurring differences in electric field strength are due to the use of Cartesian coordinates and the simulation step. In terms of determining the absolute potential, the integration path plays a crucial role.
From the study of the results for the region of Stachtoroi, the following emerges:
  • The length of the critical zone, from the centre of the arrangement, reaches up to 43.90 m in all directions depending on the way of uneven loading of the station (which is, practically, the same as the results in radially adapted frames to a central base). The arrangement can be placed at the 5.5 m isobath (3.0 m for the breaking wave water + 2.13 m electrode height), while the critical zone of the electric field has a 28.35 m inland deviation. The centre of the arrangement is at the 8.8 m isobath, as it can be seen in Figure 33. That is, in relation to the ninth configuration, the base will be at a greater depth. Alternatively, the base can be placed at a distance of the order of 44 m (from the centre of the arrangement to the nearest land), resulting in an isobath of the order of 14 m, while the entire critical zone of the electric field will be in the water.
  • The deviation in the maximum developing electric field strength of the electrode station compared to a single frame (18.77 V/m against 17.96 V/m, according to Table 11 in [2]) is of the order of 4.51%, which is smaller than in all other configurations.
  • In the region of the non-operating frame, electric field strengths greater than 1.25 V/m are observed, although they do not exceed the value of 1.97 V/m, which is below 2.5 V/m. Therefore, no issues arise (regarding the safety of the diver) when maintaining the frames. If it is desired that the frames be below the limit of 1.25 V/m, the respective radius of the central base should be 22.0 m (as it has been established after successive tests with base radii from 14.0 m and above, with a step of 0.5 m).
  • The developing absolute potentials and the corresponding values of the electrode station resistance, with respect to remote earth, are significantly better (12.07 kV, 10.34 Ω) compared to the first configuration (17.30 kV and 14.82 Ω according to Table 11 in [2]), as well as all other configurations, except for the ninth (7.21 kV and 6.18 Ω of Table 8). It behaves even better during symmetrical operation.
  • The developing absolute potentials at the centre O of the central base take smaller absolute values than the respective maximum absolute potentials, due to field interactions, where the largest values appear near the operating frames (as was the case in the ninth configuration, in the area of Korakia).
  • The field behaviour results in the case of single-frame non-operation are similar, due to the symmetry of the arrangement, with respect to its centre O. The corresponding results in dOx, dOx/, dOy, and dOy/ would be the same with the appropriate rotation of the Cartesian coordinates system. The small numerical differences in the fourth significant digit in the magnitudes of the electric field strength are due to the equivalent square element of the canvas 0.05 m × 0.05 m.
  • The numerical differences, when calculating the absolute potential, are more important than in the case of the electric field strength, because both the path of integration of the electric field strength, as well as the step (which is variable due to the large completion distance, practically around 150 km), play a crucial part. Because of this, identical loadings of five different frames lead to different numerical results. However, for safety reasons, in any case, the most unfavourable value is chosen.
Summing up, the 10th configuration gives quite improved results, in terms of absolute potential and electrode station resistance with respect to remote earth (worse only to the ninth configuration), and the best field results of all the configurations, ensuring that there is practically no risk for the diver during single-frame maintenance under full-load conditions of the electrode station. Increasing the radius of the central base ultimately leads to the development of smaller electric field strengths and (in most cases) absolute potentials and electrode station resistances, with respect to remote earth. However, in the latter, it plays an important role to have a cavity inside the base for large outer radii, as was also established in the ninth configuration.

5. Discussion—Comparison of Different Electrode Station Configurations

Further on, according to the method of electrode positioning of the electrode station, the most unfavourable absolute values are listed for the sizes of the width dOx of the critical zone of the electrode station (along the Ox semi-axis from the beginning of the axes), of the width dOx/ (along the Ox/ semi-axis), of the length dOy (along the Oy semi-axis), of the length dOy/ (along the Oy/ semi-axis) for an electric field strength limit above 1.25 V/m, of the indicative equivalent area of the zone of influence Scr (calculated through Equation (40)), of the maximum electric field strength Eoff (within the area of the frame that is out of operation), of the maximum electric field strength of the arrangement Emax, of the maximum absolute potential Vrel_max, and of the electrode-station-to-remote-earth resistance Rel, for the areas of Korakia and Stachtoroi, in Table 10 and Table 11, respectively. It is pointed out that, especially for configurations 9 and 10, the indicative equivalent area of the zone of influence Scr can be estimated as the corresponding area of a circle having a diameter of the largest value of dOx, dOx/, dOy, and dOy/ (which are practically identical).
From the study of the relevant results of Table 10, for the area of Korakia, the following emerges:
  • From the cases of typical electrode station designs through dams and ponds (1st to 8th configuration), the shortest required length in front of the dam, as well as the optimal values for the maximum electric field strength of the arrangement Emax, for the maximum absolute potential Vrel_max, and for the electrode-station-to-remote-earth resistance Rel, result from the case of placing straight frames around the perimeter (inner side) of the dam and adapted to the outline of the pond (seventh configuration).
  • From the cases of typical designs, the smallest indicative equivalent area of the electric field zone of influence Scr results from the case of placing straight frames in two overlapping rows with respect to the dam, perpendicular to its axis and aligned with each other (fifth configuration).
  • Evidently, the corresponding variations are not significant; nonetheless, in terms of field models, the placement of straight frames around the perimeter (inner side) of the dam and adapted to the outline of the pond (seventh configuration) prevails over all other typical designs.
  • From the cases of typical designs, only when placing straight frames around the perimeter (inner side) of the dam and adapted to the outline of the pond (seventh configuration) is the maximum electric field strength (within the area of the frame that is out of operation) Eoff less than 2.5 V/m.
  • The placement of straight frames, radially or perimetrically to a central base (ninth and tenth configuration, respectively), improves the field results (and especially the values of the absolute potential and ground resistance of the electrode station), but not the distances of the influence zones.
From the study of the relevant results of Table 11, for the area of Stachtoroi, the following emerges:
  • From the cases of typical designs (1st to 8th configuration), the shortest required length, in front of the dam, results from the case of placing straight frames around the perimeter (inner side) of the dam that are adapted to the outline of the pond (seventh configuration).
  • From the cases of typical designs, the smallest indicative equivalent area of the electric field zone of influence Scr results from the case of placing straight frames in two overlapping rows, with respect to the dam, perpendicular to its axis and aligned with each other (fifth configuration).
  • From the cases of typical designs, the optimal value for the maximum electric field strength of the arrangement Emax results from the case of placing straight frames perpendicular to the axis of the dam (second configuration).
  • From the cases of typical design, the optimal values for the maximum absolute potential Vrel_max and the electrode-station-to-remote-earth resistance Rel result from the case of placing straight frames in a row with respect to the dam, parallel to its axis (first configuration).
  • From the cases of typical designs, only when placing straight frames on the inner perimeter of the dam that are adapted to the outline of the pond, as well as adapting them to a T-shaped dam (seventh and eighth configurations, respectively), is the maximum electric field strength (within the area of the frame that is out of operation) Eoff less than 2.5 V/m.
  • The variations are not significant among the typical design cases and no arrangement appears to prevail over the others.
  • The placement of straight frames radially or perimetrically to a central base (ninth and tenth configurations, respectively) improves the field results (and especially the values of the absolute potential and ground resistance of the electrode station), while slightly limiting the zone of influence.
Nevertheless, apart from field results, for the selection of the final form of construction of the electrode station, the way of their construction, the respective cost, as well as the cost of their operation, with technical–economic criteria, must be taken into account.

6. Conclusions

In this paper, a systematic yet brief presentation of the proposed analytical method for calculating the electric field gradient, ground potential rise, and resistance to remote earth of electrode stations [2] was initially made, where, for the near-electric field, a linear current source was used for each electrode, which extended cylindrically over a zone of constant sea/land or dam thickness, while for the far-field, the corresponding mathematical background of a point current source was used, in the form of a suitable wedge of sea on land (extension of [1,27]). In the case of more electrodes than one, the application of the method was extended through superposition [2]. Then, for the first time, the geometry was analysed for the following electrode station configurations, against the basic configuration of straight frames in a row, parallel on the longitudinal axis of the protective dam (first configuration) [1,2,5,6,7,8,9,10]:
  • Straight frames in a row, each placed vertically on the longitudinal axis of the dam (second configuration);
  • Straight frames in two overlapping rows, each parallel to the longitudinal axis of the dam and aligned with each other (third configuration);
  • Straight frames in two overlapping rows, each parallel to the longitudinal axis, but non-overlapping on the vertical axis of the dam (fourth configuration);
  • Straight frames in two successive rows, each vertical to the longitudinal axis of the dam and aligned with each other (fifth configuration);
  • Straight frames in two successive rows, each vertical to the longitudinal axis of the dam and non-overlapping on the vertical one (sixth configuration);
  • Straight frames in perimetrical placement to the protective dam, adapting to the outline of the pond under construction (seventh configuration);
  • Straight frames adapted to a T-shaped protective dam (to increase the inner outline of the dam) (eighth configuration);
  • Straight frames adapted radially to a central base with guides, in open sea (ninth configuration);
  • Straight frames adapted perimetrically to a central base, in open sea (10th configuration).
Configurations 2 to 8 could be characterised as variations in the basic configuration, with the other two (9 and 10) as new forms, due to their placement around a central base, in the open sea. For each configuration, the particularities they present (in terms of the suspension-lifting system) and the requirements they have (in terms of dam construction works, pond dredging, embankment, quay wall formation, etc.) were recorded. Subsequently, however, the aforementioned methodology for calculating the electric field gradient, ground potential rise, and resistance to remote earth of electrode stations [2] was applied to the new proposed configurations, for the cases of the electrode stations in Stachtoroi and Korakia for the HVDC interconnection of Crete and Attica. From the respective field results, it first emerged that the field study of a single frame, with a linear arrangement of electrodes, is not sufficient for the study of an electrode station consisting of several frames. On the contrary, the respective recalculation of the field sizes proves necessary. In terms of practical results, from the typical configurations, the smallest required length (in front of the dam) occurs in the case of using straight frames placed around the perimeter of the protective dam, adapted to the outline of the pond being constructed (seventh configuration), while the smallest area of the zone of influence is achieved in the case of using straight frames in two overlapping rows, each perpendicular to the longitudinal axis of the protective dam, aligned with each other (fifth configuration). The maximum electric field strength (within the area of the frame that is out of operation) is limited below 2.5 V/m in the case of straight frames placed around the perimeter of the protective dam and adapted to the outline of the pond under construction (seventh configuration), as well as in the case of straight frames placed around the perimeter of a T-shaped protective dam (eighth configuration). Regarding the absolute potential and ground resistance of the electrode station, there is no specific configuration from the typical ones that prevails (except for the seventh, which presents the best or second-best behaviour in both cases).
The two new configurations that do not require a dam but are in the open sea with straight frames placed radially or perimetrically to a central base (9th and 10th configurations, respectively) significantly improve the field results and especially the values of absolute potential and electrode station resistance to remote earth, and give satisfactory maximum electric field strengths, within the area of the non-operating frame (below or close to 2.5 V/m). They also limit the zone of influence, although not presenting the smallest values (compared to typical configurations), which, however, does not have the same importance, since these arrangements are situated in the open sea.
In any case, however, the new configurations proved to be very promising and worth their further investigation/examination, for each specific location, where the respective electrode station will be installed.

Author Contributions

Conceptualization, G.J.T., J.M.P., C.D.T., K.L. and J.C.A.; methodology, V.T.K., G.J.T., F.D.K., J.M.P. and A.X.M.; software, V.T.K., G.J.T., F.D.K. and P.M.D.; validation, V.T.K., G.J.T., F.D.K. and P.M.D.; formal analysis, V.T.K., G.J.T., F.D.K. and P.A.K.; investigation, V.T.K. and G.J.T.; resources, V.T.K., G.J.T., K.L. and J.C.A.; data curation, C.D.T., K.L. and J.C.A.; writing—original draft preparation, V.T.K., G.J.T., F.D.K. and P.A.K.; writing—review and editing, V.T.K., G.J.T., F.D.K. and P.A.K.; visualization, V.T.K., G.J.T. and P.M.D.; supervision, G.J.T.; project administration, G.J.T.; funding acquisition, C.D.T., K.L. and J.C.A. All authors have read and agreed to the published version of the manuscript.

Funding

This research was funded by IPTO, grant number 191102.

Institutional Review Board Statement

Not applicable.

Informed Consent Statement

Not applicable.

Data Availability Statement

Data are unavailable due to privacy restrictions.

Acknowledgments

The authors would like to thank the IPTO for the data availability of the initial shoreline electrode station design. The authors are grateful to Spyridon Gialampidis for his work on the original text version.

Conflicts of Interest

The authors declare no conflict of interest. The funders (IPTO) had no role in the design of the study; in the collection, analyses, or interpretation of data; in the writing of the manuscript, or in the decision to publish the results.

References

  1. CIGRE Working Group B4.61. General Guidelines for HVDC Electrode Design, 1st ed.; CIGRE: Paris, France, 2017; Volume 675, pp. 1–150. [Google Scholar]
  2. Tsekouras, G.J.; Kontargyri, V.T.; Prousalidis, J.M.; Kanellos, F.D.; Tsirekis, C.D.; Leontaritis, K.; Alexandris, J.C.; Deligianni, P.M.; Kontaxis, P.A.; Moronis, A.X. Alternative Simplified Analytical Models for the Electric Field, in Shoreline Pond Electrode Preliminary Design, in the Case of HVDC Transmission Systems. Energies 2022, 15, 6493. [Google Scholar] [CrossRef]
  3. Independent Power Transmission Generator S.A. Technical Description for Shoreline Electrodes for HVDC Link Attica-Creta, 3rd ed.; Independent Power Transmission Generator S.A.: Athens, Greece, 2018; pp. 1–5. [Google Scholar]
  4. Bouzid, M.A.; Flazi, S.; Stambouli, A.B. A cost comparison of metallic and earth return path for HVDC transmission System case study: Connection Algeria-Europe. Electr. Power Syst. Res. 2019, 171, 15–25. [Google Scholar] [CrossRef]
  5. Hatch-Statnett. Newfoundland and Labrador Hydro-Lower Churchill Project-DC1110 Electrode Review-Gull Island & Soldiers Pond, 1st ed.; Muskrat Falls Project-CE-09 Rev.1; Hatch-Statnett: NL, Canada, 2008; p. 73. [Google Scholar]
  6. Hatch. Nalcor Energy-Lower Churchill Project-DC1250 Electrode Review Types and Locations, 1st ed.; Muskrat Falls Project-CE-11; Hatch: NL, Canada, 2010; p. 277. [Google Scholar]
  7. Hatch. Nalcor Energy-Lower Churchill Project-DC1500 Electrode Review Confirmation of Types and Site Locations, 1.1st ed.; Muskrat Falls Project-CE-12 Rev.1; Hatch: NL, Canada, 2010; p. 319. [Google Scholar]
  8. Girdinio, P.; Molfino, P.; Nervi, M.; Rossi, M.; Bertani, A.; Malgarotti, S. Technical and compatibility issues in the design of HVDC sea electrodes. In Proceedings of the International Symposium on Electromagnetic Compatibility-EMC EUROPE, Rome, Italy, 17–21 September 2012; IEEE Press: Piscataway, NJ, USA, 2012; pp. 1–5. [Google Scholar]
  9. Sutton, S.J.; Lewin, P.L.; Swingler, S.G. Review of global HVDC subsea cable projects and the application of sea electrodes. Electr. Power Energy Syst. 2017, 87, 121–135. [Google Scholar] [CrossRef]
  10. Sutton, S.J.; Swingler, S.J.; Lewin, P.L. HVDC Subsea Cable Electrical Return Path Schemes: Use of Sea Electrodes and Analysis of Environmental Impact, 1st ed.; HubNet: Manchester, UK, 2016; pp. 1–51. [Google Scholar]
  11. Molfino, P.; Nervi, M.; Rossi, M.; Malgarotti, S.; Odasso, A. Concept Design and Development of a Module for the Construction of Reversible HVDC Submarine Deep-Water Sea Electrodes. IEEE Trans. Power Deliv. 2017, 32, 1682–1687. [Google Scholar] [CrossRef]
  12. Charalambous, C.A.; Dimitriou, A.; Gonos, I.F.; Papadopoulos, T.A. Modeling and Assessment of Short-Term Electromagnetic Interference on a Railway System from Pole-to-Ground Faults on VSC-HVDC Cable Networks with Sea Electrodes. IEEE Trans. Ind. Appl. 2021, 57, 121–129. [Google Scholar] [CrossRef]
  13. Charalambous, C.A. Interference Activity on Pipeline Systems From VSC-Based HVDC Cable Networks with Earth/Sea Return: An Insightful Review. IEEE Trans. Power Deliv. 2021, 36, 1531–1541. [Google Scholar] [CrossRef]
  14. Charalambous, C.A.; Nikolaidis, A.I. Complete Method to Access the DC Corrosion Impact on Pipeline Systems During the Planning and Approval Stages of HVDC Systems with Earth Current Return. IEEE Access 2022, 10, 127550–127562. [Google Scholar] [CrossRef]
  15. EPRI. HVDC Ground Electrode Overview, 1st ed; EPRI: Palo Alto, CA, USA, 2010; Volume 1020116, p. 66. [Google Scholar]
  16. Hajiaboli, A.; Fortin, S.; Dawalibi, F.P. Numerical techniques for the analysis of HVDC sea electrodes. IEEE Trans. Ind. Appl. 2015, 51, 5175–5181. [Google Scholar] [CrossRef]
  17. Pompili, Μ.; Cauzillo, B.A.; Calcara, L.; Codino, A.; Sangiovanni, S. Steel reinforced concrete electrodes for HVDC submarine cables. Electr. Power Syst. Res. 2018, 163, 524–531. [Google Scholar] [CrossRef]
  18. Marzinotto, M.; Molfino, P.; Nervi, M. On the Measurement of Fields produced by Sea Return Electrodes for HVDC Transmission. In Proceedings of the 2020 International Symposium on Electromagnetic Compatibility-EMC EUROPE, Virtual, 23–25 September 2020; pp. 1–6. [Google Scholar]
  19. Freschi, F.; Mitolo, M.; Tartaglia, M. An effective semianalytical method for simulating grounding grids. IEEE Trans. Ind. Appl. 2013, 49, 256–263. [Google Scholar] [CrossRef]
  20. Ma, J.; Dawalibi, F.P. Analysis of grounding systems in soils with finite volumes of different resistivities. IEEE Trans. Power Deliv. 2002, 17, 596–602. [Google Scholar] [CrossRef]
  21. Hajiaboli, A.; Fortin, S.; Dawalibi, F.P.; Zhao, P.; Ngoly, A. Analysis of grounding systems in the vicinity of hemi-spheroidal heterogeneities. IEEE Trans. Ind. Appl. 2015, 51, 5070–5077. [Google Scholar] [CrossRef]
  22. Brignone, M.; Karimi Qombovani, A.; Molfino, P.; Nervi, M. An algorithm for the semianalytical computation of fields emitted in layered ground by HVDC electrodes. In Proceedings of the 19th Edition of the Power Systems Computation Conference-PSCC 2016, Genova, Italy, 20–24 June 2016; IEEE Press: Piscataway, NJ, USA, 2016; pp. 1–5. [Google Scholar]
  23. Da Fonseca Freire, P.E.; Pereira, S.Y.; Padilha, A.L. Adjustment of the Geoelectric Model for a Ground Electrode Design-the case of the Rio Madeira HVDC Transmission System, Brazil. Sci. Eng. 2021, 20, 137–151. [Google Scholar]
  24. Manglik, A.; Verma, S.K.; Muralidharan, D.; Sasmal, R.P. Electrical and electromagnetic investigations for HVDC ground electrode site in India. Phys. Chem. Earth 2011, 36, 1405–1411. [Google Scholar] [CrossRef]
  25. Thunehed, H.; GeoVista, A.B. Compilation and Evaluation Earth Current Measurements in the Forsmark Area, 1.1st ed.; Svensk Karnbranslehantering AB: Stockholm, Sweden, 2017; p. 46. [Google Scholar]
  26. Liu, Q.; Li, L.; Zheng, J.; Guan, Z. Research on Potential Distributions of Soil Surface Caused by Ground Electrode of HVDC System in Heterogeneous Soil Structure. In Proceedings of the 2007 IEEE Power Engineering Society General Meeting, Tampa, FL, USA, 24–28 June 2007; pp. 1–4. [Google Scholar]
  27. IEC. IEC Technical Commitee TC115-High Voltage Direct Current (HVDC) transmission for DC voltages above 100 kV. In Design of Earth Electrode Stations for High-Voltage Direct Current (HVDC) Links-General Guidelines, 1st ed; IEC: Geneva, Switzerland, 2013; IEC 62344:2013; pp. 1–89. [Google Scholar]
  28. Rusck, S. HVDC power transmission: Problems relating to earth return. Direct Curr. 1962, 290–300. [Google Scholar]
  29. Kimbark, E.W. Direct Current Transmission, 1st ed.; Wiley Interscience: New York, NY, USA, 1971; pp. 1–496. [Google Scholar]
  30. Kovarsky, D.; Pinto, L.J.; Caroli, C.E.; Santos, N. Soil surface potentials induced by Itaipu HVDC ground return current. I. Theoretical evaluation. IEEE Trans. Power Deliv. 1988, 3, 1204–1210. [Google Scholar] [CrossRef]
  31. Marzinotto, M.; Mazzanti, G.; Nervi, M. Ground/sea return with electrode systems for HVDC transmission. Int. J. Electr. Power Energy Syst. 2018, 100, 222–230. [Google Scholar] [CrossRef]
  32. Uhlmann, E. Power Transmission by Direct Current, 1st ed.; Springer: New York, NY, USA, 1975; pp. 1–389. [Google Scholar]
  33. Datasheet ANOTEC. High Silicon Iron Tubular Anodes Centertec Z-Series; bulletin 04-14/06.02.28; ANOTEC: Langley, BC, Canada, 2018. [Google Scholar]
  34. CIGRE Working Group B1.10. Update of Service Experience of HV Underground and Submarine Cable Systems, 1st ed.; CIGRE: Paris, France, 2009; Volume 379, pp. 1–86. [Google Scholar]
  35. Freire, P.E.; Fihlo, J.N.; Nicola, G.L.; Borin, P.O.; Perfeito, M.D.; Bartelotti, M.; Estrella, M.; Pereira, S.Y. Electrical interference of the Bipole I Ground Electrode from Rio Madeira HVDC Transmission System on the Bolivia-Brazil gas pipeline-Preliminary calculations and field measurements. In Proceedings of the 19th Edition of the Power Systems Computation Conference-PSCC 2016, Rio de Janeiro, Brazil, 22–24 September 2015; pp. 1–8. [Google Scholar]
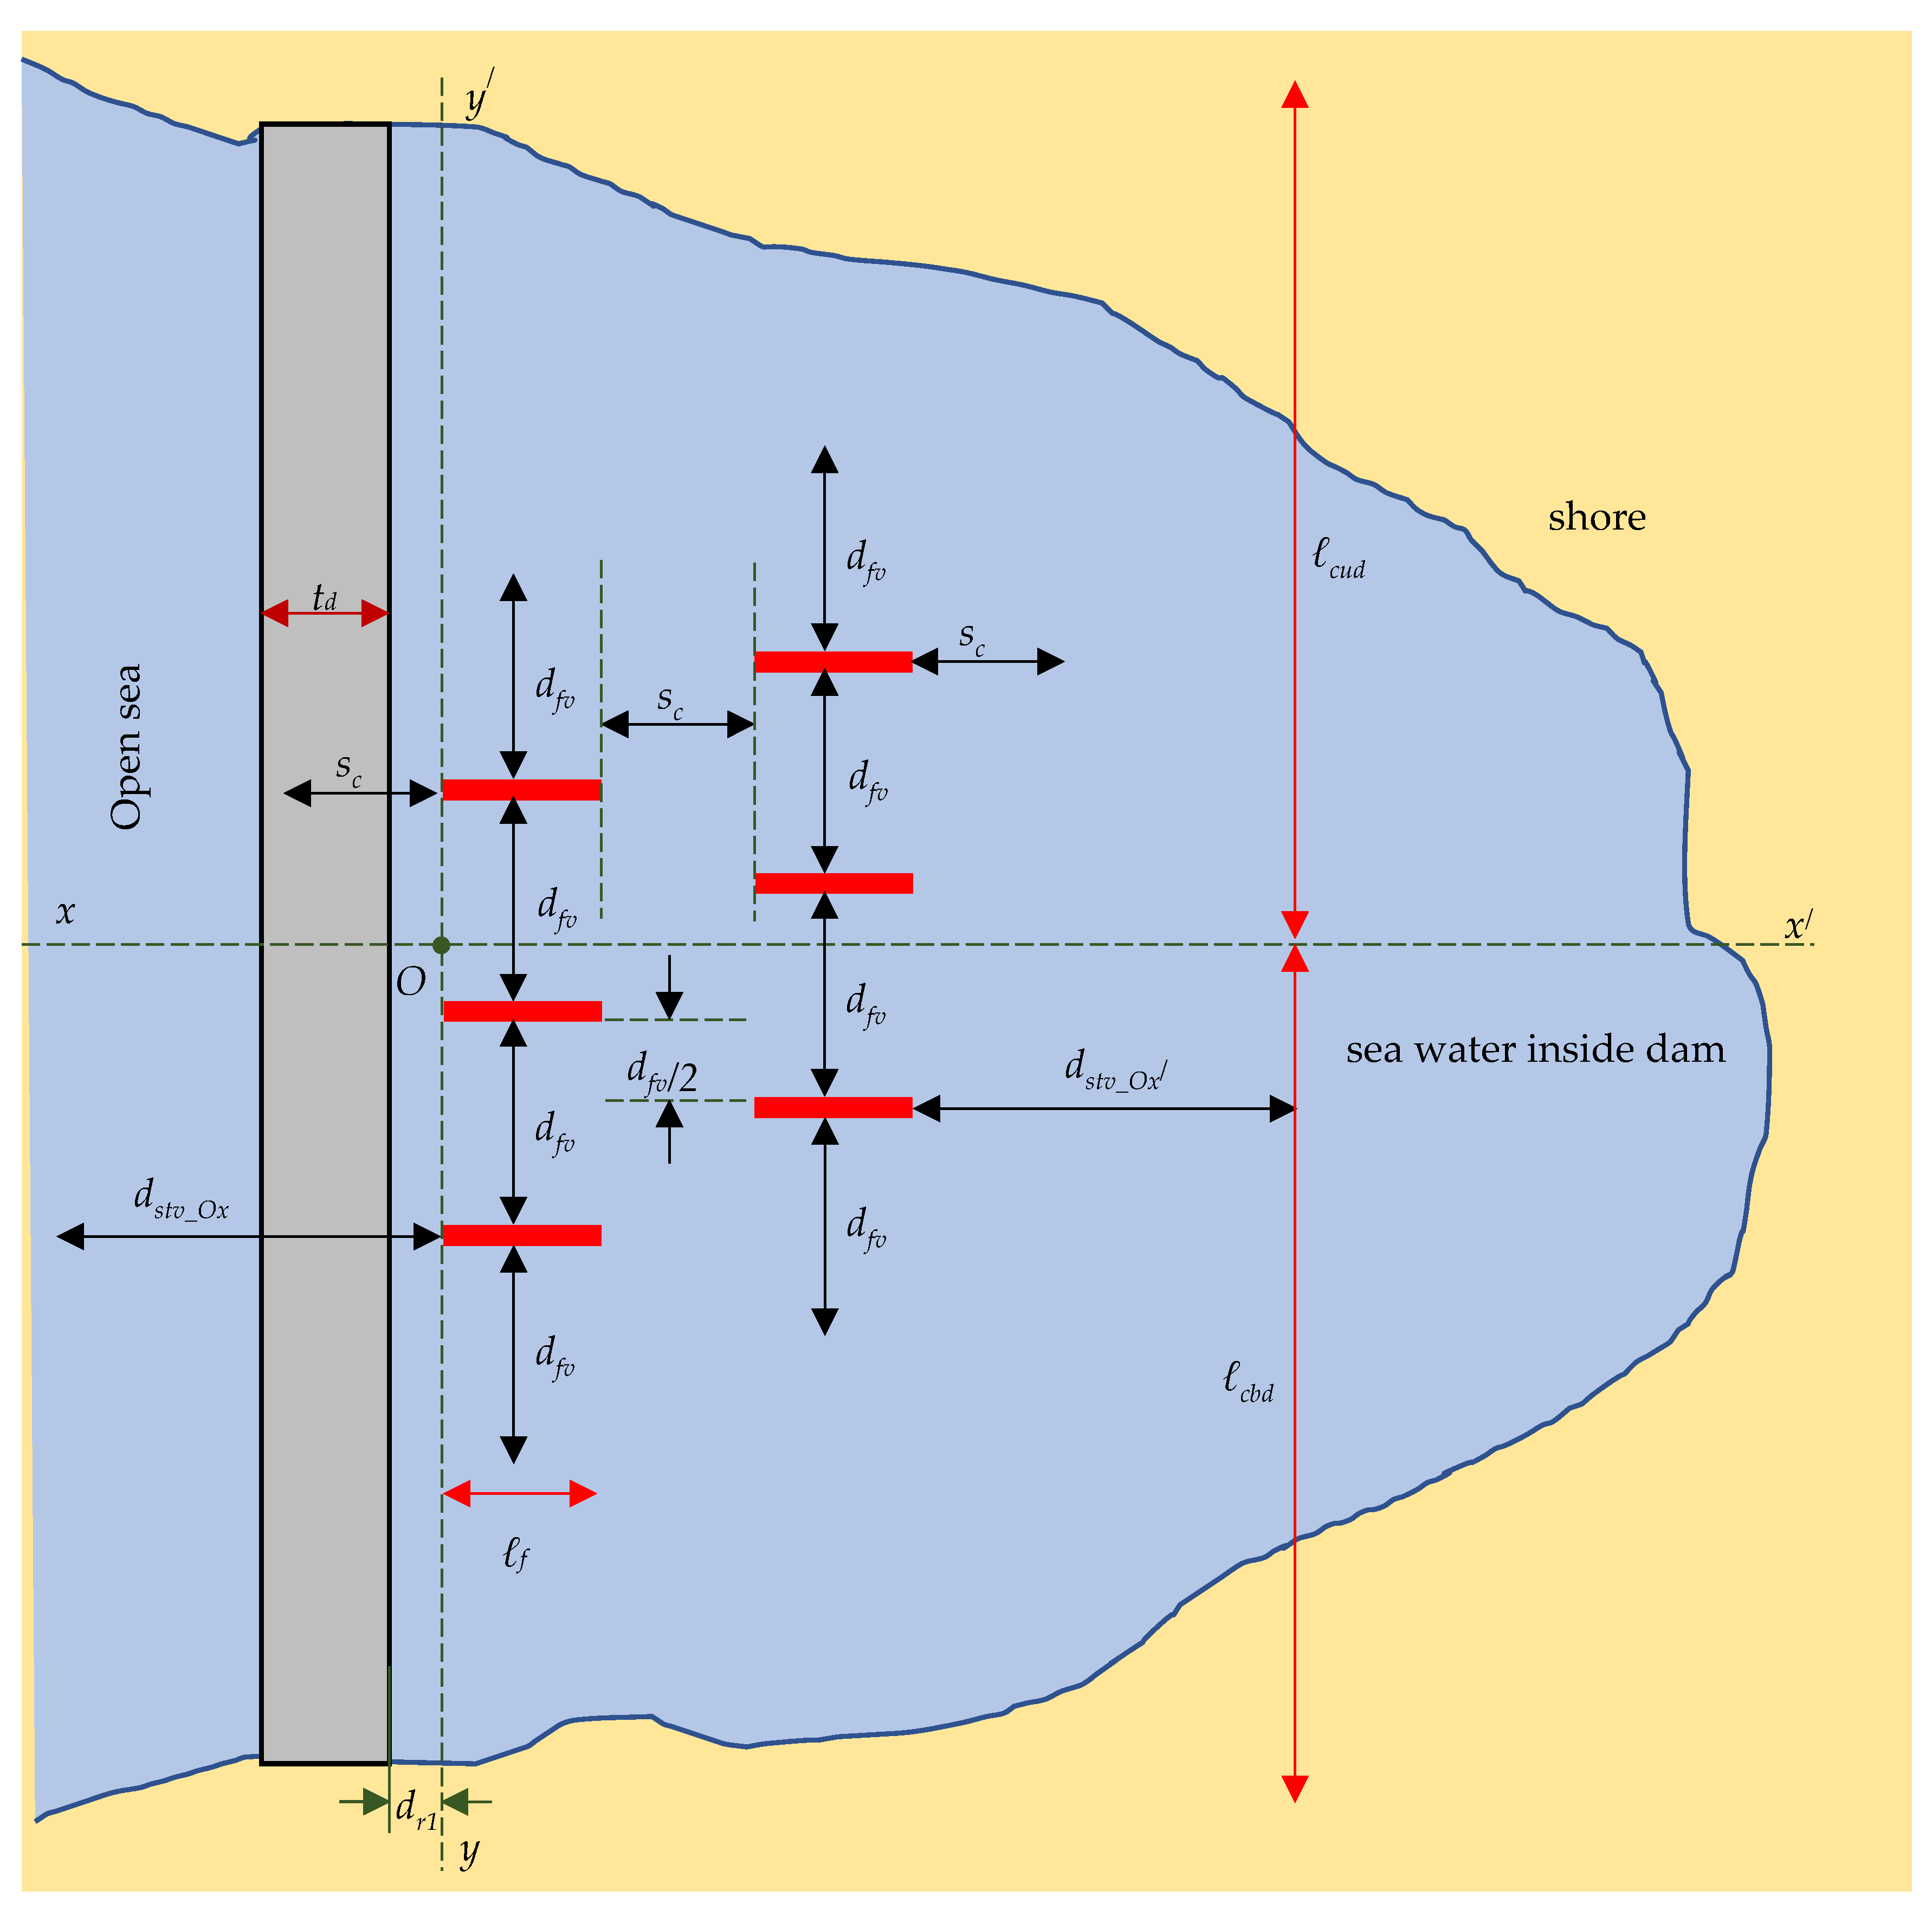
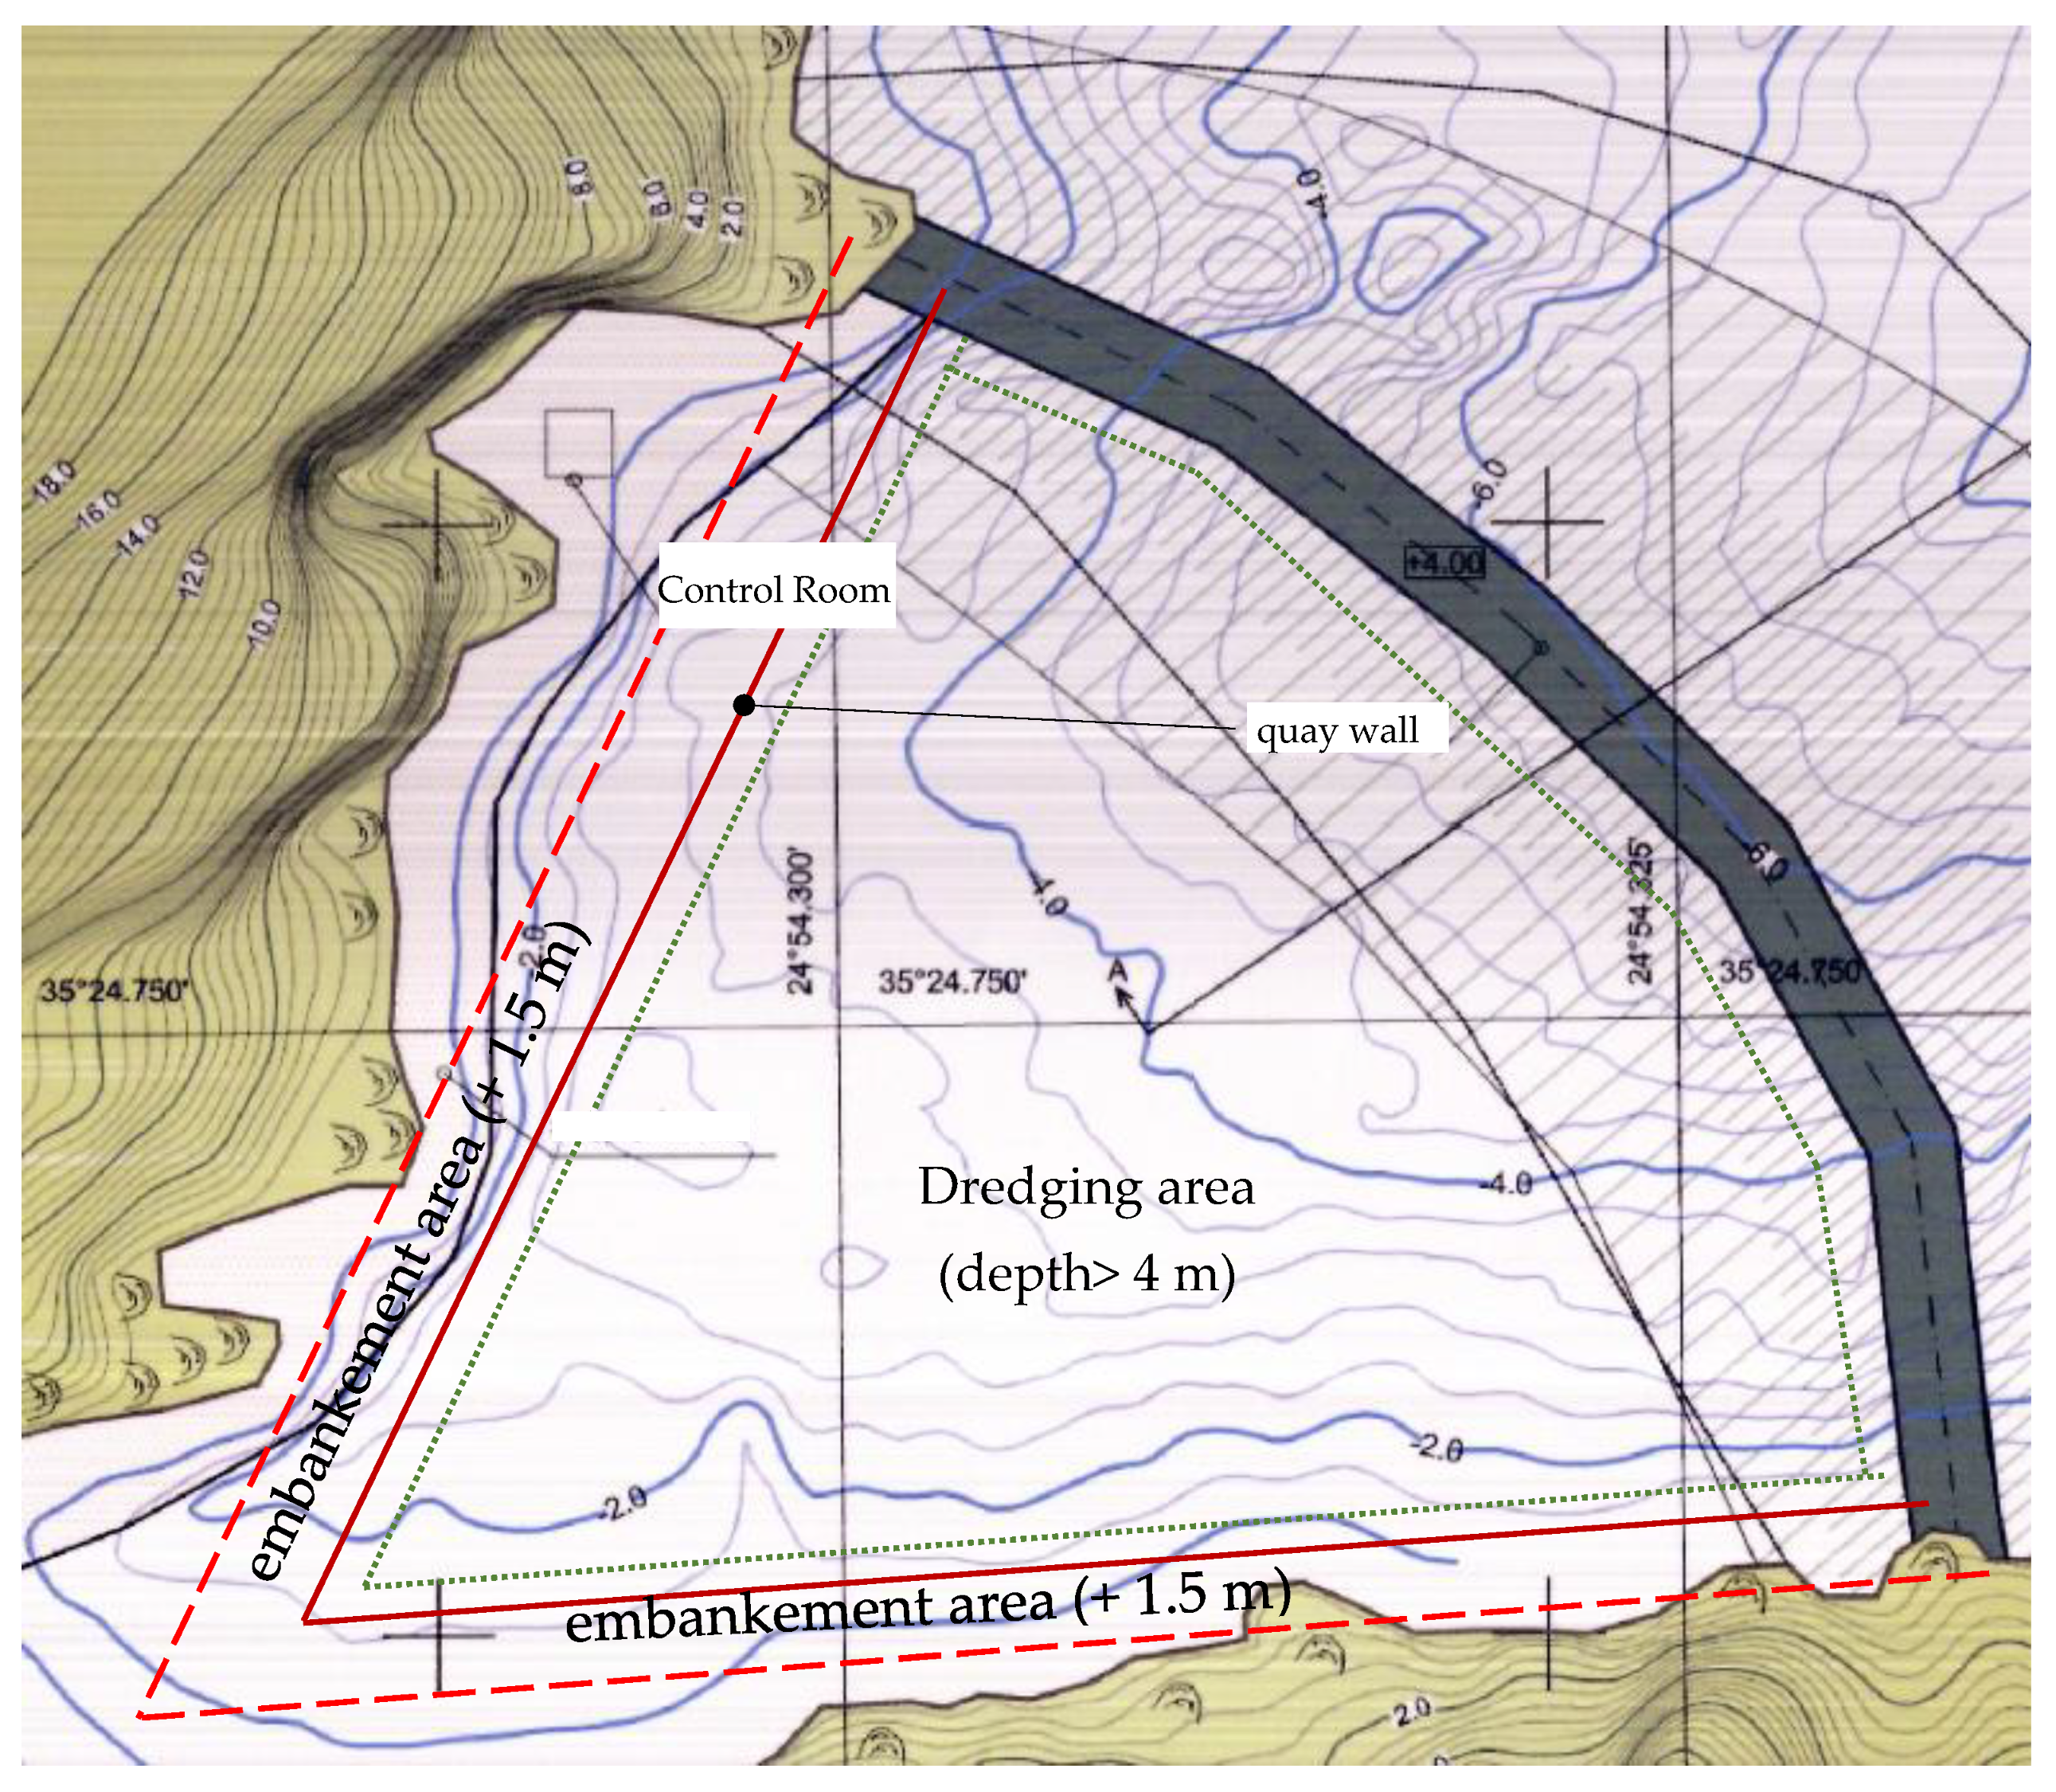
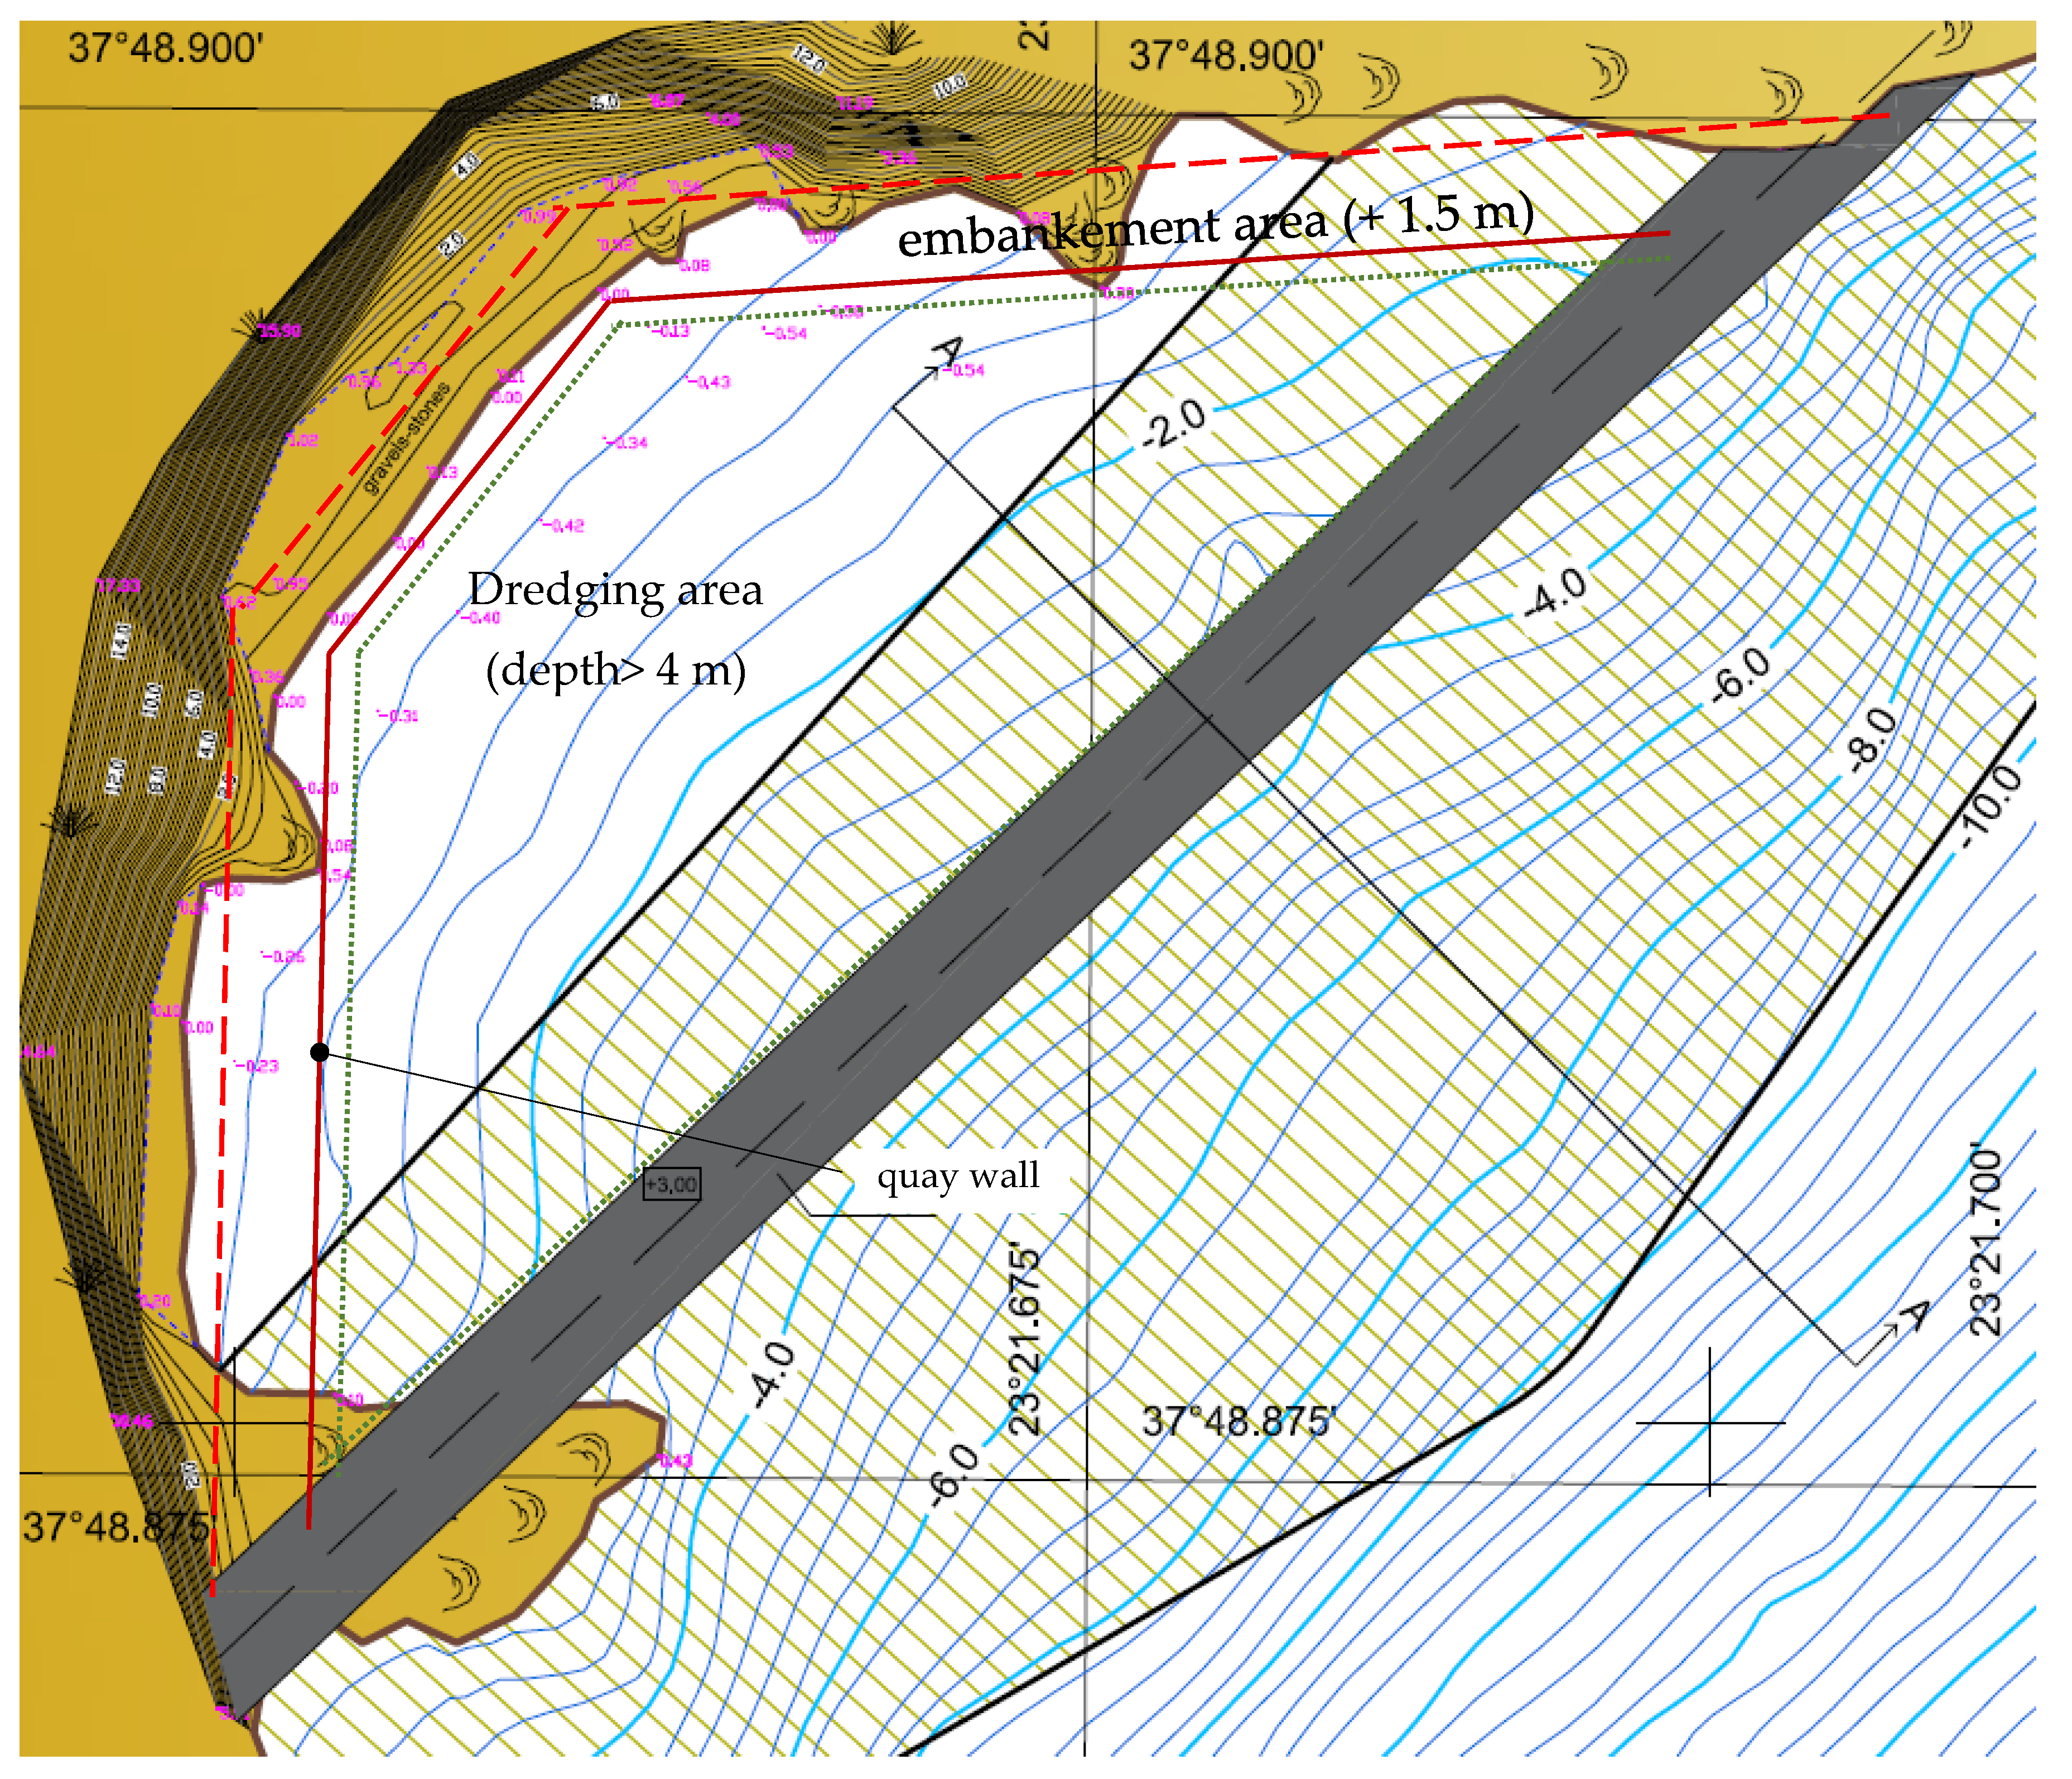
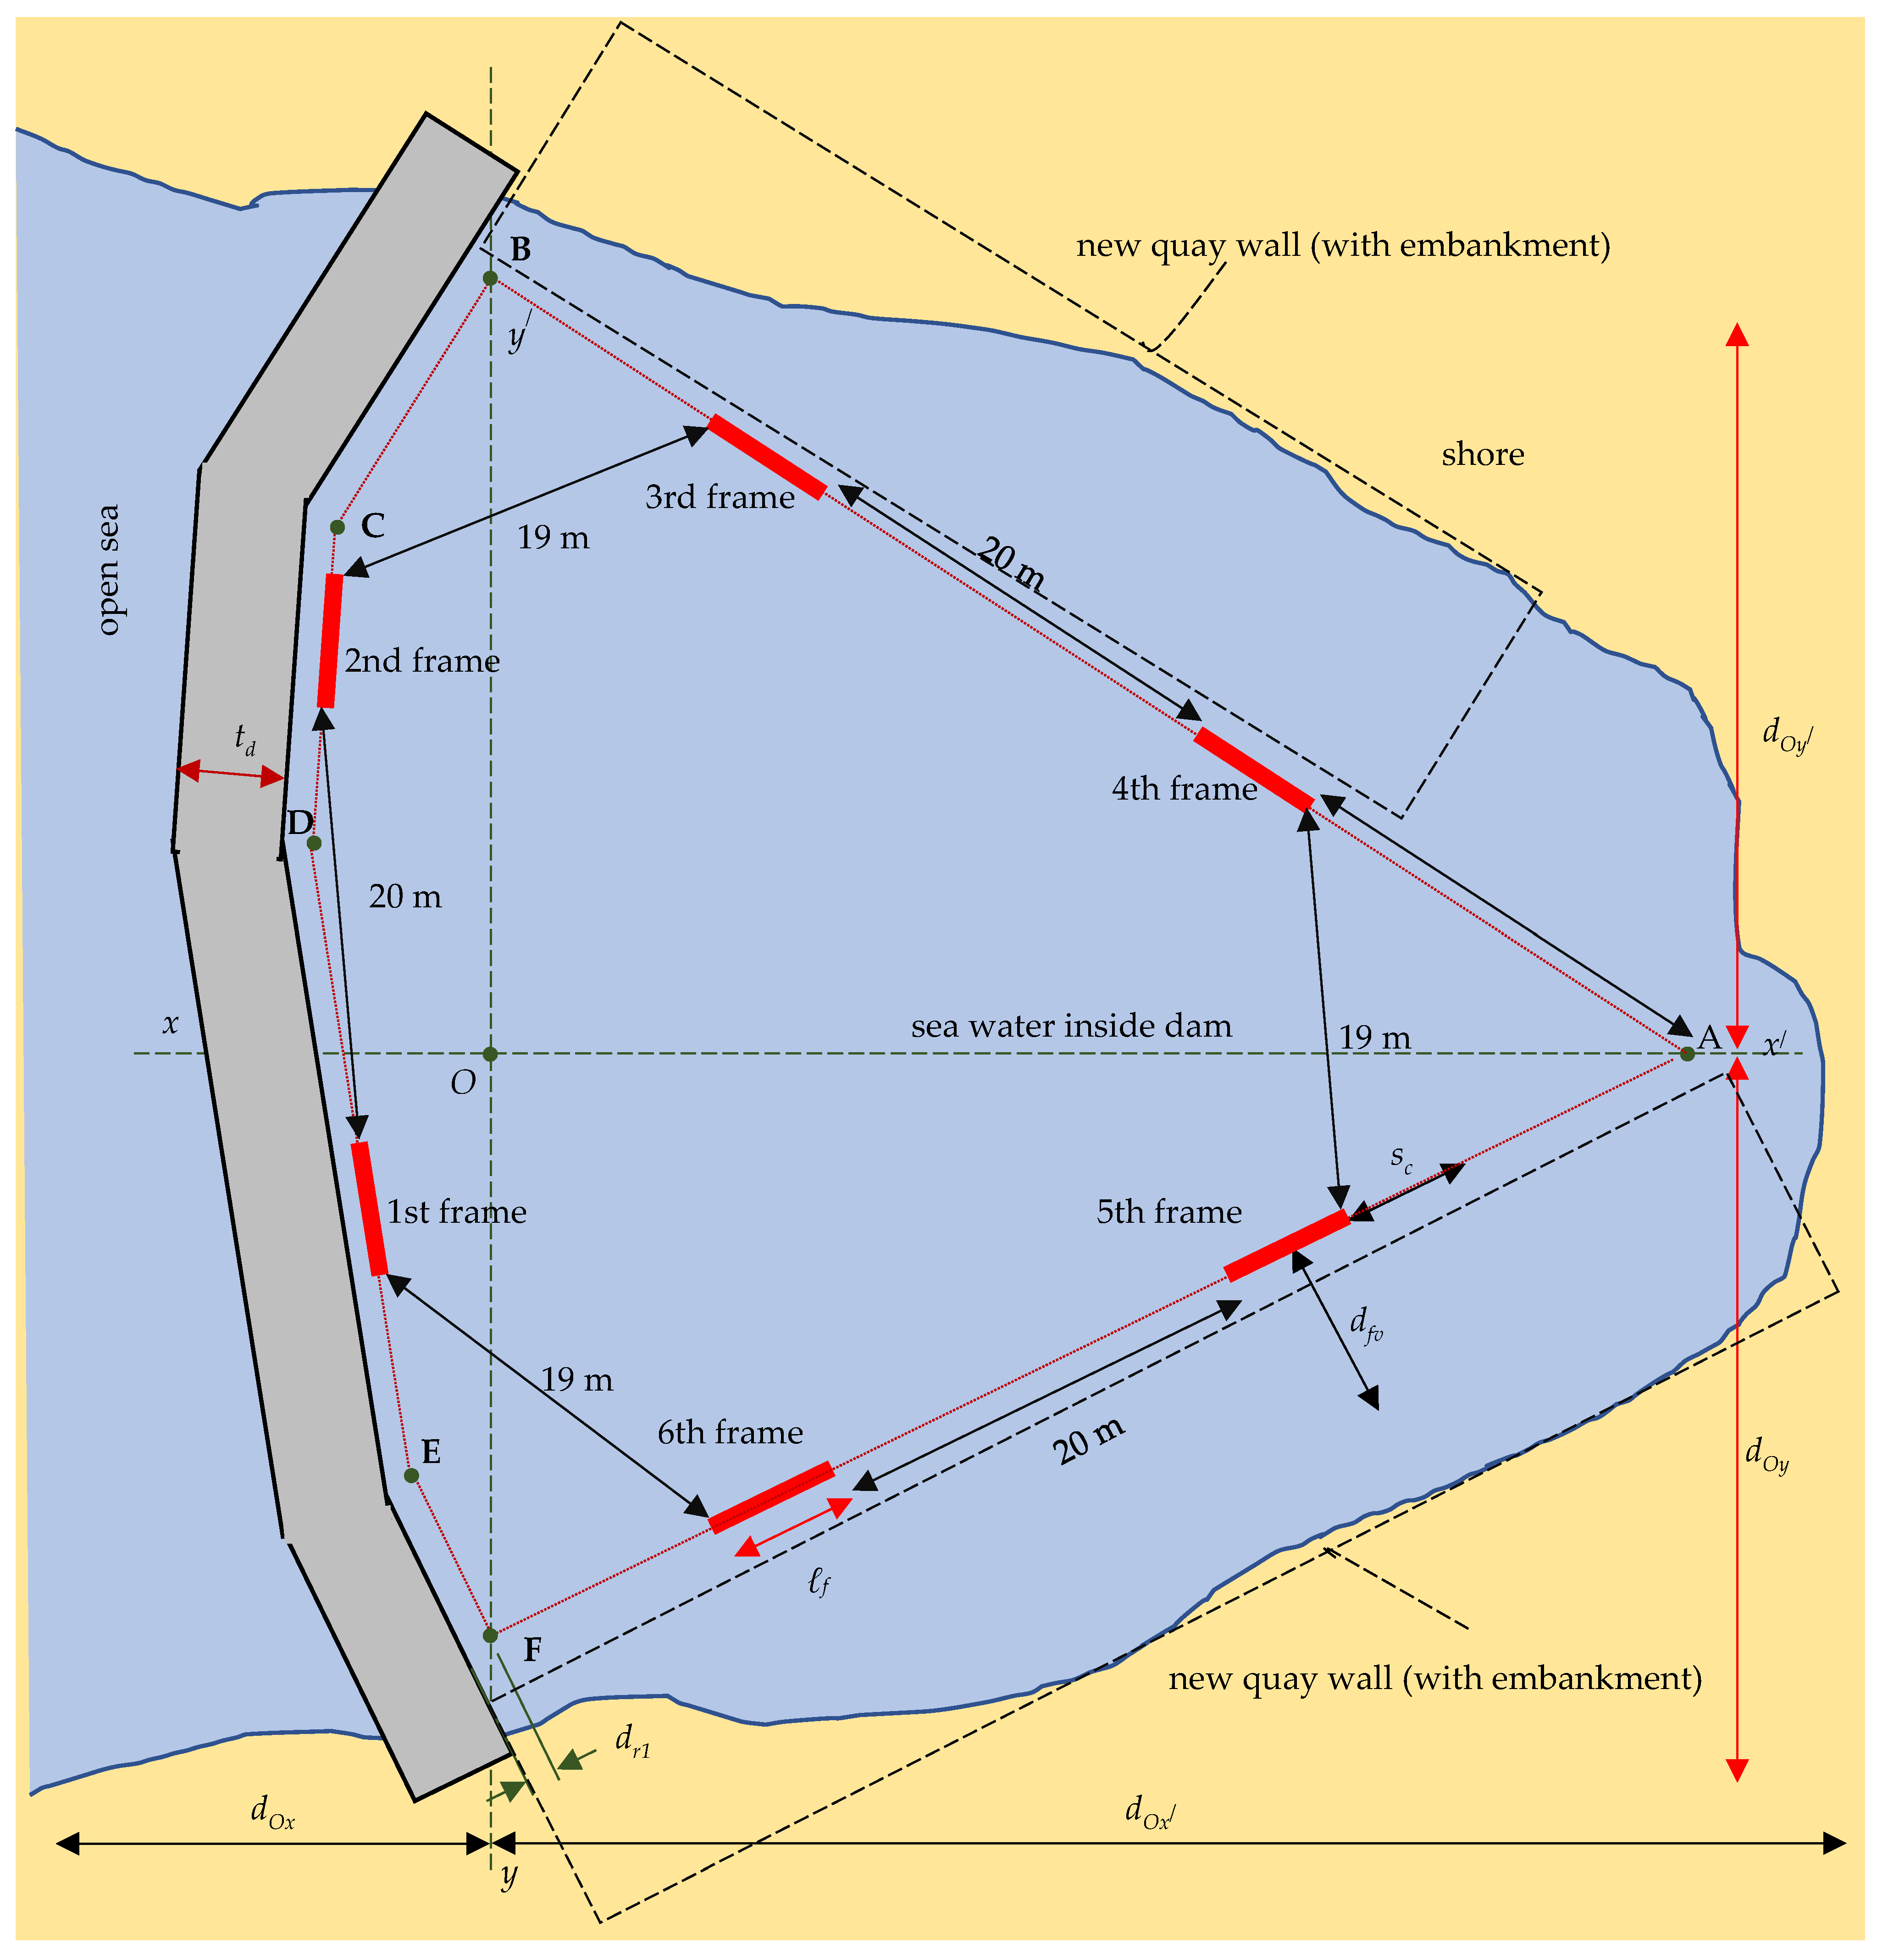
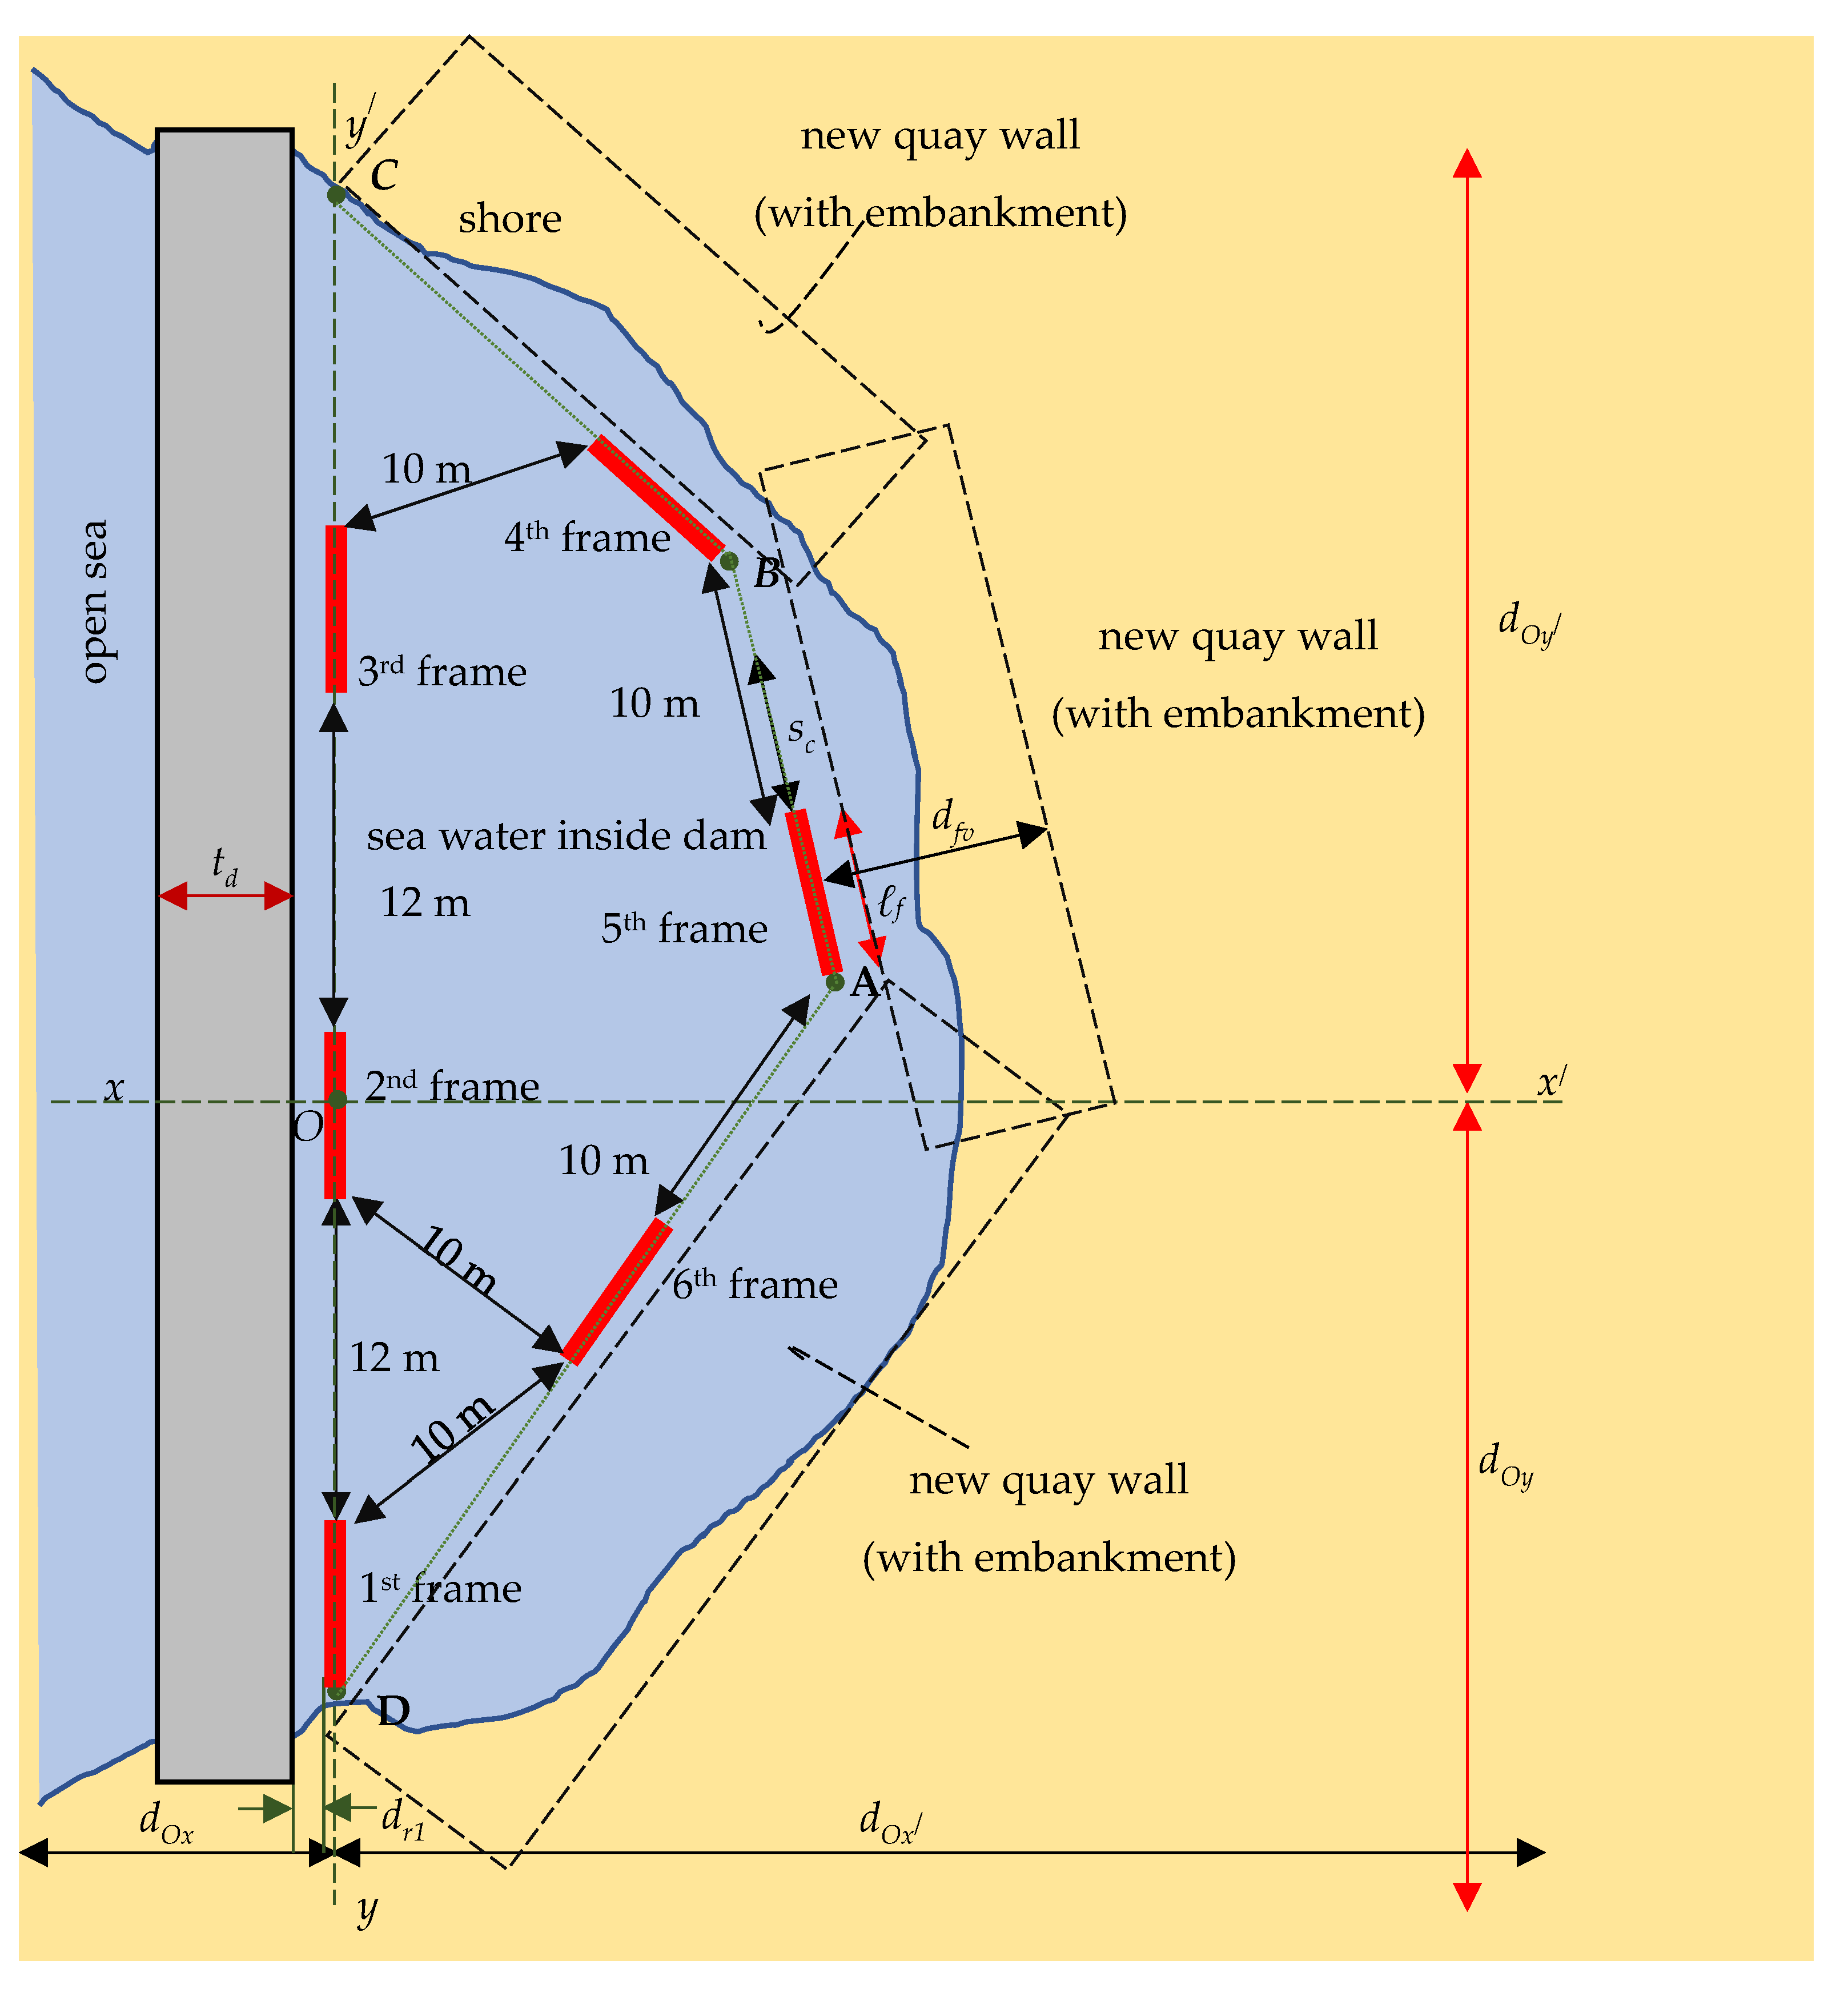
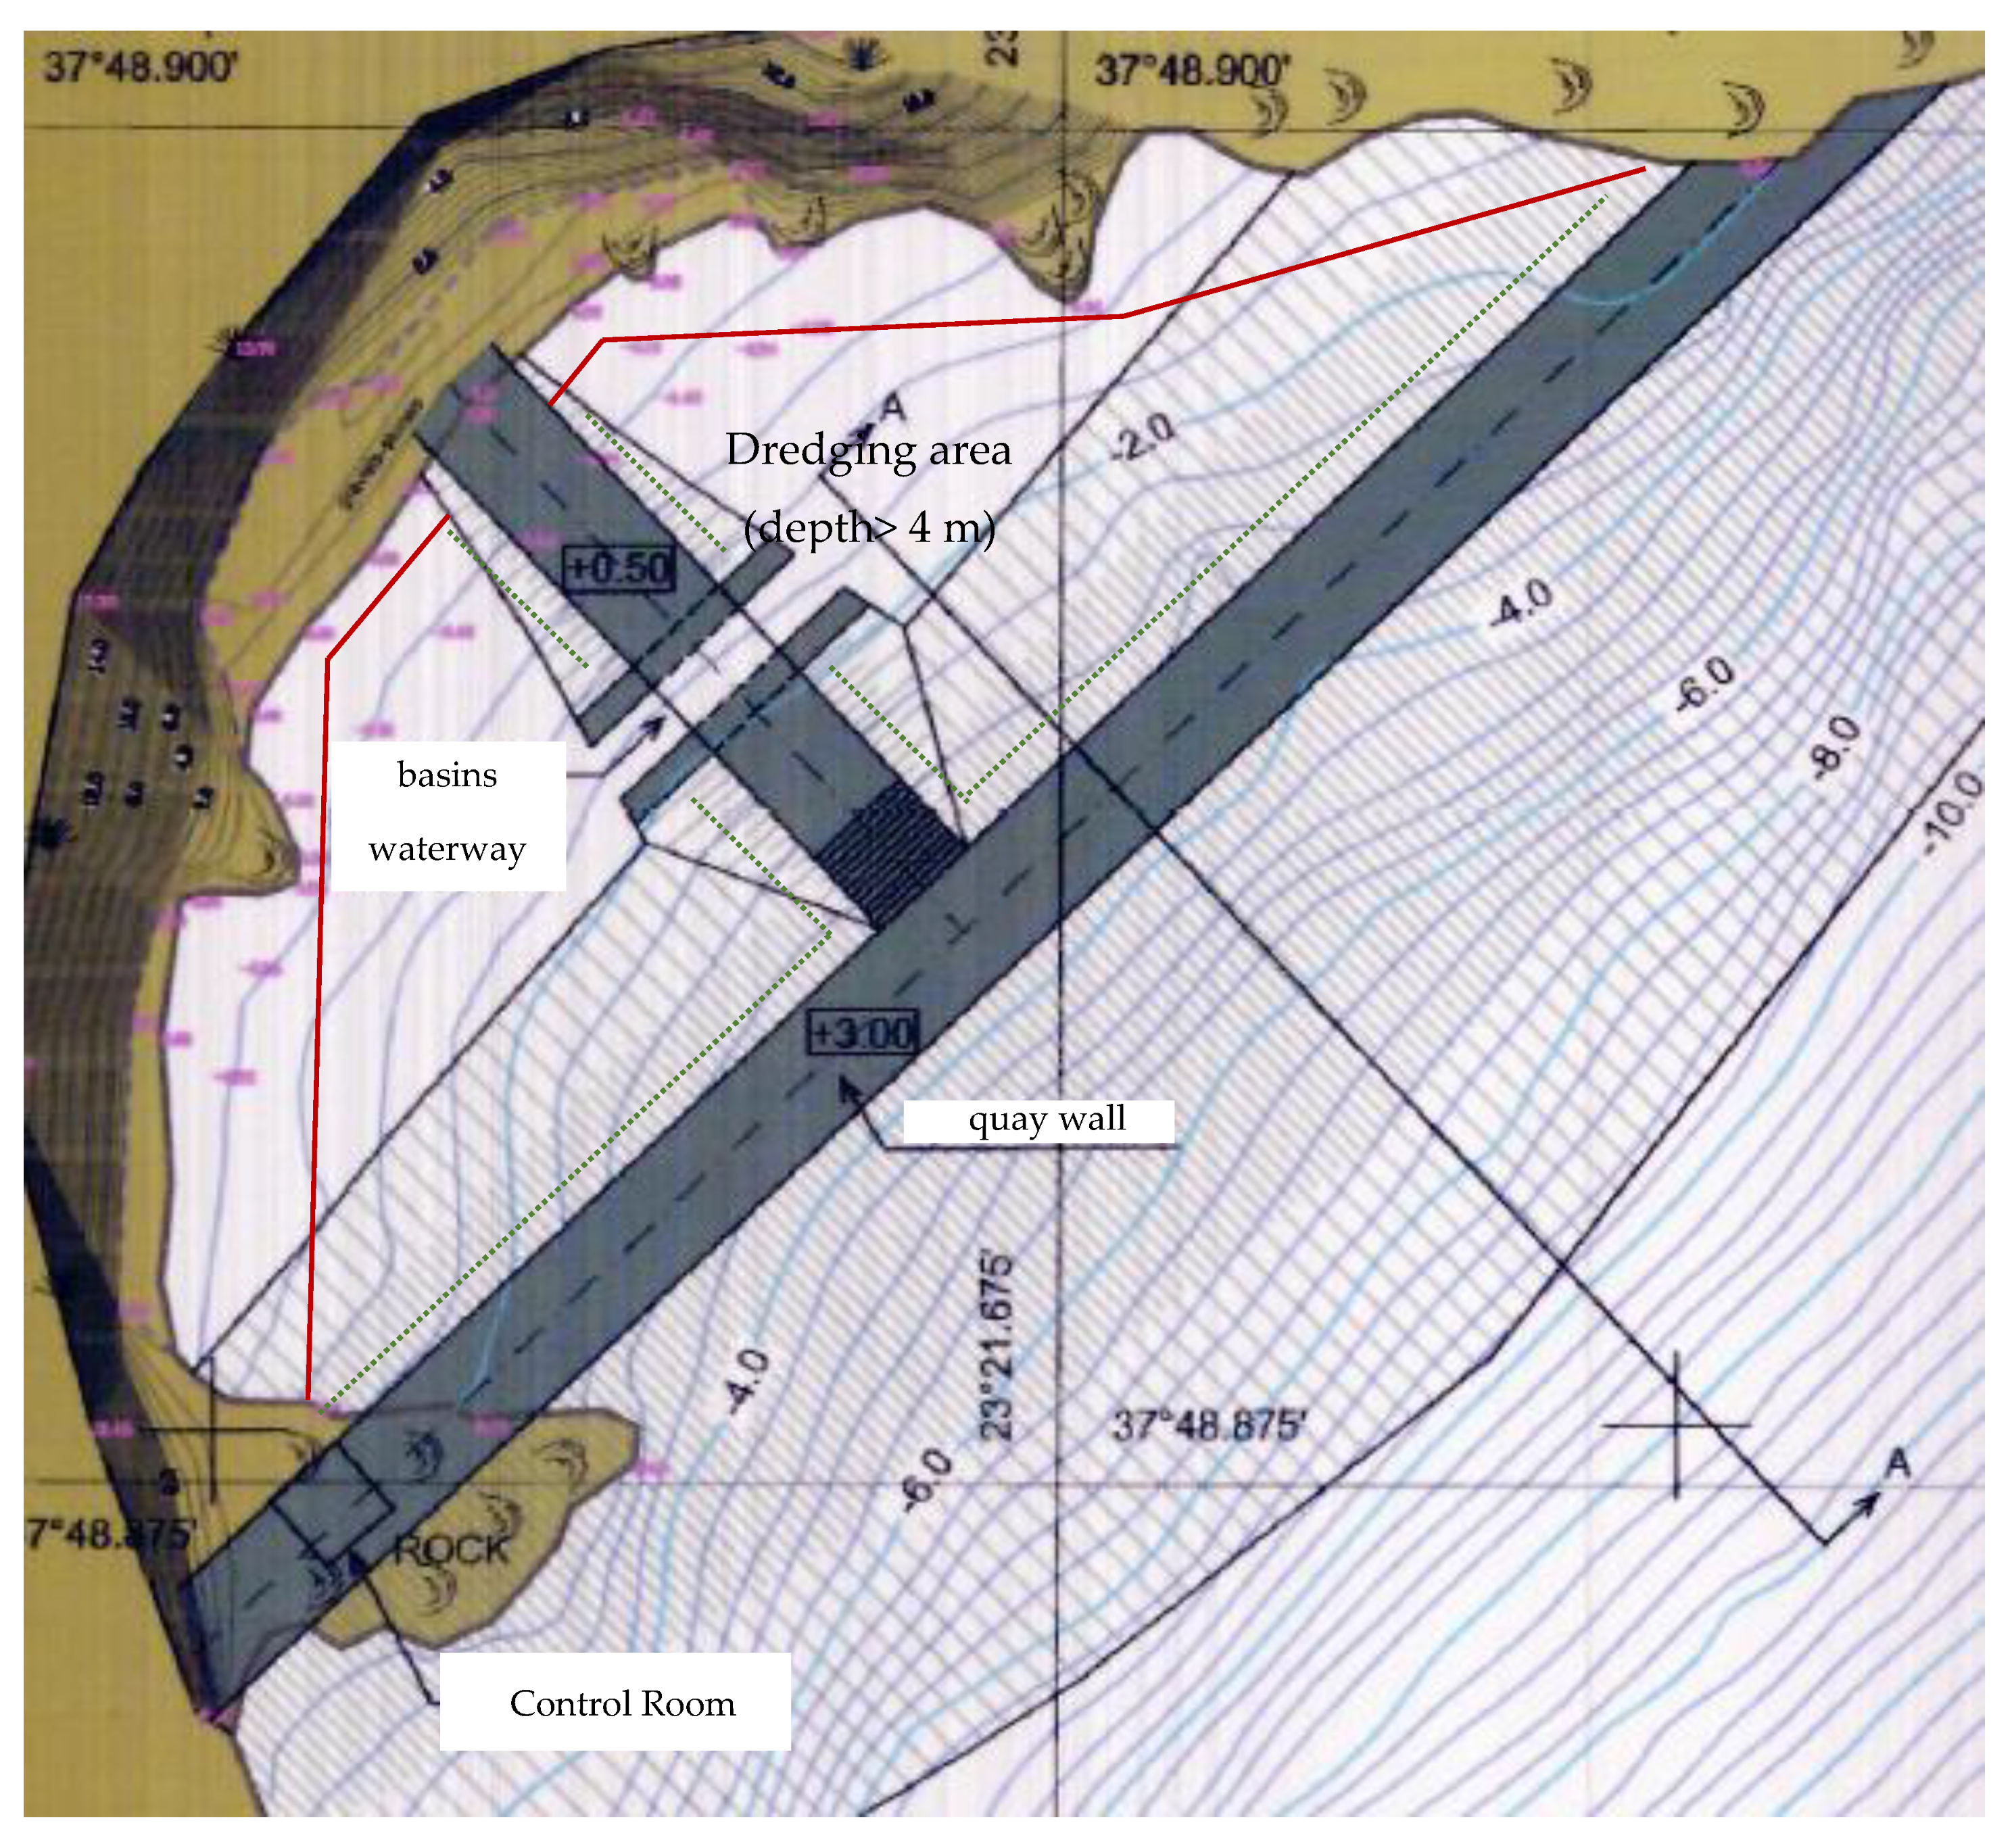
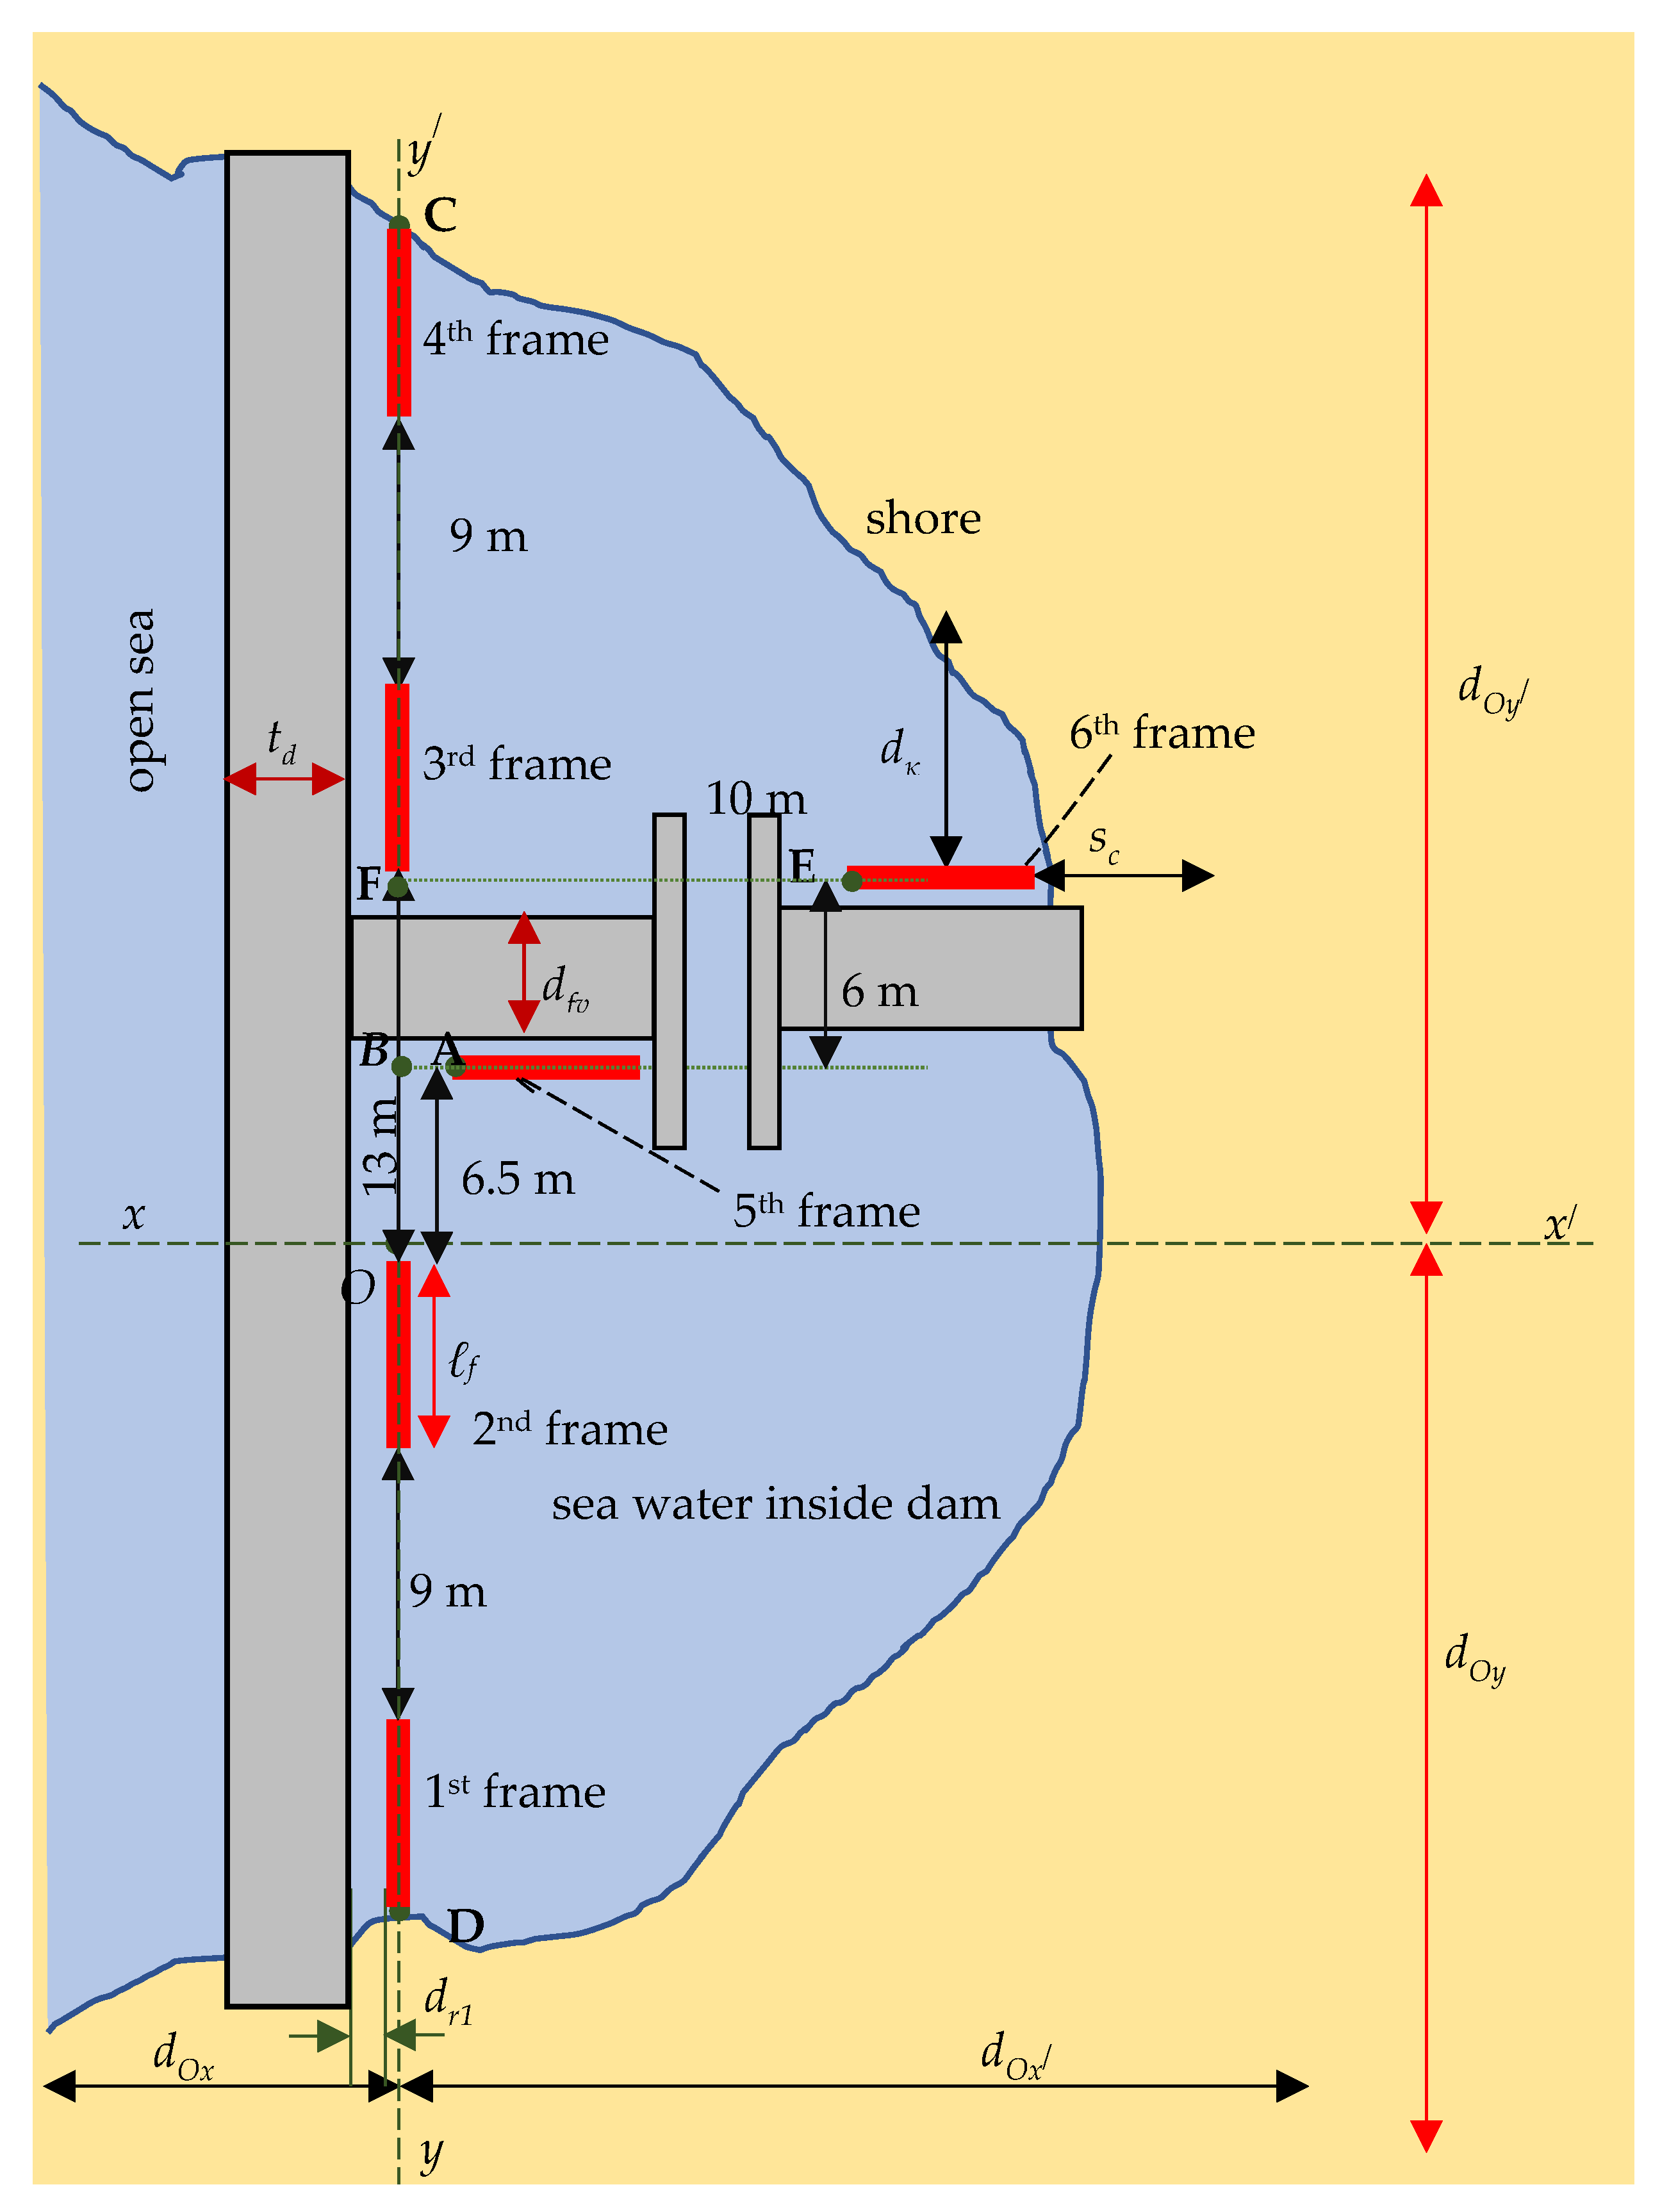
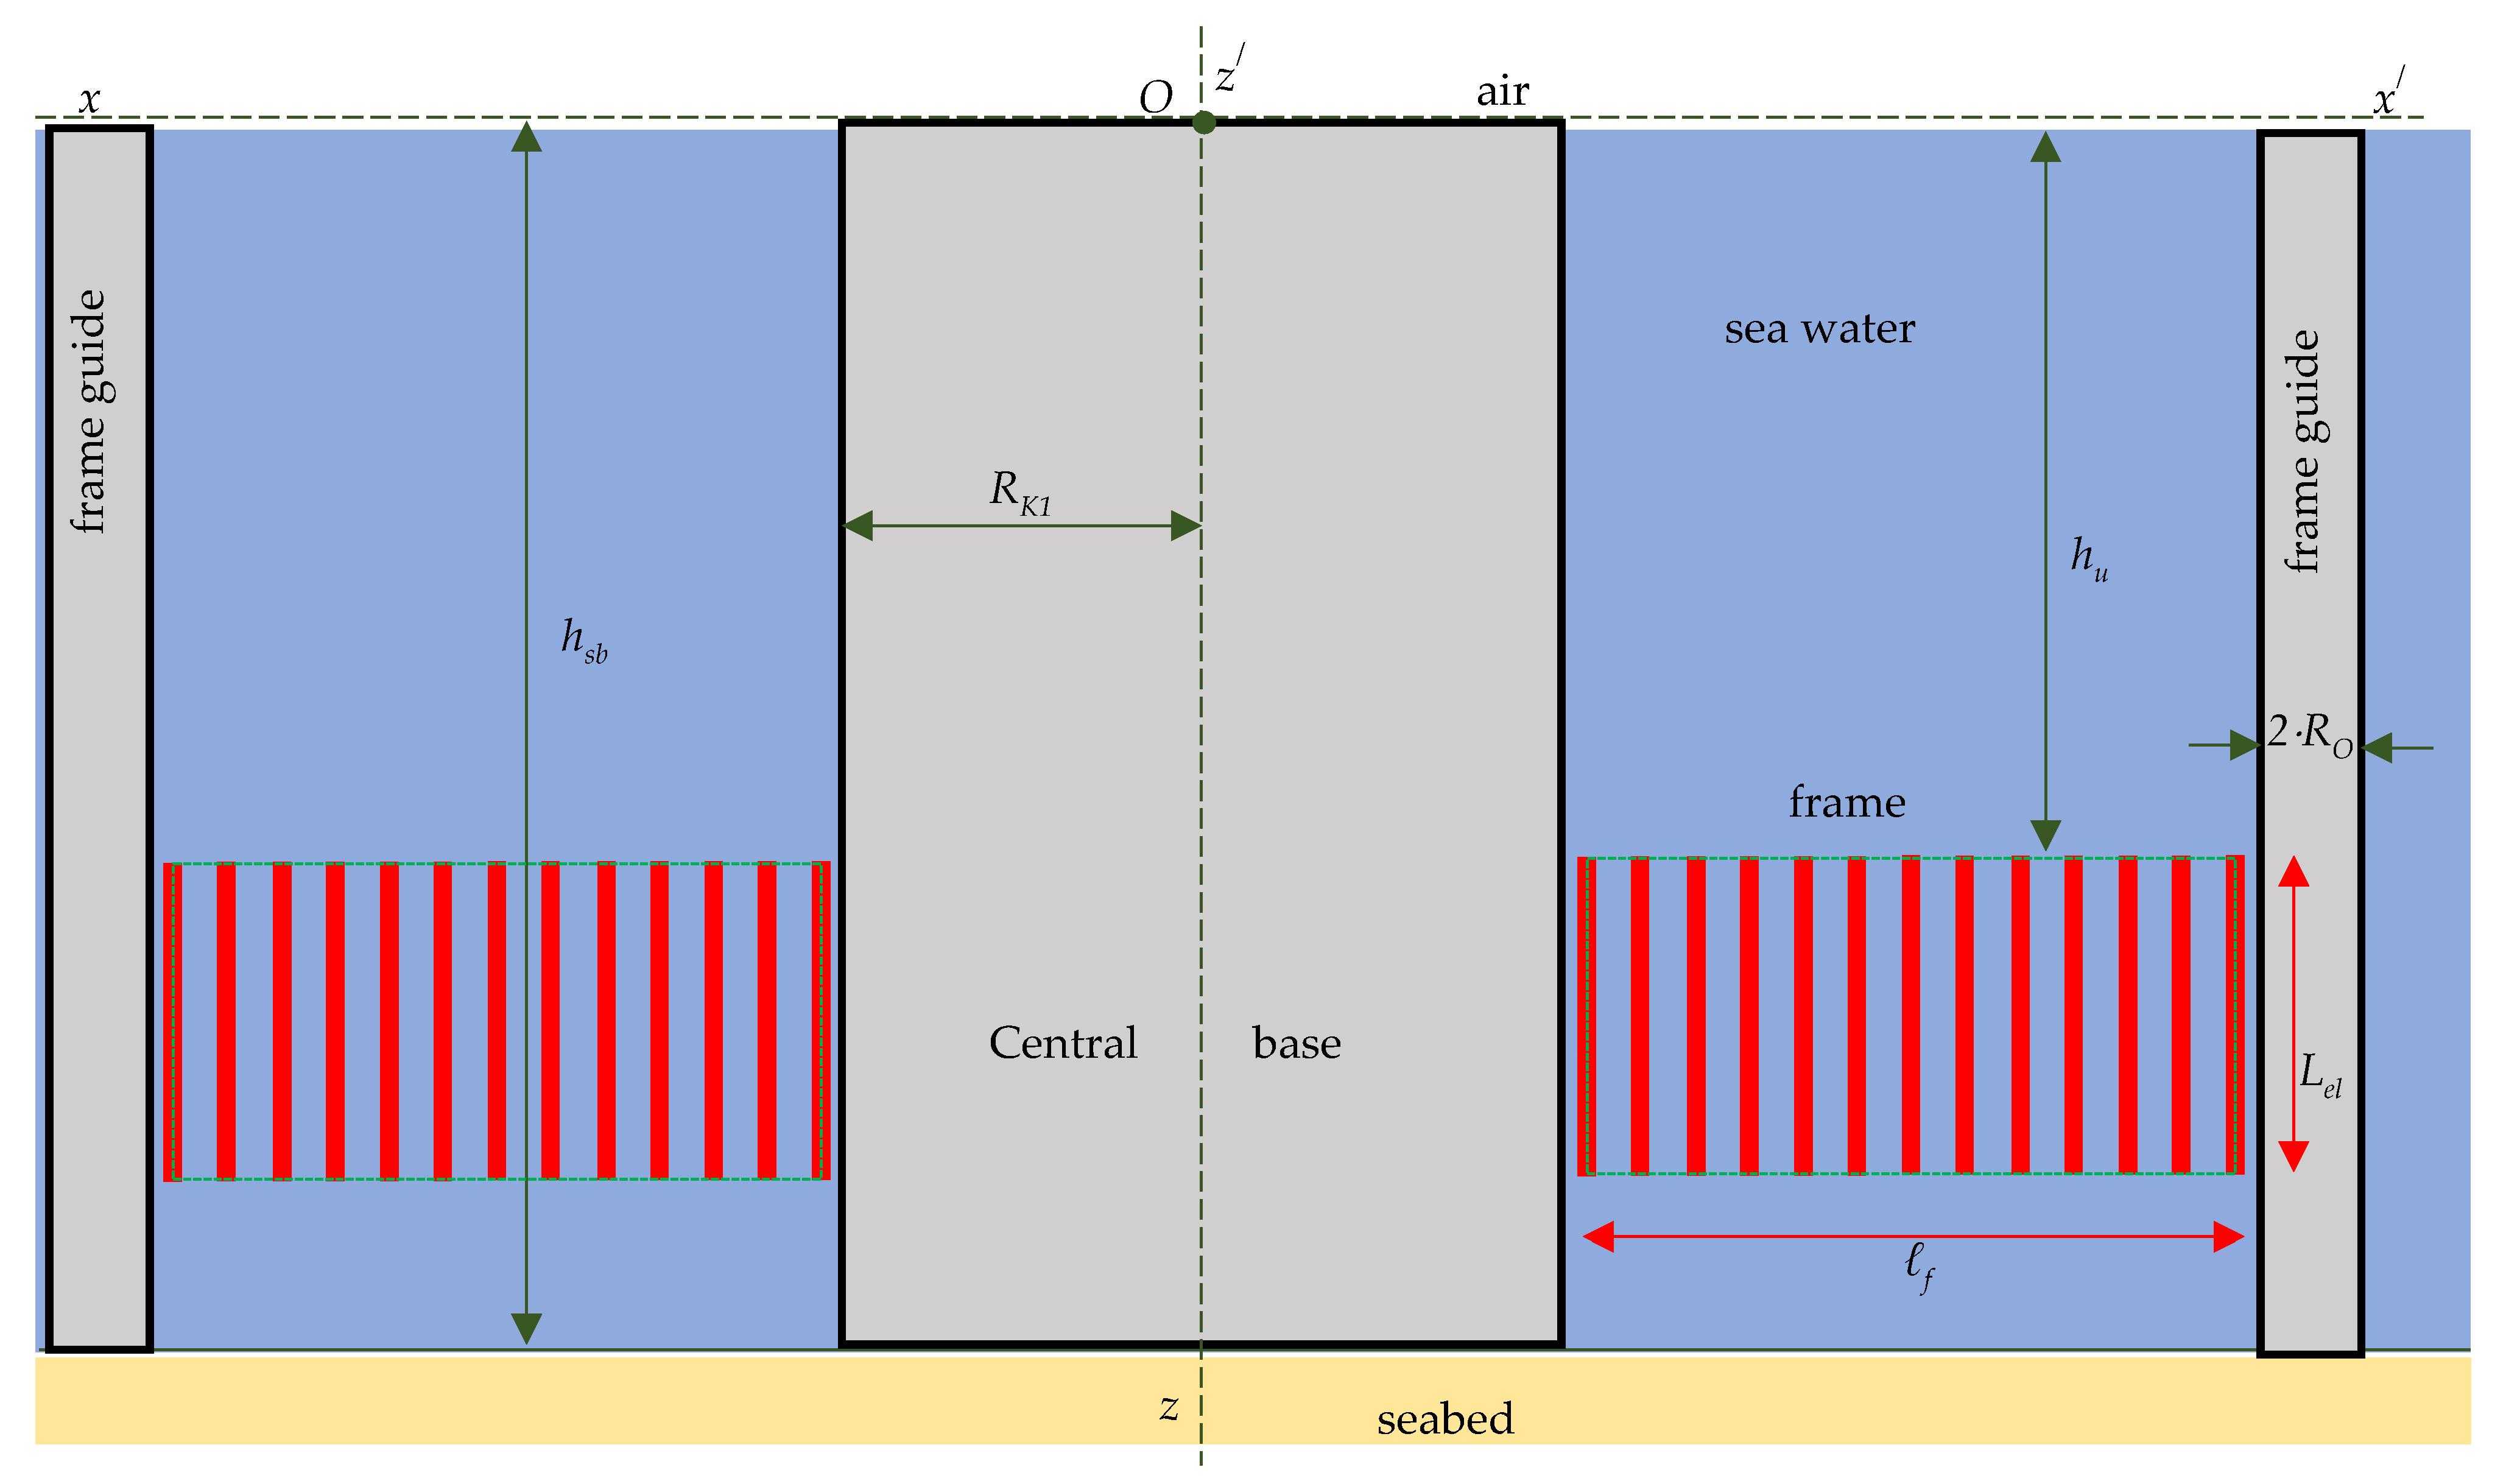
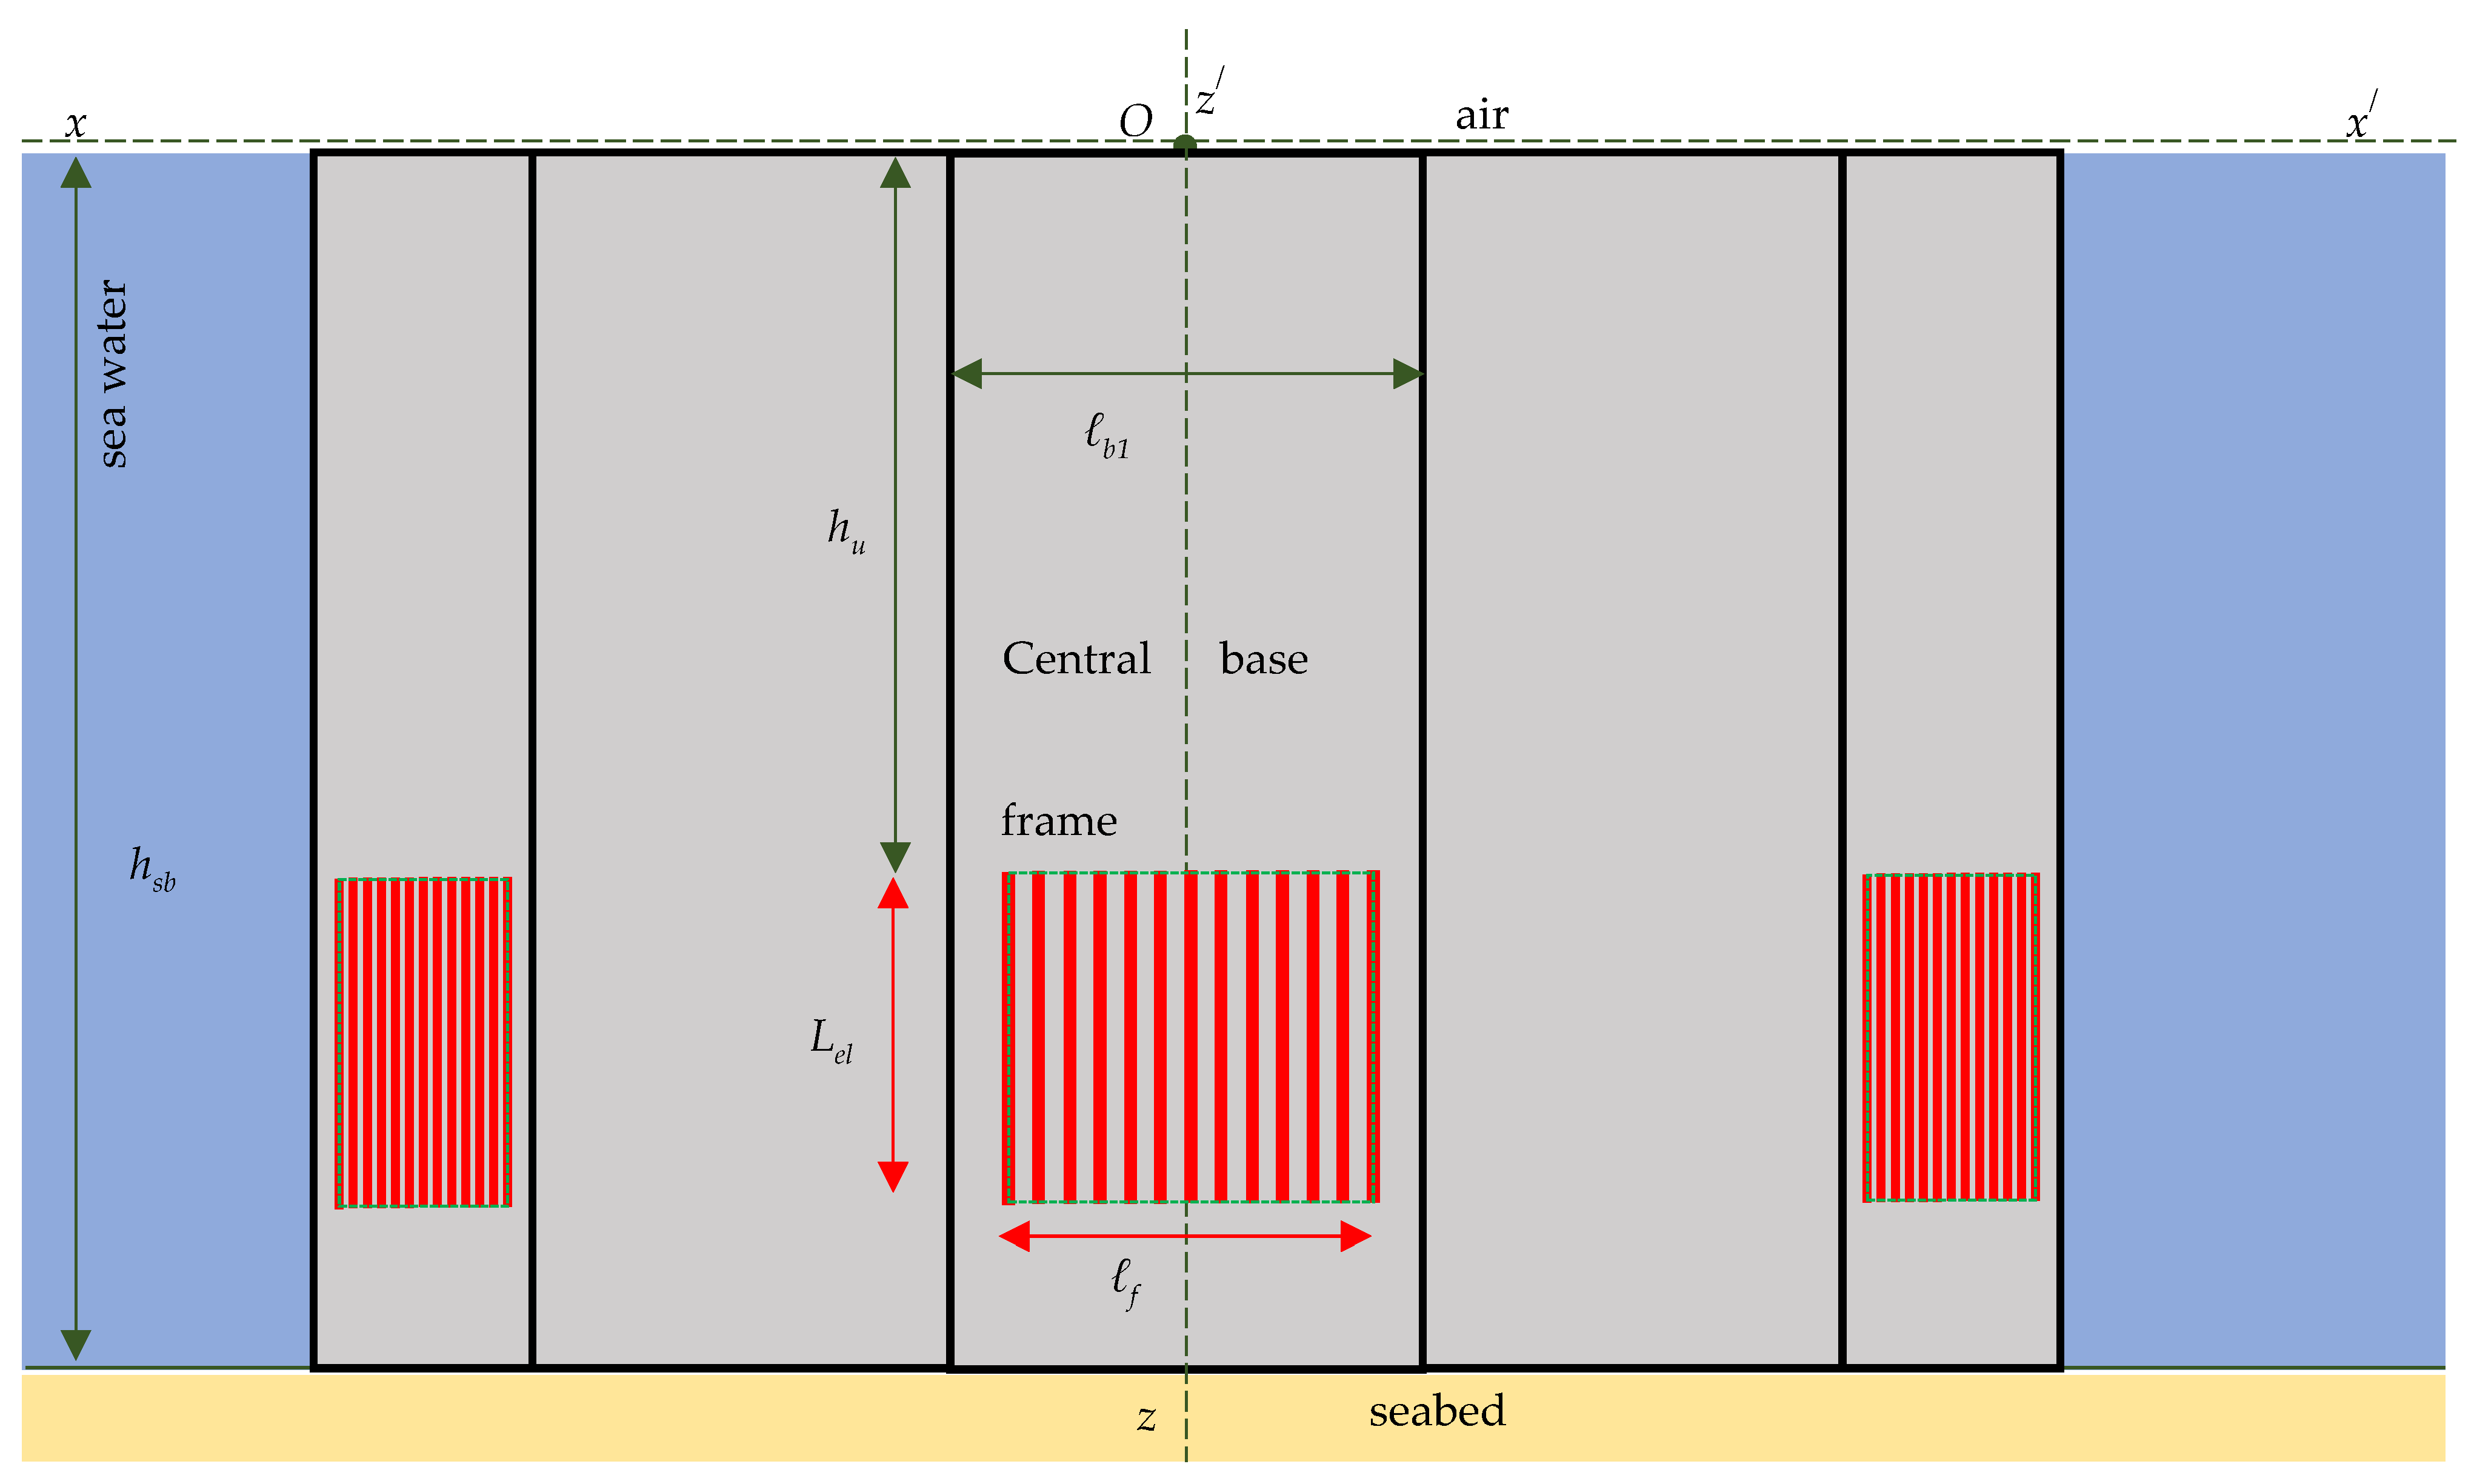
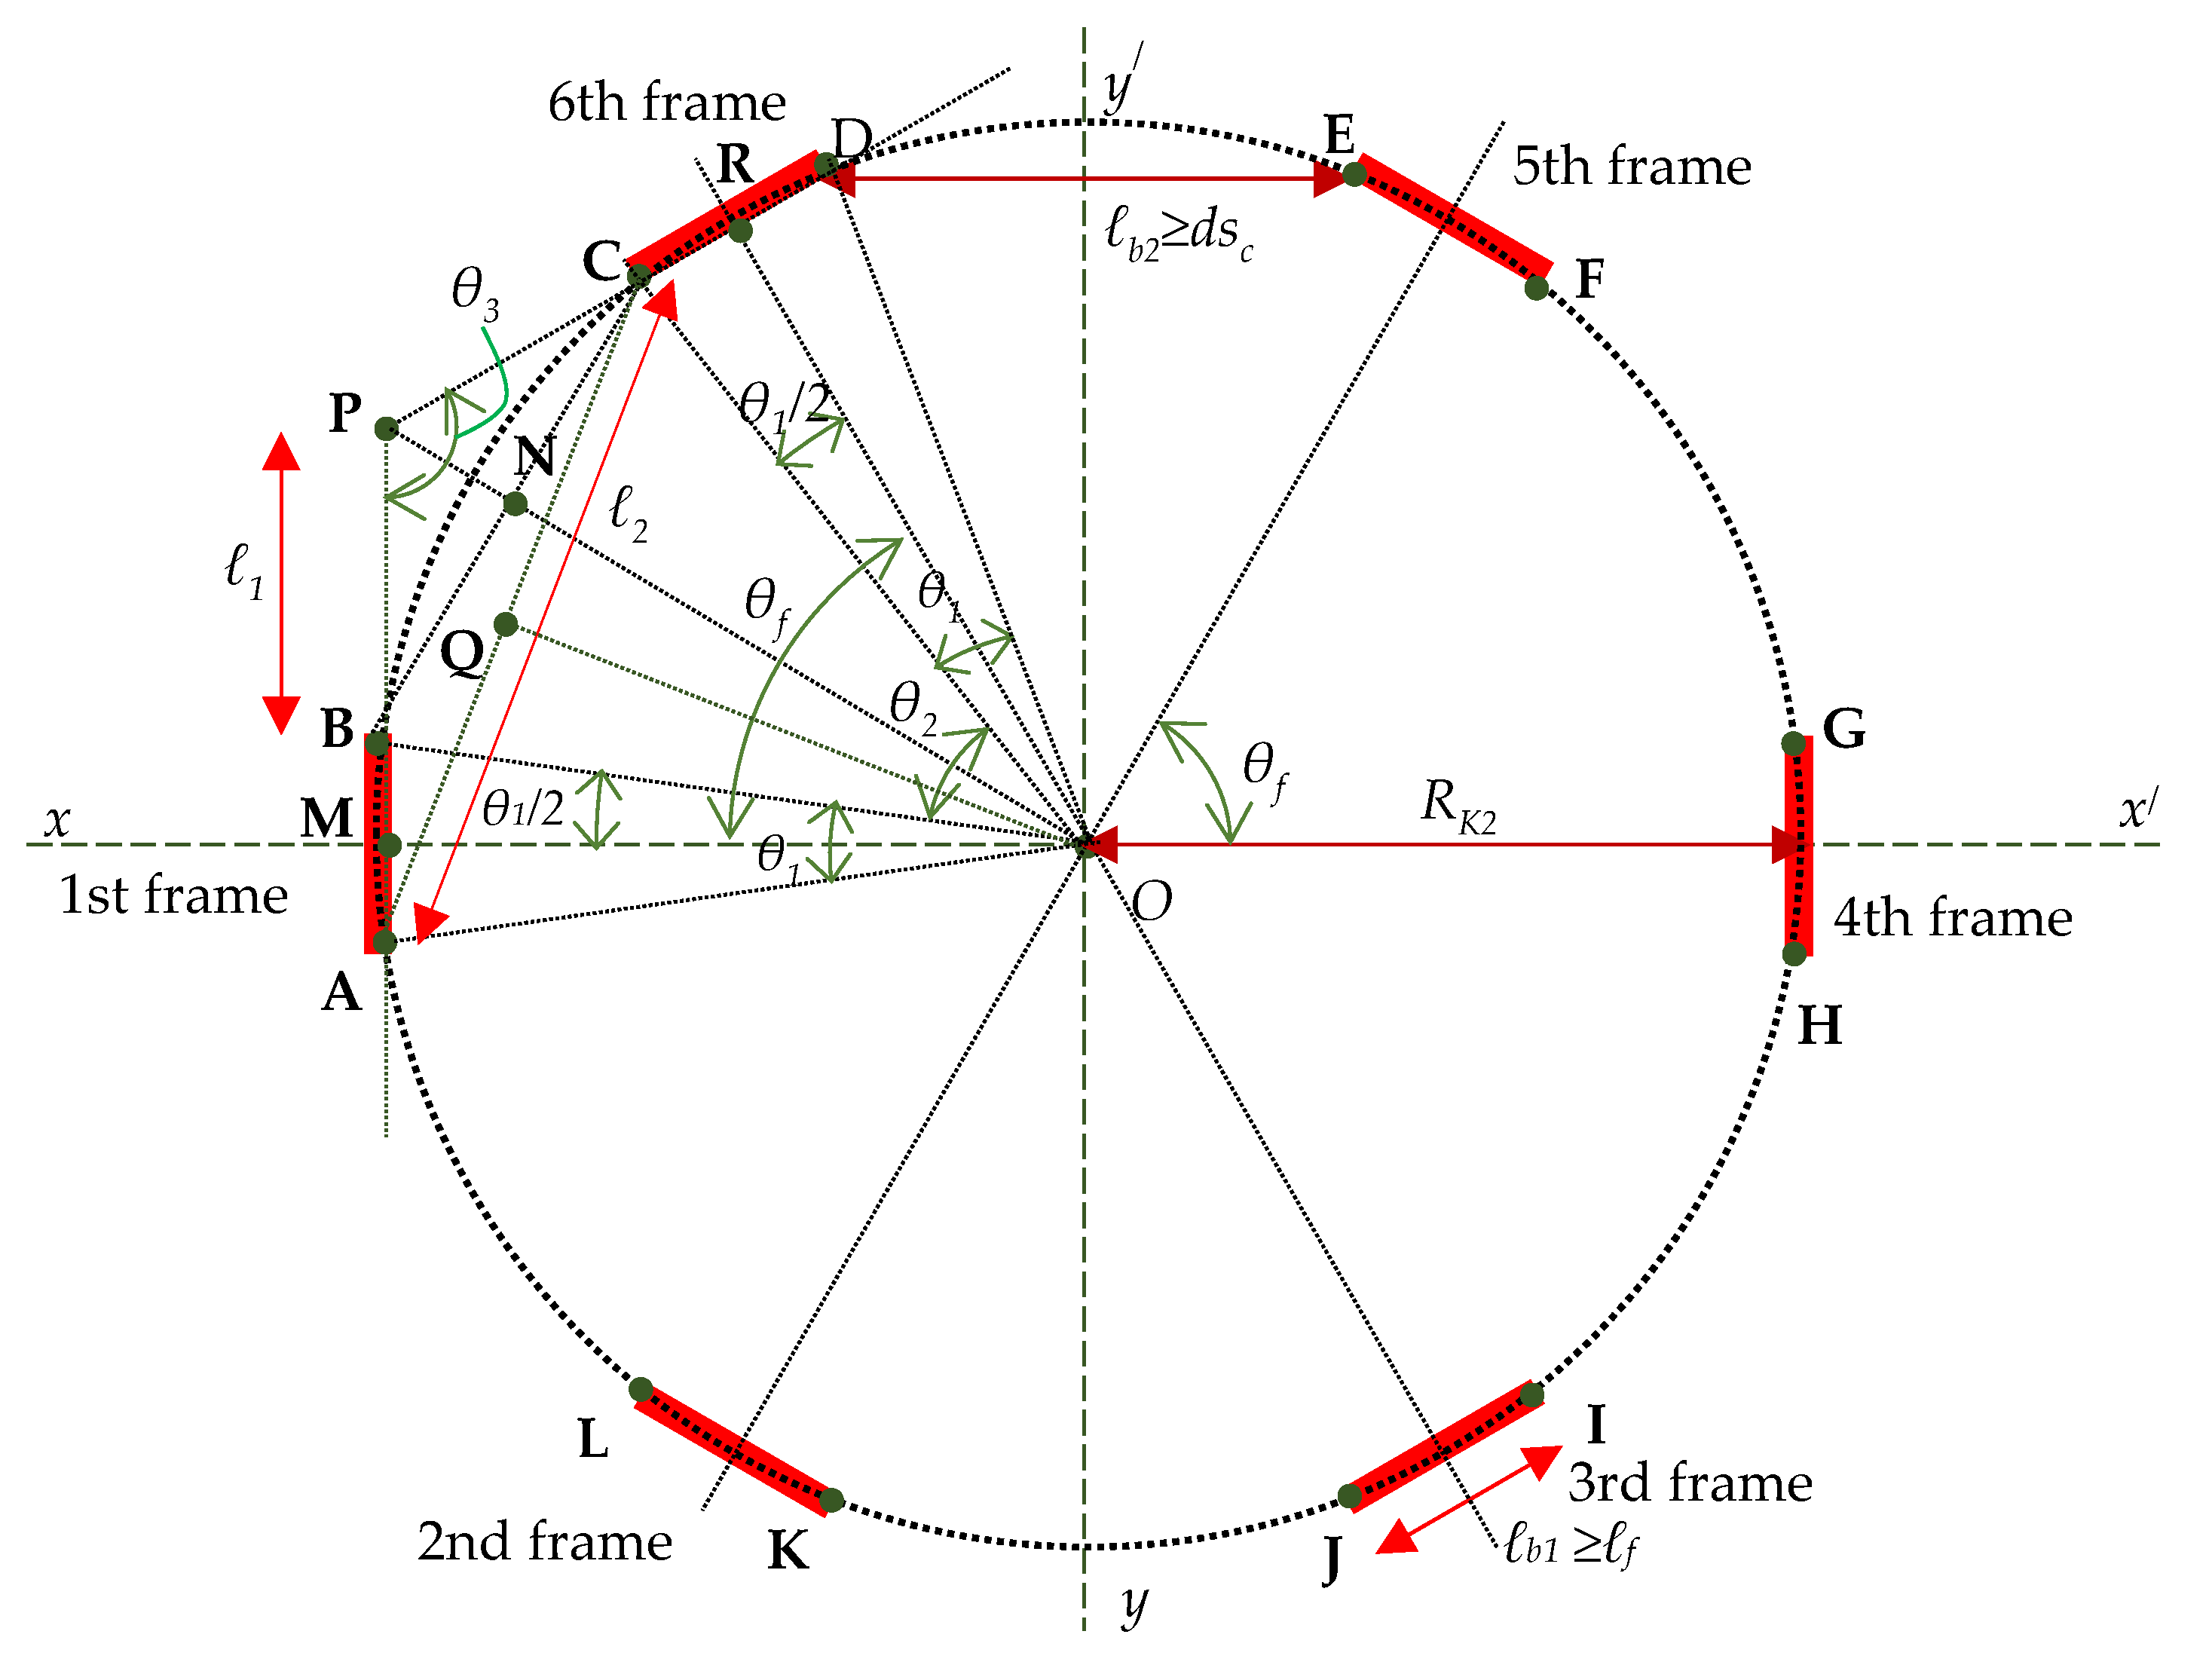
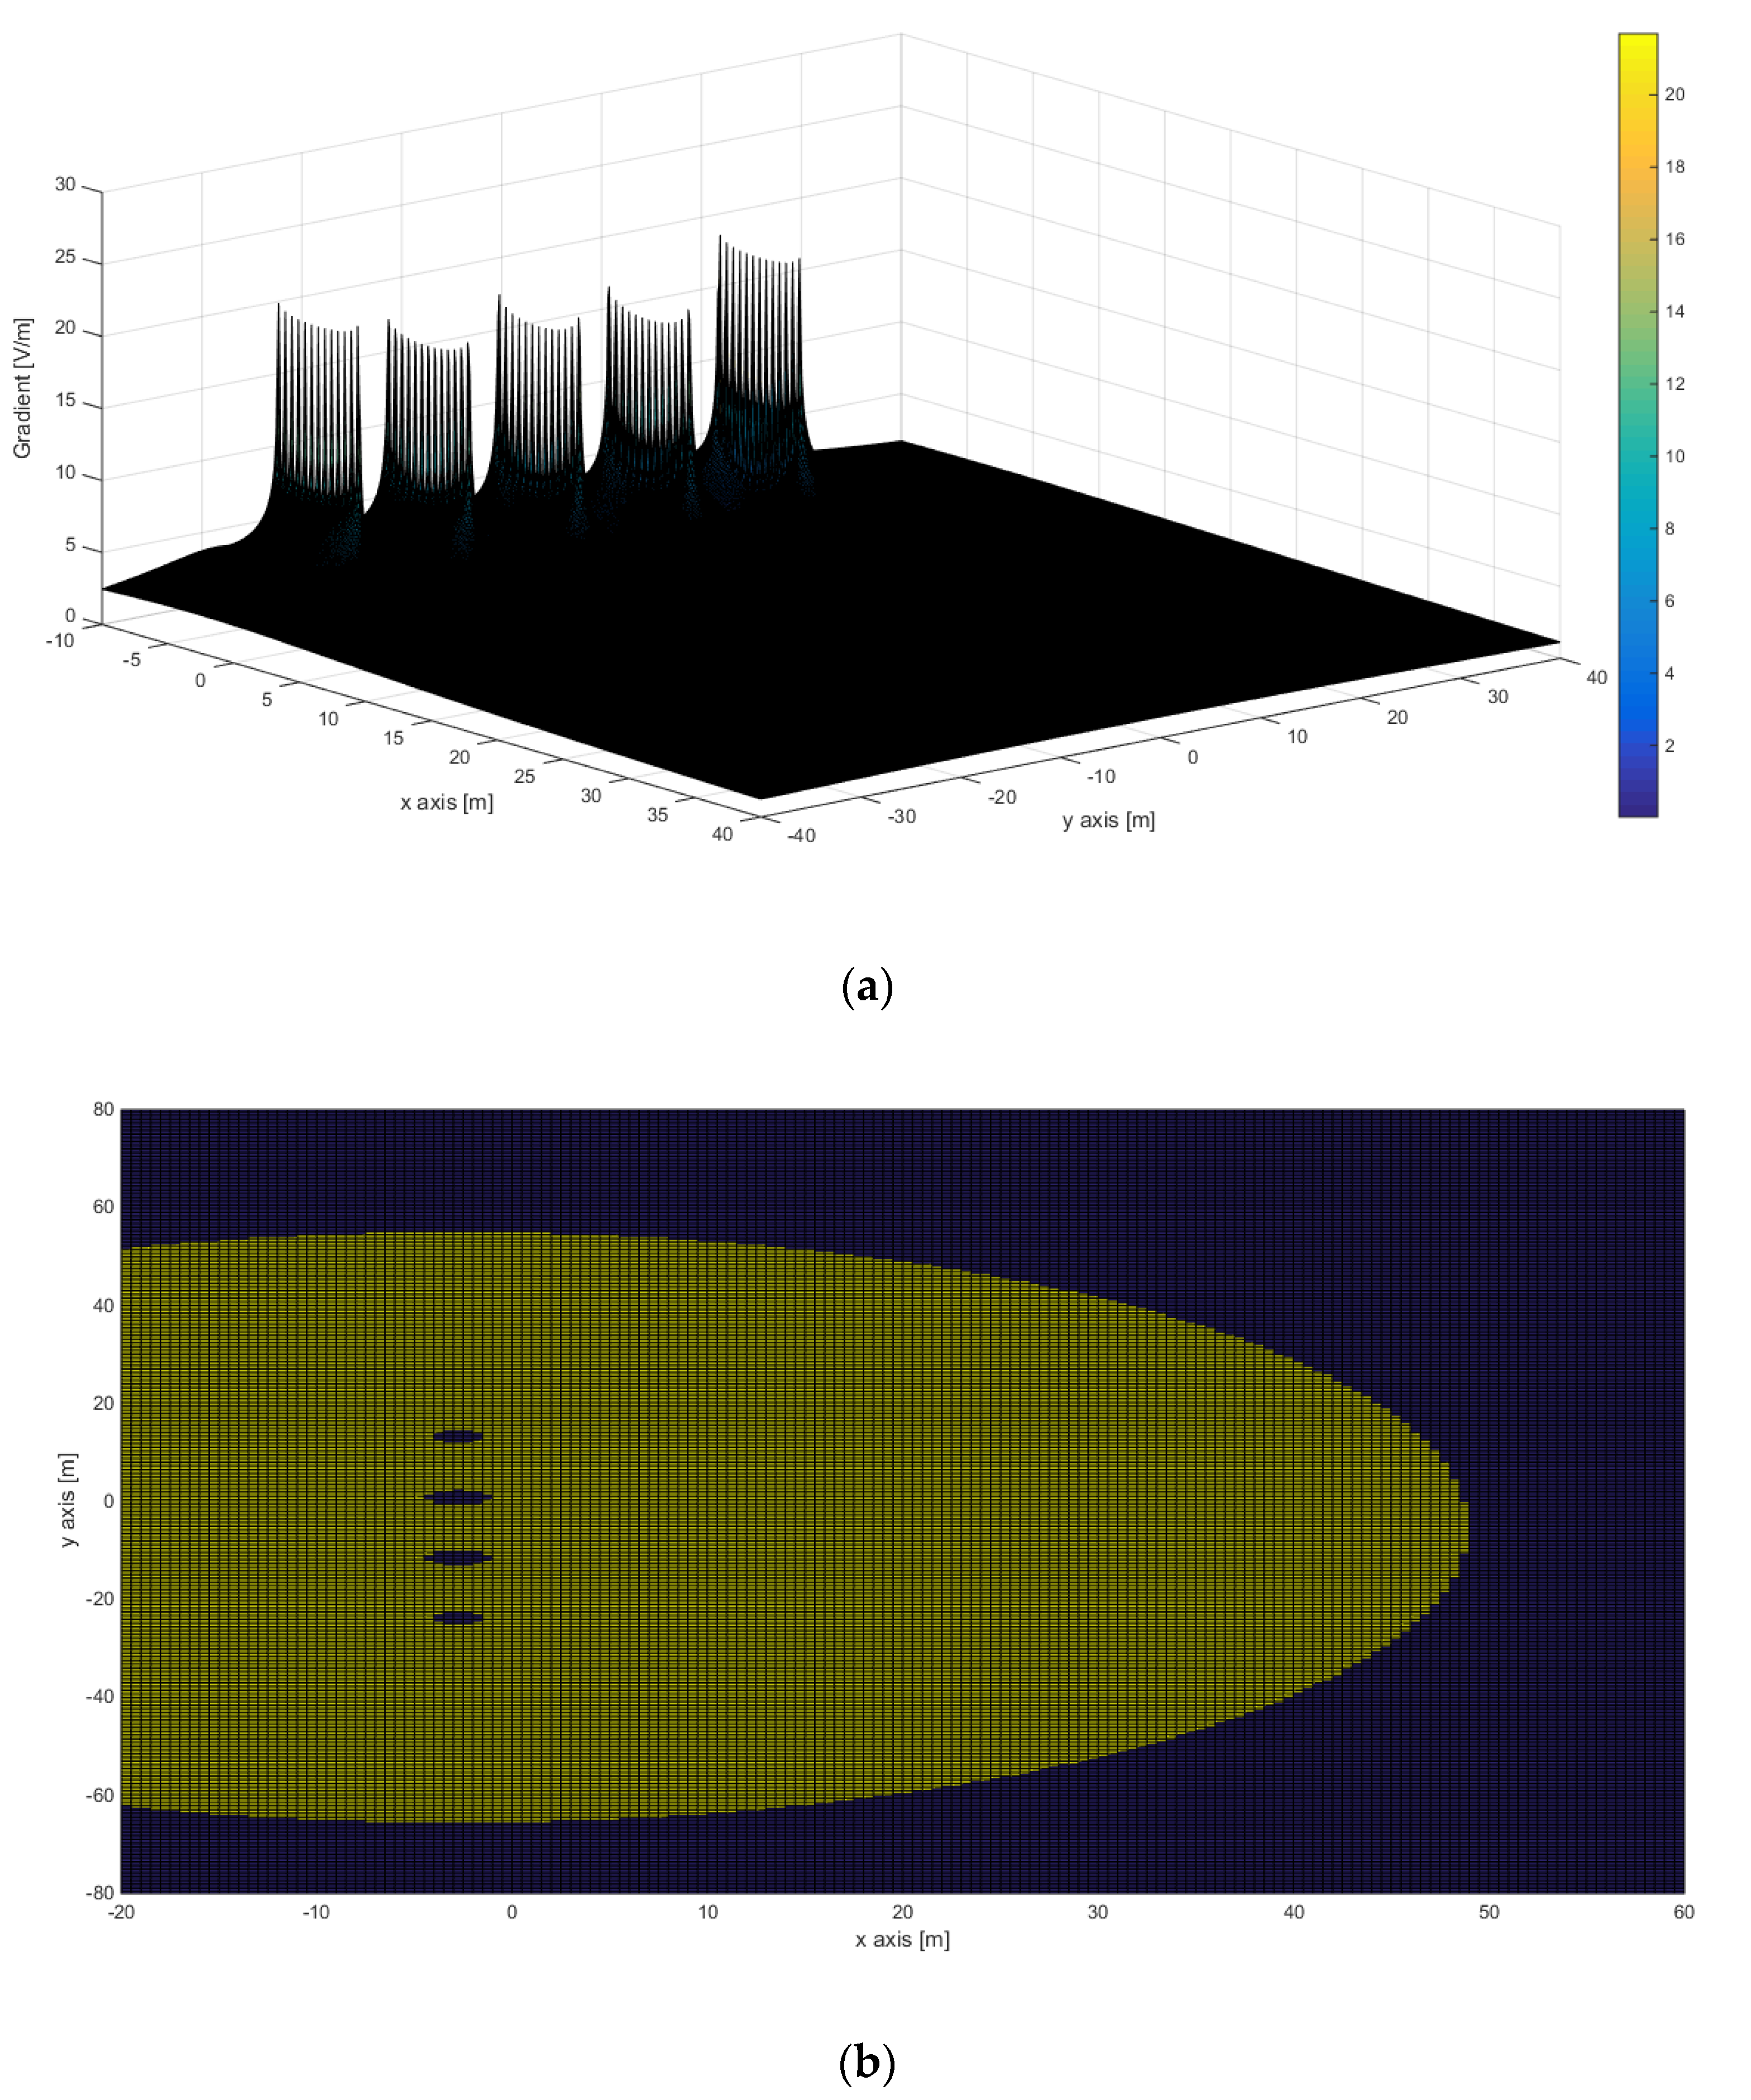
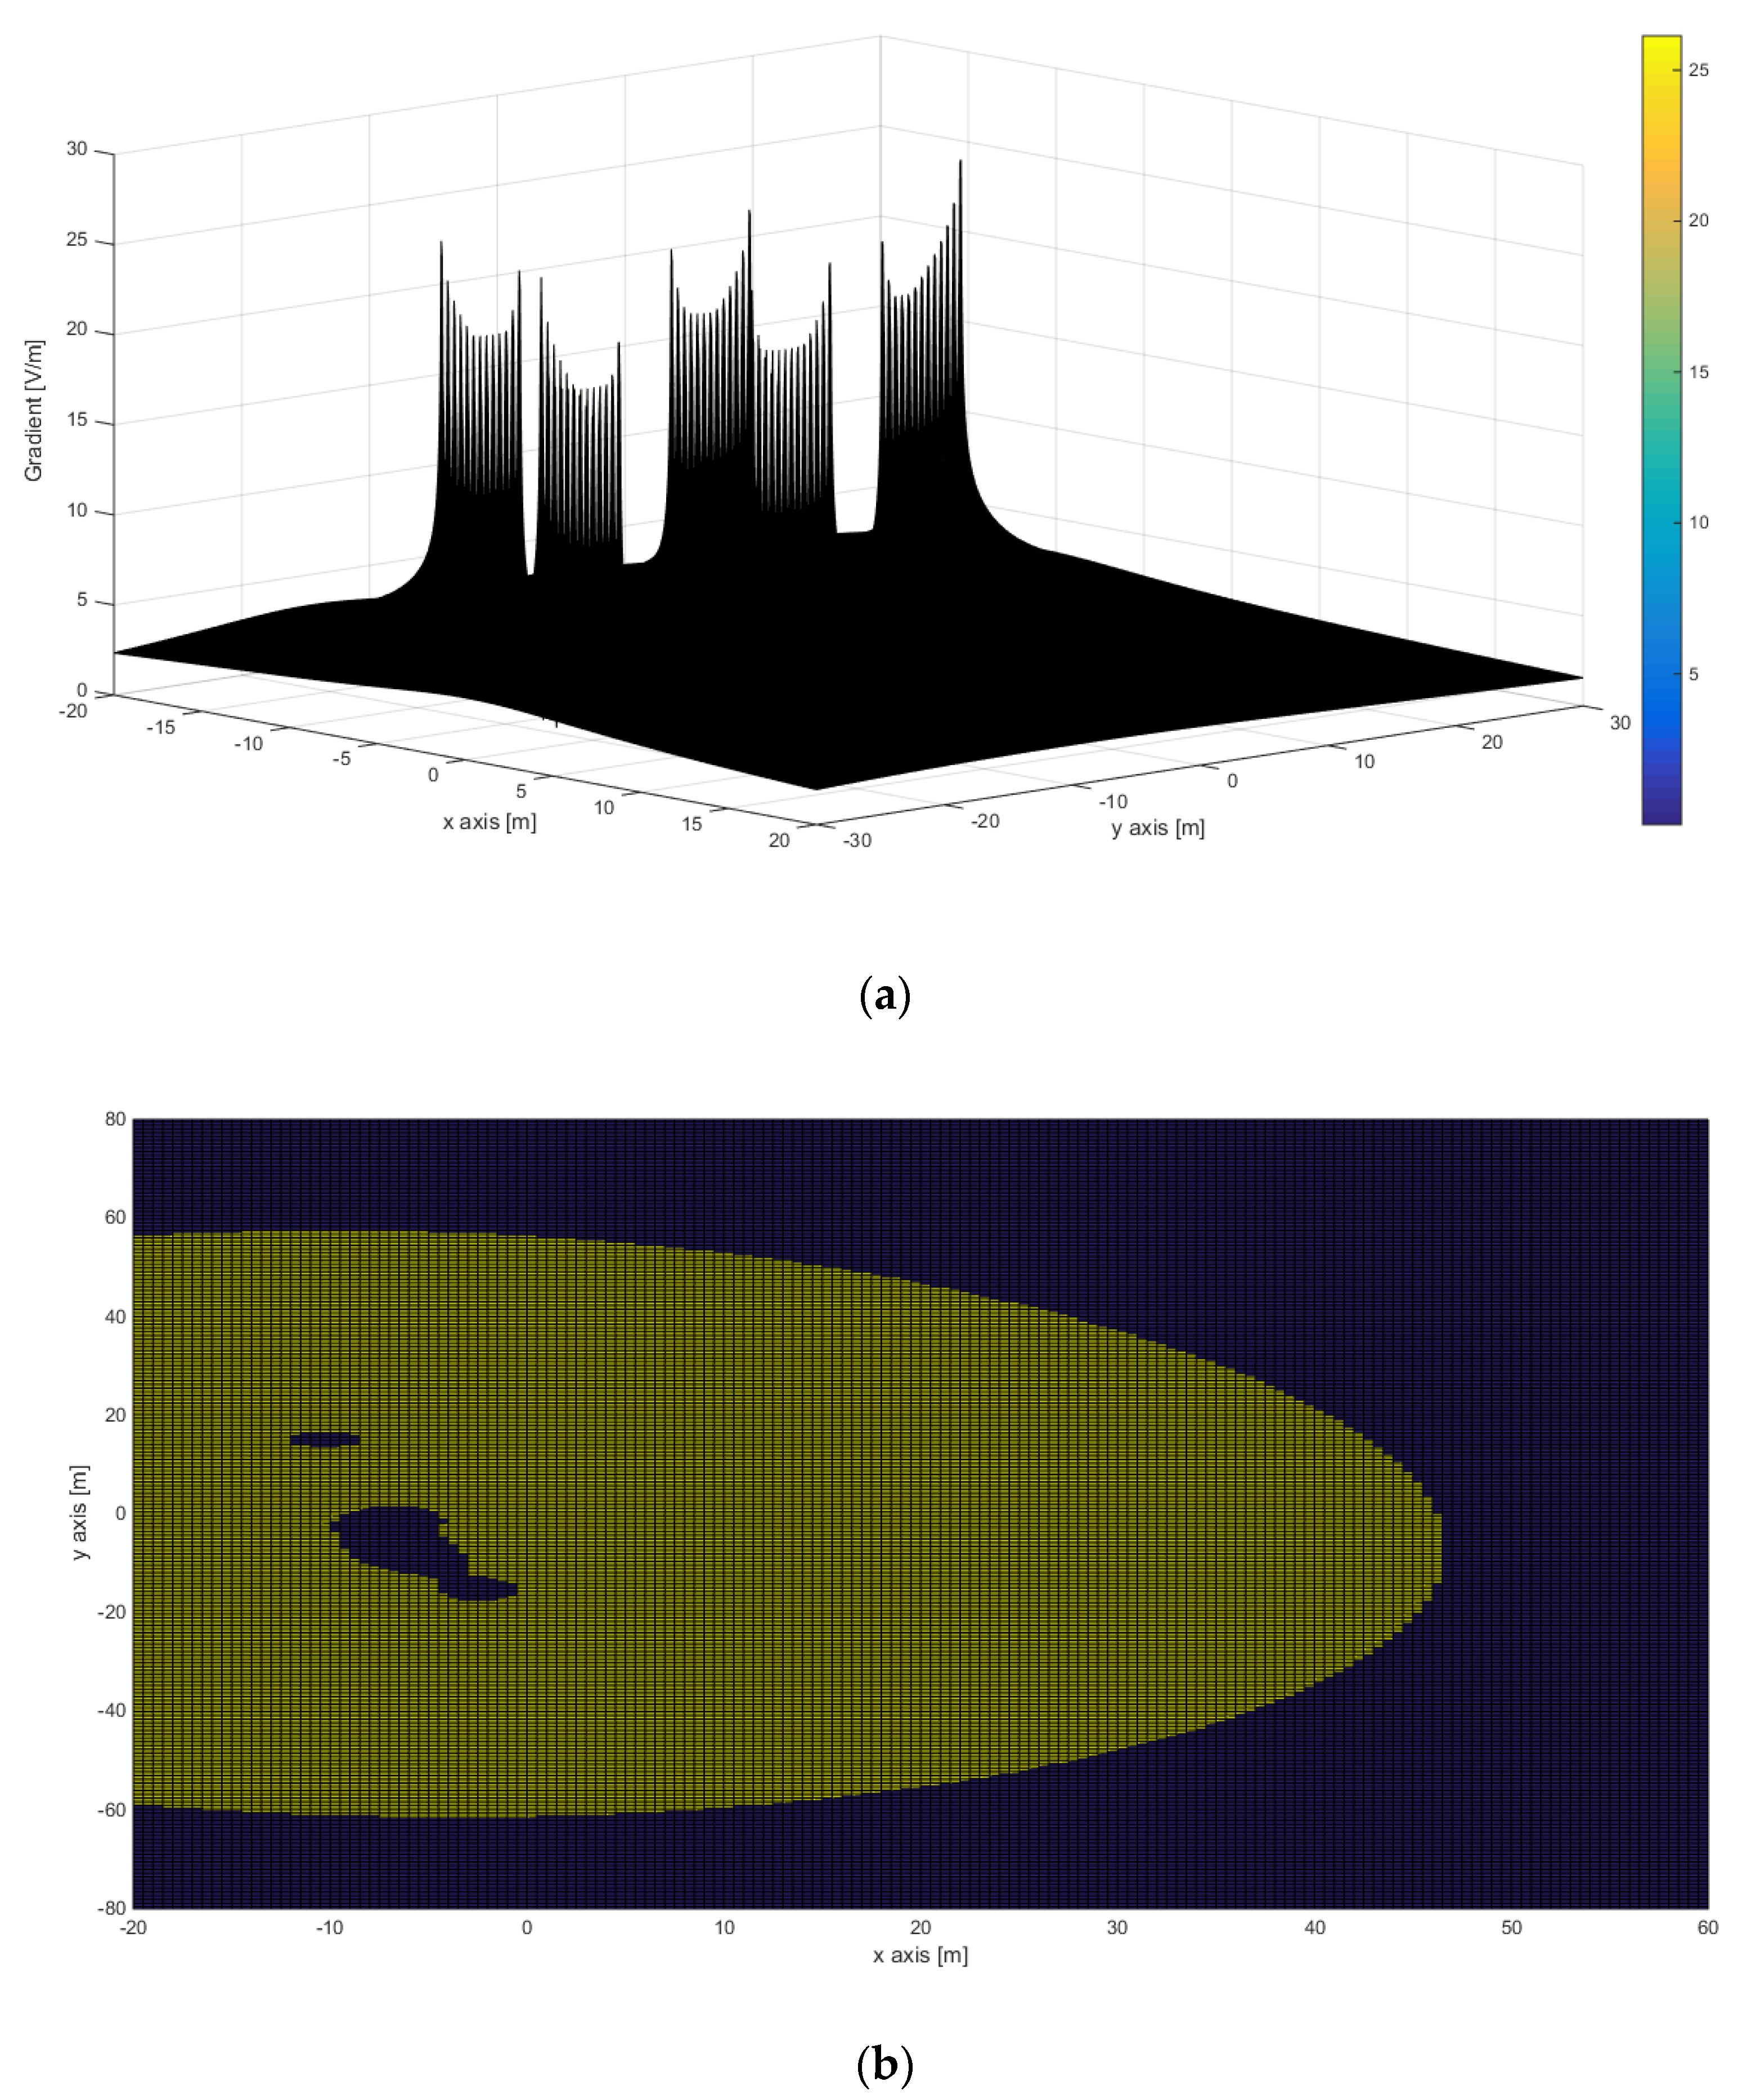
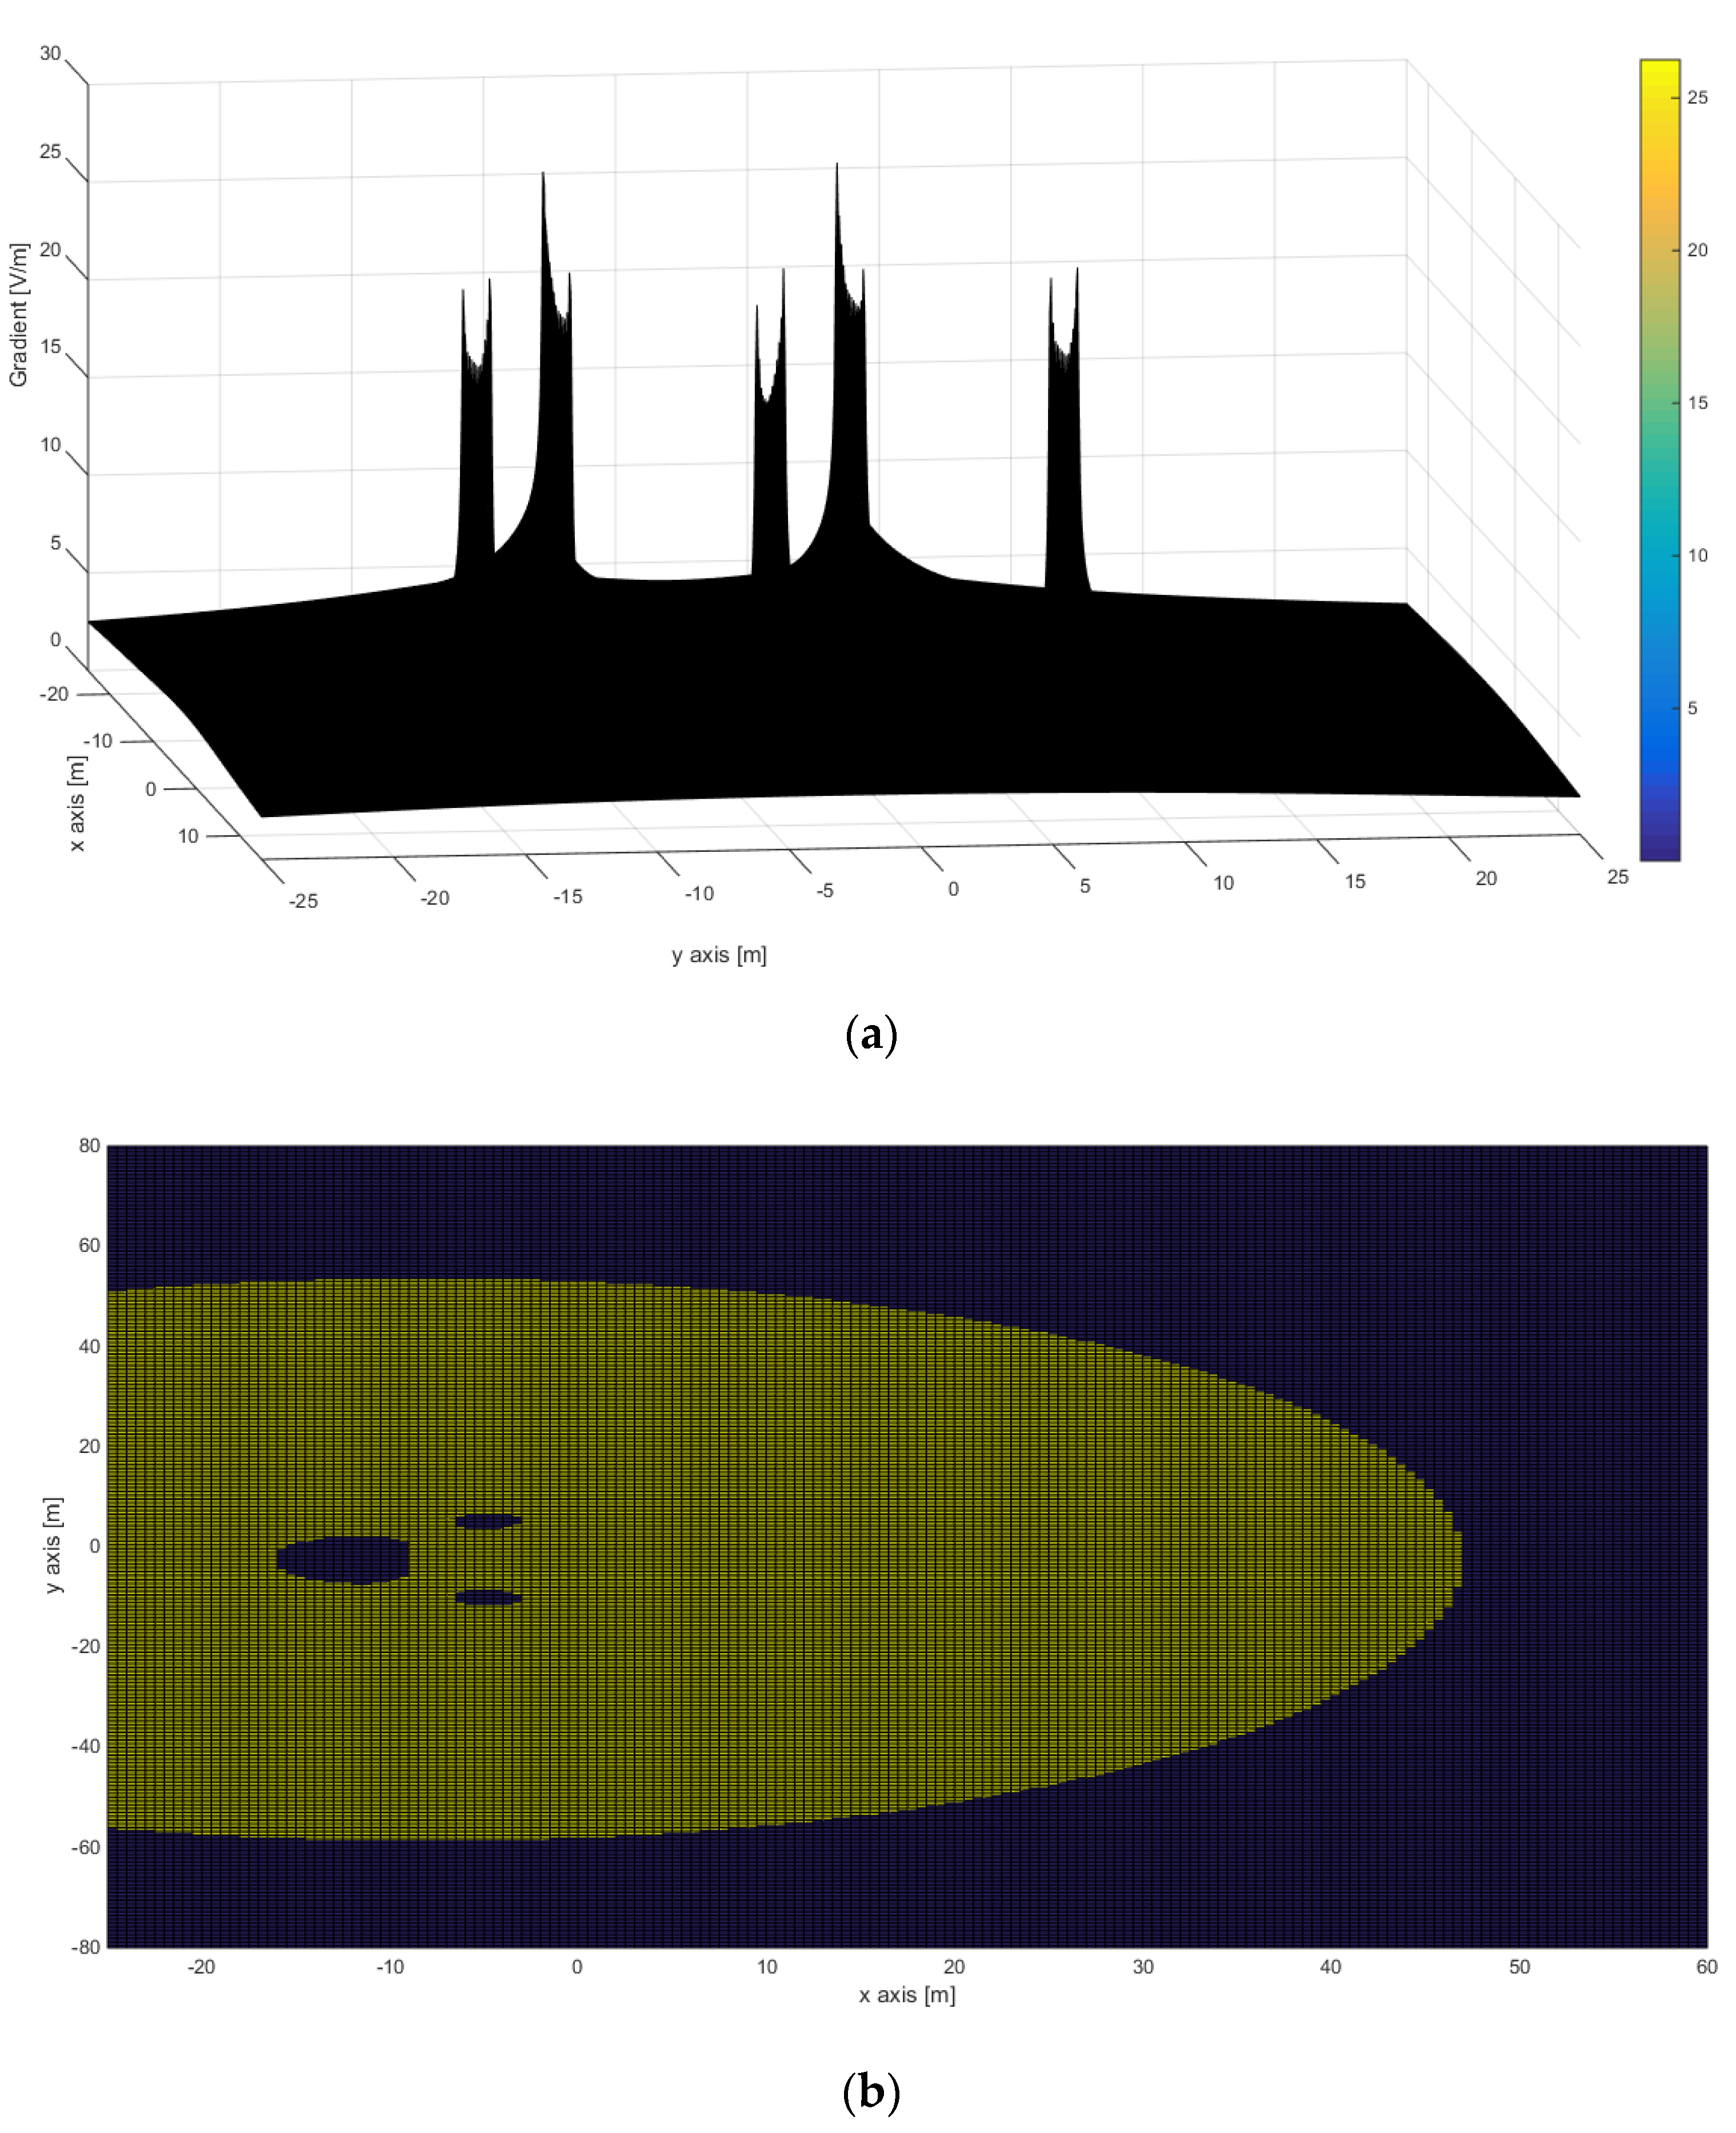
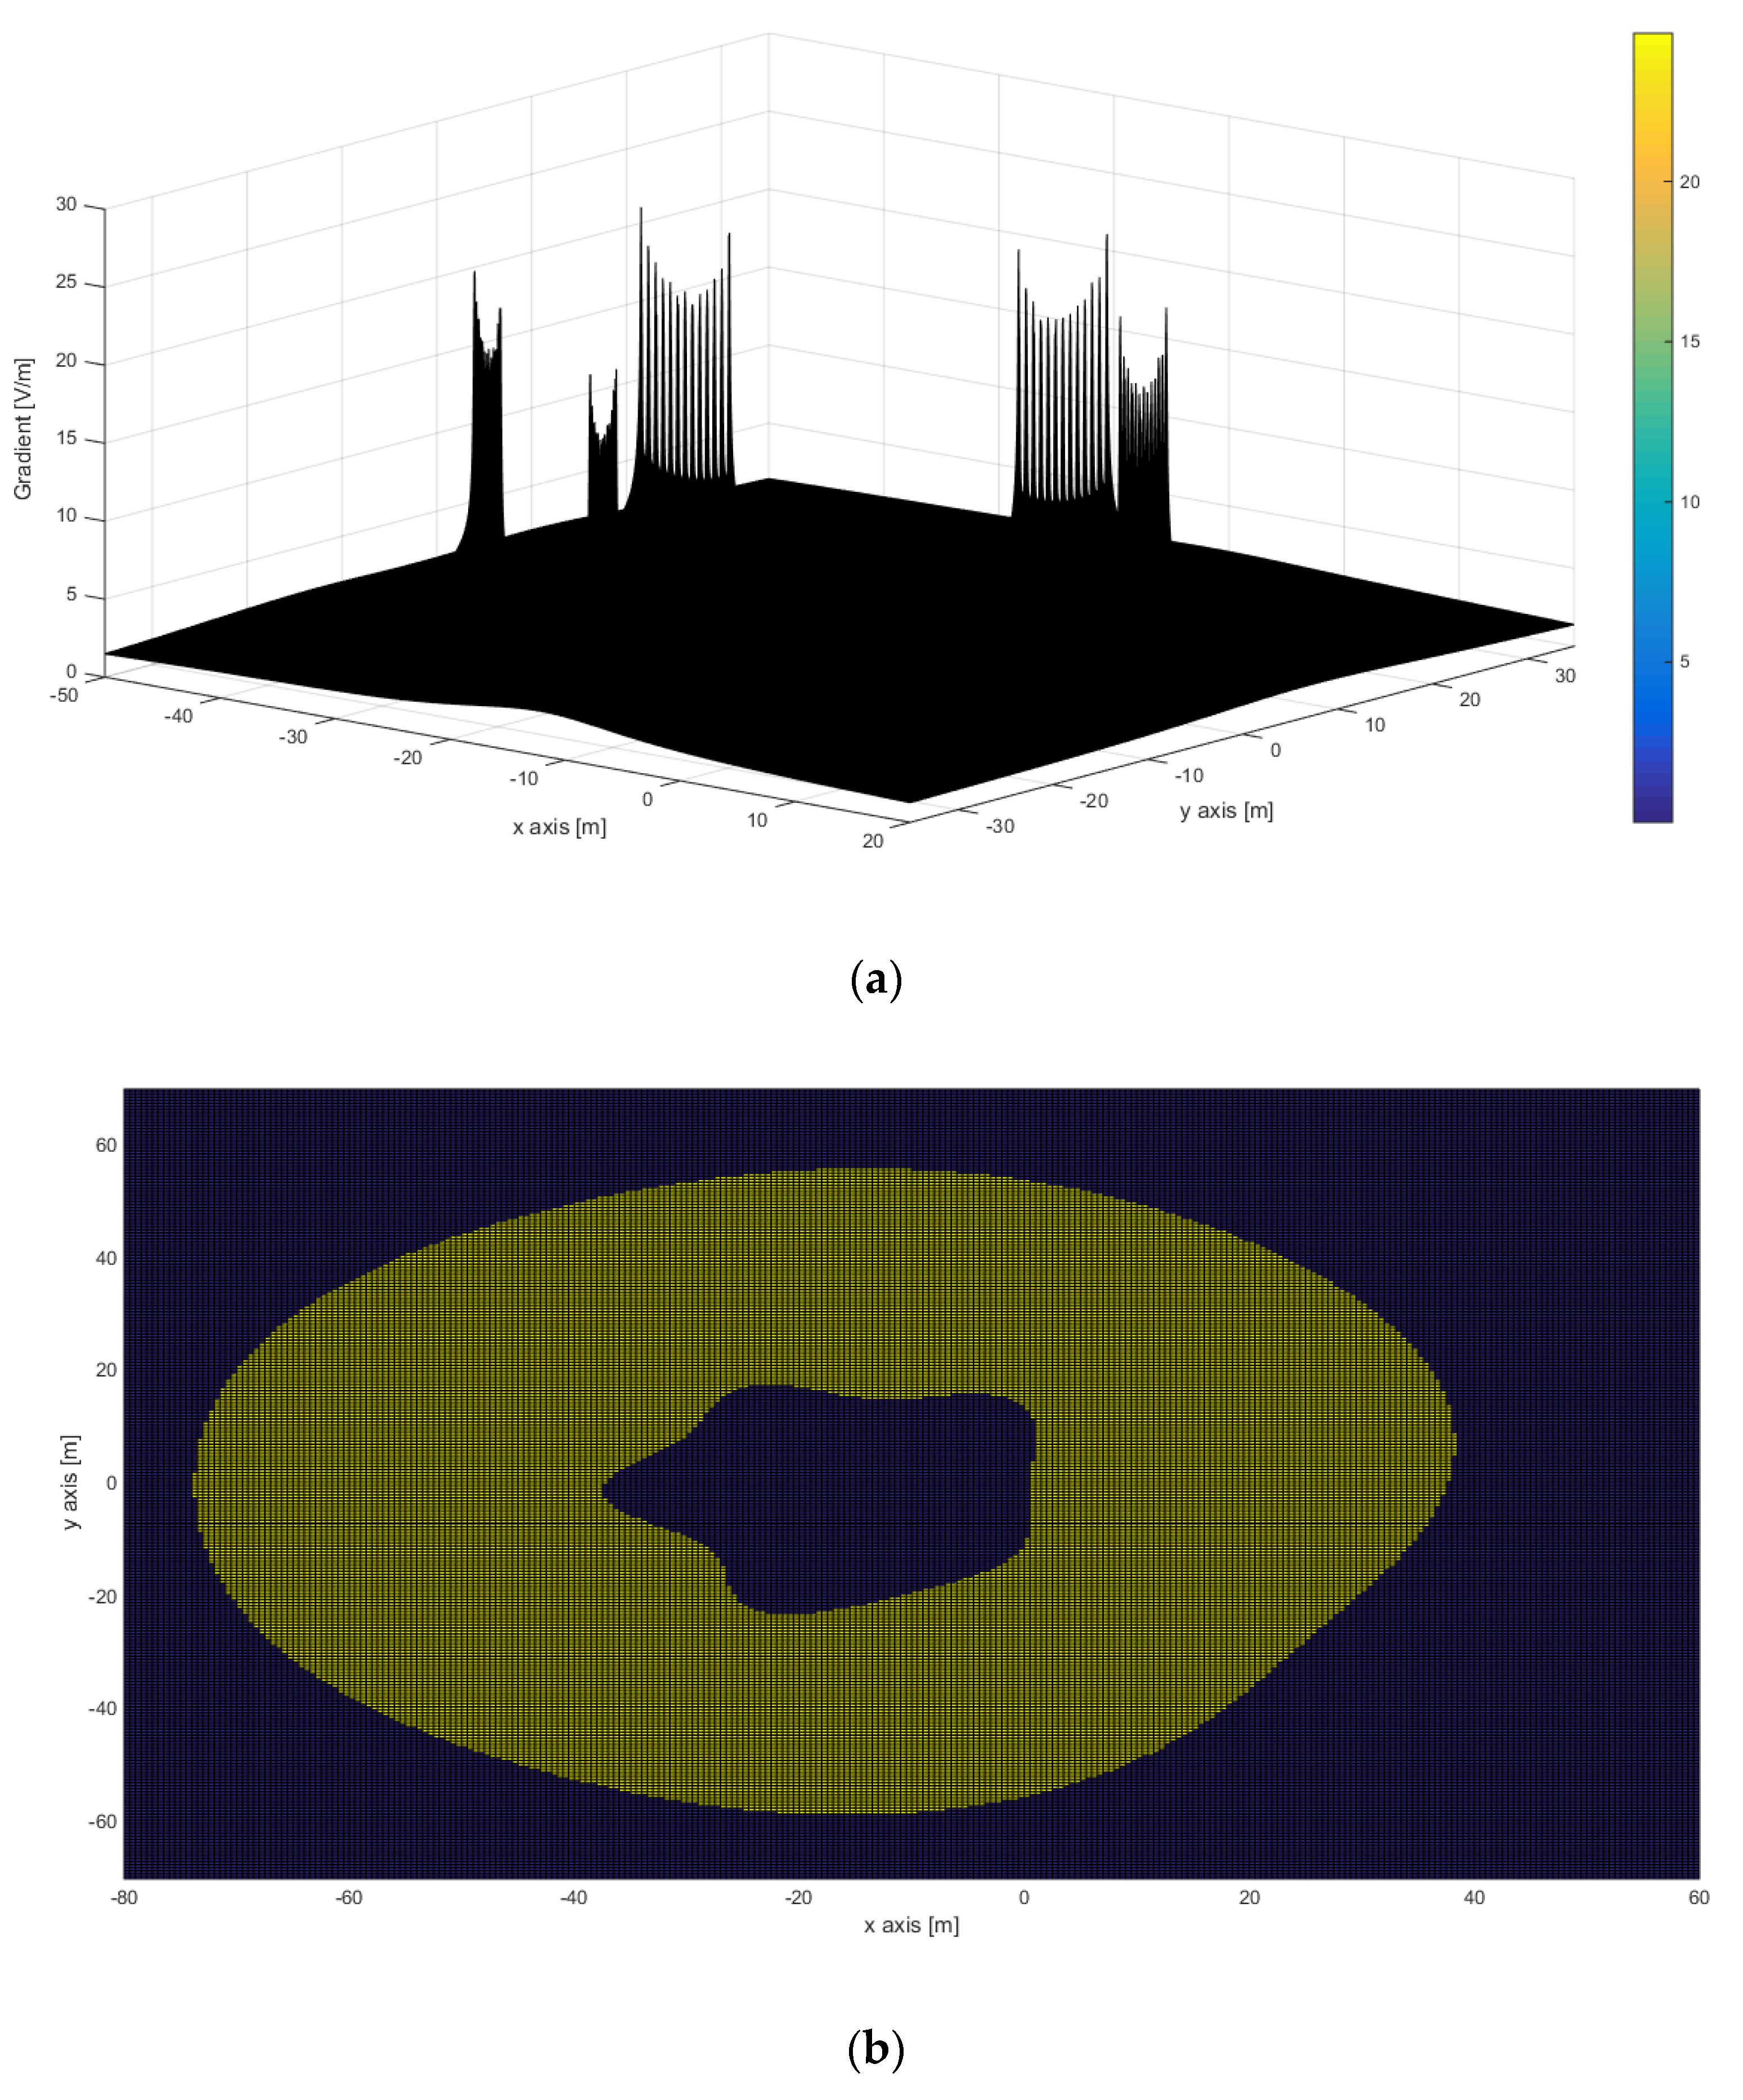
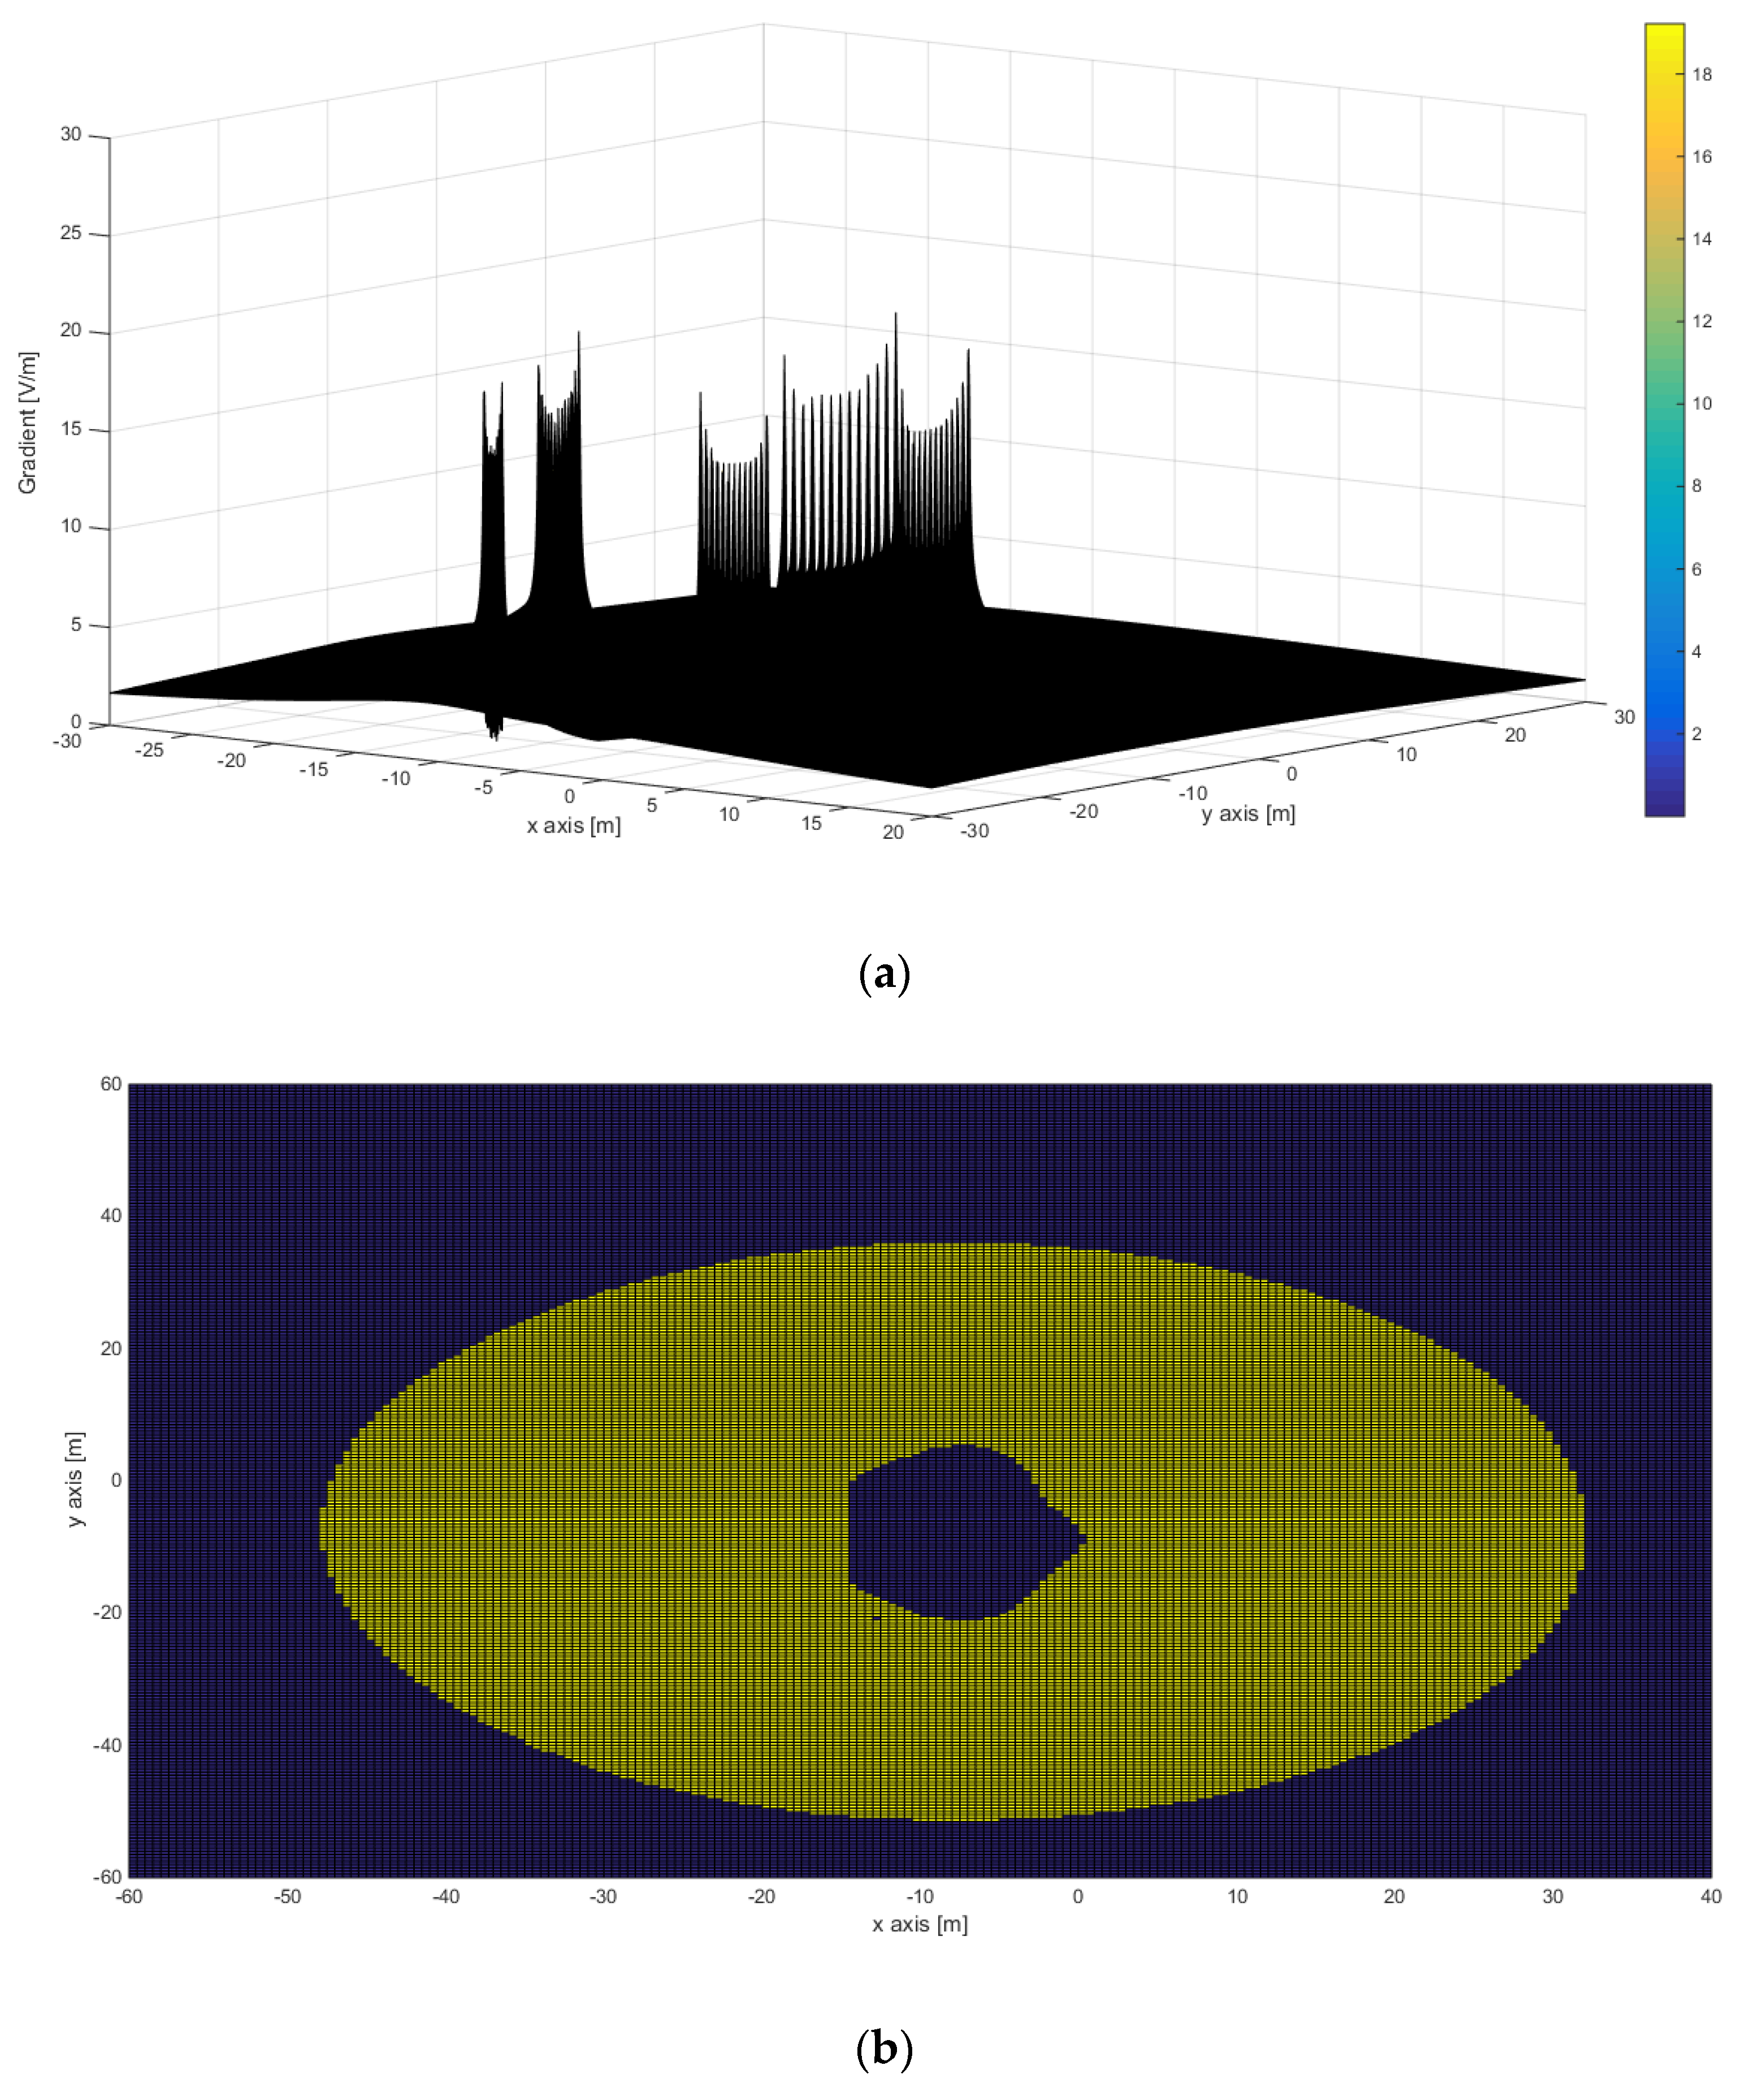
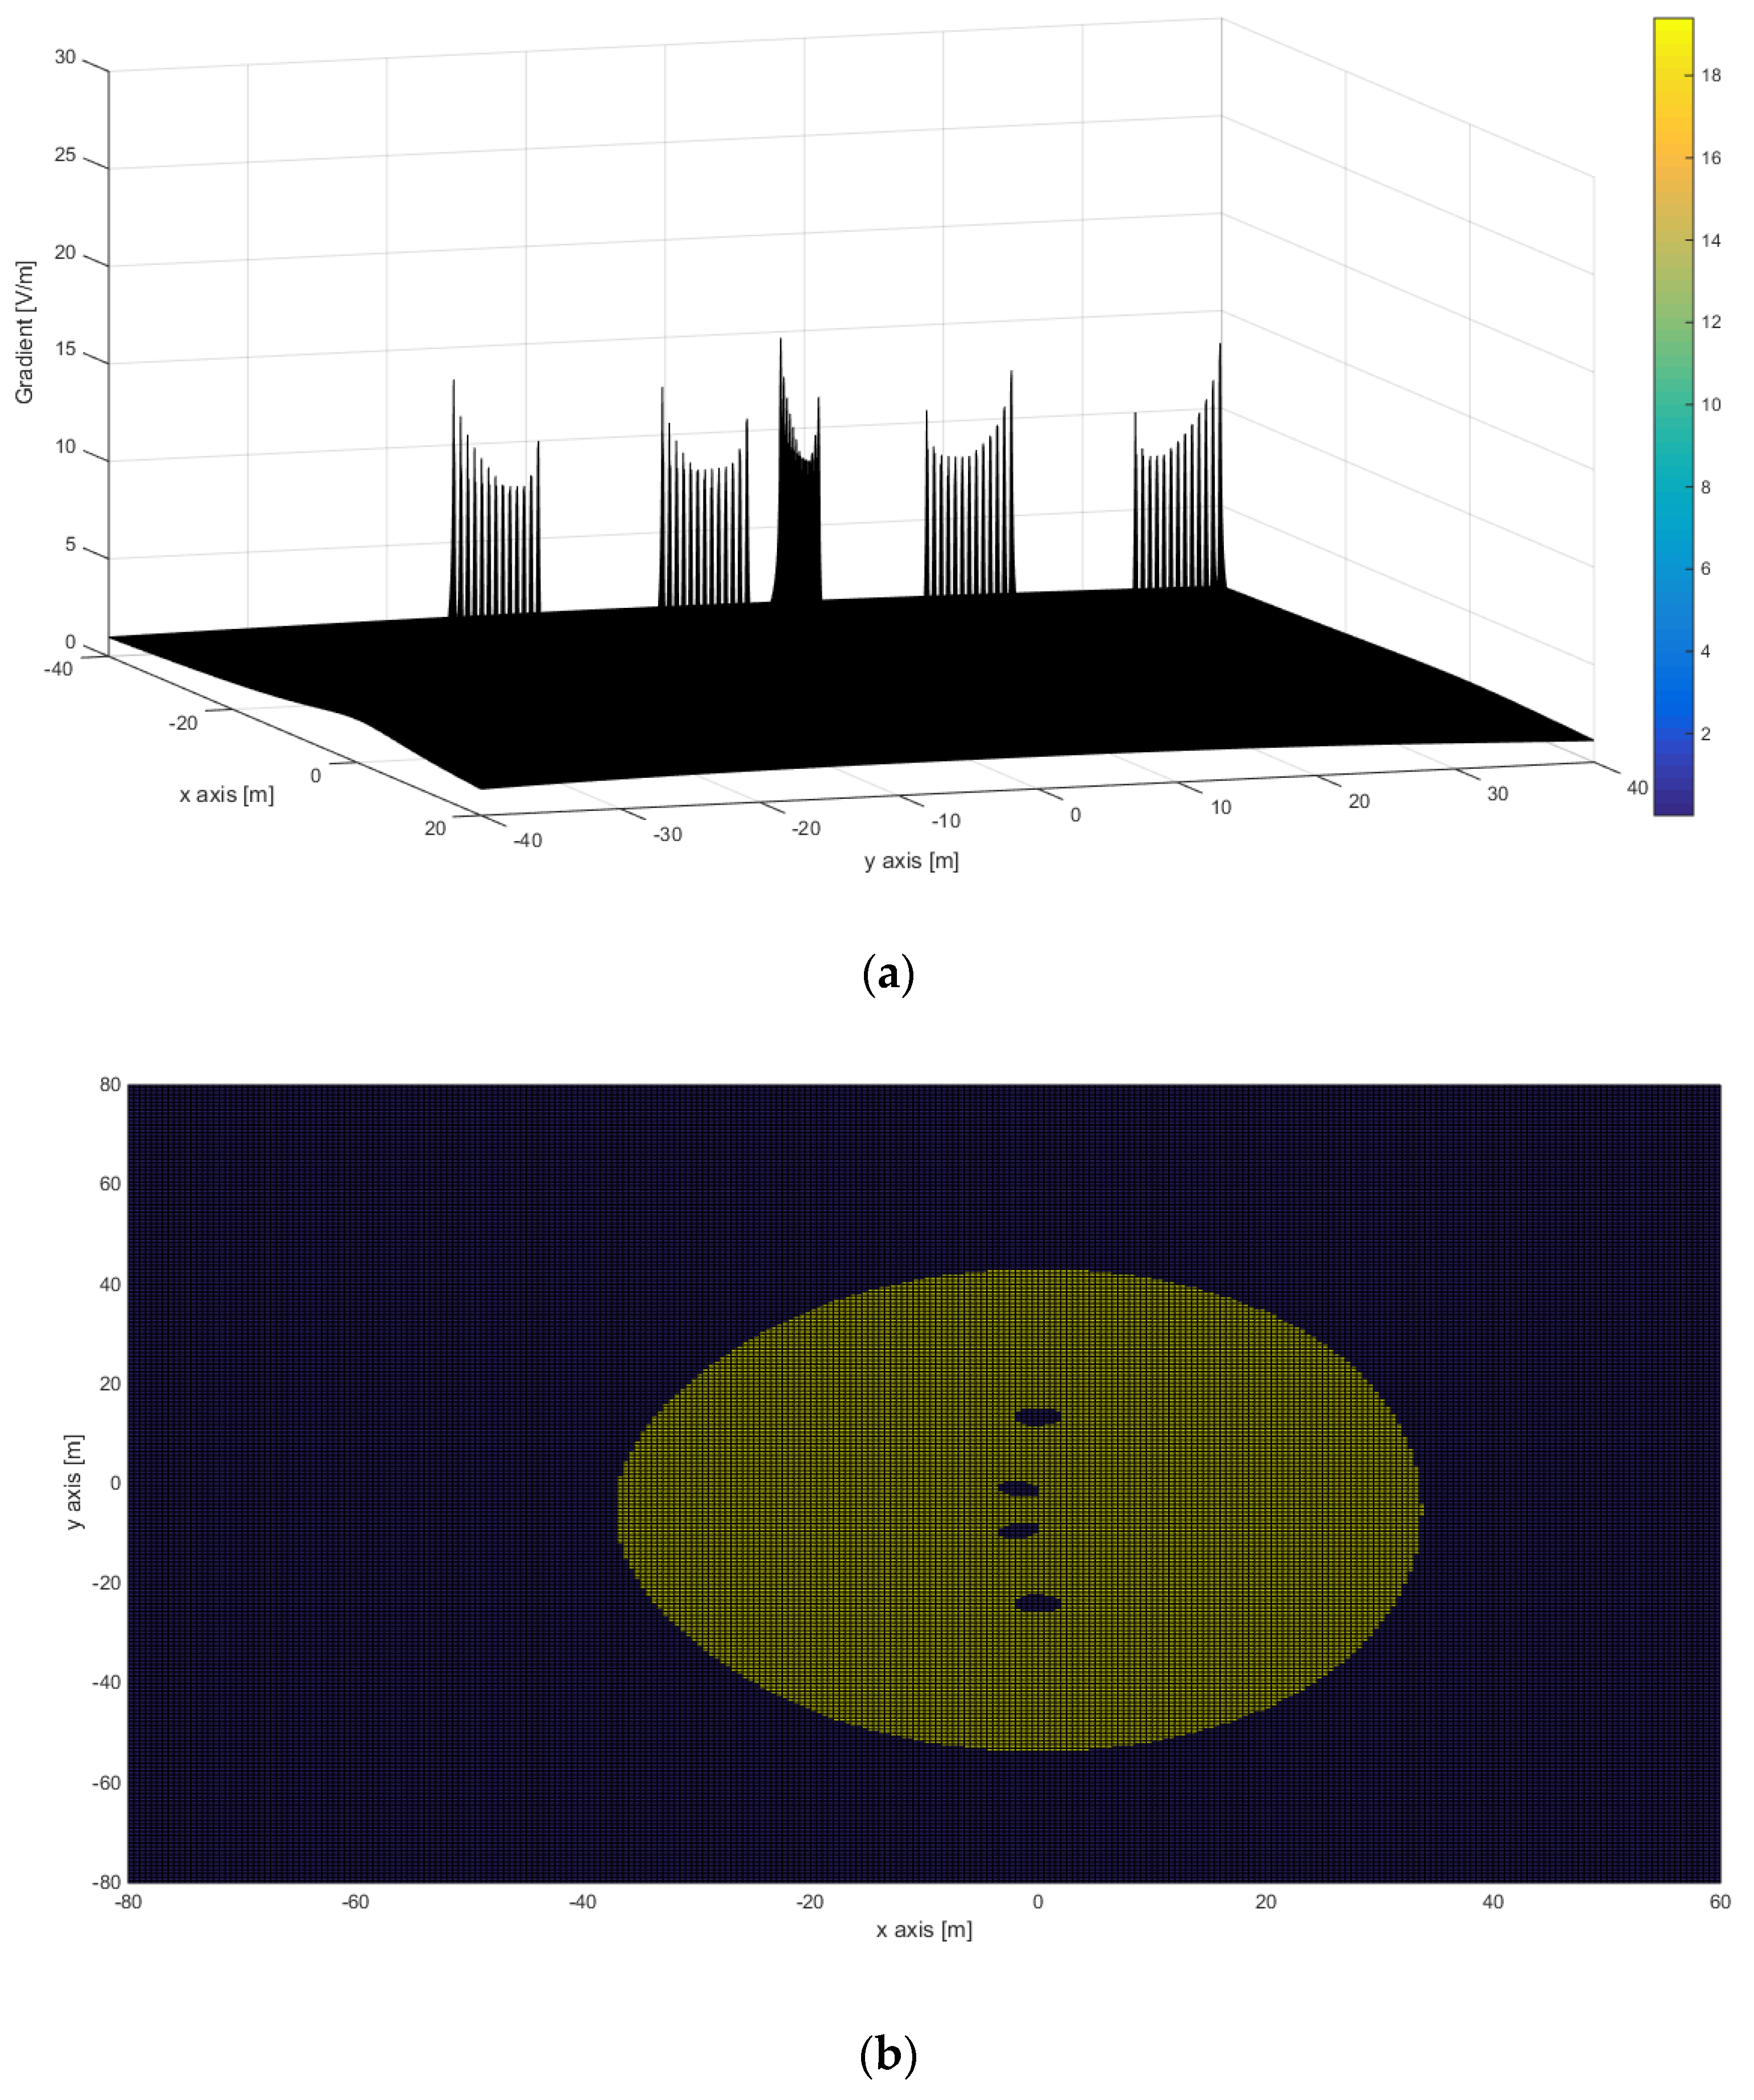
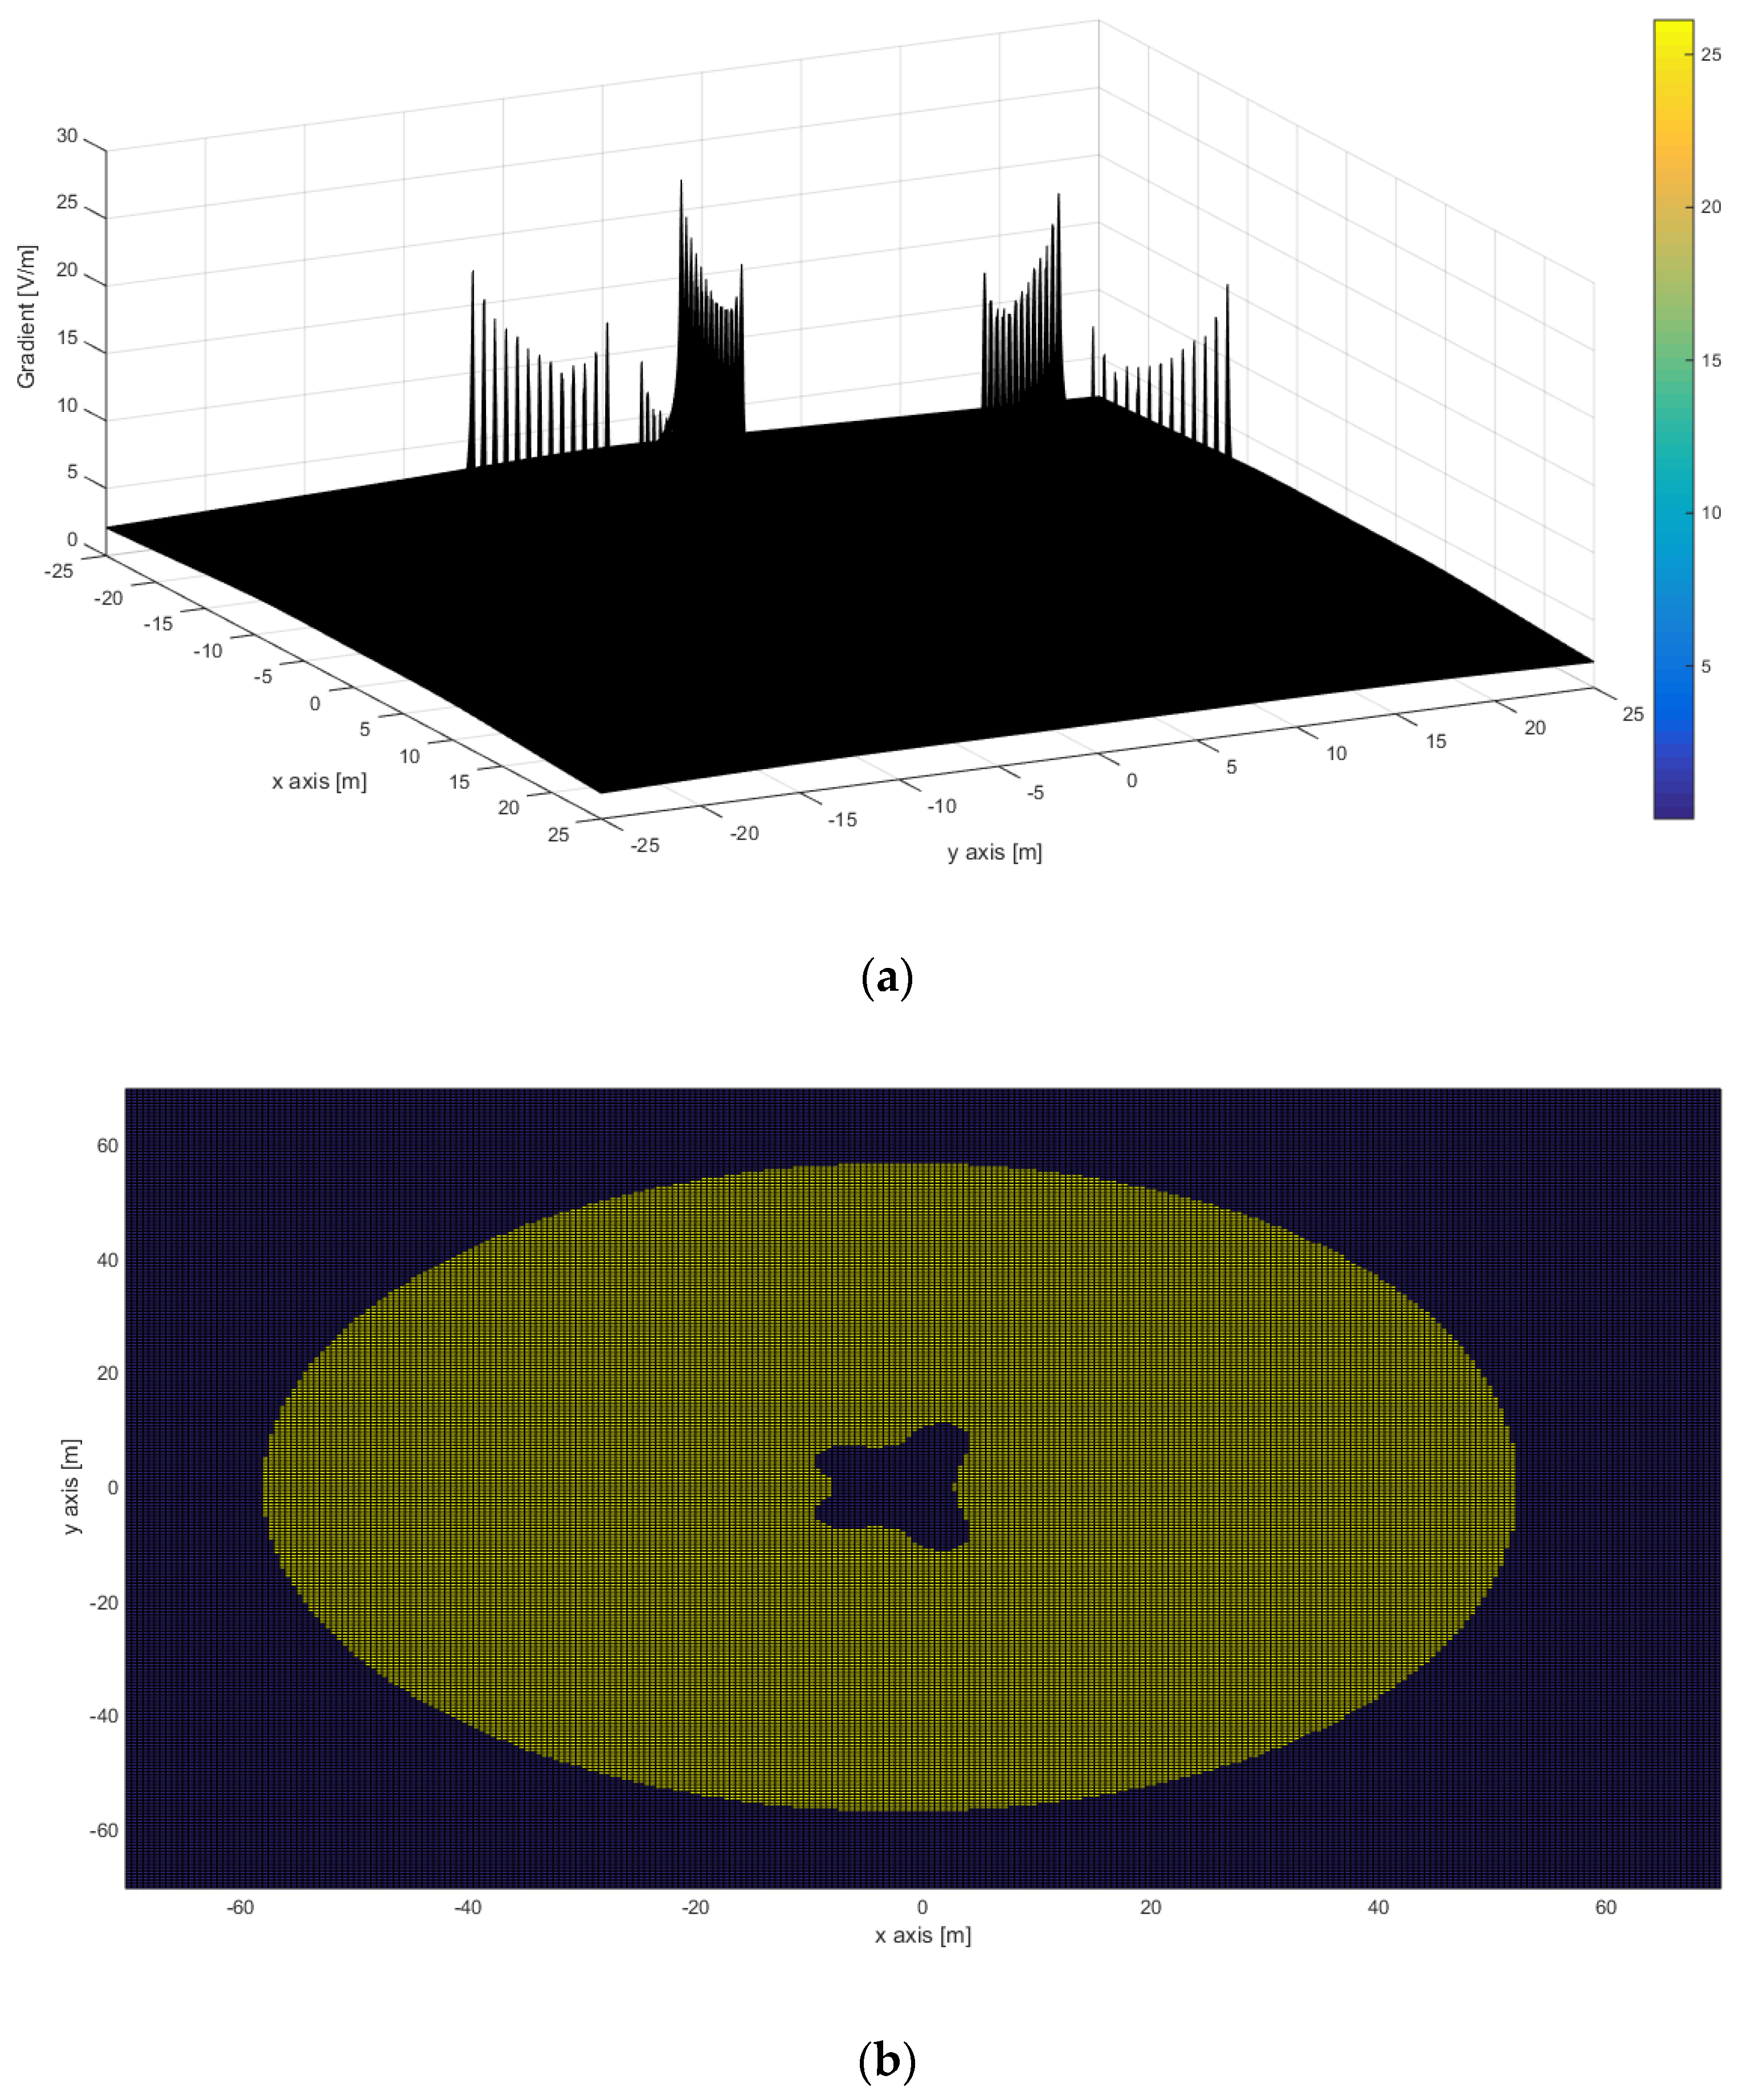
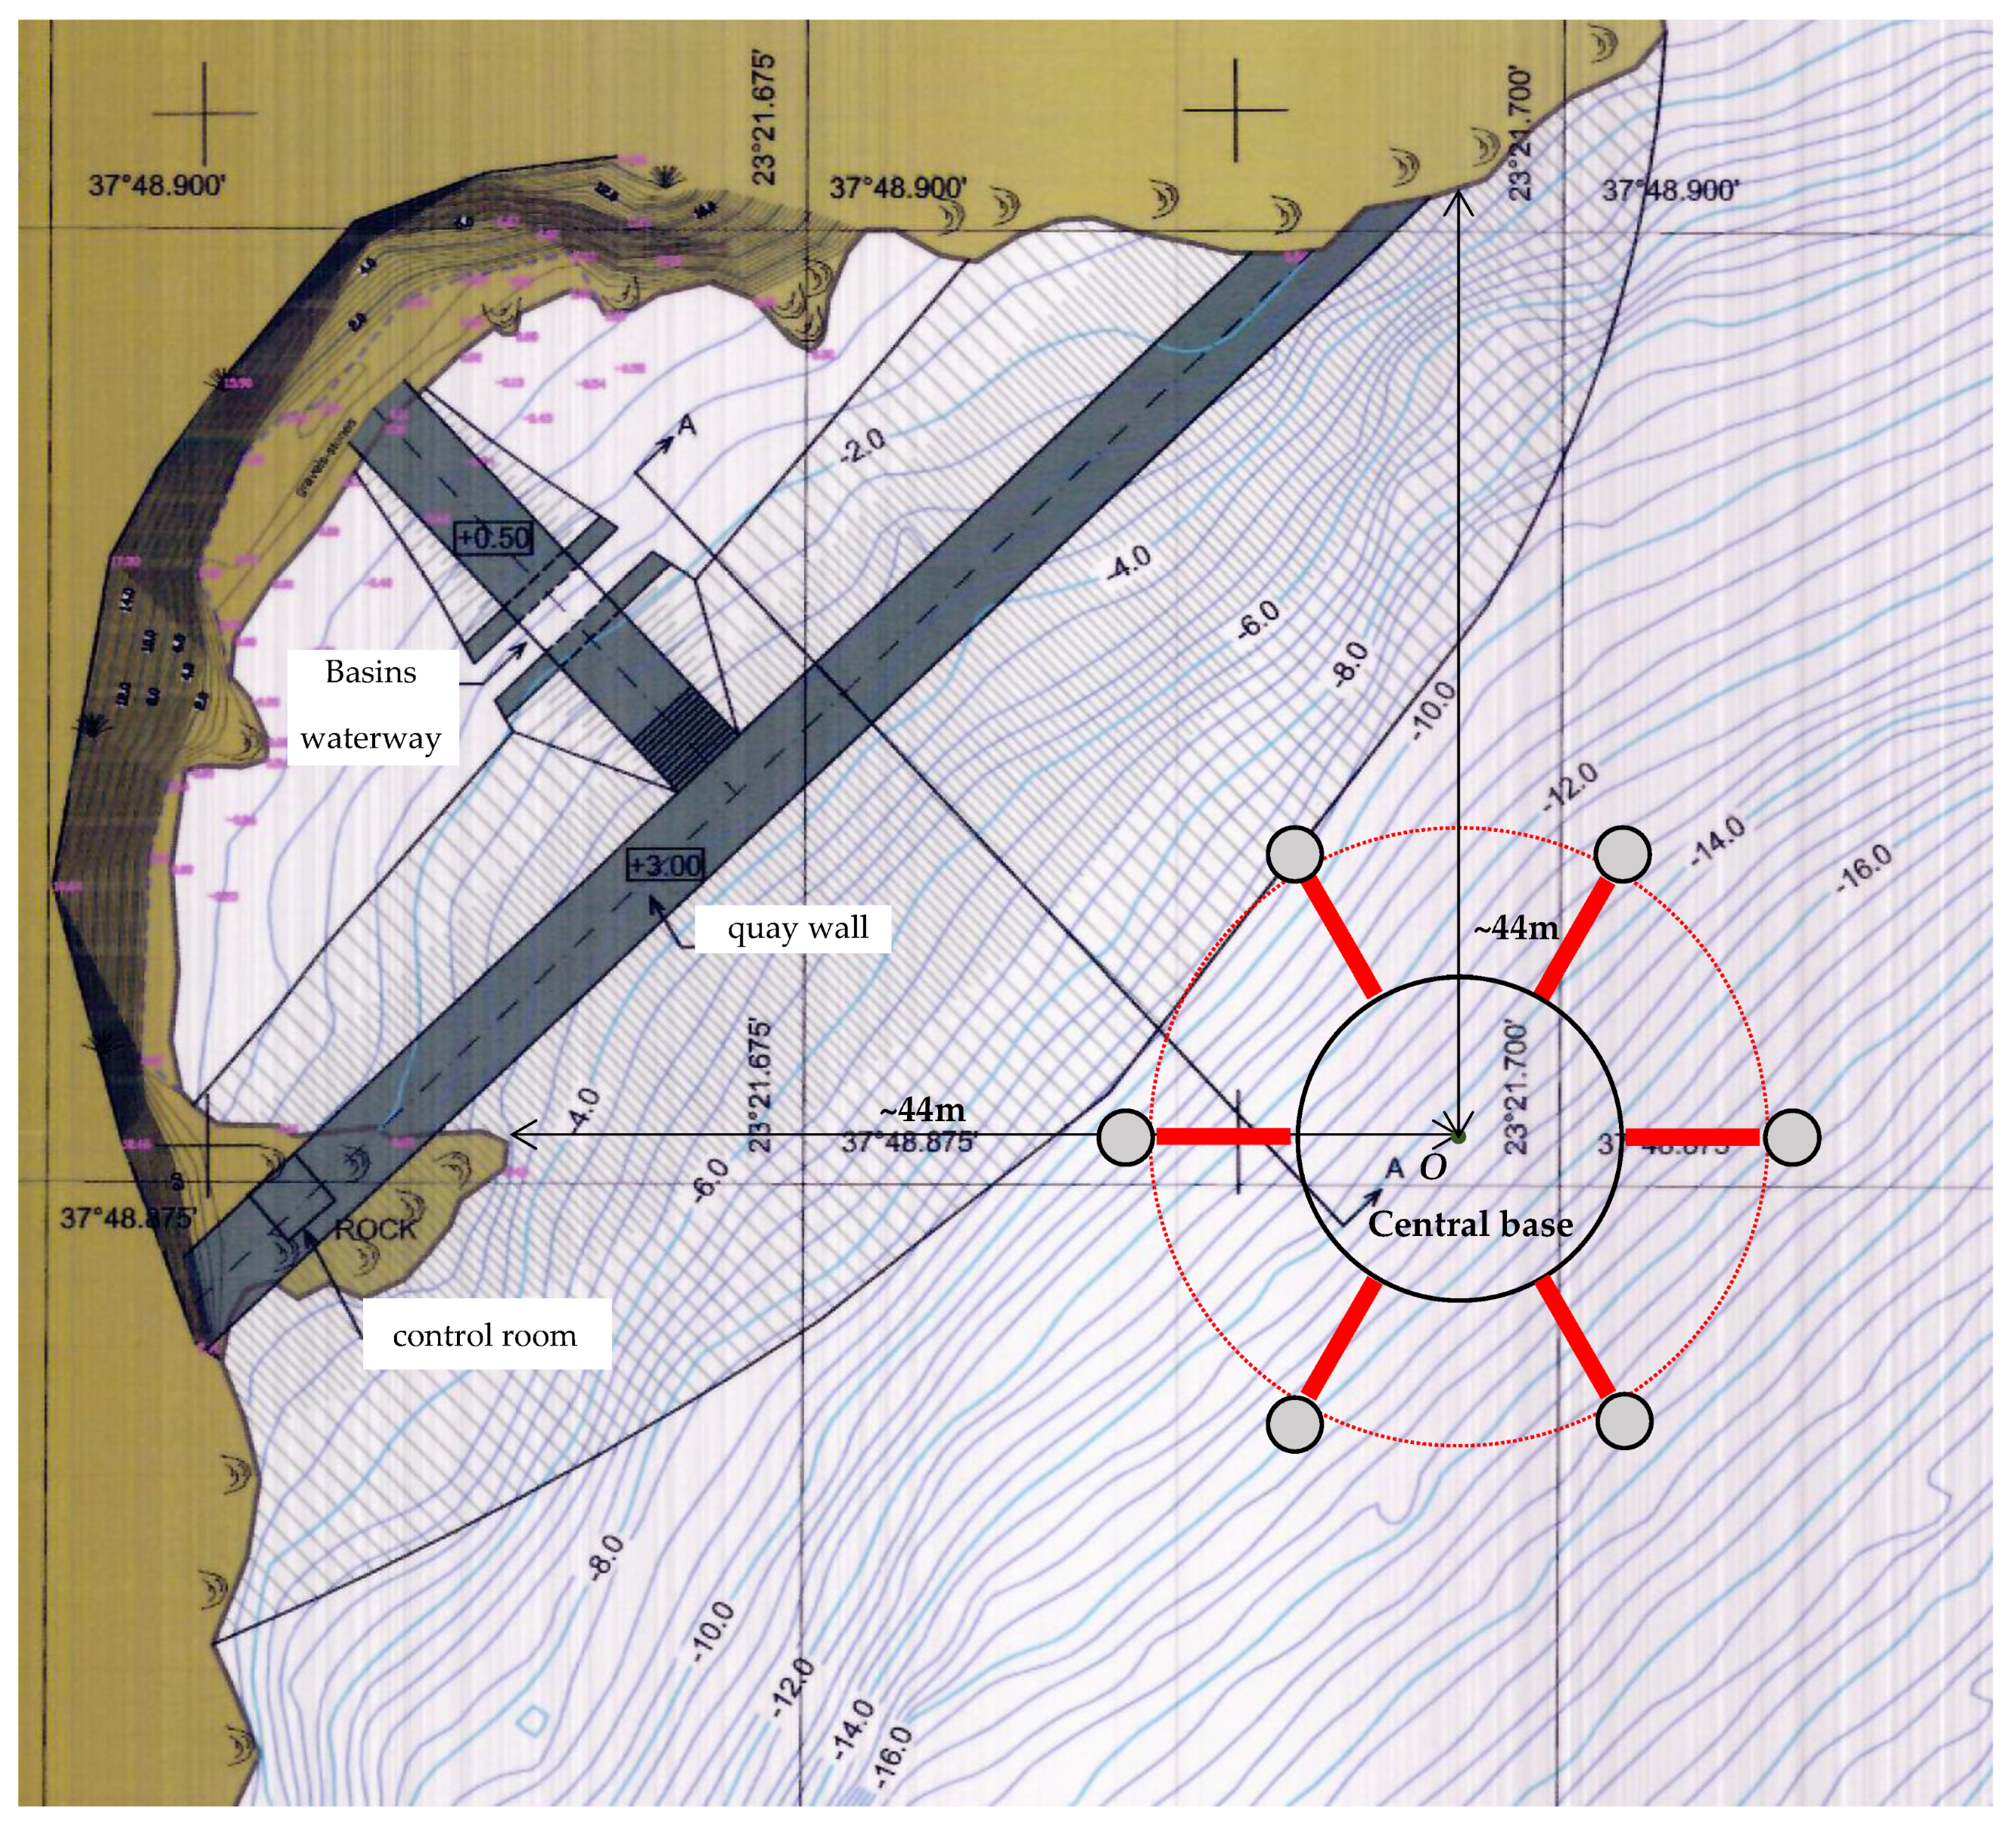
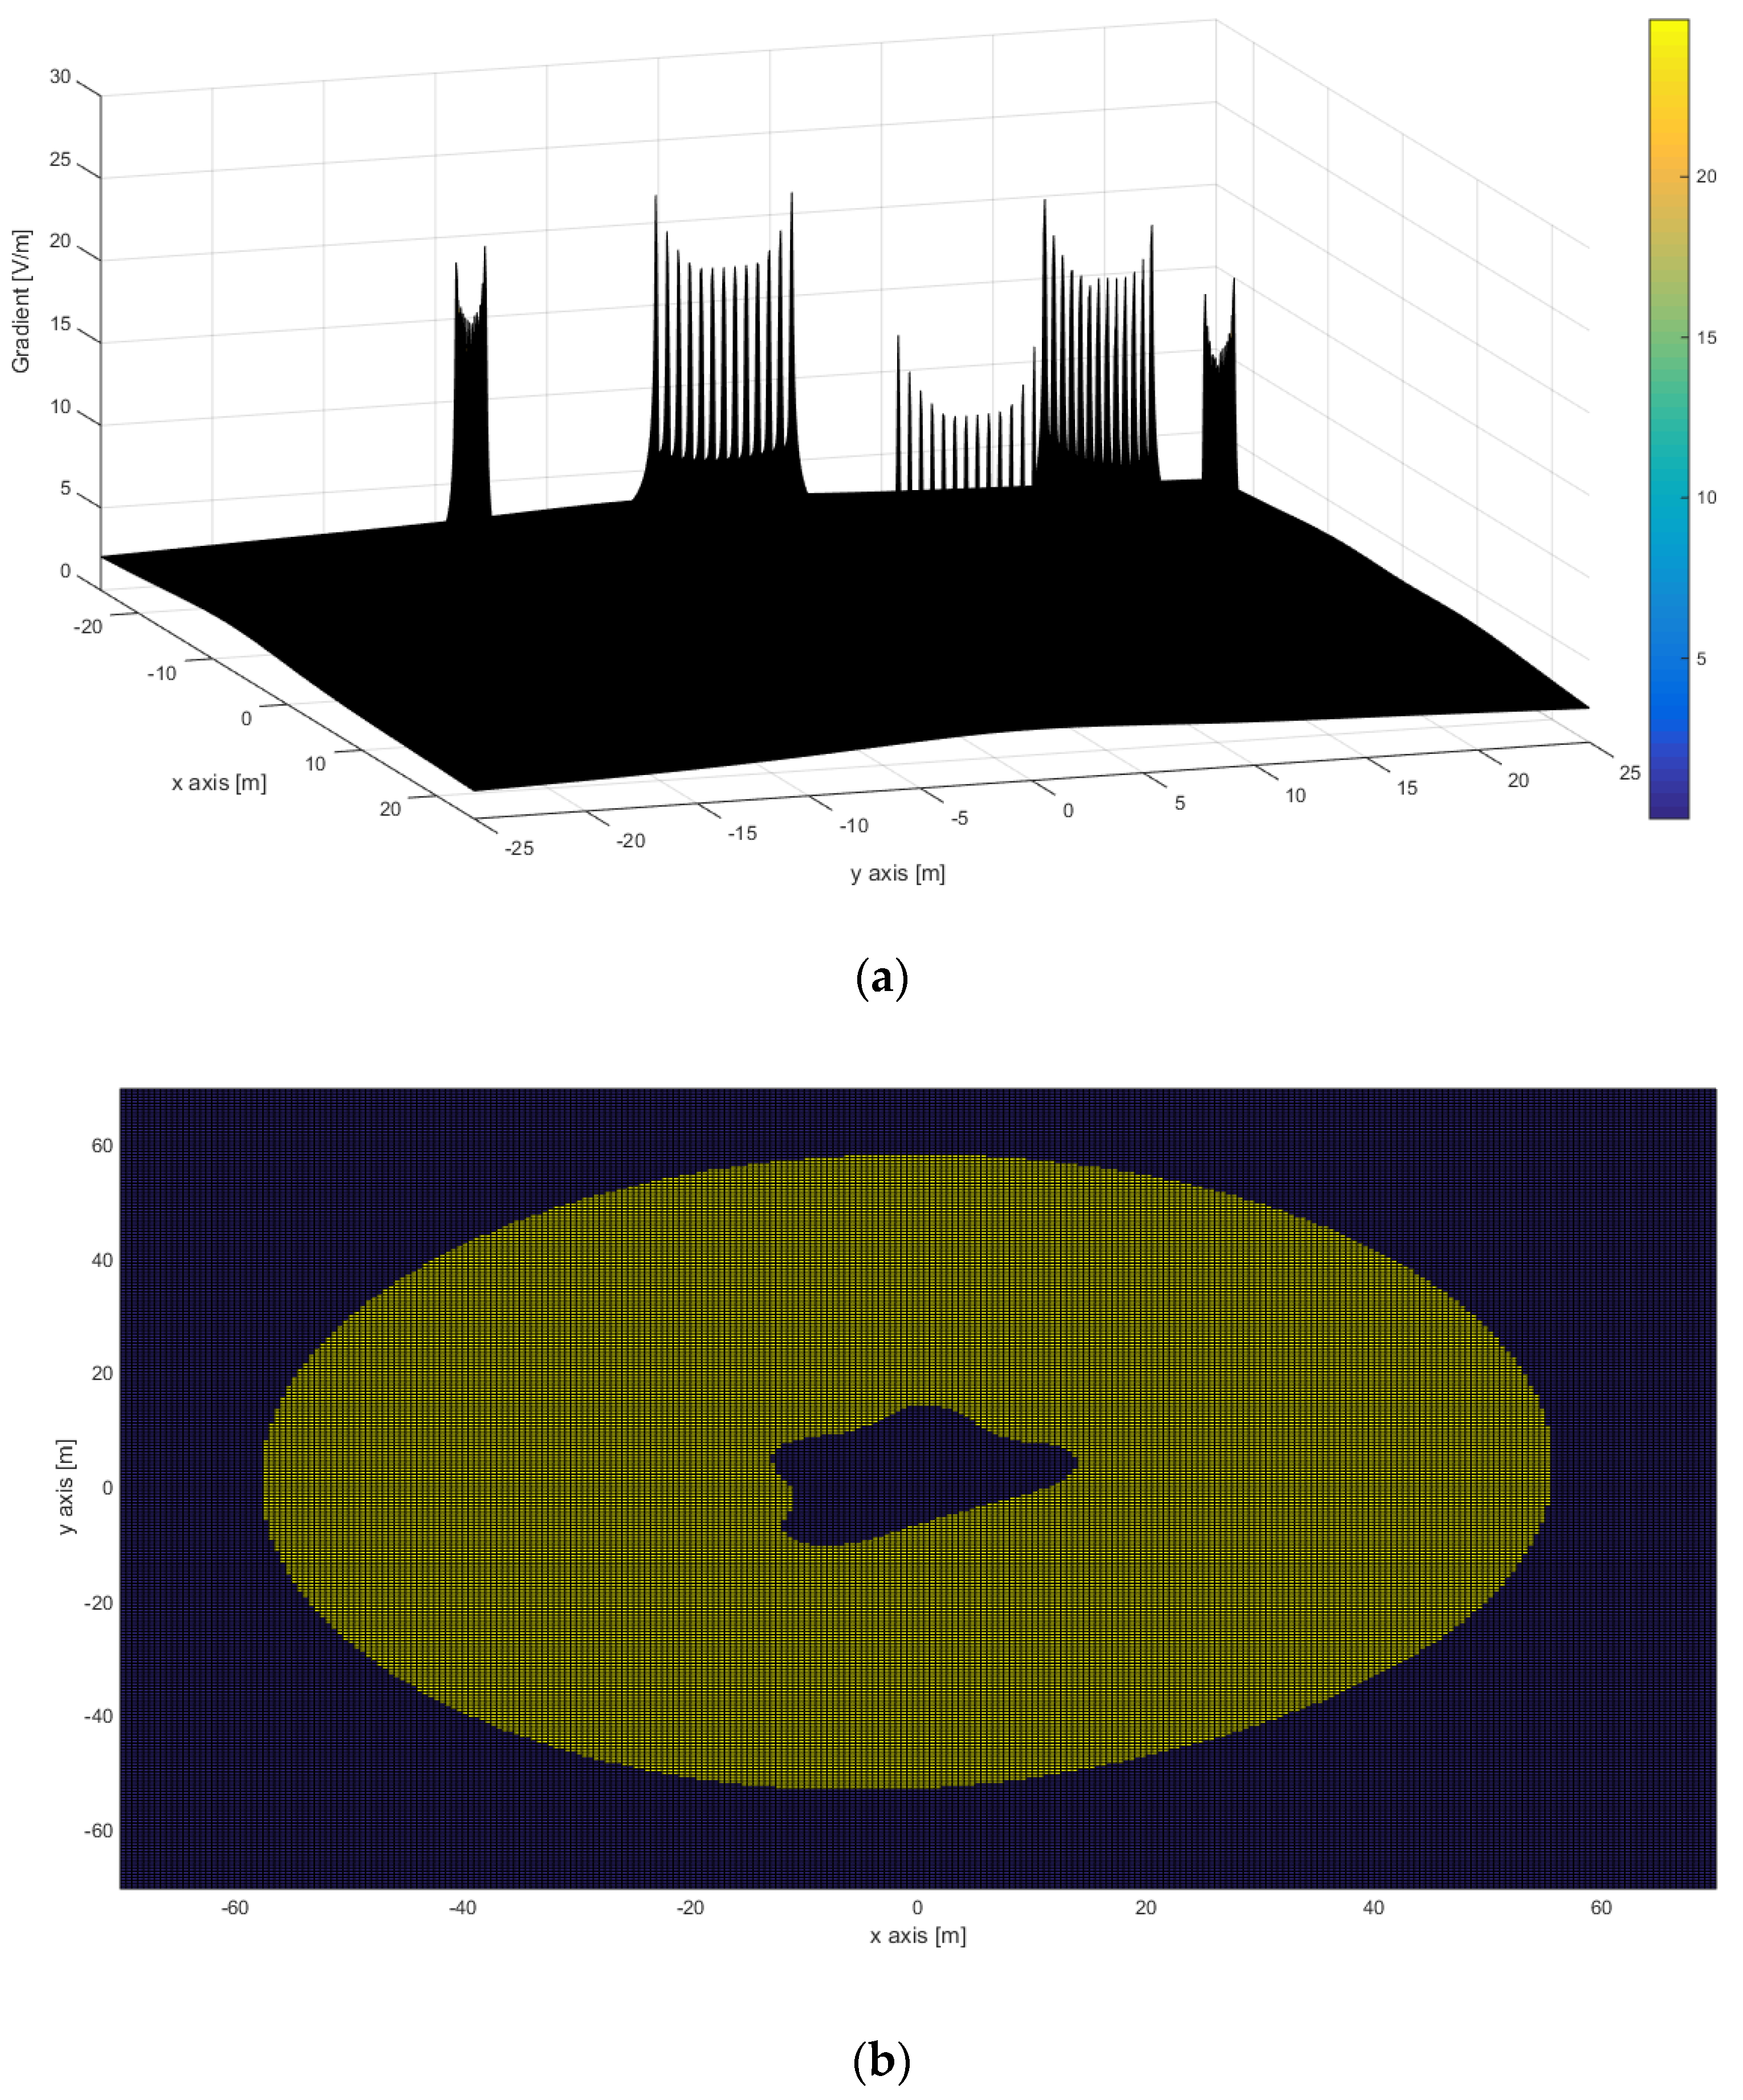
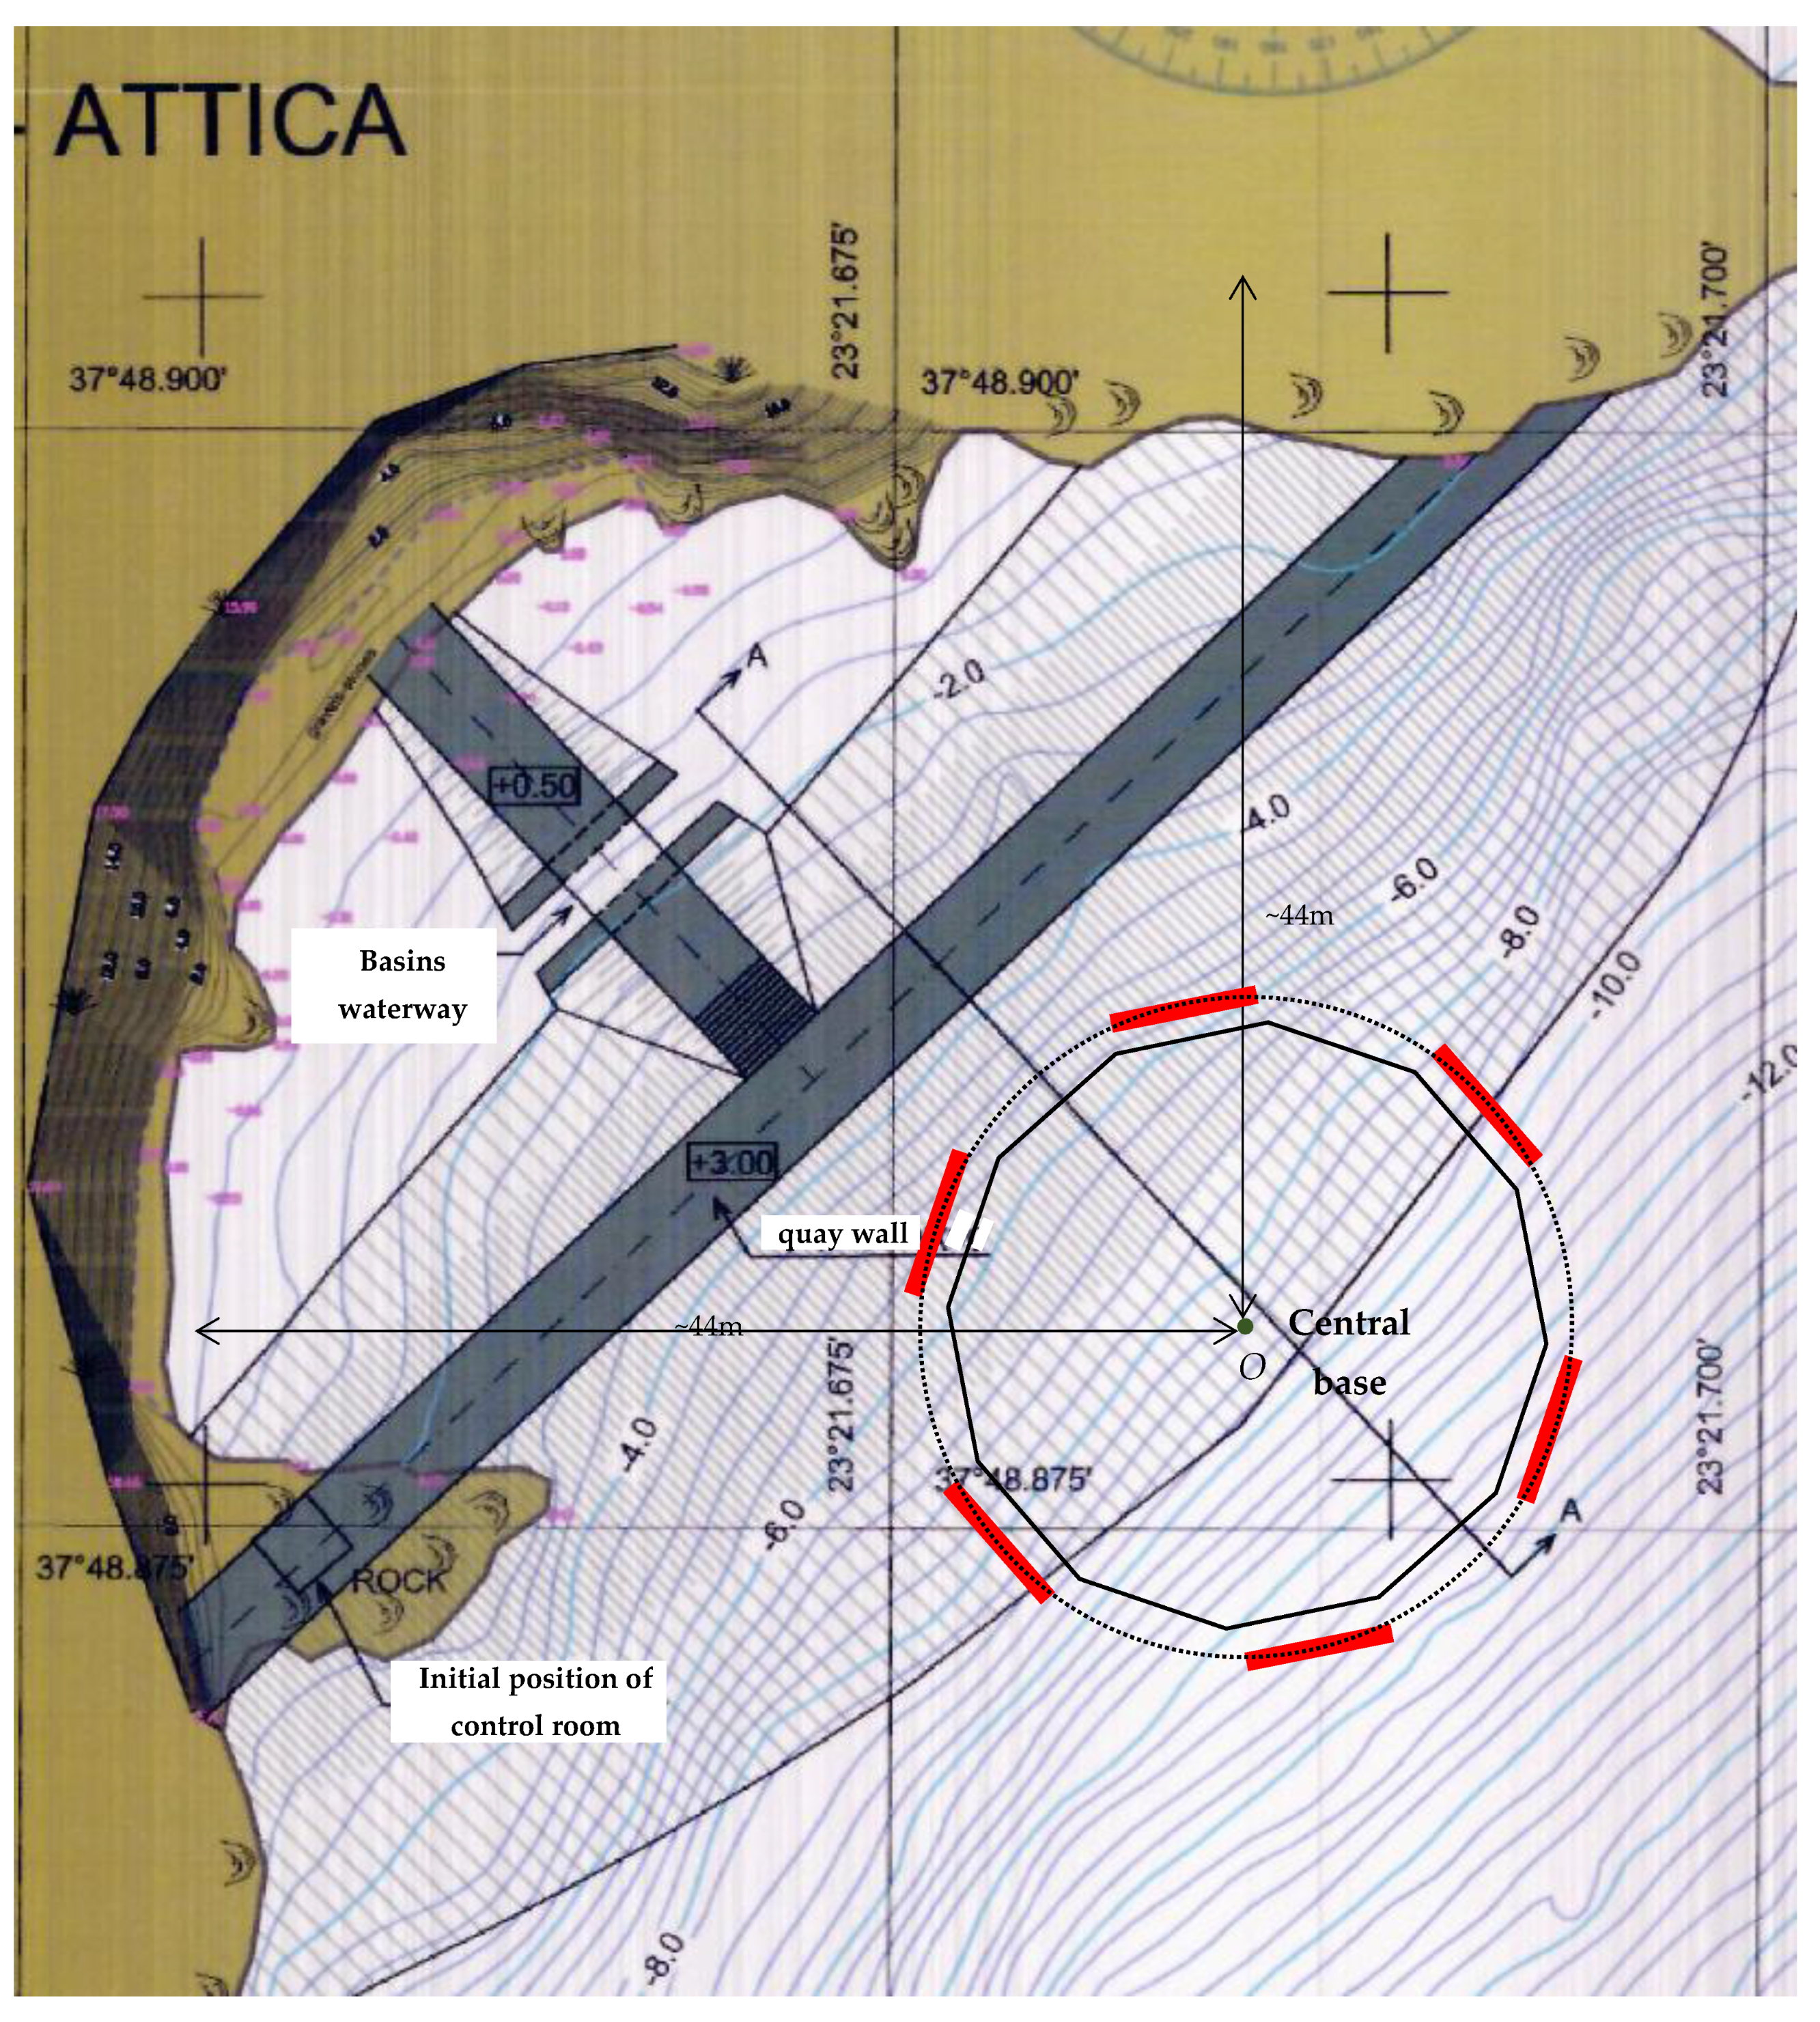
Figure 2. Simplified model regarding the positioning of an electrode on the shore or in near-shore sea, assuming a point electrode, in spherical coordinates and incorporating a dam–soil surface (based on model “B” and Figure 5, as in [2]).
Applsci 13 07136 g002
Figure 6. Second electrode station configuration—Plan view of six frames in series, each one placed vertically on the dam axis.
Applsci 13 07136 g006
Figure 7. Third electrode station configuration—Plan view of six frames in two files of three, each one parallel to the axis of the dam and aligned with each other.
Applsci 13 07136 g007
Figure 8. Fourth electrode station configuration—Plan view of six frames in two rows, each one parallel to the axis of the dam and not overlapping, with respect to the vertical axis of the dam.
Applsci 13 07136 g008
Figure 9. Fifth electrode station configuration—Plan view of six frames in two rows, with each frame vertical on the axis of the dam and aligned with each other.
Applsci 13 07136 g009
Figure 10. Sixth electrode station configuration—Plan view of six frames in two rows, with each frame vertical to the axis of the dam and not overlapping, with respect to the vertical dam axis, where each frame of one row has been placed in the middle of the gap between the frames of the other row.
Applsci 13 07136 g010
Figure 11. Korakia area of Crete—dotted green line marks electrode placement perimeter; solid burgundy marks dredging area; embankment area lies outside burgundy perimeter, up to the shoreline, to achieve a final height of 1.5 m.
Applsci 13 07136 g011
Figure 12. Stachtoroi area, Attica—dotted green line marks electrode placement perimeter; solid burgundy marks dredging area; embankment area lies outside solid brown perimeter, up to the shoreline, to achieve a final height of 1.5 m.
Applsci 13 07136 g012
Figure 13. Seventh electrode station configuration—Plan view of six straight frames placed around the perimeter of the pond under construction, in the area of Korakia, Crete, where (AB) = 66.0 m, (BC) = 13.5 m, (CD) = 15.0 m, (DE) = 29.0 m, (EF) = 8.5 m, (FA) = 60.5 m,   F A B = 59°, A B C = 90°, B C D = 158°, C D E = 160°, D E F = 163°, E F A = 90°, and F A O = 26°.
Applsci 13 07136 g013
Figure 14. Seventh electrode station configuration—Plan view of six straight frames placed around the perimeter of the pond under construction, in the area of Stachtoroi, Attica, where (AB) = 16.5 m, (BC) = 19.5 m, (CD) = 55.0 m, (DA) = 32.0 m, D A B = 35°, A B C = 131°, B C D = 146°, and C D A   =   O D A = 48°.
Applsci 13 07136 g014
Figure 15. Stachtoroi area, Attica with T-shaped dam for the eighth configuration—dotted green line marks electrode placement perimeter; burgundy solid line marks the dredging area perimeter.
Applsci 13 07136 g015
Figure 16. Eighth electrode station configuration—Plan view of six straight frames, placed perimetrically to a T-shaped dam, for the area of Stachtoroi, Attica, where (AB) = 3.0 m, (EF) = 15.5 m, (CD) = 55.0 m, (DB) = 27.5 m, F A B = 59°, D B A = 90°, and D F E = 90°.
Applsci 13 07136 g016
Figure 17. Ninth electrode station configuration—Section plan of six straight frames, adapted radially to a central base with guides.
Applsci 13 07136 g017
Figure 18. Ninth electrode station configuration—Floor plan of six straight frames, adapted radially to a central base with guides.
Applsci 13 07136 g018
Figure 19. Tenth electrode station configuration—Cross-section of six straight frames, adapted around the perimeter on a central base.
Applsci 13 07136 g019
Figure 20. Tenth electrode station configuration—Floor plan of six straight frames, adapted around the perimeter of a central base (a total of 6 frames in a dodecagon).
Applsci 13 07136 g020
Figure 21. Tenth electrode station configuration—Geometric arrangement for calculating the minimum radius of a central base for the placement of six vertical straight frames on its circumference.
Applsci 13 07136 g021
Figure 22. (a) Electric field strength, (b) area of electric field strength; blue denotes values lower and yellow denotes values higher than the limit of 1.25 V/m, with linear current sources, regarding an electrode station with the 2nd configuration in the area of Korakia (ρS = ∞, without dam, ρw = 0.25 Ω∙m, p = 0.50 m, dfv = 10.90 m, L = 2.13 m, θg = 248°), Jmt_st = 22 A/m2 (5-frame operation, excepting no. 6; steady state).
Applsci 13 07136 g022
Figure 23. (a) Electric field strength, (b) area of electric field strength; blue denotes values lower and yellow indicates values higher than the limit of 1.25 V/m, with linear current sources, regarding an electrode station with the 3rd configuration, in the area of Korakia (ρS = ∞, without dam, ρw = 0.25 Ω∙m, p = 0.50 m, dfv = 11.00 m, sc = 10.00 m, L = 2.13 m, θg = 248°), Jmt_st = 22 A/m2 (5-frame operation, excepting no. 6; steady state).
Applsci 13 07136 g023
Figure 24. (a) Electric field strength, (b) area of electric field strength; blue denotes values lower and yellow denotes values higher than the limit of 1.25 V/m, with linear current sources, regarding an electrode station with the 4th configuration, in the area of Korakia (ρS = ∞, without dam, ρw = 0.25 Ω∙m, p = 0.50 m, dfv = 11.00 m, sc = 10.00 m, L = 2.13 m, θg = 248°), Jmt_st = 22 A/m2 (5-frame operation, excepting no. 5; steady state).
Applsci 13 07136 g024
Figure 25. (a) Electric field strength, (b) area of electric field strength; blue denotes values lower and yellow denotes values higher than the limit of 1.25 V/m, with linear current sources, regarding an electrode station with the 5th configuration, in the area of Korakia (ρS = ∞, without dam, ρw = 0.25 Ω∙m, p = 0.50 m, dfv = 11.00 m, sc = 10.00 m, L = 2.13 m, θg = 248°), Jmt_st = 22 A/m2 (5-frame operation, excepting No. 6; steady state).
Applsci 13 07136 g025
Figure 26. (a) Electric field strength, (b) area of electric field strength; blue denotes values lower and yellow denotes values higher than the limit of 1.25 V/m, with linear current sources, regarding an electrode station with the 6th configuration, in the area of Korakia (ρS = ∞, without dam, ρw = 0.25 Ω∙m, p = 0.50 m, dfv = 11.00 m, sc = 10.00 m, L = 2.13 m, θg = 248°), Jmt_st = 22 A/m2 (5-frame operation, excepting no. 6; steady state).
Applsci 13 07136 g026
Figure 27. (a) Electric field strength, (b) area of electric field strength; blue denotes values lower and yellow denotes values higher than the limit of 1.25 V/m, with linear current sources, regarding an electrode station with the 7th configuration, in the area of Korakia (ρS = ∞, without dam, ρw = 0.25 Ω∙m, p = 0.50 m, dfv = 11.00 m, sc = 10.00 m, L = 2.13 m, θg = 248°), Jmt_st = 22 A/m2 (5-frame operation, excepting no. 2; steady state).
Applsci 13 07136 g027
Figure 28. (a) Electric field strength, (b) area of electric field strength; blue denotes values lower and yellow denotes values higher than the limit of 1.25 V/m, with linear current sources, regarding an electrode station with the 7th configuration, in the area of Stachtoroi (ρS = ∞, without dam, ρw = 0.25 Ω∙m, p = 0.50 m, dfv = 8.00 m, sc = 6.00 m, L = 2.13 m, θg = 210°), Jmt_st = 22 A/m2 (5-frame operation, excepting no. 1; steady state).
Applsci 13 07136 g028
Figure 29. (a) Electric field strength, (b) area of electric field strength; blue denotes values lower and yellow denotes values higher than the limit of 1.25 V/m, with linear current sources, regarding an electrode station with the 8th configuration, in the area of Stachtoroi (ρS = ∞, without dam, ρw = 0.25 Ω∙m, p = 0.50 m, dfv = 8.00 m, sc = 6.00 m, L = 2.13 m, θg = 210°), Jmt_st = 22 A/m2 (5-frame operation, excepting no. 6; steady state).
Applsci 13 07136 g029
Figure 30. (a) Electric field strength, (b) area of electric field strength; blue denotes values lower and yellow denotes values higher than the limit of 1.25 V/m, with linear current sources, regarding an electrode station with the 9th configuration, in the area of Korakia (ρS = ∞, without dam, ρw = 0.25 Ω∙m, p = 0.50 m, dfv = 11.00 m, sc = 10.00 m, L = 2.13 m, θg = 248°, RK1 = 11.0 m, R1 = 0), Jmt_st = 22 A/m2 (5-frame operation, excepting no. 6; steady state).
Applsci 13 07136 g030
Figure 31. Location of an electrode station, with 6 straight frames, adapted radially to a central base with guides (9th configuration), in the area of Stachtoroi, with base radius RΚ1 = 8.0 m (according to Figure 18), ensuring the appropriate depth for placing the frames and the necessary distances from the shore, for an equivalent electric field strength in the water below 1.25 V/m compared to the 1st configuration.
Applsci 13 07136 g031
Figure 32. (a) Electric field strength, (b) area of electric field strength; blue denotes values lower and yellow denotes values higher than the limit of 1.25 V/m, with linear current sources, regarding an electrode station with the 10th configuration, in the area of Korakia (ρS = ∞, without dam, ρw = 0.25 Ω∙m, p = 0.50 m, dfv = 11.00 m, sc = 10.00 m, L = 2.13 m, θg = 248°, RK2 = 16.5 m, R1 = 0), Jmt_st = 22 A/m2 (5-frame operation, excepting no. 6; steady state).
Applsci 13 07136 g032
Figure 33. Location of an electrode station, with 6 straight frames, adapted perimetrically to a central base (10th configuration), in the area of Stachtoroi, with base radius RΚ2 = 14.0 m according to Figure 20, ensuring the appropriate depth for placing the frames, and partially the necessary distances from the shore, for an equivalent electric field strength in the water below 1.25 V/m, compared to the 1st configuration.
Applsci 13 07136 g033
Table 1. Simulation results for the calculation of electric field strength using a linear current source (ρS = ∞, without dam, ρw = 0.25 Ω∙m) and absolute potential using a linear current source (for the near-field) and point current source (for the far-field) (ρS = ∞, ρw = 0.25, ρd = 100 Ω∙m) for the 2nd electrode station configuration, in the area of Korakia, Crete (p = 0.50 m, dfv = 10.90 m, L = 2.13 m, θg = 248°, θw =2.29°) and in the area of Stachtoroi, Attica (p = 0.50 m, dfv = 8.00 m, L = 2.13 m, θg = 210°, θw = 0.272°) with Elimit_S = 1.25 V/m.
Supply MethodJst (A/m2)dstv
(m)
cud
(m)
cbd
(m)
bc (m)uc
(m)
sbc (m)suc
(m)
ypr
(m)
Dypr (m)Εmax (V/m)Vrel_max (V)Rel (Ω)
Korakia, Crete6 frames operating18.3346.60−62.1162.11−27.5527.5534.5634.5638.45−23.6620.7619,56216.84
5 frames operating (except for no. 6)22.0048.70−65.7554.73−27.5516.5338.2038.1927.43−27.29 *124.9822,47519.26
5 frames operating (except for no. 5)22.0046.82−64.9117.05−27.555.5137.3611.5416.41−0.64 *224.7621,62110.53
−38.45−26.46
23.8559.7927.5527.553.7032.2416.657.20
38.45−21.34
5 frames operating (except for no. 4)22.0045.16−63.803.50−27.55−5.5136.259.015.391.8924.6120,37817.46
−38.45−25.35
9.8062.2216.5327.556.7334.675.634.17
38.45−23.77
Stachtoroi, Attica6 frames operating17.2734.20−46.2246.22−20.3120.3125.9225.9228.31−17.9215.8916,21313.89
5 frames operating (except for no. 6)22.0035.72−48.9240.79−20.3112.1828.6128.6120.18−20.61 *319.0818,39715.76
5 frames operating (except for no. 5)22.0034.35−48.2914.65−20.314.0627.9810.5912.06−2.59 *418.9017,62415.10
−28.31−19.98
15.6944.3920.3120.314.6124.0812.313.39
28.31−16.08
5 frames operating (except for no. 4)22.0033.15−47.463.15−20.31−4.0627.157.213.940.7918.7916,47014.11
−28.31−19.15
6.3546.3012.1820.315.8325.994.182.17
28.31−17.99
Note: Maximum electric field strength at the area of a nonoperating frame → (*1) = 2.86 V/m, (*2) = 1.55 V/m, (*3) = 2.87 V/m, (*4) = 1.67 V/m.
Table 2. Simulation results for the calculation of electric field strength using a linear current source (ρS = ∞, without dam, ρw = 0.25 Ω∙m) and absolute potential using a linear current source (for the near-field) and point current source (for the far-field) (ρS = ∞, ρw = 0.25, ρd = 100 Ω∙m) for the 3rd electrode station configuration, in the area of Korakia, Crete (p = 0.50 m, dfv = 11.00 m, sc = 10.00 m, L = 2.13 m, θg = 248°, θw = 2.29°) and in the area of Stachtoroi, Attica (p = 0.50 m, dfv = 8.00 m, sc = 6.00 m, L = 2.13 m, θg = 210°, θw = 0.272°) with Elimit_S = 1.25 V/m.
Supply MethodJst (A/m2)dstv_Ox
(m)
dstv_Ox/
(m)
cud
(m)
cbd
(m)
Εoff (V/m)Εmax (V/m)Vrel_max (V)Rel (Ω)
Korakia, Crete6 frames operating18.3347.8147.81−58.4858.4822.0524,54521.03
5 frames operating (except for no. 6 or no. 2)22.0049.2547.55−61.1055.202.9826.1226,46022.67
5 frames operating (except for no. 5 or no. 1)22.0047.5549.25−61.1055.202.9826.1226,97823.12
5 frames operating (except for no. 4)22.0048.4045.67−59.0259.022.0625.9024,35420.87
5 frames operating (except for no. 3)22.0045.6748.40−59.0259.022.0625.9023,75220.35
Stachtoroi, Attica6 frames operating18.3335.7235.72−43.7443.7416.9919,82416.99
5 frames operating (except for no. 6 or no. 2)22.0036.7835.50−45.7041.283.0520.0321,19018.16
5 frames operating (except for no. 5 or no. 1)22.0035.5036.78−45.7041.283.0520.0321,47618.40
5 frames operating (except for no. 4)22.0036.1434.14−44.1544.152.0619.8319,54916.75
5 frames operating (except for no. 3)22.0034.1436.14−44.1544.152.0619.8318,68416.01
Table 3. Simulation results for the calculation of electric field strength using a linear current source (ρS = ∞, without dam, ρw = 0.25 Ω∙m) and absolute potential using a linear current source (for the near-field) and point current source (for the far-field) (ρS = ∞, ρw = 0.25, ρd = 100 Ω∙m) for the 4th electrode station configuration, in the area of Korakia, Crete (p = 0.50 m, dfv = 11.00 m, sc = 10.00 m, L = 2.13 m, θg = 248°, θw = 2.29°) and in the area of Stachtoroi, Attica (p = 0.50 m, dfv = 8.00 m, sc = 6.00 m, L = 2.13 m, θg = 210°, θw = 0.272°) with Elimit_S = 1.25 V/m.
Supply MethodJst (A/m2)dstv_Ox
(m)
dstv_Ox/
(m)
cud
(m)
cbd
(m)
Εoff (V/m)Εmax (V/m)Vrel_max (V)Rel (Ω)
Korakia, Crete6 frames operating18.3347.0247.02−59.2859.2822.0923,37820.03
5 frames operating (except for no. 6)22.0049.0147.40−62.4154.103.0926.1326,14222.40
5 frames operating (except for no. 5)22.0046.4048.06−61.6757.252.5726.1425,91422.20
5 frames operating (except for no. 4)22.0047.6044.72−60.6459.111.8226.0823,91520.49
5 frames operating (except for no. 3)22.0044.7247.60−59.1160.641.8226.0824,37420.88
5 frames operating (except for no. 2)22.0048.0646.40−57.2561.672.5726.1424,77521.23
5 frames operating (except for no. 1)22.0047.4049.01−54.1062.413.0926.1325,81722.12
Stachtoroi, Attica6 frames operating18.3335.5335.53−44.0144.0117.0319,53716.74
5 frames operating (except for no. 6)22.0036.9535.69−46.2740.273.3520.1421,58118.49
5 frames operating (except for no. 5)22.0034.9536.26−45.6242.672.8320.0521,05518.04
5 frames operating (except for no. 4)22.0036.0033.97−44.9443.932.1520.0019,77816.95
5 frames operating (except for no. 3)22.0033.9736.00−43.9344.942.1520.0019,56916.77
5 frames operating (except for no. 2)22.0036.2634.95−42.6745.622.8320.0520,21817.32
5 frames operating (except for no. 1)22.0035.6936.95−40.2746.273.3520.1421,21218.17
Table 4. Simulation results for the calculation of electric field strength using a linear current source (ρS = ∞, without dam, ρw = 0.25 Ω∙m) and absolute potential using a linear current source (for the near-field) and point current source (for the far-field) (ρS = ∞, ρw = 0.25, ρd = 100 Ω∙m) for the 5th electrode station configuration, in the area of Korakia, Crete (p = 0.50 m, dfv = 11.00 m, sc = 10.00 m, L = 2.13 m, θg = 248°, θw = 2.29°) and in the area of Stachtoroi, Attica (p = 0.50 m, dfv = 8.00 m, sc = 6.00 m, L = 2.13 m, θg = 210°, θw 0.272°) with Elimit_S = 1.25 V/m.
Supply MethodJst (A/m2)dstv_Ox
(m)
dstv_Ox/
(m)
cud
(m)
cbd
(m)
Εoff (V/m)Εmax (V/m)Vrel_max (V)Rel (Ω)
Korakia, Crete6 frames operating18.3345.0745.07−56.3856.3822.1424,08620.64
5 frames operating (except for no. 6 or no. 2)22.0046.6444.05−58.3554.183.3126.2925,70522.02
5 frames operating (except for no. 5 or no. 1)22.0044.0546.64−58.3554.183.3126.2924,84421.29
5 frames operating (except for no. 4)22.0046.3143.08−56.6956.692.5025.7825,09421.50
5 frames operating (except for no. 3)22.0043.0846.31−56.6956.692.5025.7921,57218.48
Stachtoroi, Attica6 frames operating18.3332.6832.68−41.8941.8917.0919,14016.40
5 frames operating (except for no. 6 or no. 2)22.0033.9131.84−43.3540.313.2520.1620,34617.43
5 frames operating (except for no. 5 or no. 1)22.0031.8433.91−43.3540.313.2520.1619,40216.62
5 frames operating (except for no. 4)22.0033.6931.13−42.1242.122.5419.8019,97517.12
5 frames operating (except for no. 3)22.0031.1333.69−42.1242.122.5419.8016,90814.49
Table 5. Simulation results for the calculation of electric field strength using a linear current source (ρS = ∞, without dam, ρw = 0.25 Ω∙m) and absolute potential using a linear current source (for the near-field) and point current source (for the far-field) (ρS = ∞, ρw = 0.25, ρd = 100 Ω∙m) for the 6th electrode station configuration, in the area of Korakia, Crete (p = 0.50 m, dfv = 11.00 m, sc = 10.00 m, L = 2.13 m, θg = 248°, θw = 2.29°) and in the area of Stachtoroi, Attica (p = 0.50 m, dfv = 8.00 m, sc = 6.00 m, L = 2.13 m, θg = 210°, θw = 0.272°) with Elimit_S = 1.25 V/m.
Supply MethodJst (A/m2)dstv_Ox
(m)
dstv_Ox/
(m)
cud
(m)
cbd
(m)
Εoff (V/m)Εmax (V/m)Vrel_max (V)Rel (Ω)
Korakia, Crete6 frames operating18.3344.9644.96−56.5556.55-22.0823,86120.44
5 frames operating (except for no. 6)22.0046.7444.18−58.8953.353.4226.2525,94222.23
5 frames operating (except for no. 5)22.0043.6646.38−58.1555.283.1226.2124,56221.05
5 frames operating (except for no. 4)22.0046.2242.96−57.4156.292.4725.7925,00421.42
5 frames operating (except for no. 3)22.0042.9646.22−56.2957.412.4725.7922,27519.09
5 frames operating (except for no. 2)22.0046.3843.66−55.2858.153.1226.2125,02121.44
5 frames operating (except for no. 1)22.0044.1846.74−53.3558.893.4226.2524,62521.10
Stachtoroi, Attica6 frames operating18.3332.6032.60−42.0142.01-17.0418,99316.27
5 frames operating (except for no. 6)22.0033.9831.93−43.7439.703.3720.1220,50617.57
5 frames operating (except for no. 5)22.0031.5733.70−43.1841.113.0720.0919,19216.44
5 frames operating (except for no. 4)22.0033.6231.04−42.6541.822.5119.8019,90617.06
5 frames operating (except for no. 3)22.0031.0433.62−41.8242.652.5119.8017,37114.88
5 frames operating (except for no. 2)22.0033.7031.57−41.1143.183.0720.0919,91517.06
5 frames operating (except for no. 1)22.0031.9333.98−39.7043.743.3720.1219,27916.52
Table 6. Simulation results for the calculation of electric field strength using a linear current source (ρS = ∞, without dam, ρw = 0.25 Ω∙m) and absolute potential using a linear current source (for the near-field) and point current source (for the far-field) (ρS = ∞, ρw = 0.25, ρd = 100 Ω∙m) for the 7th electrode station configuration, in the area of Korakia, Crete (p = 0.50 m, dfv = 11.00 m, sc = 10.00 m, L = 2.13 m, θg = 248°, θw = 2.29°) and in the area of Stachtoroi, Attica (p = 0.50 m, dfv = 8.00 m, sc = 6.00 m, L = 2.13 m, θg = 210°, θw = 0.272°) with Elimit_S = 1.25 V/m.
Supply MethodJst (A/m2)dOx
(m)
dOx/
(m)
dOy
(m)
dOy/
(m)
Εoff (V/m)Εmax (V/m)Vrel_max (V)Rel (Ω)
Korakia, Crete6 frames operating18.3341.15−70.6452.67−59.71-20.6919,24916.49
5 frames operating (except for no. 6)22.0043.22−72.5042.01−62.921.4924.3921,87318.74
5 frames operating (except for no. 5)22.0044.60−66.7052.90−62.711.5324.3121,79218.67
5 frames operating (except for no. 4)22.0044.25−66.9455.09−60.531.4524.7821,22918.19
5 frames operating (except for no. 3)22.0042.58−72.7455.80−50.241.4524.7219,92717.07
5 frames operating (except for no. 2)22.0038.05−74.0455.67−58.981.5524.6218,87916.18
5 frames operating (except for no. 1)22.0038.47−73.6352.63−62.031.4224.8421,70918.60
Stachtoroi, Attica6 frames operating18.3330.55−45.7042.32−48.73-16.4216,02213.73
5 frames operating (except for no. 6)22.0031.00−45.5941.28−50.651.6119.2116,73014.33
5 frames operating (except for no. 5)22.0031.96−40.2343.88−49.231.7719.4416,83614.43
5 frames operating (except for no. 4)22.0032.55−46.2644.94−43.822.0719.4917,80415.25
5 frames operating (except for no. 3)22.0030.69−47.0444.54−46.781.8219.4417,80415.25
5 frames operating (except for no. 2)22.0027.14−46.5942.37−50.021.4519.2116,65314.27
5 frames operating (except for no. 1)22.0031.81−48.1235.83−51.612.2619.2217,84215.29
Table 7. Simulation results for the calculation of electric field strength using a linear current source (ρS = ∞, without dam, ρw = 0.25 Ω∙m) and absolute potential using a linear current source (for the near-field) and point current source (for the far-field) (ρS = ∞, ρw = 0.25, ρd = 100 Ω∙m) for the 8th electrode station configuration, in the area of Stachtoroi, Attica (p = 0.50 m, dfv = 8.00 m, sc = 6.00 m, L = 2.13 m, θg = 210°, θw = 0.272°) with Elimit_S = 1.25 V/m.
Supply MethodJst (A/m2)dOx
(m)
dOx/
(m)
dOy
(m)
dOy/
(m)
Εoff (V/m)Εmax (V/m)Vrel_max (V)Rel (Ω)
6 frames operating18.3331.80−43.9540.97−52.90-16.4915,69613.45
5 frames operating (except for no. 6)22.0033.51−37.4542.85−53.852.2819.4016,29213.96
5 frames operating (except for no. 5)22.0030.66−43.2141.71−53.790.8119.3215,60413.37
5 frames operating (except for no. 4)22.0033.74−45.8443.75−44.941.9419.6017,70515.17
5 frames operating (except for no. 3)22.0030.36−44.5142.68−52.172.1019.3516,87514.46
5 frames operating (except for no. 2)22.0030.85−44.9940.05−54.782.0519.4717,49114.99
5 frames operating (except for no. 1)22.0034.07−46.4832.08−55.851.9919.6918,31215.69
Table 8. Simulation results for the calculation of electric field strength using a linear current source (ρS = ∞, without dam, ρw = 0.25 Ω∙m) and absolute potential using a linear current source (for the near-field) and point current source (for the far-field) (ρS = ∞, ρw = 0.25, ρd = 100 Ω∙m) for the 9th electrode station configuration, in the area of Korakia, Crete (p = 0.50 m, dfv = 11.00 m, sc = 10.00 m, L = 2.13 m, θg = 248°, θw = 2.29°) and in the area of Stachtoroi, Attica (p = 0.50 m, dfv = 8.00 m, sc = 6.00 m, L = 2.13 m, θg = 210°, θw = 0.272°) with Elimit_S = 1.25 V/m.
Supply MethodJst (A/m2)dOx
(m)
dOx/
(m)
dOy
(m)
dOy/
(m)
Εoff (V/m)Εmax (V/m)Vrel_max (V)Rel (Ω)VO (V)
Korakia, CreteRK1 = 11 m, R1 = 0 m6 frames operating18.3356.08−56.0856.08−56.08-22.15(−)13231.133−978
5 frames operating (except for no. 6)22.0055.44−57.6958.09−53.372.5926.1174296.365−624
5 frames operating (except for no. 5)22.0057.69−55.4458.09−53.372.5926.11(−)71936.163−3490
5 frames operating (except for no. 4)22.0058.26−51.9356.81−56.812.5426.13(−)10,8239.273−4267
5 frames operating (except for no. 3)22.0057.69−55.4453.37−58.092.5926.11(−)71936.163−3490
5 frames operating (except for no. 2)22.0055.44−57.6953.37−58.092.5626.1174296.365−624
5 frames operating (except for no. 1)22.0051.93−58.2656.81−56.812.5426.1311,0969.5076624
RK1 = 11 m, R1 = 0 m5 frames operating (except for no. 6)22.0055.47−57.8158.20−53.192.4125.9878446.721−833
5 frames operating (except for no. 1)22.0051.47−58.3956.90−56.902.3725.9911,5429.8896832
RK1 = 26 m, R1 = 0 m5 frames operating (except for no. 6)22.0057.75−60.1558.66−53.051.2325.0511,6649.994−3298
5 frames operating (except for no. 1)22.0052.15−60.5857.56−57.561.2225.0515,59313.368310
RK1 = 26 m, R1 = 10 m5 frames operating (except for no. 6)22.0057.75−60.1558.66−53.051.2325.0511,6649.994−4002
5 frames operating (except for no. 1)22.0052.15−60.5857.56−57.561.2225.0511,5719.9145954
Stachtoroi, AtticaRK1 = 9 m, R1 = 0 m6 frames operating18.3341.88−41.8841.84−41.84-16.95677.20.580−253.7
5 frames operating (except for no. 6)22.0041.42−43.1443.43−39.752.4819.9146363.972140.6
5 frames operating (except for no. 5)22.0043.14−41.4243.43−39.752.4819.91−41833.584−1899
5 frames operating (except for no. 4)22.0043.57−38.5142.47−42.472.4219.92−67345.770−2465
5 frames operating (except for no. 3)22.0043.14−41.4239.75−43.432.4819.9141833.584−1899
5 frames operating (except for no. 2)22.0041.42−43.1439.75−43.432.4819.9146363.972140.6
5 frames operating (except for no. 1)22.0035.51−43.5742.47−42.472.4219.9272146.1814459
RK1 = 19 m, R1 = 0 m5 frames operating (except for no. 6)22.0043.28−45.0343.71−39.711.2119.0676456.550−1495
5 frames operating (except for no. 1)22.0031.31−45.3442.93−42.931.2019.0710,5329.0245948
RK1 = 19 m, R1 = 10 m5 frames operating (except for no. 6)22.0043.28−45.0343.71−39.711.2119.0676456.550−2044
5 frames operating (except for no. 1)22.0031.31−45.3442.93−42.931.2019.0764155.4973440
Table 9. Simulation results for the calculation of electric field strength using a linear current source (ρS = ∞, without dam, ρw = 0.25 Ω∙m) and absolute potential using a linear current source (for the near-field) and point current source (for the far-field) (ρS = ∞, ρw = 0.25, ρd = 100 Ω∙m) for the 10th electrode station configuration, in the area of Korakia, Crete (p = 0.50 m, dfv = 11.00 m, sc = 10.00 m, L = 2.13 m, θg = 248°, θw = 2.29°) and in the area of Stachtoroi, Attica (p = 0.50 m, dfv = 8.00 m, sc = 6.00 m, L = 2.13 m, θg = 210°, θw = 0.272°) with Elimit_S = 1.25 V/m.
Supply MethodJst (A/m2)dOx
(m)
dOx/
(m)
dOy
(m)
dOy/
(m)
Εoff (V/m)Εmax (V/m)Vrel_max (V)Rel (Ω)VO (V)
Korakia, CreteRK1 = 16.5 m, R1 = 0 m6 frames operating18.3356.09−56.0956.09−56.09-20.35−39683.400−2911
5 frames operating (except for no. 6)22.0055.49−57.9558.36−52.972.2124.9012,90211.05−3358
5 frames operating (except for no. 5)22.0057.95−55.4958.36−52.972.2124.89−12,68110.87−6450
5 frames operating (except for no. 4)22.0058.54−50.9457.01−57.012.2024.94−16,60014.22−7257
5 frames operating (except for no. 3)22.0057.95−55.4952.97−58.362.2124.89−12,68110.87−6450
5 frames operating (except for no. 2)22.0055.49−57.9552.97−58.362.2124.8912,90211.05−3358
5 frames operating (except for no. 1)22.0050.94−58.5457.01−57.012.2024.9416,83114.429401
RK1 = 28.5 m, R1 = 0 m5 frames operating (except for no. 6)22.0057.43−59.9058.84−52.841.2524.5615,72513.47−5987
5 frames operating (except for no. 1)22.0042.52−60.3557.68−57.681.2424.1119,66716.859667
RK1 = 28.5 m, R1 = 14 m5 frames operating (except for no. 6)22.0057.43−59.9058.84−52.841.2524.5615,72513.47−6722
5 frames operating (except for no. 1)22.0042.52−60.3557.68−57.681.2424.1113,67811.725984
Stachtoroi, AtticaRK1 = 14.0 m, R1 = 0 m6 frames operating18.3341.90−41.9041.83−41.83-15.26−23091.978−1608
5 frames operating (except for no. 6)22.0041.53−43.4743.73−39.321.9718.7791437.834−1831
5 frames operating (except for no. 5)22.0043.47−41.5343.73−39.321.9718.77−87197.470−4147
5 frames operating (except for no. 4)22.0043.90−37.1742.71−42.711.9718.11−11,6369.970−4750
5 frames operating (except for no. 3)22.0043.47−41.5339.32−43.731.9718.77−87197.470−4147
5 frames operating (except for no. 2)22.0041.53−43.4739.32−43.731.9718.7791437.834−1831
5 frames operating (except for no. 1)22.0037.17−43.9042.71−42.711.9718.1112,06910.347055
RK1 = 22 m, R1 = 0 m5 frames operating (except for no. 6)22.0043.03−44.8543.92−39.551.2118.4610,8659.309−3385
5 frames operating (except for no. 1)22.0031.55−45.1743.08−43.081.2118.4213,80511.837271
RK1 = 22 m, R1 = 12 m5 frames operating (except for no. 6)22.0043.03−44.8543.92−39.551.2118.4610,865.19.309−4396
5 frames operating (except for no. 1)22.0031.55−45.1743.08−43.081.2118.428726.217.477−3515
Table 10. Summary of the simulation of field results for an electrode station with 6 frames for the area of Korakia, where “*” denotes the calculation of the corresponding circular disk area.
No.ConfigurationdOx (m)|dOx/| (m)dOy (m)|dOy/| (m)Scr (m2)Εεκ (V/m)Επ (V/m)Vrel_max (V)Rel (Ω)No. of Table
1Straight frames in a row, placed parallel to a 70 m dam50.2950.2967.8167.8113,6413.1326.0922,77219.5110 and 15 in [2]
2Straight frames in a row, placed vertical to a 70 m dam48.7054.7065.7565.7513,5972.8624.9822,47519.261
3Straight frames in two overlapping rows, placed parallel to the axis of a 70 m dam, aligned with each other49.2660.2561.1061.1013,3822.9826.1226,97823.122
4Straight frames in two overlapping rows, placed parallel to the axis of a 70 m dam, non-overlapping on the vertical axis of the dam49.0160.0162.4162.4113,6083.0926.1326,14222.403
5Straight frames in two successive rows, placed vertical to the axis of a 70 m dam, aligned with each other46.6467.6458.3558.3513,3363.3126.2925,70522.024
6Straight frames in two successive rows, placed vertical to the axis of a 70 m dam, non-overlapping on the vertical axis of the dam46.7467.7458.8958.8913,4833.4226.2525,94222.235
7Straight frames in perimetrical placement to a dam, adapted to a pond outline of 192.5 m44.6074.0455.8062.9214,0851.5524.7821,87318.746
8Straight frames adapted to a T-shaped dam----------
9Straight frames adapted radially to a central base RK1 = 11 m58.2658.2658.0958.0913,537
10,663 *
2.5926.1311,0969.5078
10Straight frames adapted perimetrically to a central base RK2 = 16.5 m58.5458.5458.3658.3613,666
10,766 *
2.2124.9416,83114.429
Table 11. Summary of the simulation of field results for an electrode station with 6 frames for the area of Stachtoroi, where “*” denotes the calculation of the corresponding circular disk area.
No.ConfigurationdOx (m)|dOx/| (m)dOy (m)|dOy/| (m)Scr (m2)Εεκ (V/m)Επ (V/m)Vrel_max (V)Rel (Ω)No. of Table
1Straight frames in a row, placed parallel to a 50 m dam36.3436.3452.3052.3076022.9519.7317,30014.8211 and 15 in [2]
2Straight frames in a row, placed vertical to a 50 m dam35.7241.7248.9248.9275772.8719.0818,39715.761
3Straight frames in two overlapping rows, placed parallel to the axis of a 50 m dam, aligned with each other36.7844.7845.7045.7074553.0520.0321,47618.402
4Straight frames in two overlapping rows, placed parallel to the axis of a 50 m dam, non-overlapping on the vertical axis of the dam36.9544.9546.2746.2775793.3520.1421,58118.493
5Straight frames in two successive rows, placed vertical to the axis of a 50 m dam, aligned with each other33.9151.9143.3543.3574413.2520.1620,23517.344
6Straight frames in two successive rows, placed vertical to the axis of a 50 m dam, non-overlapping on the vertical axis of the dam33.9851.9843.7443.7475203.3720.1220,50617.575
7Straight frames in perimetrical placement to a dam, adapted to a pond outline of 123.0 m32.5548.1244.9451.6177892.2619.4917,84215.296
8Straight frames adapted to a T-shaped dam34.0746.4843.7555.8579902.2819.6918,31215.697
9Straight frames adapted radially to a central base RK1 = 8 m43.5743.5743.4343.437569
5964 *
2.4819.9272146.1818
10Straight frames adapted perimetrically to a central base RK2 = 14 m43.9043.9043.7343.737679
6055 *
1.9718.7712,06910.349
Disclaimer/Publisher’s Note: The statements, opinions and data contained in all publications are solely those of the individual author(s) and contributor(s) and not of MDPI and/or the editor(s). MDPI and/or the editor(s) disclaim responsibility for any injury to people or property resulting from any ideas, methods, instructions or products referred to in the content.

