Abstract
This study used monoethanolamine (MEA) as an amine-based solvent, which was blended with secondary amines (DIPA), tertiary amines, stereo amines, and piperazine (PZ) to prepare mixed amines at the required concentrations, which were used as the test solvents. To search for the best-mixed amines, a continuous bubble-column scrubber was adopted to explore the performance of mixed solvents presented in this study. The solvent regeneration test was also carried out at different temperatures. The selected factors included the type of mixed amine (A), the ratio of mixed amines (B), the liquid feed flow (C), the gas flow rate (D), the concentration of mixed amines (E), and the liquid temperature (F), each having five levels. Using the Taguchi experimental design, the conventional experimental number could be reduced from 15,625 to 25, saving much time and cost. The absorption efficiency (EF), absorption rate (RA), overall mass-transfer coefficient (KGa), and absorption factor (ϕ) were estimated as the indicators. After the Taguchi analysis, E, D, and C were found to play important roles in the capture of CO2 gas. Verifications of optimum conditions were found to be 100%, 19.96 × 10⁻⁴ mole/s·L, 1.2312 1/s, and 0.6891 mol-CO2/L·mol-solvent for EF, RA, KGa, and ϕ, respectively. The evaluated indexes suggested that MEA + PZ was the best-mixed amine, followed by MEA and MEA + DIPA. The solvent regeneration tests for the scrubbed solutions performed at different optimum conditions showed that the heat of the regeneration sequence was in the order of MEA > MEA + PZ > MEA + DIPA with minimum energy required at 110 °C. The individual energy required was also analyzed here.
1. Introduction
Due tothe influence of greenhouse gases, in which CO2 is the major component, climate change is becoming gradually serious in the global world. Therefore, COP26 passed a resolution to control global warming below 1.5 °C before 2050 [1]. The emission amount of CO2 was about 35 Gt in 2022, and the baseline emission is estimated to be 57 Gt in 2050. To keep the temperature rise below 1.5 °C before 2050, the emission of CO2 needs to be maintained at 14 Gt; this means that a total amount of 43 Gt CO2 needs to be reduced. According to the roadmap of the International Energy Agency, the reduction contribution in CO2 emission using CCSU (Carbon Capture, Storage and Utilization) technology is at least 8 Gt. This shows that CCSU will be important in the coming 30–40 years. Recently, a Net-Zero-CO2 emission between 2040 and 2060 was also addressed through three routes: carbon capture and storage (CCS), carbon capture, and utilization (CCU), and the use of biomass grown and processed for the specific purpose of making chemicals (BIO) [2]. This impact was largely for some CO2 emissions sectors in the industry such as coal-fired plants, the petroleum industry, the cement industry, and the steel mill industry. To reduce CO2 emission, several technologies are used, such as absorption, adsorption, membrane separation, freezing technology, and chemical looping [3], in which absorption was found to be more effective in the CO2 concentration range of 0–20% under 10 atm [4]. Recently, competing methods for the absorption and utilization of CO2, such as the capture of CO2 in molten salts, were reported in the literature [5,6]. The method used molten salt CO2 capture and an electrochemical transformation process to obtain carbon at the cathode and oxygen at the anode. In addition, synthesizing oxygen reduction reaction catalysts from CO2, connecting the fields of carbon capture and fuel cell research was reported in the literature [7].
Generally speaking, a double-unit process including a combination of scrubber and stripper is required when using the absorption method, in which the alkanolamine solutions were proposed as the absorption solvents for CO2 capture before 2030 [8,9,10,11]. However, the capture cost in the stripping step in CCS is about 60–70%, making the selection of strippers and solvents pivotal. Due to this, several solvents have been adopted, such as amines [11,12,13,14,15], amino salts [16,17], ammonia water [18,19], sodium hydroxide [20], potassium carbonate [21], piperazines [22], ionic liquids, and physical solvents [10], with amines being the most popular solvents in these capture processes. The drawbacks of a single solvent, such as loading, corrosion rate, degradation rate, and regeneration energy, were improved by adopting new solvents, including mixed amines and non-aqueous solvents [23,24,25,26,27,28]. There are four kinds of amines, basically classified as primary amines (such as monoethanolamine, MEA) [29,30], secondary amines (such as diisopropanolamine, DIPA) [31,32,33], tertiary amines (such as triethanolamine, TEA) [34,35,36], and steric amine (such as 2-amino-2-methyl-1-propanol, AMP) [37,38,39]. Structurally, these amines have at least one hydroxyl group and one amino group, as shown in Figure 1. The presented hydroxyl group can reduce the vapor pressure, and the amino group can absorb acidic gases; therefore, it affects the physical properties of amines (Table 1). The vapor pressures at 20 °C for MEA, DIPA, and TEA are 64 Pa, 2 Pa, and 1 Pa, respectively. The vapor pressure of amine decreases with an increase in the –OH group. The loadings of various amines are affected by the functional groups. For instance, theoretically, the loading of MEA is limited stoichiometrically to 0.5 moles CO2 per mole amine. However, the loading is higher for secondary and tertiary amines, with loadings of up to 1 mole of CO2 per mole of amine. To promote the absorption rate, and decrease oxygen degradation and thermal degradation, aqueous piperazine [40], and a cyclic diamine shown in Figure 1e, solution was used to test for the capture of CO2 [10,22].
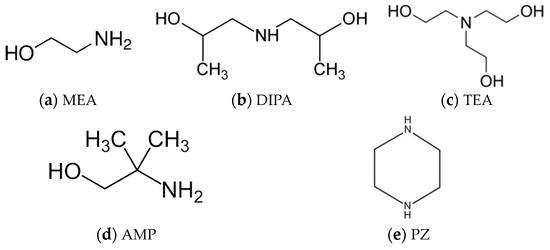
Figure 1.
Structures of various amines showing the difference in functional groups.

Table 1.
Physical and chemical properties of amines [10,39,40,41,42].
The absorption process of CO2 using an amine solution generally includes diffusion from the bulk gas phase to the gas–liquid interface, from interface diffusion into the liquid bulk phase, and reaction with an amine. The reaction between CO2 and the amine can be described by a two-step zwitterions mechanism [43]. First, the reactions of CO2 with a primary amine and secondary amine (CO2/H2O/R1R2NH2) systems, based on the zwitterion system, are found to be [43,44]:
In Equations (2) and (3), the reaction constants are and , respectively. In Equation (4), the forward reaction and reverse reaction constants are k2 and k−1, respectively. In Equations (5)–(7), the amine, OH− and H2O can be expressed as a base B, i.e., the three equations can be expressed as a single equation:
The forward reaction rate equation at quasi-steady state becomes:
In most case, < < 1 resulting simple second-order kinetics is obtained:
Considering the reactions (2) and (3), the overall rate was found to be:
The total rate of all CO2 reactions in an aqueous solution is thus represented by the sum of the reaction rates. Where the kobs is:
If << 1, the kobs becomes
The tertiary alkanolamines (denoted here as R3N such as TEA) and PZ can also be expressed as shown in Equation (11) for similar kinetics as [R1R2NH] with replacement of [R1R2NH] by [R3N] or [PZ] [38,39]. The reaction of CO2 with H2O is usually neglected in the overall reaction rate equation resulting the terms of in Equation (11) and kH2O[H2O] in Equation (13) can be neglected.
The reaction of CO2 with amines found that the reaction rate constant with CO2 are 3630 [39], 2585 [39], and 2202 m3/s·kmol [37] for MEA, DIPA, and TEA, respectively. However, the reaction constant is affected by pKa and temperature [40,45]. At a given temperature, ln k2 is proportional to pKa. In addition, the activation energy in Table 1 shows that reactions with high Ea is very temperature-sensitive and reactions low Ea is very temperature-insensitive [46]. However, the reaction rate constants for AMP and PZ were 810.4 and 48,533, respectively. The reaction rate constant for PZ is much higher than the other amines. Therefore, the addition of PZ into amines has a powerful potential to promote the absorption rate. For mixed amines, the overall rate can be expressed as:
where is the reaction rate of ith amine and kobs, Mixed is overall rate constant of mixed amines. Equation (14) states that the reaction rate is affected by concentration of various amine, [OH−] and [CO2]. In addition, the gas–liquid contact method and temperature are also affecting the reaction rate [46].
Here, the means of CO2 capture was explored to search for the best-mixed amine using a combination of amines including MEA, MEA + DIPA, MEA + TEA, MEA + AMP, and MEA + piperazine (PZ). In the capture process, however, several important factors need to be considered, such as the ratio of mixed amines, the liquid-flow rate, the gas-flow rate, the concentration of total amines, and the liquid temperature. In this study, the CO2 absorption experiment was performed by using a continuous bubble-column scrubber because bubble columns have higher mass-transfer coefficients in the range of 0.04–1.54 s−1 and higher specific surface area in the range of 100–1500 m2/m3 compared with packed bed, whose mass-transfer coefficient and specific surface area are in the range of 0.02–0.38 s−1 and 100–600 m2/m3, respectively. The larger the mass-transfer coefficient, the smaller the column size [47,48]. In addition, the bubble column is comparable with packed bed although the pressure drop for a bubble column was higher than a packed bed. The scrubbing factor for the former is higher than the latter [20]. Due to this, the bubble-column has been found that it shows a superior performance, such as a high absorption, high mass-transfer coefficient, simple structure, higher scrubbing factor, and easy operation, compared with other scrubbers. In order to evaluate the performance of solvents, the indexes of solvents include the removal efficiency (EF), the absorption rate (RA), the overall mass-transfer coefficients (KGa), and the scrubbing factor (ϕ).
To achieve this purpose, the Taguchi method was used in the experimental design to reduce the cost and save time. From the experimental data, the optimum conditions and sequence of parameters could be obtained through the S/N (signal/noise) ratio analysis. Verification of optimum conditions was required. Accompanying various indexes, the best-mixed amines for the CO2 capture process could be obtained. Finally, solvent regeneration for the best amine was also explored. A schematic of the research framework is shown in Figure 2.
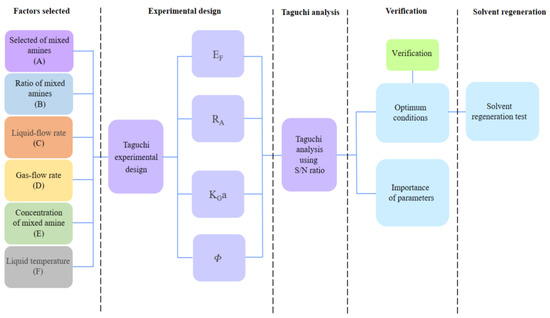
Figure 2.
Research framework conducted in this study.
2. Methodology
2.1. Experimental Design
Six factors, including the type of mixed amines (A), the ratio of mixed amines (B), the liquid-flow rate (C), the gas-flow rate (D), the concentration of total amines (E), and liquid temperature (F), were assessed, each with five levels. According to traditional experimental design, a total of 15,625 runs had to be performed, leading to high costs and a longer time for experimentation. Therefore, using the Taguchi experimental design, the experimental number could be largely reduced to 25 runs, cutting the experimental cost up to 99.84%. The optimum conditions and sequence of importance could also be obtained from Taguchi analysis. Table 2 presents the factors and levels in this work, while Table 3 presents the orthogonal arrays with 25 runs and operating conditions.
Table 2.
Factors and levels selected in this research.
Table 3.
Orthogonal arrays, L25(56).
2.2. Indexes Determination
Gas–liquid contact with the co-current flow can be found in Figure 3a, the simulated flue gas, CO2(A) + N2(B), go through the distributor forming small bubbles and mixing with absorbent in the bubble-column scrubber. The CO2 gas from the gas film diffuses into the liquid film and is absorbed by the liquid as shown in Figure 3b. At the interface, the CO2 gas follows Henry’s law and the absorption rate accompanying with two-film model becomes:
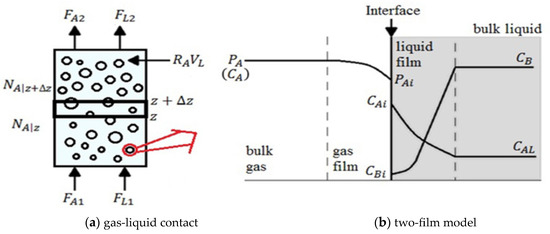
Figure 3.
Absorption of CO2 in the scrubber accompanied with two-film model.
In order to obtain the absorption rate and overall mass-transfer coefficient, the isothermal mass balance at a steady-state condition is used:
(Mass transfer of CO2 at inlet) − (Mass transfer of CO2 at outlet) = Absorption rate of CO2.
The equations can be expressed below:
where NA is the molar flux of component A. Alternatively, Equation (17) becomes:
where NAA = FA, the molar flow rate. Take limit, Equation (18) becomes
Integrate the Equation (19), it is
or
Equation (22) shows that the overall absorption rate can be calculated from the measured input and output CO2 gas molar rates and liquid volume. Because the molar flow rate of inert gas (N2) is equal to FA1(1 − yA1)/yA1, the molar flow rate of carbon dioxide at the outlet (FA2) is equal to FA1[(1 − yA1)/yA1][yA2/(1 − yA2)]. Therefore, Equation (22) can be rewritten as:
Equation (23) shows that absorption rate can be evaluated when FA1, VL, yA1, and yA2 are given. In addition, Equation (17) can be written as
where uz is the linear velocity of gas through the column. Substitute Equation (15) into Equation (24) and it is divided by Δz and take the limit, the equation becomes
For most systems, CA > > HCLA [49]. Therefore, Equation (25) can be rearranged and integration, which is
Finally, the overall mass-transfer coefficient becomes
where KGa is defined as the following:
Equation (27) shows that overall mass-transfer coefficient can be estimated when CA1, CA2, VL, and Qg are measured. In addition, the absorption efficiency and scrubbing factor are defined below:
Heat duty of solvent regeneration includes three parts, i.e., heat of adsorption (qads), sensitive heat (qsen), and heat of evaporation (qsol):
They can be determined when thermal data are available [32,50,51,52,53,54]. Thermal data used here include those of heat capacity [50], the heat of absorption [32,52,53,54], and latent heat [51]. In Equation (31), Cp is the heat capacity of scrubbed solutions, ΔHad the heat of absorption, ΔT the temperature difference, msol the mass of regeneration solution, the mass loss of CO2 after stripping, ΔHvap the heat of evaporation, and Δm1 the scrubbed solution loss during stripping.
3. Experimental Procedure
3.1. Absorption Test
The experimental devices are depicted in Figure 4, including the bubble column, tubing pumps for gas-flow and liquid-flow, a mass flow controller, pH-meter, CO2 meter, gas heating chamber, and cooler. To start with, the desired mixed amine concentration was prepared using distilled water. Next, the flow rate of carbon dioxide and nitrogen was adjusted using a mass flow controller into the proportion of 15% of CO2, maintaining the gas inlet temperature at the bottom of the scrubber at 50 °C. The mixed amine was placed into the scrubber after the desired temperature and CO2 concentration were achieved, and the experiment was started. During the experimentation, the pH of the solution, liquid temperature, gas inlet temperature, gas outlet temperature, pressure, and CO2 concentration were recorded every 5 min. The liquid at the outlet was also withdrawn for titration to observe the concentration of carbonate in the scrubbing solution. At the end of steady-state operation, the liquid input was closed, and the solution was withdrawn to measure the volume of liquid (VL) in the scrubber using a tubing pump. Using the measured data, including P, yA1, yA2, T, and VL, all the indicators can be evaluated.
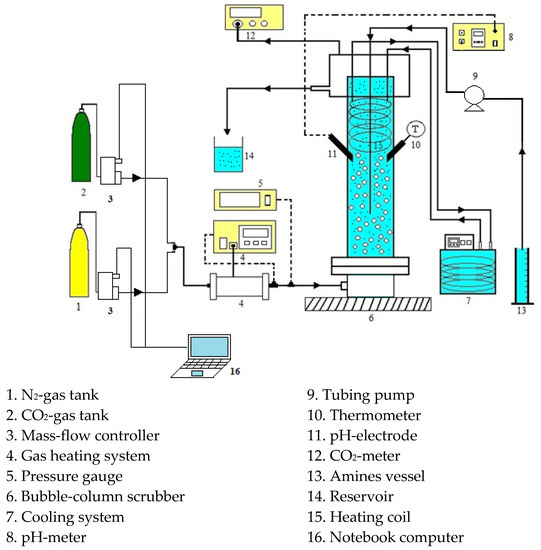
Figure 4.
Experimental device for CO2 capture test.
3.2. Regeneration Test
The equipment for regeneration tests is similar to those used in the previous work [17]. First, 0.05 kg scrubbed solution was prepared, and the ball condenser tube, three-neck round flask, heating system, and cooling circulator were assembled. The input cooling water temperature was set to 5 °C. When the heating oil temperature reached the desired value (100, 110, or 120 °C) and the cooling circulator temperature was stable, the 0.05 kg scrubbed solution was poured into the flask, and the magnetic stirrer was switched on. The experimental time was at least 60 min, and the temperature change was recorded once every 5 min. When the experiment was finished, the heating controller and cooling circulator were switched off, the mass of the scrubbed solution was measured, and the samples were taken for titration to measure the CO2 loading.
4. Results and Discussions
4.1. Steady-State Operation
A plot of Y versus t for No. 1 showing the variation in measured data with time is shown in Figure 5, wherein Y is defined as the ratio of the measured value to the initial value or the setting value. The figure shows that CO2 concentration, pH, liquid temperature, gas temperature at the inlet, and gas temperature at the top of the scrubber were maintained constant after 30 min. This variation showed that the system reached a steady-state condition. Due to this, the measured data could be used to evaluate the values of indexes. Calculated data for EF, RA, KGa, and ϕ are listed in Table 4. The range of data was 56.58–100.0%, 4.42 × 10⁻⁴–18.95 × 10⁻⁴ mol s−1 L−1, 0.1195–0.9139 s−1, and 0.0433–0.2923 mol-CO2 mol-solvent−1 L−1 for EF, RA, KGa, and ϕ, respectively. The steady-state pH values were 9.60–11.42, depending on the operating conditions. In addition, γ-values were in the range of 0.2942–2.3056. All data were analyzed to search further for the optimum mixed amine.
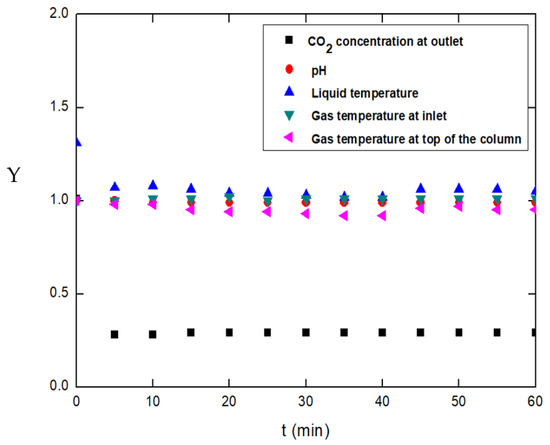
Figure 5.
Variation of measurements showing steady-state condition (No. 1).
Table 4.
Values of indexes for different runs.
4.2. Effects of Mixed Amines on the Indexes
Factor A represents mixed amine, as shown in Table 3, including A1 (MEA; Nos. 1–5), A2 (MEA + DIPA; Nos. 6–10), A3 (MEA + TEA; Nos. 11–15), A4 (MEA + AMP; Nos. 16–20), and A5(MEA + PZ; Nos. 21–25). The combination of operating conditions for B, C, D, E, and F are all involved in A1-A5. Considering EF as an example, the mean values for A1, A2, A3, A4, and A5 were 81.55%, 82.67%, 77.40%, 80.31%, and 87.20%, respectively. The sequence of A was found to be A5 > A2 > A1 > A4 > A3, showing that mixed amine (MEA + PZ) for EF was the best. The result also showed that the addition of PZ into MEA could enhance the absorption efficiency of CO2. Likewise, the mean values for other indexes are listed in Table 5. The importance sequence for RA was in the order of A1 > A5 > A2 > A4 > A3, meaning that the rate of absorption of MEA (A1) was the highest. In addition, the importance sequence for KGa in the order of A5 > A1 > A2 > A4 > A3, showing (MEA + PZ) could promote the overall mass transfer coefficient up to 28% as compared with MEA (A1), while the results of other mixed amines were contrary. On average, compared with MEA, the use of MEA + PZ mixed solvent could reduce the scrubber size by about 30%. Finally, the importance sequence for ϕ was in the order of A4 > A5 > A3 > A2 > A1, showing that the addition of DIPA, TEA, AMP, and PZ into MEA could improve the CO2 loading, while MEA + AMP (A4) increased by about 30%. The score for each mixed amine needs to be defined for quantitative comparison. According to the sequence of importance, the corresponding points were 5, 4, 3, 2, and 1. Using EF as an example (A5 > A2 > A1 > A4 > A3), the points for A1, A2, A3, A4, and A5 were 3, 4, 1, 2, and 5, respectively. All the scores and mean values are listed in Table 6. The whole sequence of importance was in the order of A5(4.5) > A1(3.25) > A2(3) > A4(2.75) > A3(1.5). The analysis shows that MEA + PZ (A5) was the best-mixed amine.
Table 5.
Importance sequence analysis for various indicators.
Table 6.
Points for various indicators.
4.3. Taguchi Analysis
Using EF as an example, the S/N (signal/noise) ratio analysis for larger-the-better can be determined by Equation (32):
where n is the number of data and zi is the outcome data such as EF, RA, KGa, and ϕ. Using No. 1 as an example, for A1 mixed solvent, the data for EF presented in Table 5 were 71.05%, 80.26%, 84.00%, 84.42%, and 88.00%, respectively. On substituting these values into Equation (32), A1 was estimated to be 38.1559. In the same method, all S/N ratios were evaluated and are listed in Table 7. The bracket words shown in this table are the maximum values for each factor, which includes the optimum condition, A5B4C5D1E5F5. The ‘DELTA’ value in this table is the difference between the maximum and minimum values of each factor, such as (A5–A3), yielding 1.37. According to the reported data, the parameter sequence was found to be in the order of E > D > A > F > C > B. Using the same analysis, the optimum condition and parameter sequence for other indexes could be determined and are listed in Table 8, in which the mixed amines in optimum conditions were A5, A2, A5, and A1, respectively. This supports the finding presented in Section 3.2 that MEA + PZ is the best amine.
Table 7.
S/N ratio analysis for EF giving optimum condition and parameter significance.
Table 8.
Optimum condition and parameter sequence for all indicators.
Based on points (0–5) analysis for six factors, the importance of parameters among the whole factors became E (4.5) > D (3.75) > C (2.5) = A (2.5) > F (1.5) > B (0.25), showing that the concentration of mixed amine (E) is the most important factor obtained. However, the optimum condition needs to be verified further.
4.4. Verifications of Optimum Conditions
The experiments were performed further according to optimum conditions listed in Table 8 and the results are listed in Table 9. The reported values were 100%, 19.9584 × 10⁻⁴ mol/s·L, 1.1675 1/s, and 0.4148 mol-CO2 /L·mol-solvent for EF, RA, KGa, and ϕ, respectively. The values are listed in bracket words. Compared with Nos. 1–25, the obtained values were all maximum, i.e., the results could be confirmed. This also demonstrates the feasibility of the Taguchi experimental design in this study.
Table 9.
Verifications of optimum conditions.
4.5. Effects of Variables on the Indexes
Figure 6 presents a plot of EF versus γ for different mixed amines. According to the trend, EF decreases with an increase in γ, while mixed amine A5 (MEA + PZ) yielded a higher EF at the same γ, suggesting that PZ can promote mass transfer and, hence, the absorption efficiency. There are two points that affect the γ and hence EF value; one is the resident time of CO2 gas and the other is the solvent molar flow rate. A lower residence time meaning a higher gas flow rate leads to reduce EF, while the EF can be increased when a higher molar flow rate was used. Nonetheless, the EF is also affected by temperature and pH, which are not included in Figure 6a. Therefore, a regression was required to assess the influences of γ, T, and pH on the EF. The results are shown below:
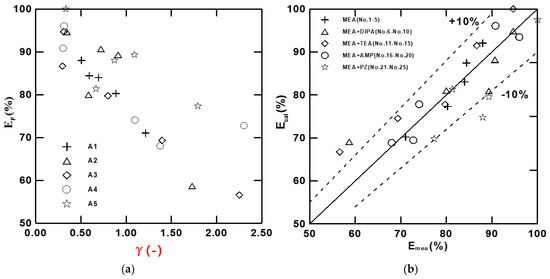
Figure 6.
Effect of parameter on EF: (a) A plot of EF versus γ for different mixed amines. (b) Confidence of Equation (33).
The R2 was found to be 0.7453 (>0.5), indicating that the powder law model is suitable for EF and that the results are reliable. EF increased with an increase in t and pH and decreased with an increase in γ. Figure 6b is a plot of calculated values versus measured values; almost all data were within 10% error, showing the confidence of Equation (33).
A similar regression was also performed for RA and KGa, but the R squares for both were <0.5 showing the differences in solvents. Due to this, the regressions could be carried out for different solvents and were expressed as: . Table 10 and Table 11 show both parameters and R2 for different solvents. A2 and A3 were excluded because R2 < 0.5, and RA decreased with an increase in γ for A1 and decreased with an increase in t for A5. In addition, RA increased with an increase in pH, γ, and t, respectively. According to Figure 7a, a plot of calculated data versus measured data showed that the error limit for most data was within 20%. A2 and A3 showed some scattering data; conversely, for A1, KGa decreased with an increase in γ and KGa and increased with an increase in pH, γ, and t, respectively. Figure 7b shows that a plot of calculated data versus measured data showed that the errors of most data were within 20%. Some scattering data were also observed for A2 and A3. The results also reveal that the effect of terminal pH was more significant for RA and KGa, while that of was γ minor.
Table 10.
Regression parameters of RA for different solvents.
Table 11.
Regression parameters of KGa for different solvents.
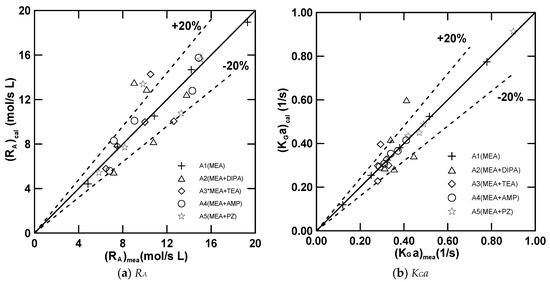
Figure 7.
A plot of calculated value versus measured values for RA and KGa.
4.6. Solvent Regeneration Test
Solvent regeneration tests for four optimum conditions were explored further. The scrubbed solution included two MEA + PZ mixed amines (No. 26 and No. 28), one MEA + DIPA (No. 27) scrubbed solution, and one MEA (No. 29) scrubbed solution. The tested temperatures were set to 100, 110, and 120 °C, separately. The overall heat of regeneration was 3.39–8.45 GJ/t, within the range of 2 GJ/t and 12 GJ/t reported in the literature [13,55,56]. Figure 8a presents a plot of q versus t showing the effect of different solvents on the heat of solvent regenerations. The plots showed that the minimum energy requirement was at 110 °C for mixed solvents, No. 26-No. 28., while the heat of regeneration decreased with a decrease in temperature for No. 29 (MEA single solvent). Comparing No. 26 and No. 28 (both MEA + PZ), at the same factor E (3M) but for factor B, were 20% and 15%, respectively. The final loadings were 0.0866 and 0.1349 mol-CO2/mol-solvent for No. 26 and No. 28, respectively. The heat of regeneration for No. 28 was lower than that for No. 26, suggesting a lower heat of regeneration at higher loading than that at lower loading. A similar result was reported in the literature [13]. The sequence of the heat of regeneration was in the order of MEA > MEA + PZ > MEA + DIPA (Figure 6).
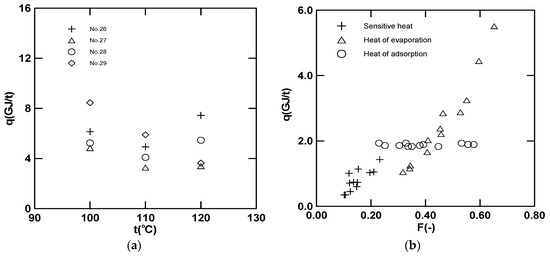
Figure 8.
Heat of regeneration and mechanism. (a) A plot of q versus t at different scrubbed solutions. (b) A plot of q versus F showing individual required energy distribution.
The results of individual energy estimation revealed that qsen were in the range 0.45–1.43 GJ/t, qsol were in the range 1.04–5.51 GJ/t, and qads were in the range of 1.83–1.93 GJ/t. The fractions (F) of individual required energies were in the range of 0.102–0.232, 0.317–0.652, and 0.229–0.577 for qsen, qsol, and qads, respectively. For further discussion, the distribution in individual energy was plotted and is shown in Figure 8b, wherein qsen and qsen both increase with an increase in F, while qads causes a small change in F in the range of 0.229–0.577. When F > 0.4, the energy required was in the order of qsol > qads > qsen. Three major choices were found to decrease q: one is selecting a lower heat of absorption solvent; second, using a higher concentration solvent to reduce the heat of evaporation; third, an increase in γ, which can increase CO2 loading and hence decreasing q.
5. Conclusions
Using the Taguchi experimental design, the experimental number of runs could be reduced from 15,625 to 25, cutting the experimental cost up to 99.84%. A continuous bubble-column scrubber was successfully used to assess the performance of mixed solvents. Solvent regeneration tests were also carried out. It is a shortcut and also a quick method to obtain the best solvent, optimum condition, and the order of parameter importance. Based on the six factors analysis here, the importance of parameters of the whole factors was found to be in the order of E > D >C = A > F > B, showing the concentration of mixed amine (E) is the most significant factor, while the ratio of mixed amine is a minor one. The priority sequence of mixed amine was found to be in the range of A5 > A1 > A2 > A4 > A3, and the regeneration energy was in the range of A1> A5 > A2, showing that A5 (MEA + PZ) is the best solvent. The absorption efficiency could be controlled to a higher value (>90%) when γ < 0.5. The sequence of promoting the CO2 loading was AMP > PZ > TEA > DIPA. According to overall mass-transfer coefficients, the scrubber size could be reduced by 30% when using A5 (MEA + PZ) mixed amine as compared with A1 (MEA) solvent. Alternatively, the indexes were expressed in terms of pH, γ, and t with different parameters, depending on the mixed solvent used. The better conditions were found to be B = 15–20%, C = 250–350 mL/min, D = 4–12 L/min, and E = 3 M; F = 40–45 °C. In addition, the minimum heat of regeneration was achieved when the operating heating temperature was 110 °C. The individual energy required was in the sequence of qsol > qads > qsen when F > 0.4. The heat of regeneration of scrubbed solutions could be controlled under 3 GJ/t or lower when increasing the concentration of mixed amines or using a solvent with a lower heat of absorption.
Author Contributions
Conceptualization, P.-C.C.; methodology, P.-C.C.; software, P.-C.C. and J.-H.J.; validation, T.-W.W., C.-Y.Y., K.-Y.W. and C.-M.C.; formal analysis, T.-W.W., C.-Y.Y., K.-Y.W. and C.-M.C.; investigation, J.-H.J., T.-W.W., C.-Y.Y., K.-Y.W. and C.-M.C.; resources, P.-C.C.; data curation, P.-C.C.; writing—original draft preparation, P.-C.C., T.-W.W., C.-Y.Y., K.-Y.W. and C.-M.C. All authors have read and agreed to the published version of the manuscript.
Funding
This research was funded by MOST, Taiwan, grant number 110-2221-E-262-003.
Institutional Review Board Statement
Not applicable.
Informed Consent Statement
We understand the general purposes, risks and methods of this research. We consent to participate in the research project and the following has been explained to me: the research may not be of direct benefit to us.
Data Availability Statement
Data are available on request only due to ethical, legal or commercial reasons.
Conflicts of Interest
The authors declare no conflict of interest.
References
- Special Report on Global Warming of 1.5 °C. Available online: https://en.wikipedia.org/wiki/Special_Report_on_Global_Warming_of_1.5_%C2%B0C (accessed on 5 June 2023).
- Gabrielli, P.; Poluzzi, A.; Kramer, G.J.; Spiers, C.; Mazzotti, M.; Gazzani, M. Seasonal energy storage for zero-emissions multi-energy systems via underground hydrogen storage. Renew. Sustain. Energy Rev. 2020, 121, 109629. [Google Scholar] [CrossRef]
- Cuéllar-Franca, R.M.; Azapagic, A. Carbon capture, storage and utilization technologies: A critical analysis and comparison of their life cycle environmental impacts. J. CO2 Util. 2015, 9, 82–102. [Google Scholar] [CrossRef]
- Han, K.; Ahn, C.K.; Lee, M.S. Performance of an ammonia-based CO2 Capture pilot facility in iron and steel industry. Int. J. Greenh. Gas Control 2014, 27, 239–246. [Google Scholar] [CrossRef]
- Weng, W.; Tang, L.; Xiao, W. Capture and electro-splitting of CO2 in molten salts. J. Energy Chem. 2019, 28, 128–143. [Google Scholar] [CrossRef]
- Jiang, R.; Gao, M.; Mao, X.; Wang, D. Advancements and potentials of molten salt CO2 capture and electrochemical transformation (MSCC-ET) process. Curr. Opin. Electrochem. 2019, 17, 38–46. [Google Scholar] [CrossRef]
- Ratso, S.; Walke, P.R.; Mikli, V.; Locs, J.; Smits, K.; Viota, V.; Sutka, A.; Kruusenberg, I. CO2 turned into a nitrogen doped carbon catalyst for fuel cells and metal-air battery applications. Green Chem. 2021, 23, 4435–4445. [Google Scholar] [CrossRef]
- Feron, P.H.M. The potential for improvement of the energy performance of pulverized coal fired power stations with post-combustion capture of carbon dioxide. Energy Procedia 2009, 1, 1067–1074. [Google Scholar] [CrossRef]
- Badea, A.A.; Dinca, C.F. CO2 capture from post-combustion gas by employing MEA absorption process–experimental investigation for pilot studies. Univ. Politeh. Buchar. Sci. Bull. Ser. D Mech. Eng. 2012, 74, 1454–2358. [Google Scholar]
- Yu, C.H.; Huang, C.H.; Tan, C.S. A Review of CO2 Capture by absorption and adsorption. Aerosol Air Qual. Res. 2012, 12, 745–769. [Google Scholar] [CrossRef]
- Stec, M.; Tatarczuk, A.; Cław-Solny, L.W.; Krotki, A.; Spietz, T.; Wilk, A.; Spiewak, D. Demonstration of a post-combustion carbon capture pilot plant using amine-based solvents at the Łaziska Power Plant in Poland. Clean Techn. Environ. Policy 2016, 18, 151–160. [Google Scholar] [CrossRef]
- Kim, I.; Hoff, K.A.; Mejdell, T. Heat of absorption of CO2 with aqueous solutions of MEA: New experimental data. Energy Procedia 2014, 63, 1446–1455. [Google Scholar] [CrossRef]
- Zhang, X.; Fu, K.; Liang, Z.; Yang, Z.; Rongwong, W.; Na, Y. Experimental studies of regeneration heat duty for CO2 desorption from aqueous DETA solution in a randomly packed column. Energy Procedia 2014, 63, 1497–1503. [Google Scholar] [CrossRef]
- Lopez, A.B.; La Rubia, M.D.; Navaza, J.M.; Pacheco, R.; Gomez-Dıaz, D. Characterization of MIPA and DIPA aqueous solutions in relation to absorption, speciation and degradation. J. Ind. Eng. Chem. 2015, 21, 428–435. [Google Scholar] [CrossRef]
- Choi, B.K.; Kim, S.M.; Lee, J.S.; Park, Y.C.; Chun, D.H.; Shin, H.Y.; Sung, H.J.; Min, B.M.; Moon, J.H. Effect of blending ratio and temperature on CO2 solubility in blended aqueous solution of monoethanolamine and 2-amino-2-methyl-propanol: Experimental and modeling study using the electrolyte nonrandom two-liquid model. ACS Omega 2020, 5, 28738–28748. [Google Scholar] [CrossRef]
- Kumar, P.S.; Hogendoorn, J.A.; Versteeg, G.F.; Feron, P.H.M. Kinetics of the reaction of CO2 with aqueous potassium salt of Taurine and Glycine. AIChE J. 2003, 49, 203–213. [Google Scholar] [CrossRef]
- Chen, P.C.; Lin, S.Z. Optimization in the absorption and desorption of CO2 using sodium glycinate solution. Appl. Sci. 2018, 8, 2041. [Google Scholar] [CrossRef]
- Diao, Y.F.; Zheng, X.Y.; He, B.S.; Chen, C.H.; Xu, X.C. Experimental study on capturing CO2 greenhouse gas by ammonia scrubbing. Energy Convers. Manag. 2004, 45, 2283–2296. [Google Scholar] [CrossRef]
- Yeh, J.T.; Resnik, K.P.; Rygle, K.; Pennline, H.W. Semi-batch absorption and regeneration studies for CO2 capture by aqueous ammonia. Fuel Process. Technol. 2005, 86, 1533–1546. [Google Scholar] [CrossRef]
- Chen, P.C. Absorption of carbondioxide in a bubble-column scrubber. In Greenhouse GASES—Capturing, Utlization and Reduction; InTech: Houston, TX, USA, 2012; Chapter 5; pp. 95–116. [Google Scholar]
- Borhani, T.N.G.; Azarpour, A.; Akbari, V.; Alwi, S.R.W.; Manan, Z.A. CO2 capture with potassium carbonate solutions: A state-of-the-art review. Int. J. Greenh. Gas Control 2015, 41, 142–162. [Google Scholar] [CrossRef]
- Bishnoi, S.; Rochelle, G.T. Absorption of carbon dioxide into aqueous piperazine: Reaction kinetics, mass transfer and solubility. Chem. Eng. Sci. 2000, 55, 5531–5543. [Google Scholar] [CrossRef]
- Aroonwilas, A.; Veawab, A. Integration of CO2 capture unit using blended MEA-AMP solution into coal-fired power plants. Energy Procedia 2009, 1, 4315–4321. [Google Scholar] [CrossRef]
- Mangalapally, H.P.; Notz, R.; Hoch, S.; Asprion, N.; Sieder, G.; Garcia, H.; Hasse, H. Pilot plant experimental studies of post combustion CO2 capture by reactive absorption with MEA and new solvents. Energy Procedia 2009, 1, 963–970. [Google Scholar] [CrossRef]
- Adeosun, A.; Hadri, N.E.; Goetheer, E.; Abu-Zahra, M.R.M. Absorption of CO2 by amine blends solution: An experimental evaluation. Int. J. Eng. Sci. 2013, 3, 12–23. [Google Scholar]
- Dash, S.K.; Samanta, A.N.; Bandyopadhyay, S.S. Simulation and parametric study of post combustion CO2 capture process using (AMP + PZ) blended solvent. Int. J. Greenh. Gas Control 2014, 21, 130–139. [Google Scholar] [CrossRef]
- Nwaoha, C.; Idem, R.; Supap, T.; Saiwan, C.; Tontiwachwuthikul, P.; Rongwong, W.; Al-Marri, M.J.; Benamor, A. Heat duty, heat of absorption, sensible heat and heat of vaporization of 2–amino–2–methyl–1–propanol (AMP), piperazine (PZ) and monoethanolamine (MEA) tri–solvent blend for carbon dioxide (CO2) capture. Chem. Eng. Sci. 2017, 170, 26–35. [Google Scholar] [CrossRef]
- Ali Khan, A.; Halder, G.; Saha, A.K. Kinetic effect and absorption performance of piperizine activator into aqueous solutions of 2-amino-1-methyl-1-propanol through post-combustion CO2 capture. Korean J. Chem. Eng. Eng. 2019, 63, 1090–1101. [Google Scholar] [CrossRef]
- Lai, Q.; Kong, L.; Gong, W.; Russell, A.G.; Fa, M. Low-energy-consumption and environmentally friendly CO2 capture via blending alcohols into amine solution. Applied Energy 2019, 254, 113696. [Google Scholar] [CrossRef]
- Chen, P.C.; Luo, Y.X.; Cai, P.W. CO2 capture using monoethanolamine in a bubble-column scrubber. Chem. Eng. Technol. 2015, 38, 274–282. [Google Scholar] [CrossRef]
- Hwang, K.S.; Park, S.W.; Park, D.W.; Oh, K.J.; Kim, S.S. Absorption of carbon dioxide into diisopropanolamine solutions of polar organic solvents. J. Taiwan Inst. Chem. Eng. 2010, 41, 16–21. [Google Scholar] [CrossRef]
- Wanderley, R.R.; Ponce, G.J.C.; Knuutila, H.K. Solubility and heat of absorption of CO2 into diisopropylamine and N,N-diethylethanolamine mixed with organic solvents. Energy Fuels 2020, 34, 8552–8561. [Google Scholar] [CrossRef]
- Mun, J.H.; Shin, B.J.; Kim, S.M.; You, J.K.; Park, Y.C.; Chun, D.H.; Lee, J.S.; Min, B.M.; Lee, U.; Kim, K.M.; et al. Optimal MEA/DIPA/water blending ratio for minimizing regeneration energy in absorption-based carbon capture process: Experimental CO2 solubility and thermodynamic modeling Author links open overlay panel. Chem. Eng. J. 2022, 444, 136523. [Google Scholar] [CrossRef]
- Chakma, A.; Lemonier, J.P.; Chornet, E.; Overend, R.P. Absorption of CO2 by aqueous triethanolamine (TEA) solutions in a high shear jet absorber. Gas Sep. Purif. 1989, 3, 65–70. [Google Scholar] [CrossRef]
- Gómez-Díaz, D.; López, A.B.; La Rubia García, M.D.; Pacheco, R.; Gómez-Díaz, D. Carbon dioxide absorption in triethanolamine aqueous solutions: Hydrodynamics and Mass Transfer. Chem. Eng. Technol. 2014, 37, 419–426. [Google Scholar]
- Liu, B.; Cui, Z.; Tian, W. The kinetics investigation of CO2 absorption into TEA and DEEA amine solutions containing carbonic anhydrase. Processes 2021, 9, 2140. [Google Scholar] [CrossRef]
- Versteeg, G.F.; Dijck, L.A.J.; Swaaij, W.P.M. On the kinetics between CO2 and Alkaloamines both in aqueous and non-aqueous solutions. An overview. Chem. Eng. Comm. 1996, 144, 113–158. [Google Scholar] [CrossRef]
- Vaidya, P.D.; Kenig, E.Y. Absorption of CO2 into aqueous blends of alkanolamines prepared from renewable resources. Chem. Eng. Sci. 2007, 62, 7344–7350. [Google Scholar] [CrossRef]
- Vaidya, P.D.; Kenig, E.Y. CO2-alkanomine reaction kinetics: A review of recent work. Chem. Eng. Technol. 2007, 30, 1467–1474. [Google Scholar] [CrossRef]
- Cullinane, J.T.; Rochelle, G.T. Kinetics of carbon dioxide absorption into aqueous potassium carbonate and piperazine. Ind. Eng. Chem. Res. 2006, 45, 2531–2545. [Google Scholar] [CrossRef]
- Xiao, J.; Li, C.C.; Li, M.H. Kinetics of absorption of carbon dioxide into aqueous solutions of 2-amino-2-methyl-1-propanol+monoethanolamin. Chem. Eng. Sci. 2000, 55, 161–175. [Google Scholar] [CrossRef]
- Khalili, F.; Rayer, A.V.; Henni, V.; East, A.L.L.; Tontiwachwuthikul, P. Kinetics and dissociation constants (pKa) of polyamines of importance in post-combustion carbon dioxide (CO2) capture studie. In Recent Advances in Post-Combustion CO2 Capture Chemistry; Attalla, M., Ed.; ACS Symposium Series; American Chemical Society: Washington, DC, USA, 2012; Chapter 3. [Google Scholar]
- Esmaeili, A.; Liu, Z.; Xiang, Y.; Yun, J.; Shao, L. Assessment of carbon dioxide separation by amine solutions using electrolyte non-random two-liquid and Peng-Robinson models: Carbon dioxide absorption efficiency. J. Constr. Mater. 2021, 2, 3–10. [Google Scholar] [CrossRef]
- Derks, P.W.J.; Kleigeld, T.; van Aken, C.; Hogendoorn, J.A.; Versteeg, G.F. Kinetics of absorption of carbon dioxide in aqueous piperazine solutions. Chem. Eng. Sci. 2006, 61, 6837–6854. [Google Scholar] [CrossRef]
- Little, R.J.; Versteeg, G.F.; van Swaaij, W.P.M. Kinetics of CO2 with primary and secondary amines in aqueous solutions-II. Influence of temperature and zwitterion formation and deprotonation rates. Chem. Eng. Sci. 1992, 47, 2037–2943. [Google Scholar] [CrossRef]
- Levenspiel, O. Chemical Reaction Engineering, 3rd ed.; John Wiley & Sons: Hoboken, NJ, USA, 1999. [Google Scholar]
- Mirzaei, S.; Shamiri, A.; Aroua, M.K. A review of different solvents, mass transfer, and hydrodynamics for postcombustion CO2 capture. Rev. Chem. Eng. 2015, 31. [Google Scholar] [CrossRef]
- Schlager, M.; Haushofer, G.; Triebl, A.; Wolf-Zöllner, V.; Lehner, M. Determination of volumetric mass transfer coefficients of structured packings at two different column diameters. Chem. Eng. Res. Des. 2022, 186, 462–472. [Google Scholar] [CrossRef]
- Tong, D.; Martin Trusler, J.P.; Maitland, G.C.; Gibbins, J.; Fennell, P.S. Solubility of carbon dioxide in aqueous solution of monoethanolamine or 2-amino-2-methyl-1-propanol: Experimental measurements and modeling. Int. J. Greenh. Gas Control 2012, 6, 37–47. [Google Scholar] [CrossRef]
- Chiu, L.F.; Li, M.H. Heat capacity of alkanolamine aqueous solutions. J. Chem. Eng. Data 1999, 44, 1396–1401. [Google Scholar] [CrossRef]
- Eller, K.; Henkes, E. Ullmann’s Encyclopedia of Industrial Chemistry, 7th ed.; John Wiley & Sons: New York, NY, USA, 2005. [Google Scholar]
- Elhajj, J.; Al-Hindi, M.; Azizi, F. A Review of the absorption and desorption processes of carbon dioxide in water systems. Ind. Eng. Chem. Res. 2014, 53, 2–22. [Google Scholar] [CrossRef]
- Ojala, M.S.; Serrano, N.F.; Uusi-Kyyny, P.; Alopaeus, V. Comparative study: Absorption enthalpy of carbon dioxide into aqueous diisopropanolamine and monoethanolamine solutions and densities of the carbonated amine solutions. Fluid Phase Equilibria 2014, 376, 85–95. [Google Scholar] [CrossRef]
- Kim, E.K.; Yun, S.H.; Xhoi, J.H.; Nam, S.C.; Park, S.Y.; Jeong, S.K.; Yoon, Y.I. Comparison of CO2 absorption characteristics of aqueous solutions of diamines: Absorption capacity, specific heat capacity, and heat of absorption. Energy Fuels 2015, 29, 2582–2590. [Google Scholar] [CrossRef]
- Mangalapally, H.P.; Hasse, H. Pilot plant experiments for post combustion carbon dioxide capture by reactive absorption with novel solvents. Energy Procedia 2011, 4, 1–8. [Google Scholar]
- Li, T.; Keener, T.C. A review: Desorption of CO2 from rich solutions in chemical absorption processes. Int. Greenh. Gas Control 2016, 51, 290–304. [Google Scholar] [CrossRef]


Disclaimer/Publisher’s Note: The statements, opinions and data contained in all publications are solely those of the individual author(s) and contributor(s) and not of MDPI and/or the editor(s). MDPI and/or the editor(s) disclaim responsibility for any injury to people or property resulting from any ideas, methods, instructions or products referred to in the content. |
© 2023 by the authors. Licensee MDPI, Basel, Switzerland. This article is an open access article distributed under the terms and conditions of the Creative Commons Attribution (CC BY) license (https://creativecommons.org/licenses/by/4.0/).