Abstract
Honeybees pollinate over 75% of the total food resources produced annually, and they produce valuable hive products, such as bee pollen, propolis, and royal jelly. However, species such as the Asian hornet (Vespa velutina) feed on more than 85% of honeybees, causing a decline in their population and considerable damage to beekeepers in Korea. To prevent damage to honeybees, a portable real-time monitoring system was developed that detects V. velutina individuals and notifies users of their presence. This system was designed with a focus on portability and ease of installation, as V. velutina can be found in various areas of apiary sites. To detect V. velutina, an improved convolutional neural network YOLOv5s was trained on 1960 high-resolution () image data. At the confidence threshold of ≥0.600 and intersection over the union of ≥0.500, the performance of the system in terms of detection accuracy, precision, recall, F1 score, and mean average precision was high. A distance-based performance comparison showed that the system was able to detect V. velutina individuals while monitoring three beehives. During a field test of monitoring three beehives, the system could detect 83.3% of V. velutina during their hunting activities and send alarms to registered mobile application users.
1. Introduction
Honeybees are one of the most ecologically dominant insects, accounting for over half of the global insect biomass [1]. They also provide important ecosystem services as pollinators by increasing the yield of 75% of crops worldwide [2]. However, honeybee colonies are declining due to factors such as land-use intensification, climate change, the spread of invasive species, and the spread of diseases [3]. Wasp species, including Vespa analis, V. mandarinia, V. dybowskii, V. ducalis, V. crabro flavofasciata, V. simillima simillima, and V. simillima xanthoptera, have inhabited Korean apiary sites, and the discovery of V. velutina in Busan in 2003 has increased the total number of wasp species to eight [4,5]. Among the eight species, V. velutina was originally distributed in a wide area from southeastern China to northern India. However, it has rapidly spread to Europe and other Asian regions. In 2004, it was introduced to southwestern France, followed by Spain in 2010, Portugal and Belgium in 2011, Italy and Japan in 2012, Germany in 2014, and finally, the United Kingdom in 2016 [6,7]. In Korea, the spread of wasps is slow due to competition for food and habitat among these wasp species. Initially, the spread of V. velutina was not a major concern as it coexisted with the highly predatory V. mandarinia. However, its habitat range has been expanding from Busan, where it was first discovered. Among approximately 480,000 requests to remove wasp nests from 2010–2014 in South Korea, the requests to remove V. velutina nests were the highest among those for all Vespa species [8]. The venom of V. velutina is lethal not only to insects but also to humans. Since the invasion of V. velutina, two deaths have been reported in France and South Korea each [9]. In addition, V. velutina is known for extensively preying on honeybees (especially Apis mellifera), syrphid flies, social wasps, and other pollinators. Their presence at honeybee hives can suppress foraging activity, leading to decreased honey yields and increased winter mortality. Additionally, their intense predation of insects on flowers can negatively impact the overall pollination of plants [6]. Moreover, as more than 85% of V. velutina’s prey consists of honeybees, the increase in its population has led to a significant rise in damage to Korean beekeepers [10]. It is all the more devastating as honeybees are unable to defend themselves against V. velutina’s hunting strategy of preying on individual bees, which implies that even a single V. velutina can cause considerable damage to apiaries [11,12]. The methods used in Korean apiaries to control wasp populations include pesticide repatriation and vespa traps; however, these methods do not specifically target V. velutina. Meanwhile, research on using honeybee extracts to lure and capture V. velutina individuals and queen bees to reduce their number has proved to be effective because some queen bees build nests called “embryo nests,” where the population can grow to thousands of individuals [13,14,15]. However, some V. velutina individuals cannot be lured in this way. To address this problem, a real-time image data analysis system was developed to immediately notify users of the presence of V. velutina to enable a prompt response.
In the past, object recognition using image data was performed using computer vision-based local feature-matching methods that classified objects or located their positions. This involved developers selecting feature points and extracting feature vectors using local scale-invariant feature detection methods. Recognition rates were improved using a support vector machine, which is one of the early machine learning methods [16,17,18,19]. Unlike these classical machine learning methods, deep learning algorithms do not require selecting feature points to optimize feature extraction and classification. With the emergence of convolutional neural networks (CNNs), spatial information in image data are maintained while simultaneously optimizing feature extraction and classification. This has led to the development of several deep learning algorithms, including AlexNet, GoogLeNet, and you only look once (YOLO). CNN-based deep learning models have outperformed classical machine learning methods in object recognition using image data [20,21,22]. The YOLOv1 algorithm used in this study was first introduced in 2015. The speed of YOLOv1 was improved in YOLOv2 using Darknet-19 as the backbone, and its performance was improved using various methods such as batch normalization, high-resolution classification, convolution with anchor boxes, dimension clusters, and direct location prediction. YOLOv3 changed the backbone to Darknet-53 and improved the detection rate of small objects using the predicting across scales method. YOLOv4 was then released as a result of further experiments and applications, including a bag of freebies, to achieve higher accuracy, and YOLOv5 is the current version [23,24,25]. As new versions of the YOLO algorithm were released, the detection performance for small objects improved, and the algorithm became capable of detecting multiple objects simultaneously.
In general, V. velutina appears smaller than people or objects in image data. Therefore, the s-model of YOLOv5 (YOLOv5s) with improved detection performance for small-sized objects was used in this study to develop a model for detecting V. velutina individuals in image data. In addition, a mobile application was developed to implement a function that immediately informs users when V. velutina individuals appear. The supply model for apiaries was designed in a detachable system to ensure portability and installation convenience.
2. Materials and Methods
2.1. System Configuration and Operation Process
The system developed in this study consists of image analysis and communication parts that can be installed on-site, an app that can be installed on the user’s smartphone, and a server that supports communication between these two systems. The image analysis part is mounted with an image analysis device and an image acquisition device. Most deep learning models show better processing performance when using GPUs instead of CPUs [26]. Therefore, the image analysis device was equipped with NVIDIA Jetson Xavier NX, which has 48 Tensor Cores, 384 CUDA Cores, and a 16 GB 128-bit LPDDR4x memory. The image acquisition device, which is connected to the image analysis device, captures resolution image data at a rate of 30 frames per second and sends it to the image analysis device. The image analysis device performs real-time display, V. velutina object detection, and image data network transmission using the real-time streaming protocol (RTSP) and stores image data in a USB. Performing object detection for each frame of image data in the image analysis device can cause a bottleneck in the system. To solve this issue, V. velutina detection was configured to be performed once every 10 frames of acquired image data, i.e., three times per second. At the bottom of the image analysis part, HDMI, LAN, and power connectors that can be connected to the communication part and USB 3.0 terminals that can connect additional storage are placed. Furthermore, the communication part is equipped with a monitor that can be connected to the image analysis device, an LTE router, and a power supply device to supply power to the system. A 220 AC external power source is connected to the power supply device, and DC power is supplied after passing through an AC–DC converter. At the bottom of the communication part, an HDMI cable that can be connected to the image analysis part, a LAN connector, and AC input and DC output connectors for the power supply are placed. Both the image analysis and communication parts are made with waterproof connectors considering that they are installed outdoors. The application is installed on the user’s mobile phone and provides functions for field monitoring and alarms when V. velutina appears. In addition, it is possible to set the alarm resending time and manage registered devices in the application, monitor each registered device, and check the history of V. velutina detection. The server acts as a communication relay between the image analysis device and the mobile application and stores image data in which V. velutina was detected (Figure 1).

Figure 1.
Deep learning-based portable real-time V. velutina detection image analysis system: (a) Portable system; (b) Block diagram of the system.
The system automatically starts detecting V. velutina once power is supplied. The image analysis device acquires image data at a resolution of through the connected image acquisition device and converts it to . This downsampling is performed to reduce the size of the acquired image data, thereby decreasing the transmission time. Real-time image data transmission is then performed using the RTSP. The pre-trained YOLOv5s algorithm is used to detect V. velutina objects in the original image data. When a V. velutina object is detected in image data, the algorithm converts the image data that display it to a resolution of 640 × 480 and transmits it to the server in JavaScript Object Notation format. The server stores the received image data in the database and sends a notification to the registered mobile app users. Upon checking the alarm, users can run the app to view the V. velutina detection image data stored in the server’s database. Additionally, real-time monitoring of image data transmitted via RTSP is possible (Figure 2).
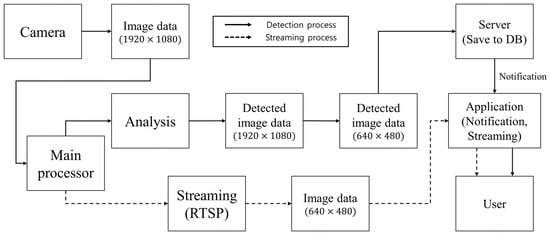
Figure 2.
Block diagram of the operation process of the V. velutina detection system.
2.2. Image Data Acquisition for the Training of YOLOv5s
While the human eye can distinguish between bees and V. velutina by size, a camera renders nearby objects larger and distant objects smaller. Therefore, various sizes of V. velutina image data were obtained by adjusting the distance and angle between the camera and the beehive (Figure 3).
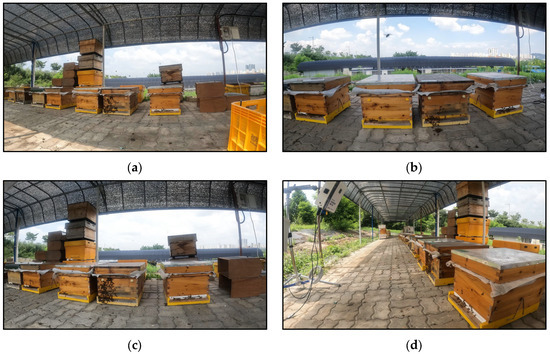
Figure 3.
Acquired dataset for YOLOv5s training. (a–c) Image data acquired by adjusting the distance; (d) image data acquired by adjusting the angle.
Image data were acquired using GoPro Hero 6 (GoPro, San Mateo, CA, USA) at the apiary of the National Institute of Agricultural Sciences. First, data from 2358 images were acquired, and the training and performance of YOLOv5s for detecting V. velutina were evaluated. Additionally, 953 image data were acquired to set the V. velutina detection range of this system to include one, two, and three beehives in image data, with the distance between the camera and each beehive set at 40, 55, and 90 cm, respectively (Figure 4). As a result, 347, 273, and 333 image data, including one, two, and three beehives, respectively, were obtained.
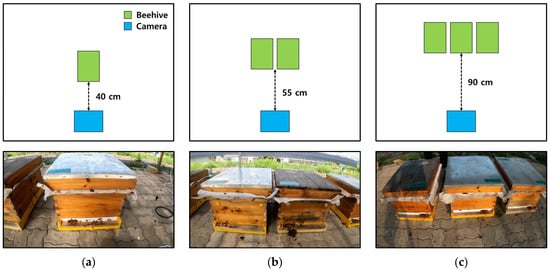
Figure 4.
Distance between the beehive and camera. Image data for setting the range of system detection: Image data including (a) one beehive (distance = 40 cm); (b) two beehives (distance = 55 cm); (c) three beehives (distance = 90 cm).
Image data for the training of YOLOv5s and those for setting the detection range of the system were preprocessed using a coordinate data generation program (LabelImg v.1.8.6, MIT). During the preprocessing, the coordinate values of V. velutina included in the image data were saved as a text file.
2.3. Deep Learning Model
Deep learning algorithms for object detection in image data can be categorized into one- and two-stage methods. One-stage algorithms localize and classify the detected object simultaneously. Examples of one-stage algorithms are the single-shot detector (SSD) and YOLO [22,23,24,25,27]. In contrast, two-stage algorithms perform object localization first, followed by classification. Examples of two-stage algorithms include R-CNN, Fast R-CNN, and Faster R-CNN [28,29,30]. In general, one-stage algorithms have faster processing speeds but lower accuracy compared to the two-stage approach. Iyer et al. evaluated the performance of real-time object detection by YOLOv3, YOLOv5s, and MobileNet-SSD V2 and showed that the real-time object detection performance of YOLOv5s was superior to that of SSD [31].
The proposed system performs real-time image analysis and transmission via RTSP simultaneously using the image analysis device Jetson Xavier NX. Therefore, YOLOv5s was selected because of its fast processing speed. YOLOv5s divides input image data into grid cells, and if an object’s center is present in a grid cell, it is detected by that grid cell. Each grid cell predicts number of bounding boxes and the confidence score for each bounding box. The confidence score is an indicator of the model’s certainty in the detection and represents the probability that each bounding box contains an object and the accuracy of the predicted bounding box (). The confidence score calculation formula is expressed by Equations (1) and (2).
When an object is present, each grid cell also calculates the probability of each class . Then, the detection of objects in image data is performed by multiplying the confidence score for each bounding box with the corresponding probability of each class, as shown in Equation (3).
because can represent the same mathematical expression. represents the probability that the object contained in the grid cell belongs to [22].
The biggest change in YOLOv5 is the implementation of CSP-Darknet using PyTorch, replacing the backbone, which was previously implemented in C language. The primary function of the backbone is to convert input image data into feature maps through convolutional operations (Conv, C3). The neck upsamples feature maps and concatenates (Concat) them with other feature maps to harmonize the features extracted from the backbone. The head is responsible for performing localization and classification. Due to the multiple feature maps generated by the neck, YOLOv5 can effectively detect multiple objects in a single image.
2.4. Performance Evaluation of YOLOv5s
YOLOv5s was trained on a PC equipped with an Intel i7-11700K 3.60 GHz CPU, DDR4 128 GB RAM, and NVIDIA GeForce RTX 3080Ti 12 GB, using 1960 out of 2358 image data (83.1%). The hyperparameters used were as follows” epoch: 300, batch size: 2, img_size: 1920, and optimizer: Adam. With image data obtained from the image acquisition device in the image analysis part measuring , the img_size was set to 1920. The predicted results of a model can be compared with the actual values using a confusion matrix. Thus, a confusion matrix is used to evaluate the performance of an object detection model. True positive (TP) represents the number of values correctly classified as the positive class, whereas false positive (FP) represents the number of values incorrectly classified as the positive class but actually belonging to the negative class. Likewise, true negative (TN) represents the number of values correctly classified as the negative class, whereas false negative (FN) represents the number of values incorrectly classified as the negative class but actually belonging to the positive class. The values in the confusion matrix allow us to evaluate three measures: accuracy, precision, and recall. Accuracy is the ratio of TPs and TNs to all samples and indicates how accurately the deep learning model predicts true and false samples (Equation (4)).
The V. velutina detection model trained in this study is designed to locate the actual object’s location without separately detecting cases in which there is no object. Therefore, the TN item is not used. Precision is the ratio of TP to all predicted positives, indicating the prediction accuracy of the deep learning model (Equation (5)).
Recall is the ratio of TP to all actual positives, indicating how well the deep learning model detects objects of interest (Equation (6)).
Another method to evaluate performance is the mean average precision (mAP), which is the average of the AP values for each class. A higher mAP indicates a higher object detection accuracy. The precision–recall (P–R) curve displays the recall (X-axis) and precision (Y-axis) values based on the confidence threshold. The AP value can be obtained by calculating the area under the P–R curve, which shows how precision values change with respect to recall values. That is, the P–R curve allows us to check the precision value based on the change in the recall value, and the AP value can be obtained by calculating the area of the P–R curve.
Finally, the F1 score is the harmonic mean of the precision and recall values, with the two measures evenly weighted (Equation (7)).
2.5. Field Testing
The system was installed at an apiary located at the National Agricultural Science Institute for field testing. For field testing, cameras were installed at a distance of 90 cm to monitor three beehives. The operation of V. velutina detection started after verifying that the camera was acquiring image data with a normal resolution (1920 × 1080). Considering that the quality of image data obtained by the image acquisition device varies depending on the position of the sun, field testing was conducted under two conditions: with and without direct sunlight. In addition, the detection of V. velutina was analyzed based on the appearance time.
3. Results
3.1. Outcome of Training of YOLOv5s
A total of 215 training epochs were conducted using the early stopping feature, which stops the training process when the degree of change in the loss value is negligible (Figure 5).
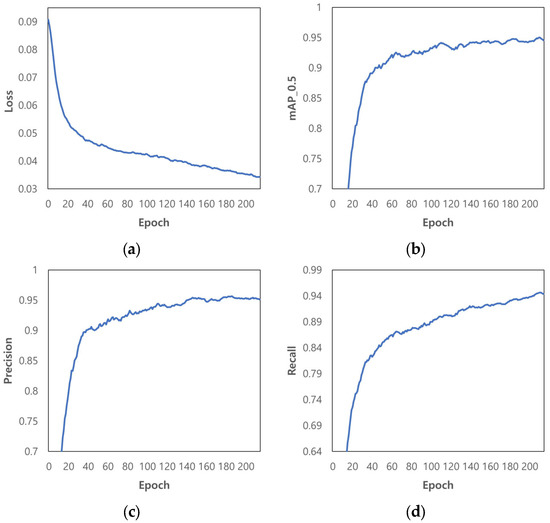
Figure 5.
Outcome of training of YOLOv5s: (a) Loss; (b) mAP (IoU 0.500); (c) Precision; (d) Recall.
Training results of the model in terms of loss, mAP_0.5, precision, and recall were 0.034, 0.95, 95.4%, and 94.6%, respectively (Figure 5a–d). Loss decreased, and mAP_0.5, precision, and recall increased as the training progressed. The performance evaluation of the model was conducted using test data from 398 images. At the confidence threshold of ≥0.600 and intersection over union (IoU) of ≥0.500, the V. velutina detection accuracy of the pre-trained YOLOv5s model was 92.3%, with a TP, FP, FN, TN, precision, recall, F1 score, and mAP_0.5 of 411, 8, 26, 0, 98.0%, 94.0%, 0.959, and 0.959, respectively.
3.2. Performance Evaluation of YOLOv5s Based on Detection Range
As beekeepers typically place two or three beehives close together, we conducted tests to determine the detection range of the system. For performance evaluation, image data with one, two, or three beehives within the detection range were used. The performance levels of YOLOv5s based on the detection range at the confidence threshold of ≥0.600 and IoU of ≥0.500 are as follows (Table 1; Figure 6).

Table 1.
Results of performance evaluation based on detection range.
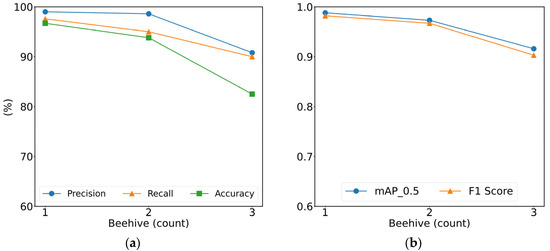
Figure 6.
Comparison of performances based on detection range: (a) Precision, recall, and accuracy; (b) mAP_0.5 and F1 score.
In image data with one beehive, 2–3 V. velutina objects per hive appeared, resulting in more labels and, consequently, a higher TP rate compared to images with two or three beehives. Additionally, the shorter the distance between the camera and the beehive, the larger the size of the V. velutina objects included in the image data, resulting in a higher detection rate. The detection accuracy for three hives was 82.5%, which is lower than those of one and two beehives (96.7 and 93.8%, respectively). This trade-off indicates that accuracy increases as the distance decreases and vice versa. However, V. velutina could be detected even when monitoring three beehives, with both precision and recall exceeding 90.0% and the mAP_0.5 and F1 score exceeding 0.900. Another advantage is that the detection range becomes wider as the distance increases. Therefore, we decided to monitor three beehives with a larger detection range. Figure 7 shows the detection results for image data containing one, two, or three beehives.
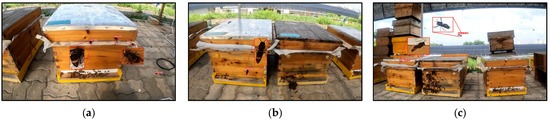
Figure 7.
Results of detection of V. velutina based on detection range: (a) One beehive image data, confidence 0.880 and 0.910; (b) Two beehive image data, confidence 0.910; (c) Three beehive image data, confidence 0.710 and 0.760.
3.3. Field Testing
The results demonstrate that the detection of V. velutina occurred in both scenarios when the acquired image data were affected by sunlight and when it was not (Figure 8a,b). The results of the field testing for detecting V. velutina’s performance are presented in Table 2 when a confidence threshold of ≥0.600 and an IoU of ≥0.500.
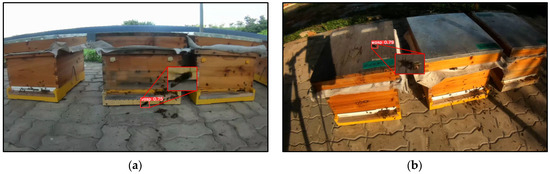
Figure 8.
Field testing: (a) Image data unaffected by sunlight; (b) Image data affected by sunlight.
Table 2.
Results of analysis of the field test.
The image analysis device performs V. velutina detection, RTSP, and image display operations simultaneously. To reduce system bottlenecks, the image analysis device was set to analyze three frames per second and send image data to the server when the system detected V. velutina twice in a row. Consequently, since it takes at least 1 s for the system to detect V. velutina and send an alarm, only V. velutina occurrences lasting at least 1 s were analyzed during field testing. Thus, 25 out of 30 occurrences of V. velutina were detected, showing a detection accuracy of 83.3%. In fast-moving image data of V. velutina, the feature points of V. velutina did not appear clearly, leading to detection failure. In contrast, the detection rate was high when V. velutina hovered in front of a beehive to hunt bees. When the system detects V. velutina twice, image data are sent to the mobile app via the server. When the server sends an alarm to the app, a pop-up alarm appears, updating the image data with the one sent with the alarm (Figure 9).
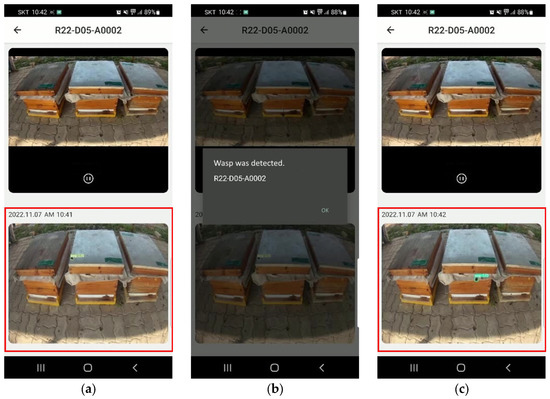
Figure 9.
Notification app for V. velutina detection: (a) Real-time monitoring of image data; (b) Alarm for detection of V. velutina (“Wasp was detected”); (c) Updated image data, red box area.
4. Discussion
Recently, research has been conducted on the automated detection of V. velutina using optical sensors with machine learning by analyzing the wingbeat frequencies of seven species of bees, wasps, and hornets. This research was carried out in an entomological tent in the laboratory, and V. velutina individuals were detected by distinguishing species of bees, wasps, and hornets based on the wingbeat frequency [32]. Previous studies have also used machine learning to predict the prioritization of tasks in sighting reports of V. velutina in situations in which human resources are limited [33]. The previous studies performed auxiliary roles such as the identification of V. velutina and the prediction of task priorities.
In this study, we developed a portable monitoring system based on deep learning to minimize the damage caused by V. velutina in beekeeping farms. This system can be directly applied in the field as it detects V. velutina objects from image data. Considering that V. velutina appears in various areas of an apiary site, a system was designed to ensure portability and ease of installation. To create a portable system, we utilized an embedded PC (Jetson Xavier NX, Santa Clara, CA, USA), whose performance is worse than that of a regular PC. This system must perform real-time video streaming and display tasks while detecting V. velutina objects. Therefore, we used the YOLOv5s model, a fast 1-stage algorithm, to simultaneously perform localization and classification tasks [22,23,24,25].
During field testing, only blurred images were obtained for V. velutina that fly fast, and the feature points could not be clearly marked, making detection difficult. In contrast, V. velutina hovering for hunting could be detected with high reliability. Therefore, by acquiring additional image data of fast-flying V. velutina and adding them to the training set of image data, it may be possible to extract the distinguishing features of fast-flying V. velutina, which could improve the detection reliability and accuracy.
The system is powered by 220VAC electricity to supply power to the embedded PC, monitor, router, and other components. Therefore, in situations wherein the power supply is difficult, the system must be operated using a high-capacity power bank. To address this issue, a possible solution would be to change the system’s operation to have the central PC handle the detection of V. velutina objects, reducing the power consumption of the on-site installed system. This can be achieved by implementing a small-scale solar power generation system.
5. Conclusions
A system was developed to minimize the damage to honeybees that inhabit beehives by sending notifications to the user when V. velutina are detected in beekeeping farms. For V. velutina detection, we trained YOLOv5s using a training set of 1960 images and evaluated its detection performance using a test set of 396 images. The detection performance was evaluated in terms of accuracy, precision, recall, F1 score, and mAP_0.5, which were found to be 92.3%, 98.0%, 94.0%, 0.959, and 0.959, respectively, at a confidence threshold of ≥0.6 and IoU of ≥0.5. Additionally, we conducted distance-based experiments to set the optimal detection range and confirmed that a high detection rate could be achieved at a wider range, showing a detection accuracy of 83.3% when monitoring three beehives. Furthermore, when V. velutina were detected twice in a row, the system successfully transmitted the image data to the server, enabling immediate notifications to be sent to the user.
The proposed system sends alarms to the user when V. velutina appears in an apiary site, allowing them to monitor the site in real time, and it also enables immediate response to unexpected weather conditions and events. In addition, the object tracking function can be added by increasing the detection frequency and accuracy through the augmentation of training data, and better image analysis devices can be used to improve the system.
In Korea, the damage caused by V. velutina and the expenses for their control amount to over 137 million dollars annually [34]. If this system is commercialized and widely adopted in beekeeping farms, it is expected to contribute to minimizing damage to honeybees and help reduce the scale of damage caused by V. velutina, leading to cost-saving effects as well.
Author Contributions
Conceptualization, I.C. and K.-C.K.; data curation, M.-S.J. and Y.J.; formal analysis I.C., J.L., C.-W.L., M.-S.J. and Y.J.; investigation, I.C., S.-H.Y., S.-b.K., D.K., K.-C.K., M.-S.J. and Y.J.; Methodology, I.C., J.L., K.-C.K., S.L. and C.-W.L.; resources, S.-H.Y., S.-b.K., D.K. and S.L.; software, M.-S.J. and Y.J.; supervision, I.C.; validation, I.C., J.L., M.-S.J. and Y.J.; writing—original draft preparation, I.C., M.-S.J. and Y.J.; writing—review and editing, I.C., M.-S.J. and Y.J. wrote the manuscript. All authors have read and agreed to the published version of the manuscript.
Funding
This work was carried out with the support of the Research Program for Agricultural Sciences (PJ01497002), National Institute of Agricultural Sciences, Rural Development Administration, Republic of Korea.
Institutional Review Board Statement
Not applicable.
Informed Consent Statement
Not applicable.
Data Availability Statement
Not applicable.
Conflicts of Interest
The authors declare no conflict of interest.
References
- Kay, A.D.; Bruning, A.J.; van Alst, A.; Abrahamson, T.T.; Hughes, W.O.; Kaspari, M. A carbohydrate-rich diet increases social immunity in ants. Proc. R. Soc. B Biol. Sci. 2014, 281, 20132374. [Google Scholar] [CrossRef] [PubMed]
- Klein, A.M.; Vaissière, B.E.; Cane, J.H.; Steffan-Dewenter, I.; Cunningham, S.A.; Kremen, C.; Tscharntke, T. Importance of pollinators in changing landscapes for world crops. Proc. R. Soc. B Biol. Sci. 2006, 274, 303–313. [Google Scholar] [CrossRef]
- Vanbergen, A.J.; Initiative, T.I.P. Threats to an ecosystem service: Pressures on pollinators. Front. Ecol. Environ. 2013, 11, 251–259. [Google Scholar] [CrossRef] [PubMed]
- Jung, C.E.; Kang, M.S.; Kim, D.W.; Lee, H.S. Vespid wasps (Hymenoptera) occurring around apiaries in Andong, Korea—I. Taxonomy and life history. Korean J. Apic. 2007, 22, 53–62. [Google Scholar]
- Kim, J.K.; Choi, M.; Moon, T.Y. Occurrence of Vespa velutina Lepeletier from Korea, and a revised key for Korean Vespa species (Hymenoptera: Vespidae). Entomol. Res. 2006, 36, 112–115. [Google Scholar] [CrossRef]
- Otis, G.W.; Benjamin, A. Invasion potential of hornets (Hymenoptera: Vespidae: Vespa spp.). Front. Insect Sci. 2023, 3, 1145158. [Google Scholar] [CrossRef]
- Kishi, S.; Goka, K. Review of the invasive yellow-legged hornet, Vespa velutina nigrithorax (Hymenoptera: Vespidae), in Japan and its possible chemical control. Appl. Entomol. Zool. 2017, 52, 361–368. [Google Scholar] [CrossRef]
- Choi, M.B.; Kim, T.G.; Kwon, O. Recent Trends in Wasp Nest Removal and Hymenoptera Stings in South Korea. J. Med. Entomol. 2019, 56, 254–260. [Google Scholar] [CrossRef]
- Kwon, O.; Choi, M.B. Interspecific hierarchies from aggressiveness and body size among the invasive alien hornet, Vespa velutina nigrithorax, and five native hornets in South Korea. PLoS ONE 2020, 15, e0226934. [Google Scholar] [CrossRef]
- Choi, Y.S. Anti-Damage Techniques by Vespa velutina, National Institute of Agricultural Sciences, Farming Utilization Information Interview. Available online: http://m.rda.go.kr/mobile/img/video/pdf/bee_151202.pdf (accessed on 2 December 2015).
- Choi, Y.S.; Lee, M.L.; Lee, M.Y.; Kim, H.K.; Yoon, M.Y.; Kang, A.R. Trapping of Vespa velutina nigrithorax Buysson (Hymenoptera: Vespidae) queen near apiaries honeybee comb extract in south region of Korea. Korean J. Apic. 2015, 30, 281–285. [Google Scholar] [CrossRef]
- Jung, C.; Kim, D.; Lee, H.S.; Baek, H. Some biological characteristics of a new honeybee pest, Vespa velutina nigrithorax Buysson 1905 (Hymenoptera: Vespidae). Korean J. Apic. 2008, 24, 61–65. [Google Scholar]
- Chang, Y.D.; Lee, M.Y.; Youn, Y.N. Visiting pattern and control of giant hornet, Vespa mandarinia (Hymenoptera: Vespoidea). Apiary. Korean J Apic. 1994, 9, 178–180. [Google Scholar]
- Rome, Q.; Perrard, A.; Muller, F.; Villemant, C. Monitoring and control modalities of a honeybee predator, the yellow-legged hornet Vespa velutina nigrithorax (Hymenoptera: Vespidae). Aliens 2011, 31, 7–15. [Google Scholar]
- Kang, E.J.; Lee, M.L.; Lee, M.Y.; Kim, H.K.; Choi, Y.S. Attractive effect using honeybee extraction against Vespa velutina nigrithorax Buysson (Hymenoptera: Vespidae) queen. Korean J. Apic. 2016, 31, 195–199. [Google Scholar] [CrossRef]
- Ko, K.E.; Shim, K.B. Trend of object recognition and detection technology using deep learning. J. Control Robot. Syst. 2017, 23, 17–24. [Google Scholar]
- Bay, H.; Tuytelaars, T.; Van Gool, L. Surf: Speeded up robust features. Lect. Notes Comput. Sci. 2006, 3951, 404–417. [Google Scholar] [CrossRef]
- Lowe, D.G. Object recognition from local scale-invariant features. In Proceedings of the Seventh IEEE International Conference on Computer Vision, Kerkyra, Greece, 20–27 September 1999; Volume 2, pp. 1150–1157. [Google Scholar] [CrossRef]
- Lee, Y.H.; Kim, Y. Comparison of CNN and YOLO for Object Detection. J. Semicond. Disp. Technol. 2020, 19, 85–92. [Google Scholar]
- Krizhevsky, A.; Sutskever, I.; Hinton, G.E. Imagenet classification with deep convolutional neural networks. Commun. ACM 2017, 60, 84–90. [Google Scholar] [CrossRef]
- Szegedy, C.; Liu, W.; Jia, Y.; Sermanet, P.; Reed, S.; Anguelov, D.; Erhan, D.; Vanhoucke, V.; Rabinovich, A. Going deeper with convolutions. In Proceedings of the 2015 IEEE Conference on Computer Vision and Pattern Recognition Workshops (CVPRW), Boston, MA, USA, 7–12 June 2015; pp. 1–9. [Google Scholar] [CrossRef]
- Redmon, J.; Divvala, S.; Girshick, R.; Farhadi, A. You only look once: Unified, real-time object detection. In Proceedings of the 2016 IEEE Conference on Computer Vision and Pattern Recognition (CVPR), Las Vegas, NV, USA, 27–30 June 2016; pp. 779–788. [Google Scholar] [CrossRef]
- Redmon, J.; Farhadi, A. YOLO9000: Better, faster, stronger. In Proceedings of the 2017 IEEE Conference on Computer Vision and Pattern Recognition (CVPR), Honolulu, HI, USA, 21–26 July 2017; pp. 7263–7271. [Google Scholar] [CrossRef]
- Redmon, J.; Farhadi, A. Yolov3: An incremental improvement. arXiv 2018. [Google Scholar] [CrossRef]
- Bochkovskiy, A.; Wang, C.Y.; Liao, H.Y.M. Yolov4: Optimal speed and accuracy of object detection. arXiv 2020. [Google Scholar] [CrossRef]
- Shi, S.; Wang, Q.; Xu, P.; Chu, X. Benchmarking state-of-the-art deep learning software tools. In Proceedings of the 7th International Conference on Cloud Computing and Big Data (CCBD), Macau, China, 16–18 November 2016; pp. 99–104. [Google Scholar] [CrossRef]
- Liu, W.; Anguelov, D.; Erhan, D.; Szegedy, C.; Reed, S.; Fu, C.Y.; Berg, A.C. SSD: Single shot multibox detector. In Proceedings of the 14th European Conference on Computer Vision (ECCV), Amsterdam, The Netherlands, 11–14 October 2016; Springer International Publishing: Amsterdam, The Netherlands, 2016; pp. 21–37. [Google Scholar] [CrossRef]
- Girshick, R.; Donahue, J.; Darrell, T.; Malik, J. Rich feature hierarchies for accurate object detection and semantic segmentation. In Proceedings of the 2014 IEEE Conference on Computer Vision and Pattern Recognition (CVPR 2014), Columbus, OH, USA, 23–28 June 2014; pp. 580–587. [Google Scholar] [CrossRef]
- Girshick, R. Fast R-CNN. In Proceedings of the 2015 IEEE International Conference on Computer Vision (ICCV 2015), Santiago, Chile, 7–13 December 2015; pp. 1440–1448. [Google Scholar] [CrossRef]
- Ren, S.; He, K.; Girshick, R.; Sun, J. Faster R-CNN: Towards real-time object detection with region proposal networks. In Proceedings of the Advances in Neural Information Processing Systems 28: Annual Conference on Neural Information Processing Systems 2015, Montreal, QC, Canada, 7–12 December 2015. [Google Scholar] [CrossRef]
- Iyer, R.; Ringe, P.S.; Bhensdadiya, K.P. Comparison of YOLOv3, YOLOv5s and MobileNet-SSD V2 for real-time mask detection. Int. J. Res. Eng. Technol. 2021, 8, 1156–1160. [Google Scholar]
- Herrera, C.; Williams, M.; Encarnação, J.; Roura-Pascual, N.; Faulhaber, B.; Jurado-Rivera, J.A.; Leza, M. Automated detection of the yellow-legged hornet (Vespa velutina) using an optical sensor with machine learning. Pest. Manag. Sci. 2023, 79, 1225–1233. [Google Scholar] [CrossRef] [PubMed]
- Liu, Y.; Guo, J.; Dong, J.; Jiang, L.; Ouyang, H. Priority prediction of Asian Hornet sighting report using machine learning methods. In Proceedings of the 2021 IEEE International Conference on Software Engineering and Artificial Intelligence (SEAI), Xiamen, China, 11–13 June 2021; pp. 7–11. [Google Scholar]
- Jung, C.E. Initial Stage Risk Assessment of an Invasive Hornet, Vespa velutina nigrithorax Buysson (Hymenoptera: Vespidae) in Korea. J. Apic. 2012, 27, 95–104. [Google Scholar]


Disclaimer/Publisher’s Note: The statements, opinions and data contained in all publications are solely those of the individual author(s) and contributor(s) and not of MDPI and/or the editor(s). MDPI and/or the editor(s) disclaim responsibility for any injury to people or property resulting from any ideas, methods, instructions or products referred to in the content. |
© 2023 by the authors. Licensee MDPI, Basel, Switzerland. This article is an open access article distributed under the terms and conditions of the Creative Commons Attribution (CC BY) license (https://creativecommons.org/licenses/by/4.0/).