
Adaptive Feature Fusion and Kernel-Based Regression Modeling to Improve Blind Image Quality Assessment

Abstract
:1. Introduction
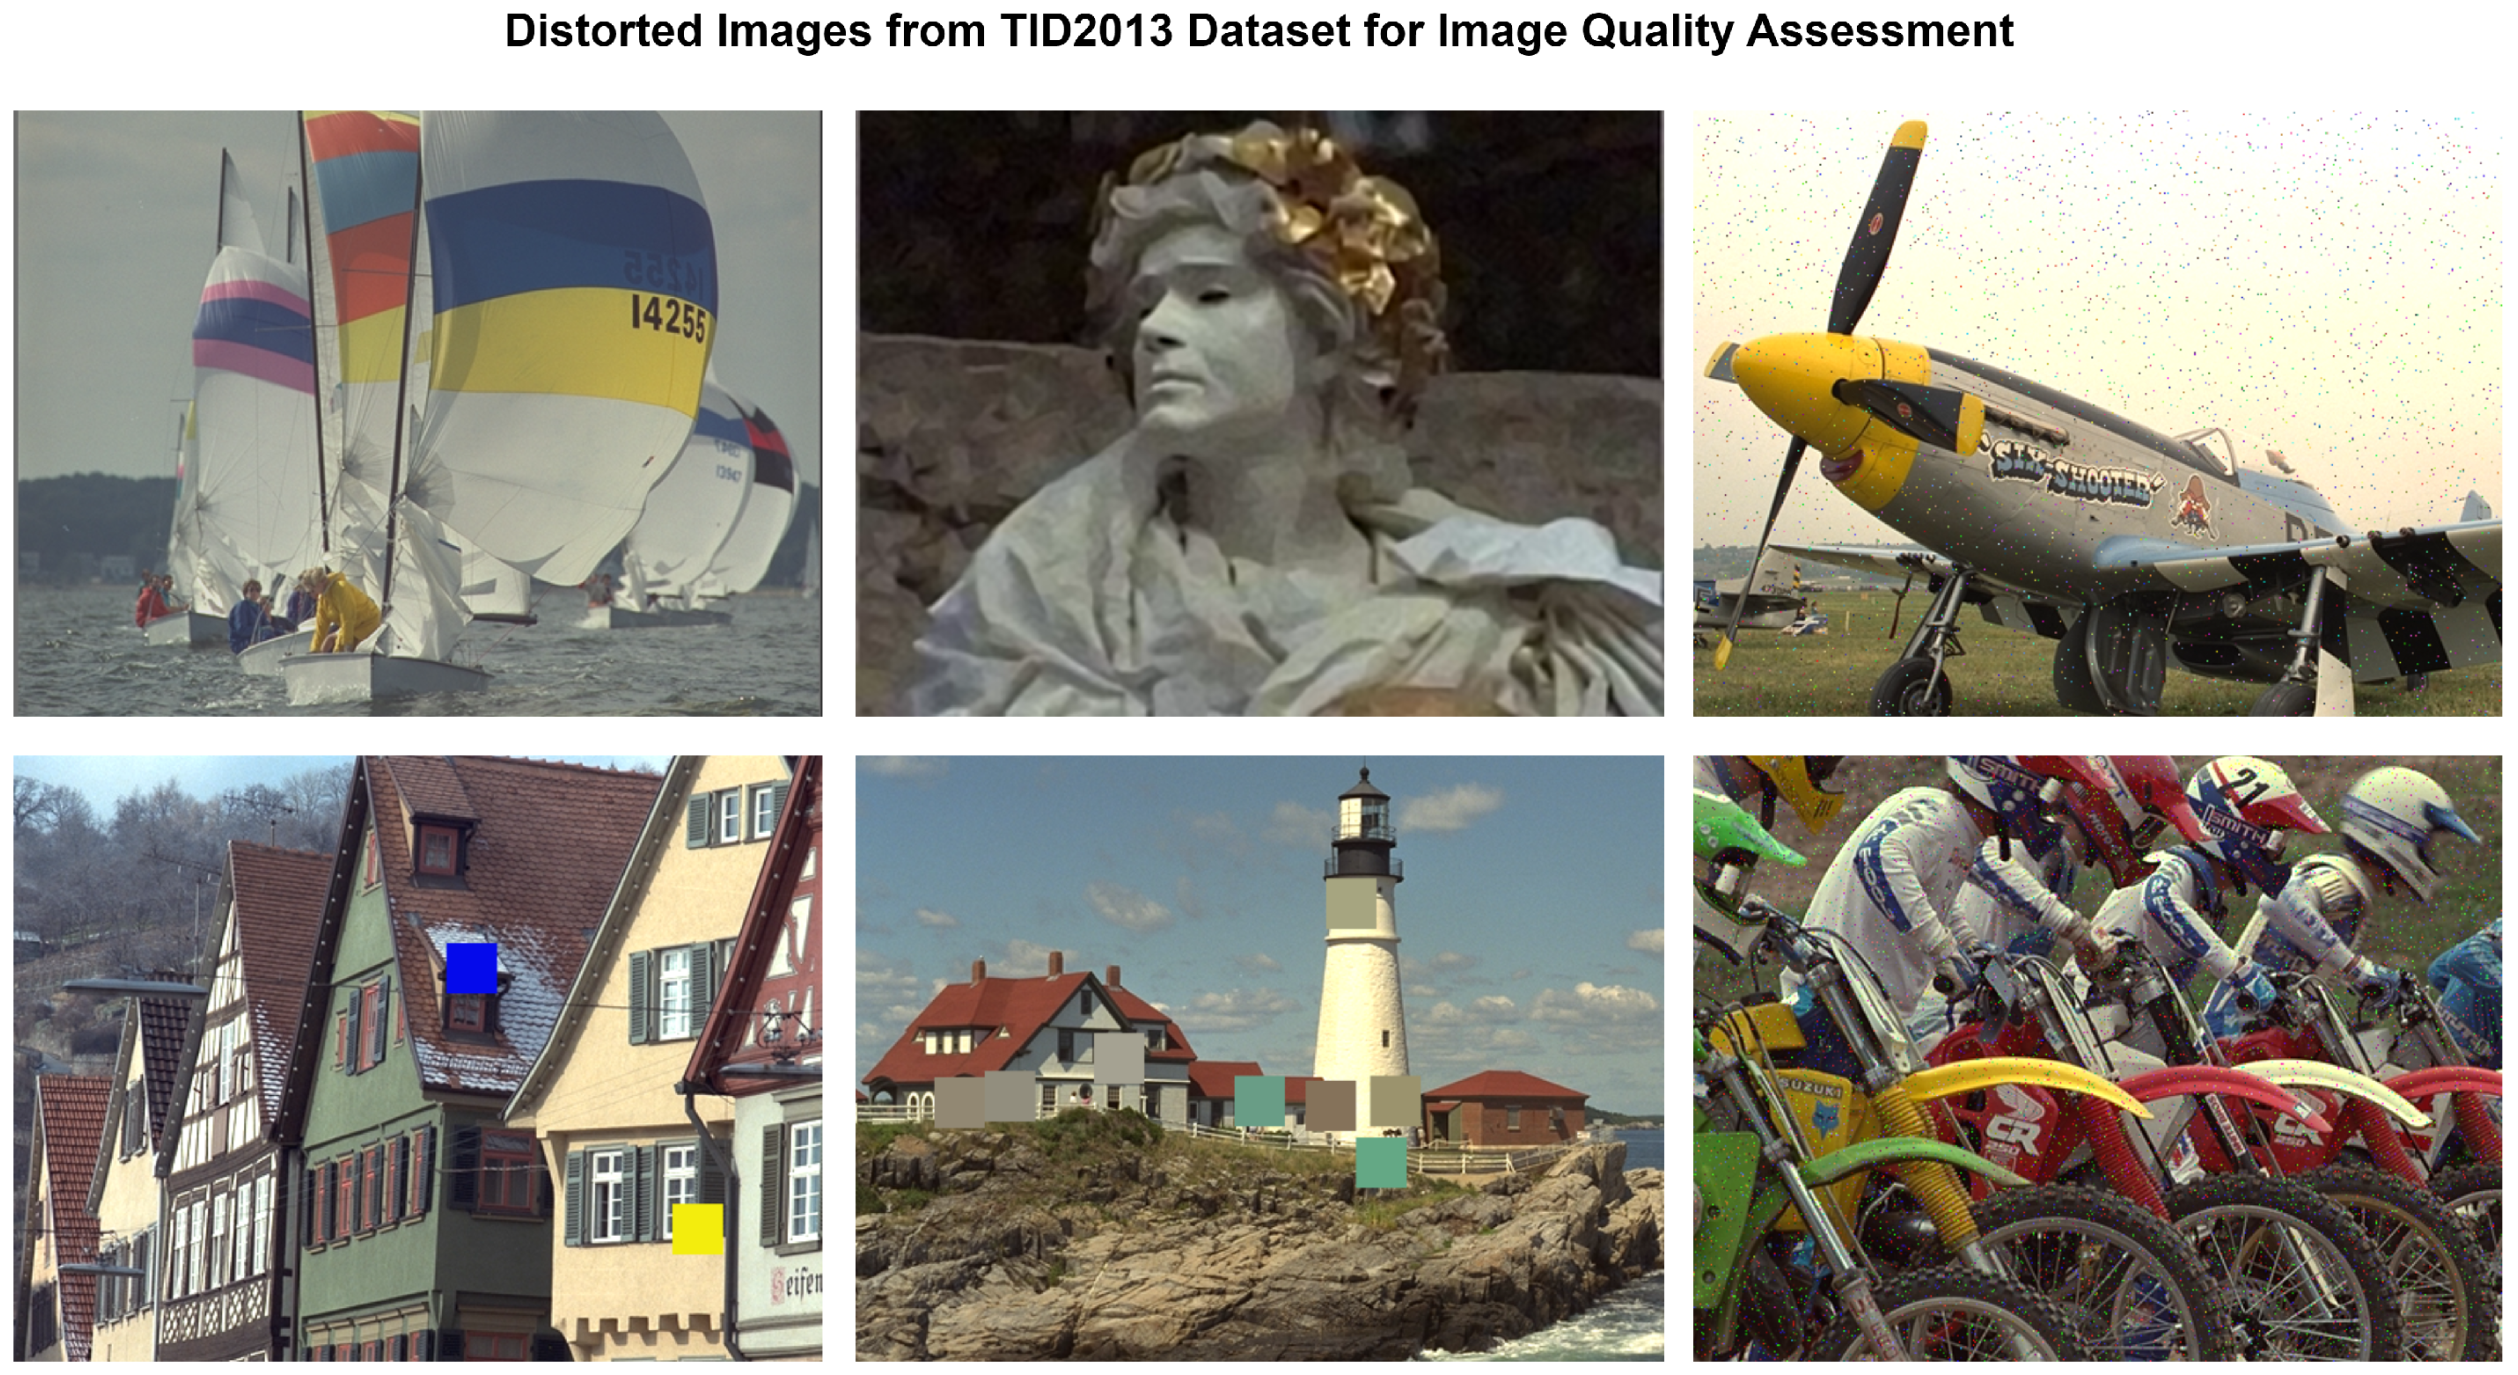
2. Datasets
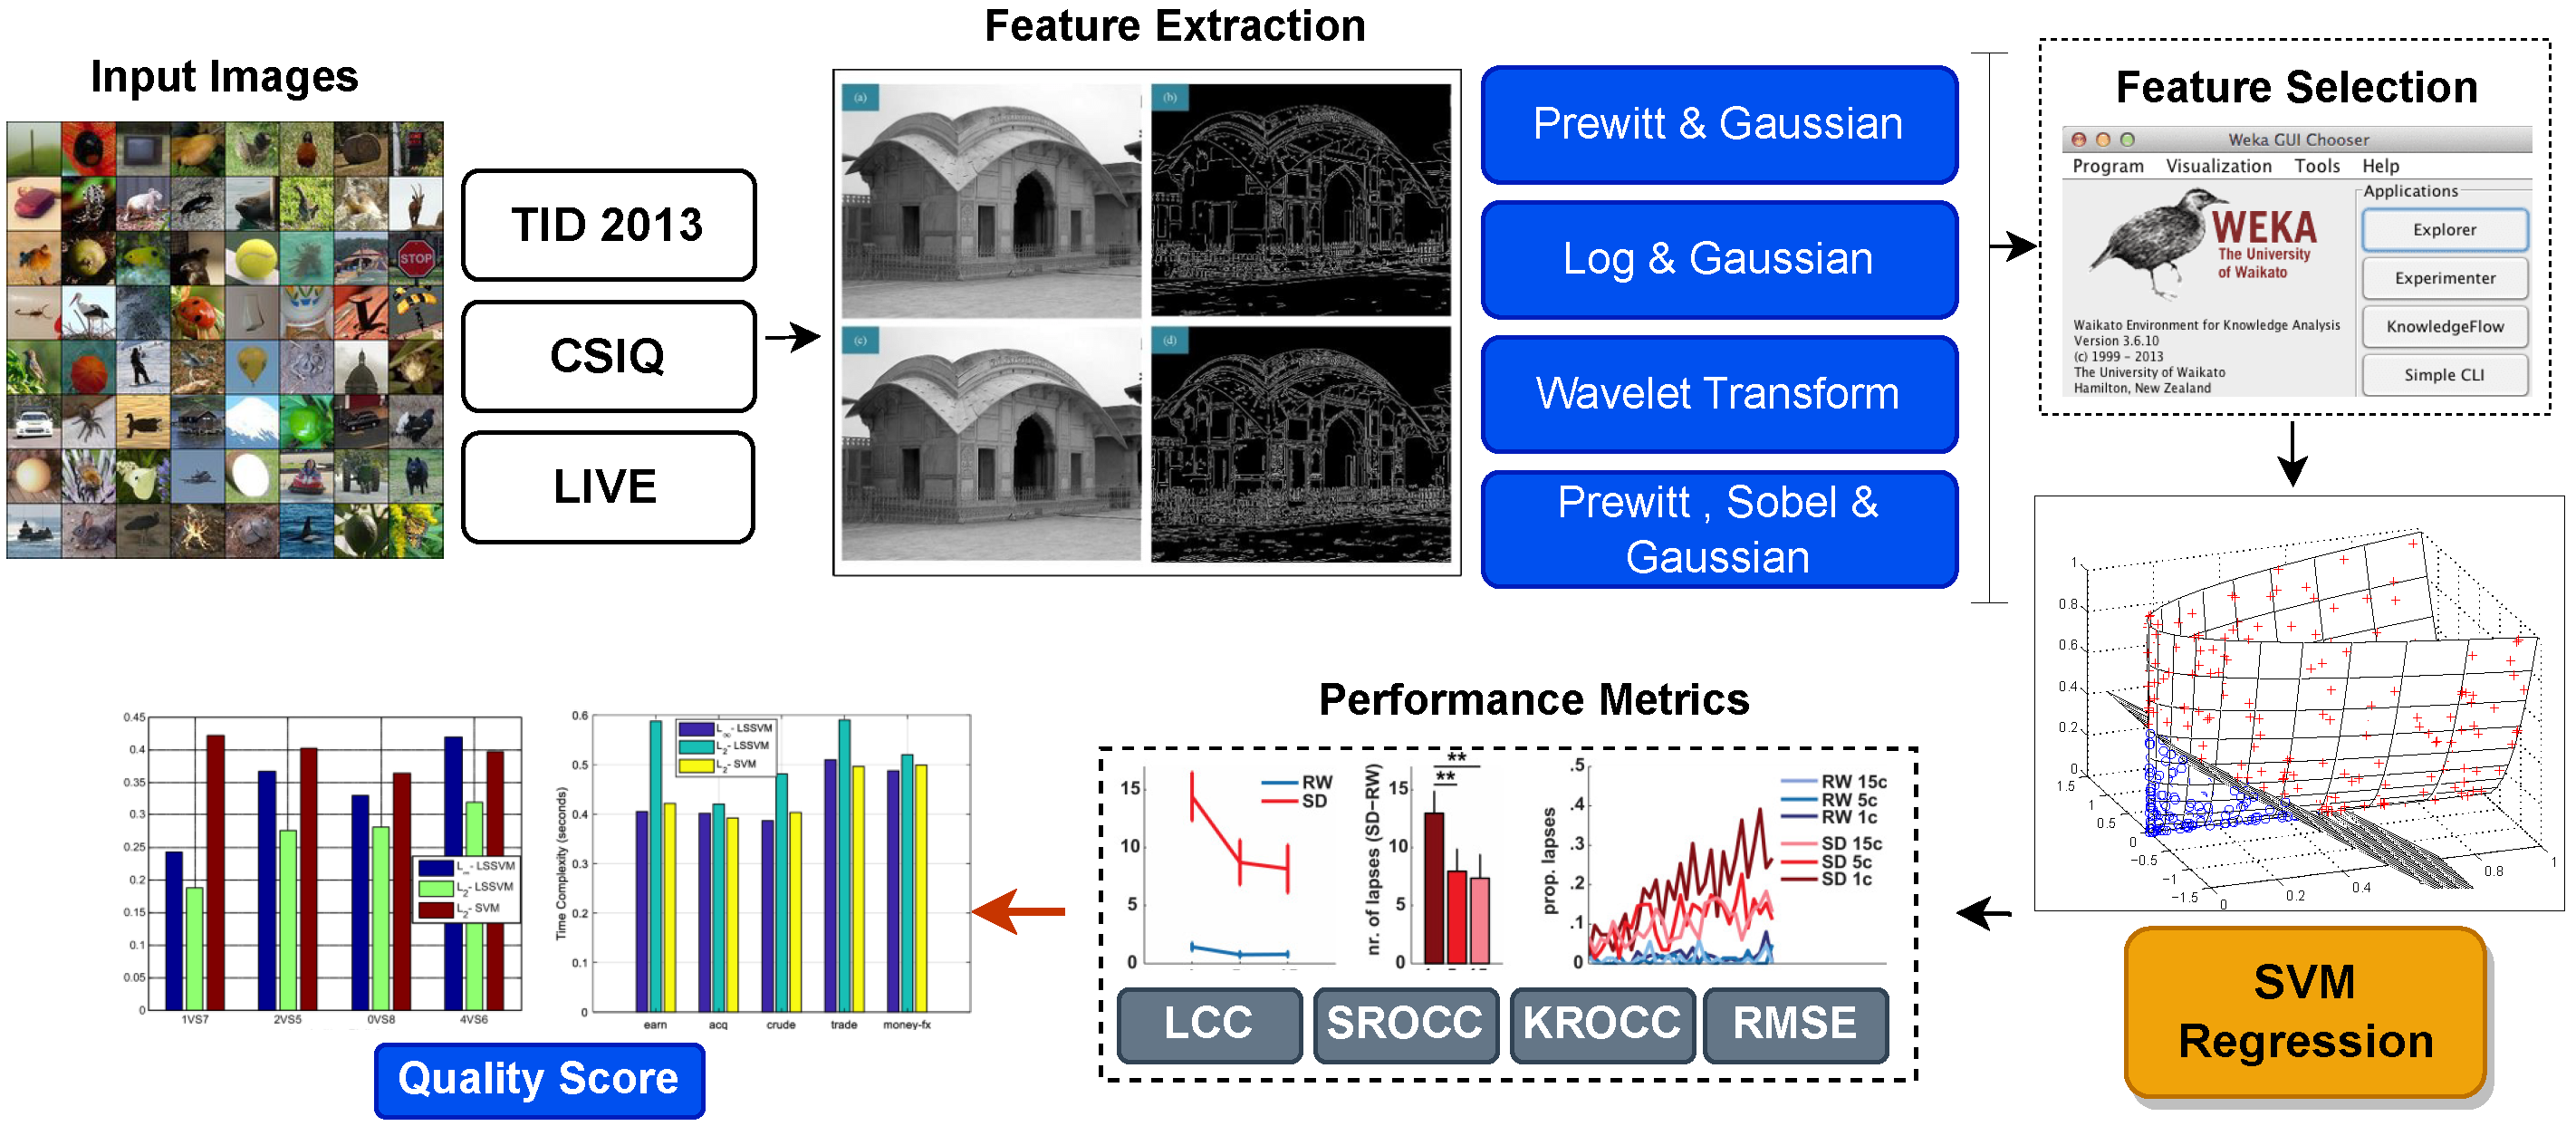
3. Proposed Methodology
3.1. Feature Extraction
3.1.1. Wavelet Transform
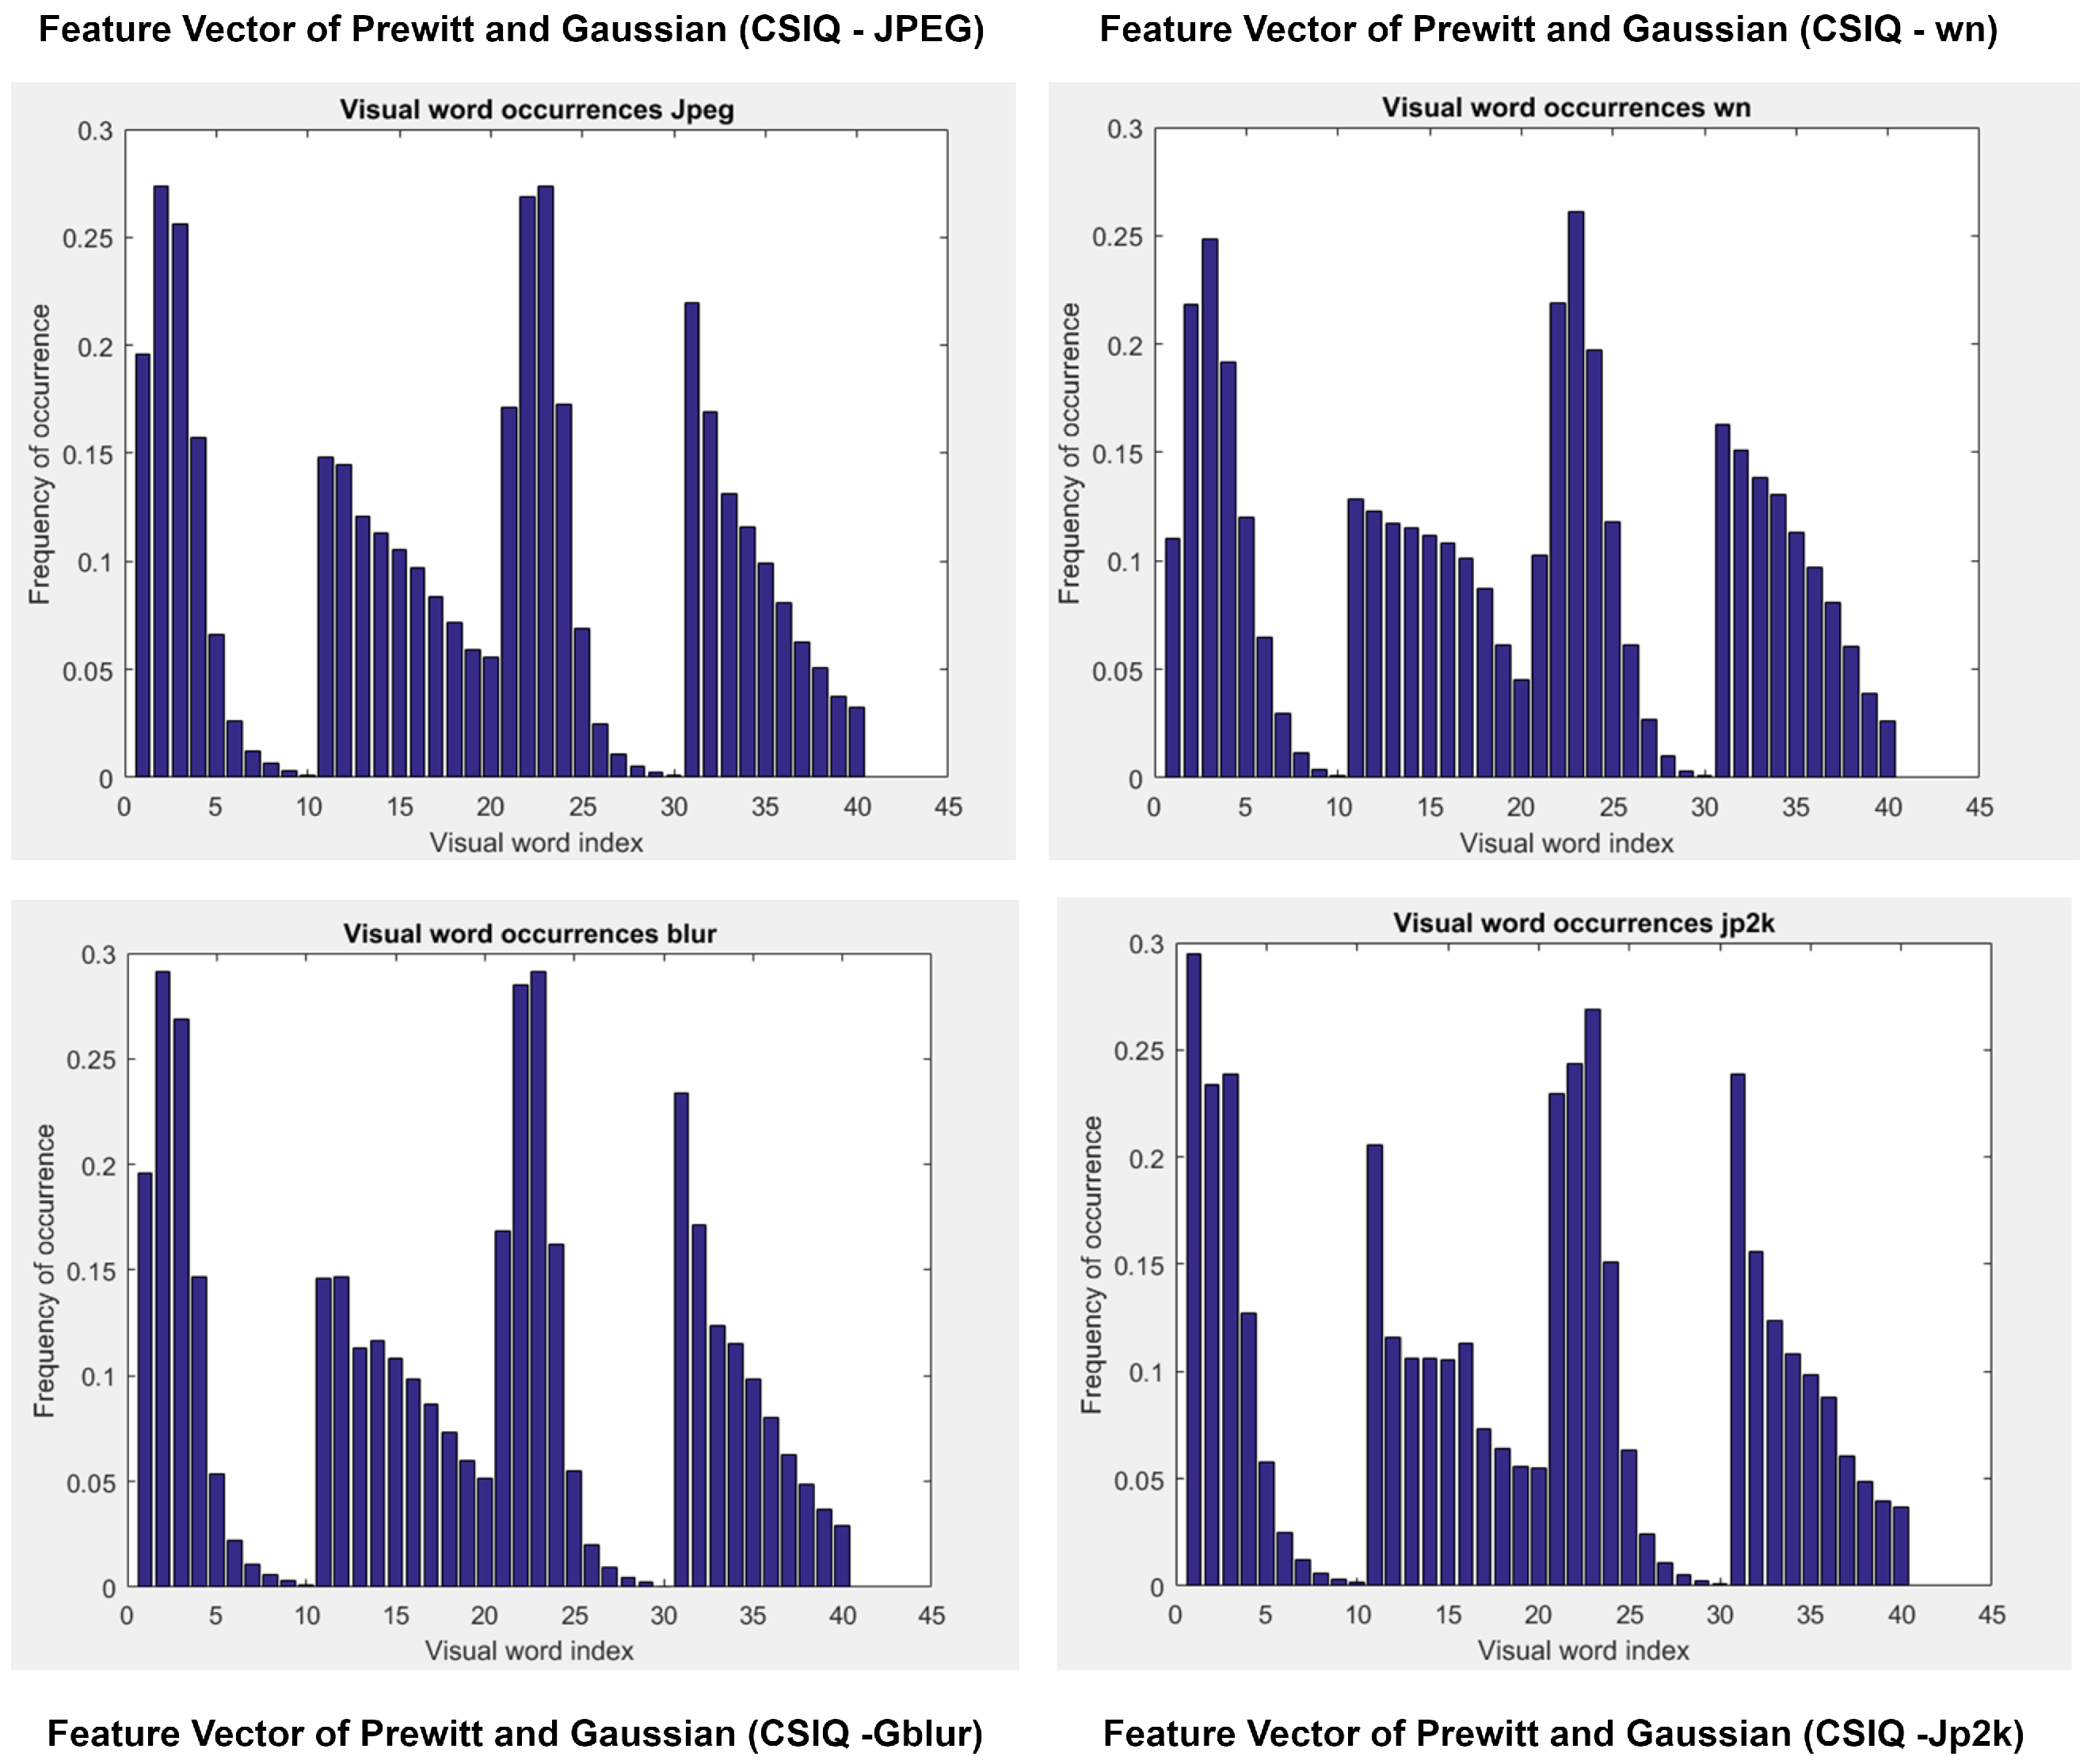
3.1.2. Prewitt and Gaussian
3.1.3. Log and Gaussian
3.1.4. Prewitt, Sobel, and Gaussian
3.2. Feature Selection
4. Quality Prediction Stage
5. Evaluation Metrics
5.1. Spearman Rank-Order Correlation Coefficient (SROCC)
5.1.1. Linear Correlation Coefficient (LCC)
5.1.2. Kendall Rank-Order Correlation Coefficient (KROCC)
5.1.3. Root Mean Squared Error (RMSE)
6. Results and Discussion
6.1. Performance Comparison of Different Features
6.2. Feature Analysis
6.3. Comparison with Exisiting Techniques
7. Conclusions
Funding
Conflicts of Interest
References
- ur Rehman, M.; Nizami, I.F.; Majid, M. DeepRPN-BIQA: Deep architectures with region proposal network for natural-scene and screen-content blind image quality assessment. Displays 2022, 71, 102101. [Google Scholar] [CrossRef]
- Qi, K.; Li, H.; Rong, C.; Gong, Y.; Li, C.; Zheng, H.; Wang, S. Blind Image Quality Assessment for MRI with A Deep Three-dimensional content-adaptive Hyper-Network. arXiv 2021, arXiv:2107.06888. [Google Scholar]
- Li, G.; Yang, Y.; Qu, X.; Cao, D.; Li, K. A deep learning based image enhancement approach for autonomous driving at night. Knowl.-Based Syst. 2021, 213, 106617. [Google Scholar] [CrossRef]
- Rajevenceltha, J.; Gaidhane, V.H. An efficient approach for no-reference image quality assessment based on statistical texture and structural features. Eng. Sci. Technol. Int. J. 2022, 30, 101039. [Google Scholar] [CrossRef]
- Li, Q.; Lin, W.; Gu, K.; Zhang, Y.; Fang, Y. Blind image quality assessment based on joint log-contrast statistics. Neurocomputing 2019, 331, 189–198. [Google Scholar] [CrossRef]
- Xu, L.; Jiang, X. Blind image quality assessment for anchor-assisted adaptation to practical situations. Multimed. Tools Appl. 2023, 83, 17929–17946. [Google Scholar] [CrossRef]
- Zhai, G.; Min, X. Perceptual image quality assessment: A survey. Sci. China Inf. Sci. 2020, 63, 211301. [Google Scholar] [CrossRef]
- Nizami, I.F.; Rehman, M.U.; Waqar, A.; Majid, M. Impact of visual saliency on multi-distorted blind image quality assessment using deep neural architecture. Multimed. Tools Appl. 2022, 81, 25283–25300. [Google Scholar] [CrossRef]
- Hosu, V.; Lin, H.; Sziranyi, T.; Saupe, D. KonIQ-10k: An ecologically valid database for deep learning of blind image quality assessment. IEEE Trans. Image Process. 2020, 29, 4041–4056. [Google Scholar] [CrossRef] [Green Version]
- Nizami, I.F.; Majid, M.; Rehman, M.u.; Anwar, S.M.; Nasim, A.; Khurshid, K. No-reference image quality assessment using bag-of-features with feature selection. Multimed. Tools Appl. 2020, 79, 7811–7836. [Google Scholar] [CrossRef]
- Nizami, I.F.; Rehman, M.u.; Majid, M.; Anwar, S.M. Natural scene statistics model independent no-reference image quality assessment using patch based discrete cosine transform. Multimed. Tools Appl. 2020, 79, 26285–26304. [Google Scholar] [CrossRef]
- Ribeiro, R.; Trifan, A.; Neves, A.J. Blind Image Quality Assessment with Deep Learning: A Replicability Study and Its Reproducibility in Lifelogging. Appl. Sci. 2023, 13, 59. [Google Scholar] [CrossRef]
- Fateh, A.; Fateh, M.; Abolghasemi, V. Multilingual handwritten numeral recognition using a robust deep network joint with transfer learning. Inf. Sci. 2021, 581, 479–494. [Google Scholar] [CrossRef]
- Yang, G.; Wang, Y. Deep Superpixel-Based Network For Blind Image Quality Assessment. arXiv 2021, arXiv:2110.06564. [Google Scholar]
- Wu, J.; Ma, J.; Liang, F.; Dong, W.; Shi, G.; Lin, W. End-to-end blind image quality prediction with cascaded deep neural network. IEEE Trans. Image Process. 2020, 29, 7414–7426. [Google Scholar] [CrossRef]
- Rehman, M.U.; Tayara, H.; Zou, Q.; Chong, K.T. i6mA-Caps: A CapsuleNet-based framework for identifying DNA N6-methyladenine sites. Bioinformatics 2022, 38, 3885–3891. [Google Scholar] [CrossRef]
- Rehman, M.U.; Tayara, H.; Chong, K.T. DL-m6A: Identification of N6-methyladenosine Sites in Mammals using deep learning based on different encoding schemes. IEEE/ACM Trans. Comput. Biol. Bioinform. 2022, 20, 904–911. [Google Scholar] [CrossRef]
- Rehman, M.U.; Tayara, H.; Chong, K.T. DCNN-4mC: Densely connected neural network based N4-methylcytosine site prediction in multiple species. Comput. Struct. Biotechnol. J. 2021, 19, 6009–6019. [Google Scholar] [CrossRef]
- Rakhmatulin, I.; Kamilaris, A.; Andreasen, C. Deep neural networks to detect weeds from crops in agricultural environments in real-time: A review. Remote Sens. 2021, 13, 4486. [Google Scholar] [CrossRef]
- Espejo-Garcia, B.; Mylonas, N.; Athanasakos, L.; Fountas, S. Improving weeds identification with a repository of agricultural pre-trained deep neural networks. Comput. Electron. Agric. 2020, 175, 105593. [Google Scholar] [CrossRef]
- Rehman, M.U.; Ryu, J.; Nizami, I.F.; Chong, K.T. RAAGR2-Net: A brain tumor segmentation network using parallel processing of multiple spatial frames. Comput. Biol. Med. 2023, 152, 106426. [Google Scholar] [CrossRef]
- Rehman, M.U.; Akhtar, S.; Zakwan, M.; Mahmood, M.H. Novel architecture with selected feature vector for effective classification of mitotic and non-mitotic cells in breast cancer histology images. Biomed. Signal Process. Control 2022, 71, 103212. [Google Scholar] [CrossRef]
- Chetouani, A.; Quach, M.; Valenzise, G.; Dufaux, F. Combination of Deep Learning-based and Handcrafted Features for Blind Image Quality Assessment. In Proceedings of the 2021 9th European Workshop on Visual Information Processing (EUVIP), Paris, France, 23–25 June 2021; IEEE: Piscataway, NJ, USA, 2021; pp. 1–6. [Google Scholar]
- Pan, Z.; Zhang, H.; Lei, J.; Fang, Y.; Shao, X.; Ling, N.; Kwong, S. Dacnn: Blind image quality assessment via a distortion-aware convolutional neural network. IEEE Trans. Circuits Syst. Video Technol. 2022, 32, 7518–7531. [Google Scholar] [CrossRef]
- Ghadiyaram, D.; Bovik, A.C. Perceptual quality prediction on authentically distorted images using a bag of features approach. J. Vis. 2017, 17, 32. [Google Scholar] [CrossRef] [Green Version]
- Gu, K.; Zhai, G.; Yang, X.; Zhang, W. Using free energy principle for blind image quality assessment. IEEE Trans. Multimed. 2014, 17, 50–63. [Google Scholar] [CrossRef]
- Mittal, A.; Moorthy, A.K.; Bovik, A.C. No-reference image quality assessment in the spatial domain. IEEE Trans. Image Process. 2012, 21, 4695–4708. [Google Scholar] [CrossRef]
- Saad, M.A.; Bovik, A.C.; Charrier, C. Blind image quality assessment: A natural scene statistics approach in the DCT domain. IEEE Trans. Image Process. 2012, 21, 3339–3352. [Google Scholar] [CrossRef] [PubMed]
- Ye, P.; Kumar, J.; Kang, L.; Doermann, D. Unsupervised feature learning framework for no-reference image quality assessment. In Proceedings of the 2012 IEEE Conference on Computer Vision and Pattern Recognition, Providence, RI, USA, 16–21 June 2012; IEEE: Piscataway, NJ, USA, 2012; pp. 1098–1105. [Google Scholar]
- Moorthy, A.K.; Bovik, A.C. Blind image quality assessment: From natural scene statistics to perceptual quality. IEEE Trans. Image Process. 2011, 20, 3350–3364. [Google Scholar] [CrossRef]

| Metrics | TID2013 | CSIQ | LIVE | ||||||||||||||
|---|---|---|---|---|---|---|---|---|---|---|---|---|---|---|---|---|---|
| SSR | SCN | HFN | IN | ID | GBLUR | JPEG | Awgn | JPEG | Jp2k | Fnoise | Jp2k | JPEG | Wn | Gblur | FF | ||
| WT | srocc | 0.9054 | 0.9553 | 0.9320 | 0.9069 | 0.9014 | 0.9181 | 0.9308 | 0.9365 | 0.9012 | 0.9217 | 0.8928 | 0.9245 | 0.9204 | 0.9724 | 0.9586 | 0.9216 |
| lcc | 0.9111 | 0.9654 | 0.9654 | 0.9078 | 0.9201 | 0.9219 | 0.9779 | 0.9517 | 0.9348 | 0.9356 | 0.9011 | 0.9376 | 0.9502 | 0.9819 | 0.9634 | 0.9253 | |
| krocc | 0.7467 | 0.8333 | 0.7903 | 0.7446 | 0.7323 | 0.7667 | 0.7933 | 0.7931 | 0.7537 | 0.7655 | 0.7149 | 0.7727 | 0.7761 | 0.8966 | 0.8424 | 0.7492 | |
| rmse | 0.8177 | 0.2038 | 0.2792 | 0.2630 | 0.6634 | 0.4972 | 0.3323 | 0.0547 | 0.1117 | 0.1140 | 0.1006 | 5.769 | 5.1151 | 2.9712 | 4.3413 | 6.3678 | |
| PG | srocc | 0.9169 | 0.9292 | 0.9363 | 0.9120 | 0.9201 | 0.9331 | 0.9159 | 0.9429 | 0.8987 | 0.9253 | 0.8921 | 0.9240 | 0.9167 | 0.9773 | 0.9655 | 0.9231 |
| lcc | 0.9346 | 0.9345 | 0.9710 | 0.9131 | 0.9440 | 0.9404 | 0.9610 | 0.9539 | 0.9310 | 0.9295 | 0.8959 | 0.9340 | 0.9430 | 0.9889 | 0.9698 | 0.9267 | |
| krocc | 0.7533 | 0.7867 | 0.8001 | 0.7600 | 0.7713 | 0.7960 | 0.7803 | 0.7636 | 0.7448 | 0.7571 | 0.7611 | 0.7652 | 0.7648 | 0.8916 | 0.8621 | 0.7635 | |
| rmse | 0.7210 | 0.2865 | 0.2580 | 0.2498 | 0.5465 | 0.4460 | 0.3936 | 0.0548 | 0.1053 | 0.1197 | 0.1051 | 6.0187 | 5.4605 | 2.5090 | 3.9717 | 6.1869 | |
| LG | srocc | 0.9311 | 0.9130 | 0.9333 | 0.9021 | 0.9032 | 0.9042 | 0.9123 | 0.9369 | 0.8891 | 0.9150 | 0.9034 | 0.9174 | 0.9124 | 0.9842 | 0.9542 | 0.9097 |
| lcc | 0.9482 | 0.9172 | 0.9709 | 0.9042 | 0.9260 | 0.9082 | 0.9664 | 0.9445 | 0.9330 | 0.9278 | 0.9004 | 0.9243 | 0.9358 | 0.9920 | 0.9602 | 0.9405 | |
| krocc | 0.7867 | 0.7656 | 0.8001 | 0.7579 | 0.7401 | 0.7379 | 0.7600 | 0.7833 | 0.7291 | 0.75886 | 0.7287 | 0.7576 | 0.7559 | 0.9064 | 0.8325 | 0.7635 | |
| rmse | 0.6049 | 0.3118 | 0.2529 | 0.2509 | 0.5689 | 0.5458 | 0.3949 | 0.0574 | 0.1130 | 0.1195 | 0.1012 | 6.4027 | 5.8812 | 2.1291 | 4.5495 | 5.7394 | |
| PSG | srocc | 0.9177 | 0.9208 | 0.9323 | 0.9238 | 0.9078 | 0.9385 | 0.9046 | 0.9423 | 0.8940 | 0.9030 | 0.8989 | 0.9174 | 0.9122 | 0.9823 | 0.9675 | 0.9167 |
| lcc | 0.9326 | 0.9293 | 0.9681 | 0.9296 | 0.9403 | 0.9491 | 0.9444 | 0.9550 | 0.9187 | 0.9211 | 0.8979 | 0.9298 | 0.9401 | 0.9902 | 0.9704 | 0.9297 | |
| krocc | 0.7667 | 0.7780 | 0.7933 | 0.7800 | 0.7523 | 0.8000 | 0.7567 | 0.8128 | 0.7389 | 0.7586 | 0.7517 | 0.7538 | 0.7546 | 0.8916 | 0.8473 | 0.7538 | |
| rmse | 0.6785 | 0.2878 | 0.2597 | 0.2249 | 0.5616 | 0.4107 | 0.4460 | 0.0481 | 0.1186 | 0.1185 | 0.0967 | 6.2532 | 5.5626 | 2.3792 | 4.1871 | 5.7901 | |
| WEKA PG | srocc | 0.9200 | 0.9305 | 0.9416 | 0.9185 | 0.9265 | 0.9348 | 0.9301 | 0.9453 | 0.9135 | 0.9336 | 0.9127 | 0.9295 | 0.9196 | 0.9788 | 0.9688 | 0.9312 |
| lcc | 0.9298 | 0.9348 | 0.9735 | 0.9195 | 0.9458 | 0.9422 | 0.9716 | 0.9549 | 0.9472 | 0.9355 | 0.9259 | 0.9407 | 0.9447 | 0.9901 | 0.9722 | 0.9366 | |
| krocc | 0.7667 | 0.7923 | 0.8047 | 0.7667 | 0.7800 | 0.7986 | 0.7867 | 0.8079 | 0.7562 | 0.7954 | 0.7621 | 0.7727 | 0.7637 | 0.8966 | 0.8674 | 0.7712 | |
| rmse | 0.7084 | 0.2760 | 0.2396 | 0.2418 | 0.5339 | 0.4360 | 0.3688 | 0.0515 | 0.1041 | 0.1145 | 0.1029 | 5.6505 | 5.3760 | 2.4960 | 3.8752 | 5.9869 | |
| WEKA PSG | srocc | 0.9222 | 0.9267 | 0.9383 | 0.9255 | 0.9104 | 0.9378 | 0.9085 | 0.9458 | 0.9116 | 0.9163 | 0.9012 | 0.9251 | 0.9148 | 0.9836 | 0.9678 | 0.9178 |
| lcc | 0.9348 | 0.9323 | 0.9695 | 0.9323 | 0.9433 | 0.9450 | 0.9577 | 0.9571 | 0.9327 | 0.9286 | 0.9022 | 0.9360 | 0.9421 | 0.9911 | 0.9708 | 0.9311 | |
| krocc | 0.7733 | 0.7850 | 0.7975 | 0.7867 | 0.7583 | 0.7989 | 0.7578 | 0.8130 | 0.7411 | 0.7648 | 0.7621 | 0.7727 | 0.7634 | 0.9015 | 0.8621 | 0.7638 | |
| rmse | 0.6824 | 0.2838 | 0.2472 | 0.2176 | 0.5587 | 0.4097 | 0.4423 | 0.0478 | 0.1149 | 0.1143 | 0.0943 | 5.9252 | 5.4526 | 2.2905 | 3.8823 | 5.7641 | |
| BIQA Models | LIVE Dataset | TID2013 Dataset | CSIQ Dataset | |||||||||
|---|---|---|---|---|---|---|---|---|---|---|---|---|
| LCC | SROCC | KROCC | RMSE | LCC | SROCC | KROCC | RMSE | LCC | SROCC | KROCC | RMSE | |
| FRIQUEE [25] | 0.9411 | 0.9347 | 0.7817 | 9.2061 | 0.7688 | 0.6926 | 0.5161 | 0.7965 | 0.9069 | 0.8815 | 0.7077 | 0.1113 |
| NFERM [26] | 0.9463 | 0.9427 | 0.8063 | 8.8021 | 0.7465 | 0.6747 | 0.4976 | 0.8301 | 0.8658 | 0.8213 | 0.6394 | 0.1298 |
| BRISQUE [27] | 0.9482 | 0.9436 | 0.8005 | 8.6605 | 0.6213 | 0.5739 | 0.4149 | 0.9668 | 0.8311 | 0.7403 | 0.5590 | 0.1442 |
| BLINDS II [28] | 0.9370 | 0.9298 | 0.7754 | 9.5072 | 0.6511 | 0.5723 | 0.4137 | 0.9403 | 0.8134 | 0.7528 | 0.5652 | 0.1522 |
| CORNIA [29] | 0.9473 | 0.9452 | 0.7953 | 8.7478 | 0.7451 | 0.6542 | 0.4770 | 0.8247 | 0.8044 | 0.7325 | 0.5464 | 0.1554 |
| DIIVINE [30] | 0.9134 | 0.9120 | 0.7487 | 11.096 | 0.7294 | 0.6735 | 0.4947 | 0.8504 | 0.8077 | 0.7594 | 0.5718 | 0.1546 |
| Proposed Model | 0.9569 | 0.9456 | 0.8143 | 4.6769 | 0.9453 | 0.9289 | 0.7851 | 0.4006 | 0.9409 | 0.9263 | 0.7804 | 0.0932 |
Disclaimer/Publisher’s Note: The statements, opinions and data contained in all publications are solely those of the individual author(s) and contributor(s) and not of MDPI and/or the editor(s). MDPI and/or the editor(s) disclaim responsibility for any injury to people or property resulting from any ideas, methods, instructions or products referred to in the content. |
© 2023 by the author. Licensee MDPI, Basel, Switzerland. This article is an open access article distributed under the terms and conditions of the Creative Commons Attribution (CC BY) license (https://creativecommons.org/licenses/by/4.0/).
Share and Cite
Ryu, J. Adaptive Feature Fusion and Kernel-Based Regression Modeling to Improve Blind Image Quality Assessment. Appl. Sci. 2023, 13, 7522. https://doi.org/10.3390/app13137522
Ryu J. Adaptive Feature Fusion and Kernel-Based Regression Modeling to Improve Blind Image Quality Assessment. Applied Sciences. 2023; 13(13):7522. https://doi.org/10.3390/app13137522
Chicago/Turabian StyleRyu, Jihyoung. 2023. "Adaptive Feature Fusion and Kernel-Based Regression Modeling to Improve Blind Image Quality Assessment" Applied Sciences 13, no. 13: 7522. https://doi.org/10.3390/app13137522
APA StyleRyu, J. (2023). Adaptive Feature Fusion and Kernel-Based Regression Modeling to Improve Blind Image Quality Assessment. Applied Sciences, 13(13), 7522. https://doi.org/10.3390/app13137522