Abstract
In order to improve the speech enhancement ability of FullSubNet model, an improved method FullSubNet-pMix is proposed. Specifically, pMix module is added to the structure of full-band frequency domain information processing, which realizes the information interaction between amplitude spectrum and phase spectrum. At the same time, the hyperparameters used in training are optimized so that the full-band and sub-band structure of the system can play a better role. Experiments are carried out on selected test sets. The experimental results show that the proposed method can independently improve the speech enhancement effect of the model, and the effect on the four evaluation indicators of WB-PESQ, NB-PESQ, STOI, and SI-SDR is better than the original model. Therefore, the FullSubNet-pMix method proposed in this paper can effectively enhance the ability of the model to extract and use voice information. The impact of different loss functions on the training performance was also verified.
1. Introduction
In people’s daily lives, speech signals are easily contaminated by external factors, such as background noise and reverberation. The purpose of speech enhancement is to attenuate noise and reverberation from noisy speech and to preserve clean speech. In recent years, deep learning-based speech enhancement has achieved significant progress. This method can be broadly categorized into two approaches: time domain method and time-frequency domain method. The former method directly processes the speech waveform in the time domain [1,2,3], while the latter method employs short-time Fourier transform (STFT) to convert the time-domain speech into a frequency spectrum represented in the time-frequency domain and processes the spectrum as input features [4,5,6]. The latter approach can enhance the noisy speech by predicting masks (e.g., IBM [7], IRM [8], CRM [9], and PSM [10]) required for speech enhancement. These masks come in different types and serve various purposes.
FullSubNet is a time-frequency domain-based speech enhancement model [11] that takes the magnitude spectrum of the noisy speech as input features. Through a deep learning structure consisting of two parts, full-band and sub-band, it generates a mask to achieve speech enhancement. The model has achieved good results, but there are points for improvement in the approach it uses. Firstly, the original model does not utilize the phase spectrum of the noisy speech, which can result in deviations in the phase of the enhanced output compared to clean speech. Additionally, during the sub-band division, the width of each sub-band also affects the model’s performance. Choosing an appropriate sub-band width hyperparameter allows the model to better capture the local frequency characteristics of speech. The Lookahead hyperparameter influences the model’s consideration of future information. Selecting suitable values for these two hyperparameters will allow the model’s capabilities to be more fully utilized. The proposed method in this paper addresses these two aspects and improves upon the original model.
2. Related Works
This paper presents an optimization of the original FullSubNet model and proposes the FullSubNet-pMix method. This method utilizes both the magnitude spectrum and the phase spectrum of the speech, allowing the information from these two spectra to interact with each other. The extracted information after interaction better reflects the characteristics of the noisy speech. Furthermore, hyperparameter optimization was performed on the model. The width of the sub-band frequency range was adjusted to achieve a more reasonable division of frequency bands. Additionally, the value of the Lookahead hyperparameter was changed to enable the model to consider future information more appropriately. Experimental results demonstrate that the proposed model outperforms the original model in terms of speech enhancement on the same training and test sets. Through ablation experiments, it was found that the respective improvements independently contribute to the enhancement of the model’s speech enhancement performance.
To achieve the capabilities described in the speech enhancement model, two key points need to be addressed: firstly, to obtain more valuable information during the pre-processing of speech before training; secondly, to effectively and fully utilize the acquired information during the model training process.
In speech enhancement, the valuable information primarily includes the magnitude spectrum, phase spectrum, real spectrum, and imaginary spectrum of the speech. The real spectrum and imaginary spectrum contain both magnitude and phase information. In recent years, various approaches have been proposed to better utilize the extracted information. The PACDNN model [12] enhances both the magnitude spectrum and phase spectrum simultaneously. The CycleGan model [13] applies 2D convolutional processing to the magnitude spectrum and phase spectrum of the speech. One model [14] leverages the real spectrum and imaginary spectrum of the audio and utilizes encoder layers to reduce information loss during the training process. Another model [15] for speech enhancement directly utilizes deep complex-valued networks on the STFT representation, incorporating the phase information of the input speech. Some models [16,17] takes the real and imaginary spectrum of the speech signal as input, which contain the phase information of the signal. The FullSubNet+ model [18] takes the magnitude spectrum, real spectrogram, and imaginary spectrogram of the speech signal as input, where the latter two spectrograms contain the phase information of the signal.
3. The Proposed Method Architecture
The objective of this paper is to enhance noisy speech in the short-time Fourier transform (STFT) domain and attenuate background noise and reverberation to obtain clean speech. To accomplish this task, a model architecture named FullSubNet-pMix is proposed, as shown in Figure 1. This method utilizes the magnitude spectrum and phase spectrum of the speech in the frequency domain. It consists of three main components: an information interaction module, a full-band module, and a sub-band module. The sub-band module takes the information from the full-band module as part of its input.
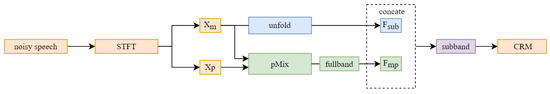
Figure 1.
Structure of FullSubNet-pMix. The pMix block implements the interaction of magnitude and phase information. The unfold block partitions the magnitude spectrum into sub-bands. The full-band block obtains the features of the full-band. The concatenate operation concatenates the sub-bands’ features with the full-band’s features. The sub-band block obtains the features of all sub-bands.
The model takes the magnitude spectrum and the phase spectrum as input, where represents the temporal length of the speech and represents the number of frequencies obtained after performing STFT on the speech.
After the magnitude spectrum and phase spectrum are input into the model, the pMix module is first utilized to extract the temporal correlation of the phase spectrum and facilitate information interaction between the magnitude and phase spectra. The output of this module, denoted as , is then fed into the subsequent full-band module to extract features and obtain the full-band feature , which contains both the phase spectrum and magnitude spectrum information.
By contrast, the initial input magnitude spectrum is divided into multiple sub-band units , using the unfold module, where each unit corresponds to a specific frequency range. The full-band spectrum feature and the sub-band units are concatenated to form the complete sub-band information. This information is then fed into the sub-band module to extract information and generate the predicted target CIRM using deep learning. The following sections provide a detailed description of these modules.
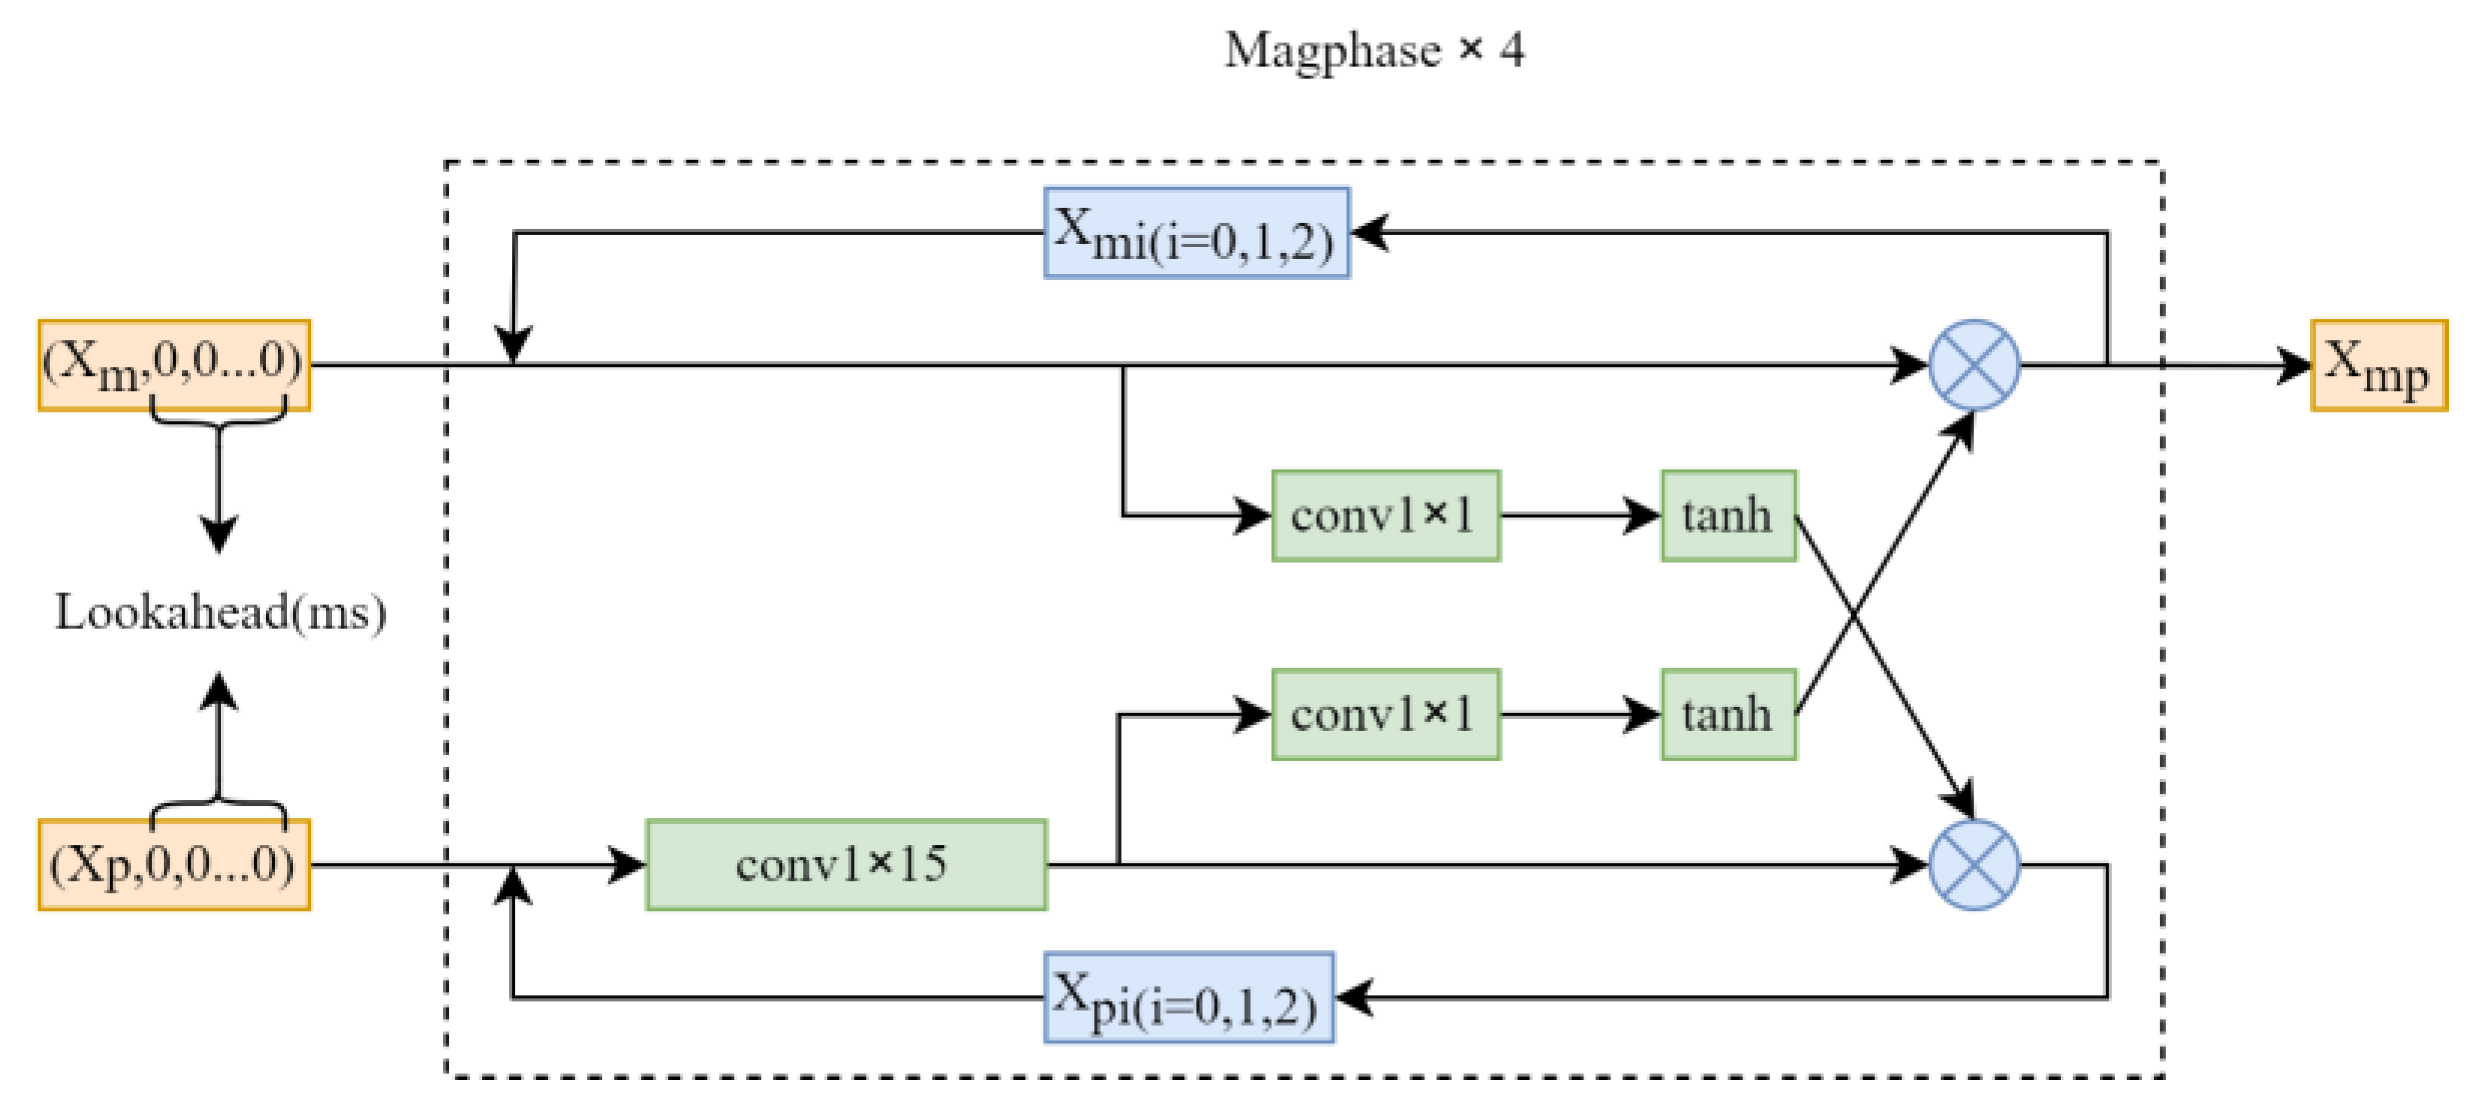
The structure of the PMix module is illustrated in Figure 2. This unit takes the magnitude spectrum and phase spectrum as inputs and pads them with zeros, where the number of zeros is determined by the Lookahead value. PMix consists of four consecutive Magphase units. In each Magphase unit, a single 2D convolutional layer is used to process the input phase spectrum feature, followed by the information interaction between the phase and magnitude spectra. The corresponding formula is as follows:
where represents the output features of the i-th phase spectrum passed through the convolutional layer in Magphase. and represent the input and output information, respectively. The convolutional layer utilizes a kernel of size , aiming to capture the temporal correlation of the phase spectrum within a certain time range. There is no normalization layer or activation function following this convolutional layer.
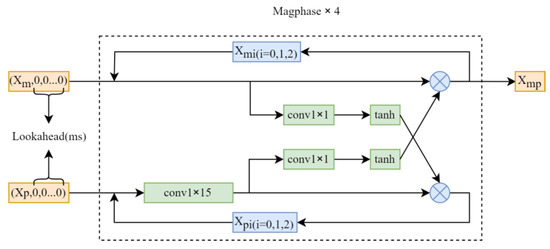
Figure 2.
Structure of pMix. The term ‘lookahead’ refers to zero-padding applied after the input features. The structure inside the dashed box is called the Magphase unit, and four connected Magphase units form the pMix block.
The addition of phase features in the input helps improve the training results of speech enhancement, and the interaction between phase and magnitude features also contributes to the prediction of the target result [19]. In the final part of the Magphase unit, there is a module that facilitates the interaction of information between the magnitude and phase. The calculation formula for the elements input into this module is as follows:
where represents the transfer of phase spectrum information to the magnitude spectrum, and represents the transfer of magnitude spectrum information to the phase spectrum. The formula for this function is as follows:
where denotes element-wise multiplication between two matrices, and represents a convolution. The effect of the function is to restrict the range of the output of the convolutional layer to [–1, 1], thereby introducing non-linear activation on the output of the convolutional layer and enhancing the network’s expression capability. The convolutional layer performs spatial feature extraction on input data, capturing local patterns and spatial hierarchies, allowing the model to learn important features of the phase spectrum and magnitude spectrum.
The magnitude spectrum contains the amplitude information of the signal, while the phase spectrum contains the phase information. By using the Magphase module to combine these two spectra, the model can simultaneously consider both amplitude and phase features. Therefore, using the combination of magnitude and phase spectra can provide a more comprehensive feature representation, thereby enhancing the capability of the model.
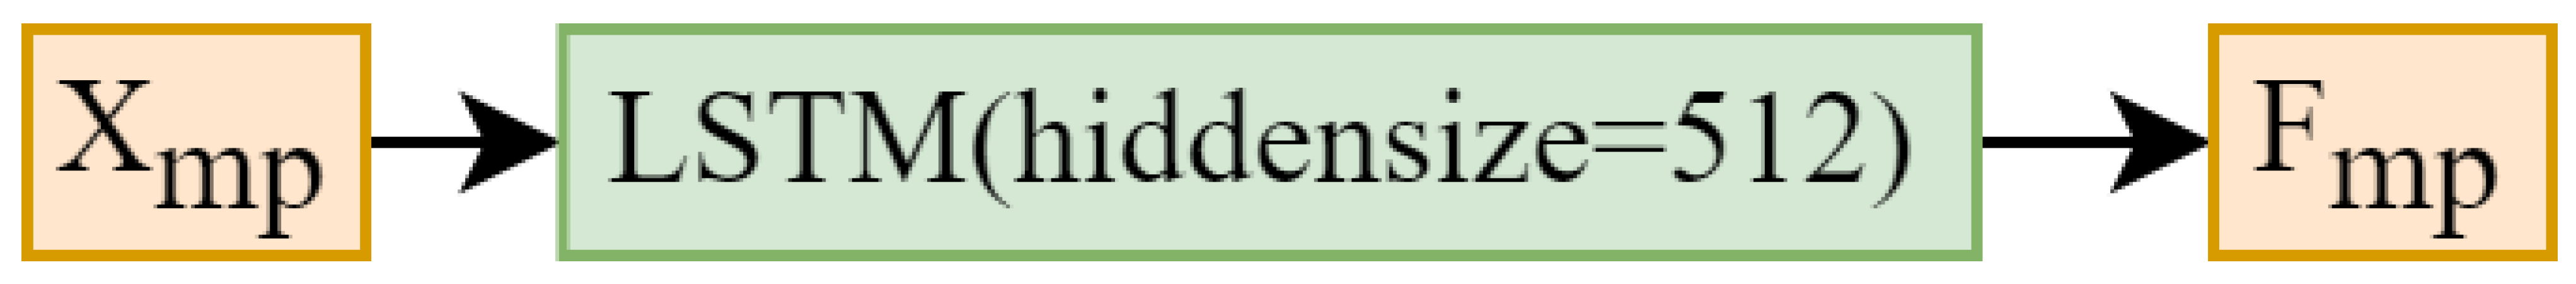
To enable the model to learn features of both magnitude and phase in the full-band, there is a full-band module. The structure of this module, as shown in Figure 3, primarily consists of a LSTM layer with 512 hidden units. It is designed to extract the full-band information obtained from the output of the pMix module and output the full-band feature , which includes both magnitude and phase information.
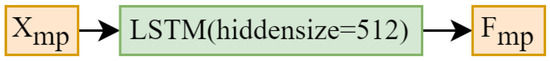
Figure 3.
Structure of full-band. The LSTM (hidden size = 512) block denotes a LSTM layer with 512 hidden units.
The unfold module’s specific function is to divide the full-band into sub-bands. For each frequency in the noisy speech spectrum, it takes the corresponding frequency vector along the time axis. With this vector as the center, it selects frequency vectors from both sides, resulting in a total width of . For the frequency axes on the upper and lower sides of the spectrum where the surrounding frequencies are less than , the missing side’s frequency axis vector is mapped to the missing part of the vector. This process generates sub-bands centered around the corresponding frequency axes. Combining all the sub-bands together forms the unit. The number of sub-bands in this unit is the same as the number of frequency points in the full-band spectrum, which is .
The width of the sub-bands affects the model’s extraction of inter-sub-band correlation features. In the model, the sub-bands are divided by taking one frequency point as the center and extending it above and below by a set length. In this paper, after performing STFT, the number of frequency points in the spectrum is 257, which corresponds to the division of 257 sub-bands.
In the original FullSubNet paper [11], the width of the sub-bands was set to 15. However, after conducting experiments, it was found that adjusting the width of the sub-bands resulted in better experimental results. This indicates that an appropriate sub-band width allows the model to learn sub-band features more effectively.
The unit and the unit are concatenated to obtain the final value given to the sub-band unit, denoted as . consists of independent vectors, each with a dimension of , where represents the temporal length of the corresponding noisy signal. In terms of the included features, contains the spectral information surrounding the corresponding frequency axis and the temporal correlation features, i.e., local information. contains the global information extracted from the amplitude and phase spectrum, including the full-band amplitude information and phase information.
In order to enable the model to learn the detailed sub-band features of the audio signal spectrum along the frequency axis, a sub-band module is introduced at the end of the model. The structure of this module is depicted in Figure 4, and it consists of two unidirectional LSTM layers with 384 hidden units each. No activation layer is included between these layers. The sub-band module predicts the complex ratio mask (CRM) by weighting the sub-band noise with respect to different frequency bands and combining it with the output of the previous full-band feature extractor.

Figure 4.
Structure of sub-band. The LSTM (hidden size = 384) block denotes an LSTM layer with 384 hidden units.
The same loss function as the baseline model [11], mean square error (MSE) loss, was used. Additionally, the impact of two other loss functions, mean absolute error (MAE) loss and Huber loss, on the model’s training effectiveness was also tested. The formulas for these three loss functions are as follows:
where represents the number of audio samples in each training batch, represents the number of frequency bins in the spectrum, represents the length of the time axis in the spectrum, and denotes the real and imaginary parts of the mask. Huber loss is a combination of the other two loss functions, with as a hyperparameter. The value of determines the emphasis of Huber loss on MSE loss and MAE loss.
CRM is generated by the model when inputting the noisy speech, and CIRM is the complex ideal ratio mask constructed from the real and imaginary parts of the clean and noisy speech spectrum; it is calculated by the following formula:
where represents the noisy speech, represents the clean speech, and represents the complex ideal ratio mask, with the subscripts and denoting the real and imaginary parts, respectively.
4. Experimental Setup
4.1. Dataset
The dataset used in this experiment is the Interspeech 2021 Deep Noise Suppression Challenge dataset [20]. It includes clean speech, test sets, noise, and reverberation. The clean speech consists of 500 h of speech segments from 2150 speakers, while the noise comprises 150 classes with over 180 h of sound segments. The processing of these sound segments aligns with the training set processing method described in [18].
The test set used in the experiment is the Interspeech 2021 test dataset, which is the same as the test set used in other comparative experiments.
4.2. Experimental Details
Before performing deep learning, it is necessary to convert audio into time-frequency domain by using short-time Fourier transform (STFT) to obtain the spectrum as input feature. The formula for time-frequency transformation is as follows:
where represents the duration of the audio, represents the number of frequency points in the spectrum, and represents the analysis window function used in this STFT. The window function used in this paper is a Hann window of length 32 ms (512 frames) with a frame shift of 16 ms.
The formula for the discrete short-time Fourier transform is as follows:
where represents the input discrete-time audio signal, represents the hop size, which indicates the length of window function movement on the signal, represents the window function, represents the time frame of the spectrum, and represents the frequency bin of the spectrum.
After performing STFT, we obtain the phase spectrum and magnitude spectrum of the speech signal, as well as the real spectrum and imaginary spectrum. This paper mainly focuses on the first two.
Programming environment: In our study, we employed the Python programming language for implementing all models on a Windows 10 system. During the training phase, a NVIDIA Tesla V100S GPU with 32 GB of memory was utilized to enhance computational performance.
Consistency was maintained in the training parameter configuration across all speech data. We employed the Adam optimizer with a learning rate of 1 × 10⁻³. To promote effective learning, exponential decay with decay rates of was applied once per epoch. The batch size for training was set to 32. Additionally, to ensure reproducibility, the random seed values for numpy, pytorch-gpu, and pytorch-cpu were set to 0.
The baseline model comprises a full-band unit and a sub-band unit. For the baseline, a sub-band width of 15 was employed. To capture future information, we set the Lookahead value to 32.
In our proposed method, we introduced a pMix unit alongside the full-band and sub-band units. The pMix unit consisted of four unidirectional Magphase units. The number of hidden units in the LSTM layers for the full-band and sub-band units remained consistent with the baseline, specifically 512 and 384, respectively. In our specific model configuration, the sub-band width was set to 10, while the Lookahead value was set to 2.
4.3. Evaluation Protocol
There are two main methods for evaluating the quality of speech enhancement: subjective evaluation and objective evaluation. Subjective evaluation provides a direct reflection of human perception of speech quality, but it is time-consuming and requires human participation. Therefore, in the experiments, objective evaluation methods are primarily chosen to simulate human perception of speech quality using various types of data.
STOI is short-time objective intelligibility measure. It is calculated using the following formula [21]:
where represents the m-th frame of the speech, represents the j-th one-third octave band, represents the clean speech, represents the normalized and clipped enhanced speech, represents the sample average of the corresponding vectors, represents the intermediate intelligibility measure, represents the total number of frames, represents the number of one-third octave bands, and is the average of the intermediate intelligibility measure. The value of is between 0 and 1 due to the magnitude relationship between vector products and modulus products, and the value of is between 0 and . The value of is also between 0 and 1.
A higher value indicates a higher proportion of speech that is intelligible to human ears after speech enhancement, resulting in better perceived speech quality. When presenting evaluation results, the STOI value is typically expressed as a percentage.
SI-SDR is scale-invariant signal-to-distortion ratio. It is calculated using the following formula:
where represents the time-domain vector of the clean speech, represents the time-domain vector of the noise, where is obtained by subtracting the model’s output speech from the clean speech. A higher SI-SDR value indicates less distortion in the enhanced speech compared to the clean speech.
5. Result and Analysis
5.1. Comparison of Models Using Different Hyperparameters
The sub-band width has a significant impact on feature extraction in the sub-band model. The sub-band width itself is a hyperparameter, determining the size of frequency bands into which the frequency axis is equally divided before extracting sub-band features. When the value of is too small, it indicates that the frequency bands are centered around the corresponding frequency axis, resulting in a limited inclusion of adjacent frequencies. In this case, the sub-band can only capture correlated features within a narrow frequency range. When the value of is too large, it means that a large number of adjacent frequencies are included, and the sub-band width gradually approaches the full-band, losing the ability to extract sub-frequency-domain correlations effectively. Only by setting an appropriate value for the sub-band width can it align with the frequency characteristics of human speech, allowing the model to learn sufficient and clear correlated features. Therefore, it is necessary to experiment with different sub-band widths in order to find the sub-band width value that approaches the optimal solution.
The Lookahead value represents the number of milliseconds by which the amplitude spectrum and phase spectrum of the input speech are zero-padded at the end of the time axis. A larger Lookahead value indicates that the full-band model considers more future information corresponding to the current input speech, thereby emphasizing the correlation features between the current speech and the future input speech. In previous experiments, this value is commonly set to 32 milliseconds. As shown in Table 1, in the ablation experiments that incorporated the influence of echo, various combinations of Lookahead values and sub-band widths were explored, aiming to find the most suitable values while considering the correlation between these two hyperparameters. From experiments 1 to 8, it was found that when the number of Magphase units is 4, a closer Lookahead value to 2, and a sub-band width closer to 10 results in better model performance. By contrast, experiments 9 to 13 revealed that when the number of Magphase units is 3, a Lookahead value closer to 16 and a sub-band width closer to 20 led to better model performance. This conclusion demonstrates the complex interdependence among the hyperparameters of the proposed model, and selecting appropriate values for these hyperparameters can effectively improve the model’s performance.

Table 1.
The effect of different hyperparameters on speech enhancement ability.
5.2. Comparison of Models Using Different Magphase
The Magphase unit is used to extract the amplitude spectrum and phase spectrum features of speech in the full-band unit and combine the information provided by them. Table 2 presents ablation experiments with different numbers of Magphase units, demonstrating the effectiveness of these units in improving the model’s performance. In the model structures used in Table 2, apart from the varying number of concatenated Magphase units, all other units and parameters are kept the same. The Magphase column indicates the number of concatenated information interaction units in the FullSubNet-pMix model. The results of experiments 1 to 6 in Table 2 demonstrate that adding these units amplifies the effect of speech enhancement. Furthermore, the data from experiments 7 to 11 in Table 2 indicate that the best amplification effect is achieved when the number of Magphase units is 4.
Table 2.
The effect of Magphase units on speech enhancement capabilities.
5.3. Actual Effects and Comparison with Advanced Systems
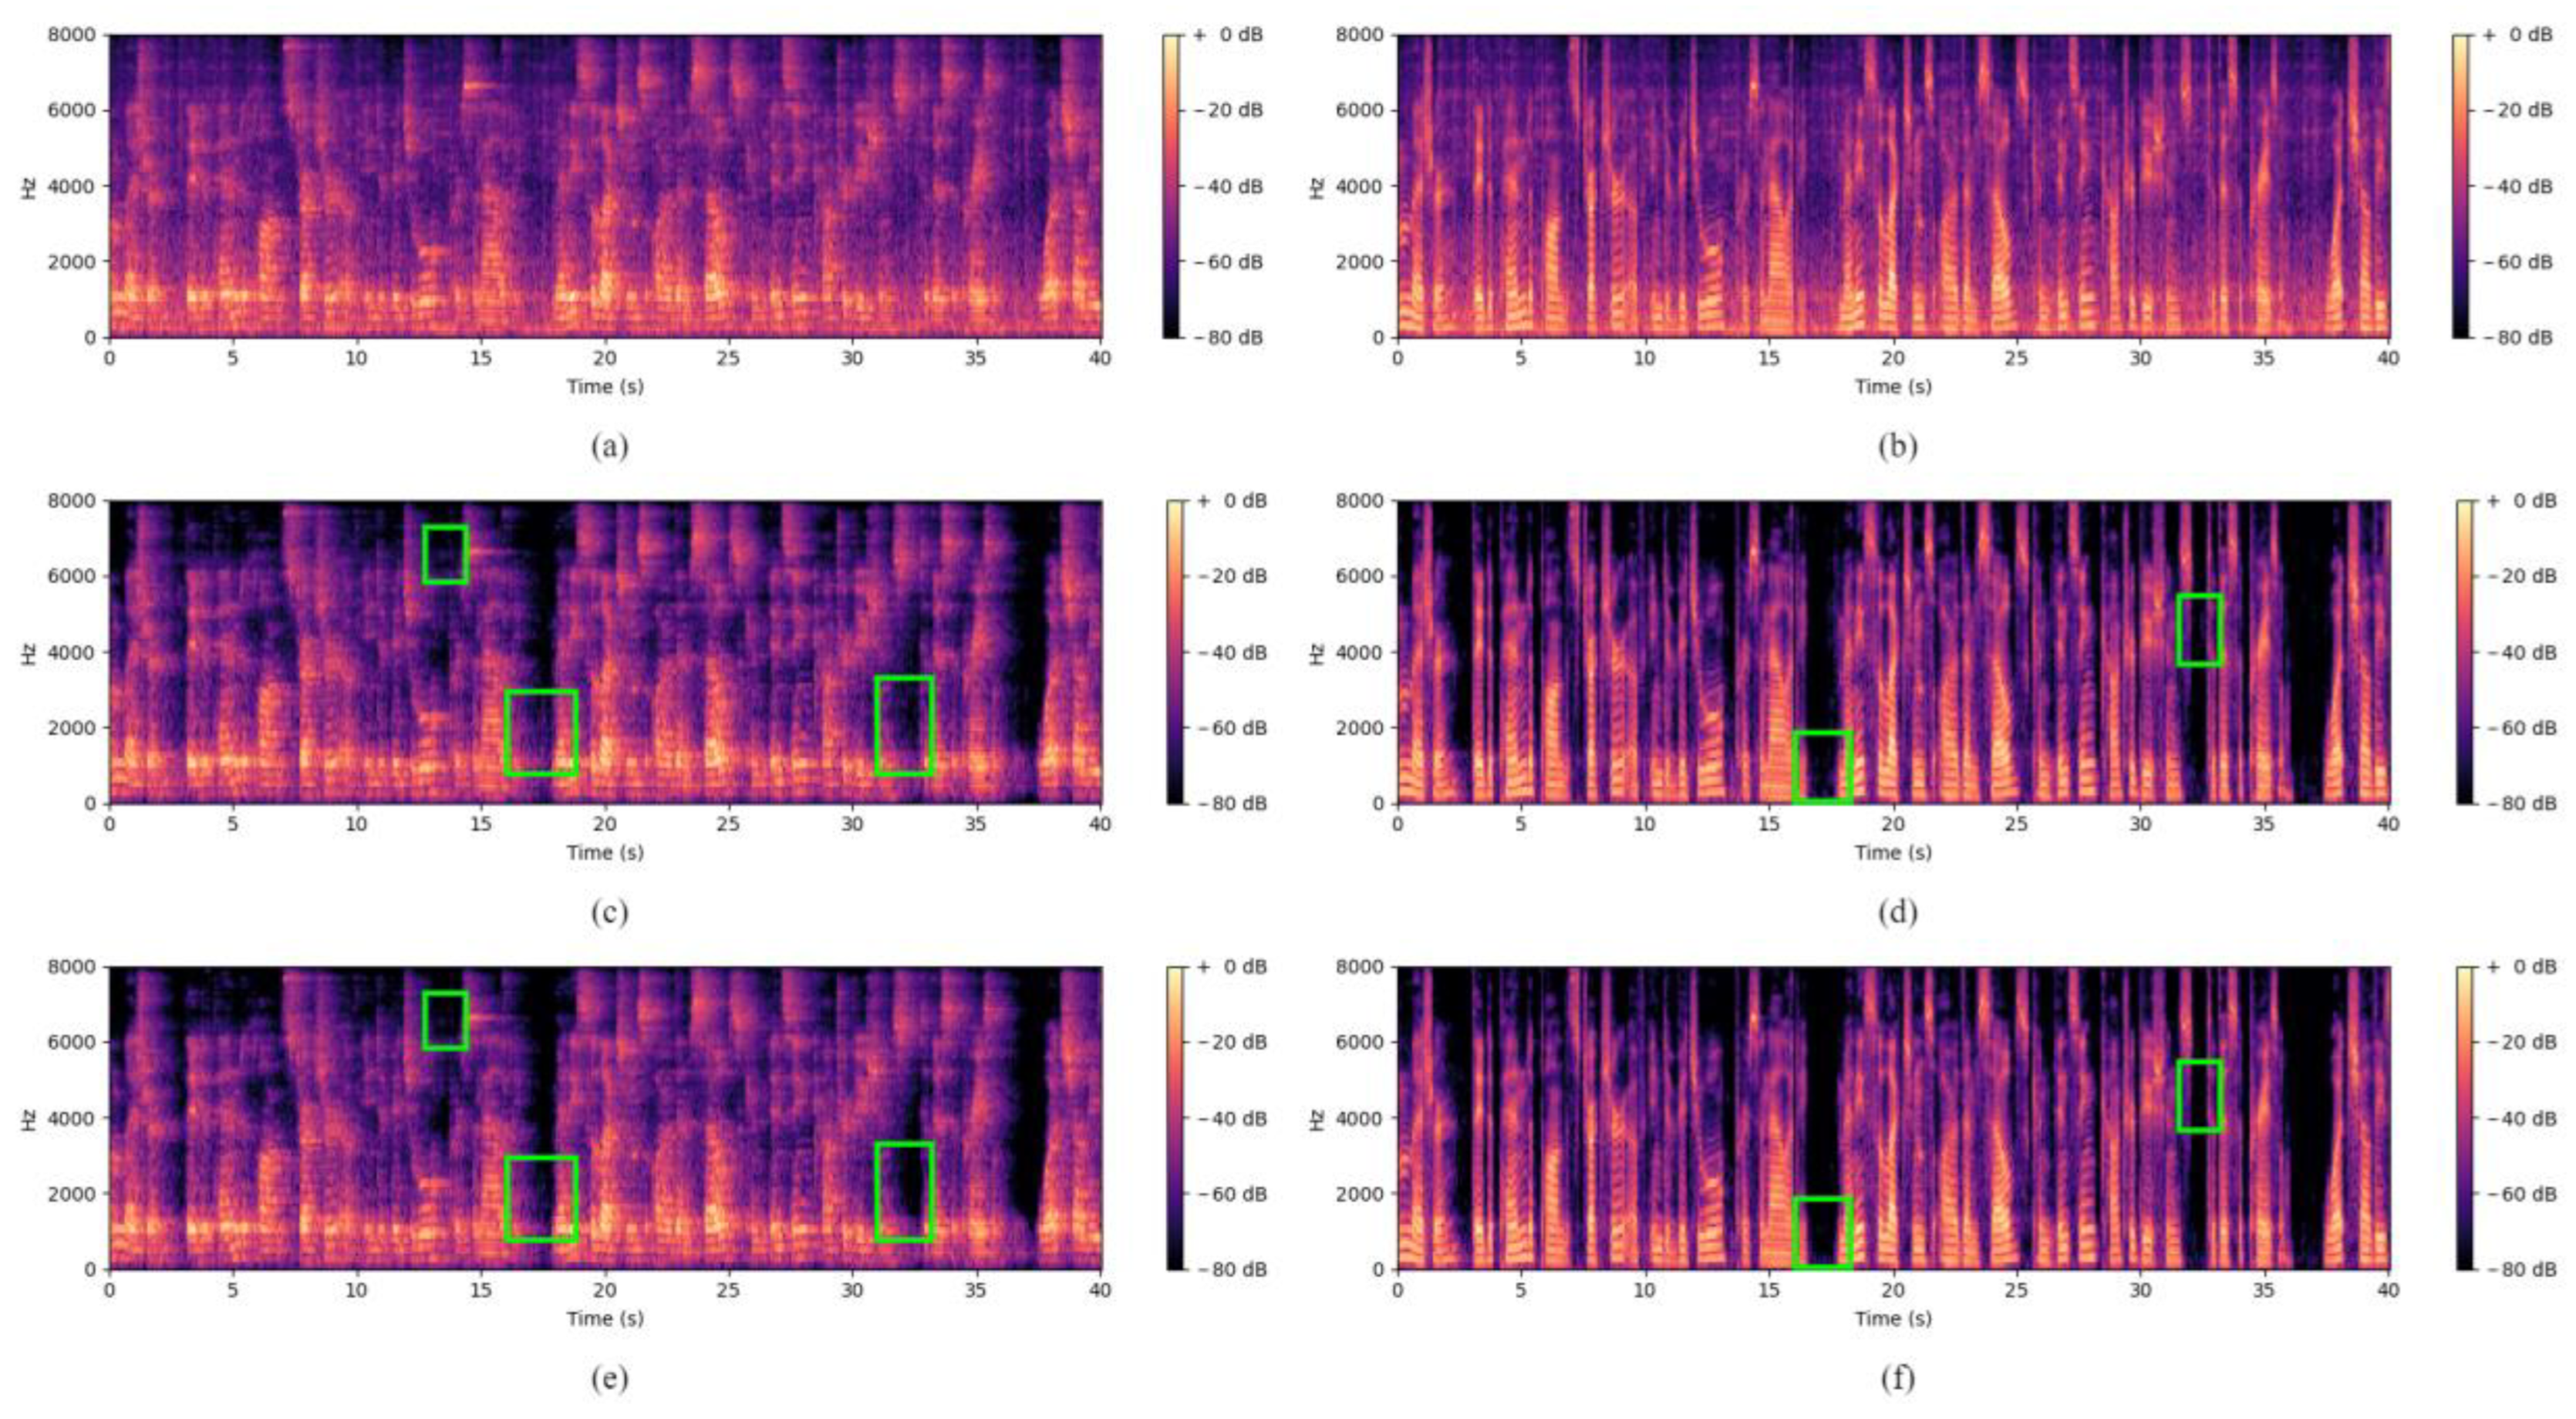
Figure 5 compares the actual effects of speech enhancement between the baseline (FullSubNet) and FullSubNet-pMix using spectrograms. In the figure, (a) represents the noisy speech with reverberation; (b) represents the noisy speech without reverberation, where the added noise is the same as in (a); (c) represents the result of baseline speech enhancement with reverberation; (d) represents the result of baseline speech enhancement without reverberation; (e) represents the result of speech enhancement using the proposed method with reverberation; and (f) represents the result of speech enhancement using the proposed method without reverberation. The green boxes in the figure indicate the specific differences between the baseline and the proposed method after speech enhancement. From the figure, it can be observed that, regardless of the presence of reverberation, FullSubNet-pMix achieves better speech enhancement results compared to the baseline.
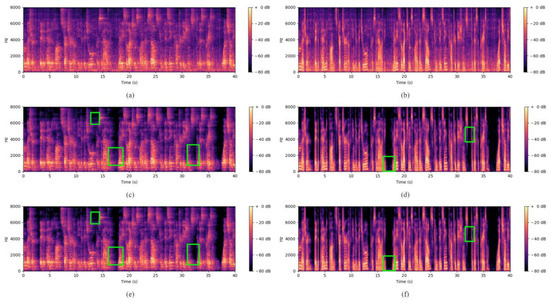
Figure 5.
Comparison of the actual effect of voice enhancement. (a) represents the noisy speech with reverberation; (b) represents the noisy speech without reverberation; (c) represents the result of baseline speech enhancement with reverberation; (d) represents the result of baseline speech enhancement without reverberation; (e) represents the result of speech enhancement using the proposed method with reverberation; (f) represents the result of speech enhancement using the proposed method without reverberation.
The experimental results were compared with other models on the Interspeech 2021 test dataset. These models were selected from previous participating models in the Interspeech speech enhancement competition, and corresponding papers were published. Since some of these models are not open source, the data used in the table are obtained from their respective papers. The DCCRN-E model [4] utilizes a five-layer convolutional encoder to extract high-level features from the input. The PoCoNet model [22] employs self-attention mechanisms to capture temporal information. The TRU-NET model [23] uses energy-normalized spectrum as input features for each channel.
For the results obtained by the proposed models in the table, Table 3 corresponds to the evaluation of speech enhancement results in the presence of reverberation in the noisy speech, while Table 4 represents the case without reverberation. FullSubNet refers to the baseline model with Lookahead hyperparameters of 32 and a sub-band width of 15. FullSubNet-pMix represents the proposed method in this paper, with 4 Magphase units, a Lookahead of 2, and a sub-band width of 10. From the table, it can be observed that, for all four evaluation metrics, the proposed method outperforms other recent speech enhancement models in the presence of reverberation. In the absence of reverberation, except for a slight inferiority compared to TRU-NET, the FullSubNet-pMix model shows better speech enhancement performance compared to other models. Regardless of the presence of reverberation, the results show improvement compared to the baseline, demonstrating the effectiveness of the proposed method.
Table 3.
Comparison of speech enhancement results among different models (with reverberation).
Table 4.
Comparison of speech enhancement results among different models (without reverberation).
5.4. Comparison of Models Using Different Loss
The speech enhancement performance of FullSubNet-pMix was compared using different loss functions during training. Three loss functions, namely MAE loss, MSE loss, and Huber loss, were compared. The training dataset consisted of reverberant noisy speech. The final results are presented in Table 5. The value of the hyperparameter in Huber loss is set to 1.
Table 5.
Comparison of speech enhancement results among different loss (without reverberation).
The experimental results were compared with other models on the Interspeech 2021 test dataset. The model used is FullSubNet-pMix with a Magphase set to 4, a lookahead set to 2, and a sub-band width set to 10. From the experimental results, it can be observed that using MSE loss as the loss function yields the best training performance with this model.
6. Conclusions
This paper presents improvements on the FullSubNet model by introducing a pMix unit, which enables the model to utilize phase spectrum information and facilitate information interaction between magnitude and phase spectra, leading to the extraction of more comprehensive features from the noisy speech. The parameters of the original model were also optimized, resulting in improved performance as demonstrated by the ablation experiments. The proposed approach achieves superior results compared to the baseline model on the utilized dataset and outperforms the majority of existing deep learning-based speech enhancement models. Additionally, it was experimentally verified that MSE loss achieves the best performance when training the proposed model in this study. However, there are still areas for further improvement in this method, such as exploring better ways to leverage full-band phase information and incorporating phase features into the sub-band units.
Author Contributions
Conceptualization, Q.Y. and R.Z.; methodology, Q.Y.; software, Q.Y.; validation, Q.Y. and R.Z.; formal analysis, Q.Y.; investigation, Q.Y.; resources, R.Z.; data curation, R.Z.; writing—original draft preparation, Q.Y.; writing—review and editing, Q.Y.; visualization, R.Z.; supervision, R.Z.; project administration, R.Z. All authors have read and agreed to the published version of the manuscript.
Funding
This research received no external funding.
Institutional Review Board Statement
Not applicable.
Informed Consent Statement
Not applicable.
Data Availability Statement
The Interspeech 2021 Deep Noise Suppression Challenge dataset used in this paper can be accessed by the following link: (https://github.com/microsoft/DNS-Challenge/tree/master/datasets, accessed on 12 January 2023).
Conflicts of Interest
The authors declare no conflict of interest.
References
- Hao, X.; Xu, C.; Xie, L.; Li, H. Optimizing the Perceptual Quality of Time-Domain Speech Enhancement with Reinforcement Learning. Tsinghua Sci. Technol. 2022, 27, 939–947. [Google Scholar] [CrossRef]
- Pandey, A.; Xu, B.; Kumar, A.; Donley, J.; Calamia, P.; Wang, D. TPARN: Triple-path attentive recurrent network for time-domain multichannel speech enhancement. In Proceedings of the ICASSP 2022—2022 IEEE International Conference on Acoustics, Speech and Signal Processing (ICASSP), Singapore, 23–27 May 2022; pp. 6497–6501. [Google Scholar]
- Song, Z.; Ma, Y.; Tan, F.; Feng, X. Hybrid dilated and recursive recurrent convolution network for time-domain speech enhancement. Appl. Sci. 2022, 12, 3461. [Google Scholar] [CrossRef]
- Hu, Y.; Liu, Y.; Lv, S.; Xing, M.; Zhang, S.; Fu, Y.; Wu, J.; Zhang, B.; Xie, L. DCCRN: Deep complex convolution recurrent network for phase-aware speech enhancement. arXiv 2020, arXiv:2008.00264. [Google Scholar]
- Zhao, S.; Ma, B.; Watcharasupat, K.N.; Gan, W.-S. FRCRN: Boosting feature representation using frequency recurrence for monaural speech enhancement. In Proceedings of the ICASSP 2022—2022 IEEE International Conference on Acoustics, Speech and Signal Processing (ICASSP), Singapore, 23–27 May 2022; pp. 9281–9285. [Google Scholar]
- Lv, S.; Fu, Y.; Xing, M.; Sun, J.; Xie, L.; Huang, J.; Wang, Y.; Yu, T. S-dccrn: Super wide band dccrn with learnable complex feature for speech enhancement. In Proceedings of the ICASSP 2022—2022 IEEE International Conference on Acoustics, Speech and Signal Processing (ICASSP), Singapore, 23–27 May 2022; pp. 7767–7771. [Google Scholar]
- Gogate, M.; Dashtipour, K.; Adeel, A.; Hussain, A. CochleaNet: A robust language-independent audio-visual model for real-time speech enhancement. Inf. Fusion 2020, 63, 273–285. [Google Scholar] [CrossRef]
- Li, R.; Sun, X.; Li, T.; Zhao, F. A multi-objective learning speech enhancement algorithm based on IRM post-processing with joint estimation of SCNN and TCNN. Digit. Signal Process. 2020, 101, 102731. [Google Scholar] [CrossRef]
- Yu, H.; Zhu, W.-P.; Yang, Y. Constrained Ratio Mask for Speech Enhancement Using DNN. In Proceedings of the INTERSPEECH, Shanghai, China, 25–29 October 2020; pp. 2427–2431. [Google Scholar]
- Hasannezhad, M.; Ouyang, Z.; Zhu, W.-P.; Champagne, B. Speech enhancement with phase sensitive mask estimation using a novel hybrid neural network. IEEE Open J. Signal Process. 2021, 2, 136–150. [Google Scholar] [CrossRef]
- Hao, X.; Su, X.; Horaud, R.; Li, X. Fullsubnet: A full-band and sub-band fusion model for real-time single-channel speech enhancement. In Proceedings of the ICASSP 2021—2021 IEEE International Conference on Acoustics, Speech and Signal Processing (ICASSP), Toronto, ON, Canada, 6–11 June 2021; pp. 6633–6637. [Google Scholar]
- Hasannezhad, M.; Yu, H.; Zhu, W.-P.; Champagne, B. PACDNN: A phase-aware composite deep neural network for speech enhancement. Speech Commun. 2022, 136, 1–13. [Google Scholar] [CrossRef]
- Yu, G.; Li, A.; Wang, Y.; Guo, Y.; Wang, H.; Zheng, C. Joint magnitude estimation and phase recovery using Cycle-in-Cycle GAN for non-parallel speech enhancement. In Proceedings of the ICASSP 2022—2022 IEEE International Conference on Acoustics, Speech and Signal Processing (ICASSP), Singapore, 23–27 May 2022; pp. 6967–6971. [Google Scholar]
- Li, A.; Zheng, C.; Zhang, L.; Li, X. Glance and gaze: A collaborative learning framework for single-channel speech enhancement. Appl. Acoust. 2022, 187, 108499. [Google Scholar] [CrossRef]
- Guimaraes, H.R.; Beccaro, W.; Ramırez, M.A. A perceptual loss based complex neural beamforming for Ambix 3D speech enhancement. In Proceedings of the L3DAS22: Machine Learning for 3D Audio Signal Processing Virtual, Singapore, 22–27 May 2022; pp. 16–20. Available online: https://www.isca-speech.org/archive/l3das_2022/guimaraes22_l3das.html (accessed on 18 May 2023).
- Yu, G.; Li, A.; Wang, H.; Wang, Y.; Ke, Y.; Zheng, C. DBT-Net: Dual-branch federative magnitude and phase estimation with attention-in-attention transformer for monaural speech enhancement. IEEE/ACM Trans. Audio Speech Lang. Process. 2022, 30, 2629–2644. [Google Scholar] [CrossRef]
- Tan, K.; Wang, D. Complex spectral mapping with a convolutional recurrent network for monaural speech enhancement. In Proceedings of the ICASSP 2019—2019 IEEE International Conference on Acoustics, Speech and Signal Processing (ICASSP), Brighton, UK, 12–17 May 2019; pp. 6865–6869. [Google Scholar]
- Chen, J.; Wang, Z.; Tuo, D.; Wu, Z.; Kang, S.; Meng, H. FullSubNet+: Channel attention fullsubnet with complex spectrograms for speech enhancement. In Proceedings of the ICASSP 2022—2022 IEEE International Conference on Acoustics, Speech and Signal Processing (ICASSP), Singapore, 23–27 May 2022; pp. 7857–7861. [Google Scholar]
- Yin, D.; Luo, C.; Xiong, Z.; Zeng, W. Phasen: A phase-and-harmonics-aware speech enhancement network. In Proceedings of the AAAI Conference on Artificial Intelligence, New York, NY, USA, 7–12 February 2020; pp. 9458–9465. [Google Scholar]
- Reddy, C.K.; Dubey, H.; Gopal, V.; Cutler, R.; Braun, S.; Gamper, H.; Aichner, R.; Srinivasan, S. ICASSP 2021 deep noise suppression challenge. In Proceedings of the ICASSP 2021—2021 IEEE International Conference on Acoustics, Speech and Signal Processing (ICASSP), Toronto, ON, Canada, 6–11 June 2021; pp. 6623–6627. [Google Scholar]
- Taal, C.H.; Hendriks, R.C.; Heusdens, R.; Jensen, J. An algorithm for intelligibility prediction of time–frequency weighted noisy speech. IEEE Trans. Audio Speech Lang. Process. 2011, 19, 2125–2136. [Google Scholar] [CrossRef]
- Isik, U.; Giri, R.; Phansalkar, N.; Valin, J.-M.; Helwani, K.; Krishnaswamy, A. Poconet: Better speech enhancement with frequency-positional embeddings, semi-supervised conversational data, and biased loss. arXiv 2020, arXiv:2008.04470. [Google Scholar]
- Choi, H.-S.; Park, S.; Lee, J.H.; Heo, H.; Jeon, D.; Lee, K. Real-time denoising and dereverberation wtih tiny recurrent u-net. In Proceedings of the ICASSP 2021—2021 IEEE International Conference on Acoustics, Speech and Signal Processing (ICASSP), Toronto, ON, Canada, 6–11 June 2021; pp. 5789–5793. [Google Scholar]


Disclaimer/Publisher’s Note: The statements, opinions and data contained in all publications are solely those of the individual author(s) and contributor(s) and not of MDPI and/or the editor(s). MDPI and/or the editor(s) disclaim responsibility for any injury to people or property resulting from any ideas, methods, instructions or products referred to in the content. |
© 2023 by the authors. Licensee MDPI, Basel, Switzerland. This article is an open access article distributed under the terms and conditions of the Creative Commons Attribution (CC BY) license (https://creativecommons.org/licenses/by/4.0/).