Article

Indicative Effect of Excess Topography on Potential Risk Location of Giant Ancient Landslides—A Case Study in Lengqu River Section

1
School of Marine Science and Engineering, Jiangsu Center for Collaborative Innovation in Geographical Information Resource Development and Application, Nanjing Normal University, Nanjing 210023, China
2
China-Pakistan Joint Research Center on Earth Sciences, Institute of Mountain Hazards and Environment, Chinese Academy of Sciences, Chengdu 610041, China
*
Author to whom correspondence should be addressed.
Appl. Sci. 2023, 13(14), 8085; https://doi.org/10.3390/app13148085
Submission received: 5 June 2023 / Revised: 6 July 2023 / Accepted: 7 July 2023 / Published: 11 July 2023

Abstract

:
In order to identify giant ancient landslides more effectively and to quantify the risk of giant ancient landslides, this study takes a Lengqu River section located on the Qinghai–Tibet Plateau as an example and then uses the red relief image map (RRIM) method to enhance the digital elevation model (DEM) for topographic 2D visualization to identify giant ancient landslides. Then, the relationships between giant ancient landslides (GALs), resurgent GALs, the deposition of inactive GALs and the excess topography of hillslopes under 30° threshold are analyzed separately. A total of 54 GALs are identified at last by using the RRIM method; 77.75% of GALs are still located on excess topography, 68.38% of resurgent GALs occurred on excess topography, and 62.21% of the deposition of inactive GALs are on non-excess topography. The RRIM method provides a new way to identify giant ancient landslides. The excess topography provides an indication of the risk of new landslides through the destructive effect of GALs on the threshold hillslope, and the preliminary investigation of the quantitative relationship between the resurrection of GALs and excess topography also shows that there is a certain pattern between the resurrection of GALs and the excess topography under the natural state, so the excess topography has a certain indication of the generation of new landslides and secondary resurrection at the original GAL positions.

1. Introduction

Landslide identification has always been an important direction in geological hazard research [1]. With the rapid development of remote sensing technology, the interpretation of landslides has gradually shifted from field census and visual interpretation to human–computer interactive interpretation [2]. Remote sensing technology has the advantages of short time consumption, labor saving, large area and all-round observation of landslides in landslide hazard identification. There have been many applications using chronological high-resolution remote sensing images to identify landslide disasters [3,4,5,6], and other researchers also prefer more intelligent machine learning algorithms to automate landslide extraction based on landslide features [7,8,9]. Nowadays, researchers are also increasingly inclined to use diverse interferometry synthetic aperture radar (InSAR) techniques for early identification of potential landslide hazards [10,11,12,13,14,15]. In addition, the identification of landslides by DEM should not be neglected. Landslides can often be identified directly by DEM or by using DEM-assisted optical remote sensing images; therefore, numerous researchers have chosen to effectively identify landslides with the help of DEM. For instance, DEM was used to assist high-resolution remote sensing images for more accurate landslide extraction [16]; landslides were well monitored by DEM data with different time phases [17]. The original DEM without any changes can only roughly discriminate landslide locations and elevations, for example, using the historical landslide morphology displayed by high-precision DEM combined with high-resolution remote sensing images to interpret landslides, but DEM cannot provide a realistic and detailed portrayal of the surface morphology. A DEM with enhanced mountain shadow visualization can observe certain landslide morphologies; however, the color contrast is not obvious and the details of the surface are not carved enough, which often leads to the misjudgment of landslides. Compared with the original DEM and hillshade, the sky view factor (SVF) is more detailed for landslide contours, but the specific structure of the landslide can still easily be misjudged due to the poor visual effect. Matching different time-phase DEMs to identify landslides often requires a consideration of the alignment accuracy of the two time-phase DEMs.
In order to use the DEM more easily and effectively, it is possible to increase the utilization of the DEM by rendering the terrain in 2D visualization and by zooming terrain features to extract related objects. Yokoyama et al. 2002 proposed a DEM-based terrain 2D visualization parameter, the name of which is topographic openness, to visualize terrain features in 2002 [18]. Then, CHIBA et al. 2008 proposed that RRIM can be synthesized from remote sensing images such as airborne light detection and ranging (LiDAR) and Shuttle Radar Topography Mission (SRTM) to visualize terrain and then used the visualized terrain map for the identification of geological hazards such as landslides [19], and topographic features such as fractures, deserts and landslides were identified in Mongolia and Japan by visualizing RRIM terrain transformations of the DEM [20]. Later, an assessment of the contribution of landslide interpretation in Turkey using 2D-visualized RRIM maps based on LiDAR data was made by Gorum 2019 [21]. This method is significant for the identification of geological hazards such as landslides and debris flows and can also provide support for laymen. All in all, the higher the DEM resolution, the more delicate the features [22,23]. We will introduce the RRIM 2D visualization terrain method supporting visual interpretation and try to use a 12.5 m DEM for the effective identification of GALs based on the above research in this research. Ancient landslides refer to landslides that occurred before the Holocene and have become relatively stable [24], and landslides with a volume of 100 × 104–1000 × 104 m3 are classified as giant landslides [25]. But in this paper, all landslides that occurred before the obtained DEM years are considered “ancient landslides”, where “ancient landslides” does not follow the definition of real ancient landslides in a strict temporal sense, and all landslides that are recognizable to the naked eye are considered “giant landslides”, which also does not follow the definition of giant landslides in the strict spatial sense.
We usually use susceptibility to evaluate the risk of landslides, which means we can select a few impact factors that are most relevant to the occurrence of landslides somewhere and then input both landslides and factors into a trained suitable machine learning model to predict the probability of landslides occurring [26,27,28,29]. Nowadays, researchers continue to improve the accuracy of landslide occurrence probability by changing the landslide influence factors and innovating the training models. Although this type of method is relatively simple to operate and can predict a wider area at the same time, it also has some disadvantages; for example, different scholars may not choose exactly the same landslide occurrence indicators for training the model in the same area. Different scholars often have different division methods to divide the training data into certain intervals in order to reduce the redundancy of data. In addition, the important aspect of negative sample selection is handled differently by different scholars. In a word, the inconsistency of the above operations usually leads to incomplete consistent results. Therefore, we need to find an indicator directly related to the occurrence of landslides as much as possible and explore the relationship between landslides and this indicator so that we can use this indicator to indicate or predict the risk of landslides to some extent. So, we note the concept of excess topography, which was proposed in 2015 and refers to the volume of rock located on a threshold hillslope angle that is indicative of potentially unstable slopes. A study extracted excess topography in the Himalayan Karakoram range based on a 90 m DEM, and then the relationship between 492 obtained bedrock landslides (rockslides and rock avalanches) and excess topography was quantitatively analyzed at last [30]. Later, Liu et al. 2021 extracted the excess topography of six watersheds in the Transverse Mountain region based on a 30 m DEM and quantitatively analyzed the relationship between the obtained data of 4430 large, medium and small landslide sites and the excess topography [31]. The studies of Blothe et al. and Liu et al. both found that more than 70% of landslides were still distributed on excess topography when the threshold hillslope is 30°. It is thus clear that most landslides occurred without changing the threshold hillslope, and excess topography can be used as an important indicator of actual landslides.
In this research, we try to effectively identify GALs in a Lengqu River section based on 12.5 m DEM data by RRIM transformation and explore the potential risk location of GALs by quantitatively analyzing relationships between GALs, resurgent GALs, the deposition of inactive GALs and excess topography. This research is intended to provide a new reference basis for the investigation of potential risk locations of GALs. One of the most important innovations of this paper is to enhance the morphology, color and other features of GALs through two-dimensional visualization of changes in the topography using 12.5 m DEM data so that researchers can easily interpret landslides and to update the catalog of GALs in the Lengqu River section. In addition, excess topography is an indicator of landslide occurrence on threshold hillslope damage, so, based on the indication of threshold hillslope damage by landslides using the concept of excess topography, we can easily investigate the risk locations of new landslides and the secondary resurgence of GALs at the original occurrence of GALs and also provide a basis for theoretical studies on the occurrence of GALs and the accurate detection of GAL activity such as by using InSAR and other techniques.

2. Study Area

The Lengqu River section is located in the upper reaches of the Nujiang River Basin, which is located in the transverse mountainous region of southeast Tibet at the contact between the Asian–European and Indian Ocean plates, and the variation in its elevation is between 1764 and 6610 m. It is a first-grade tributary of the Nujiang River Basin, and it has developed multi-stage terraces consisting of thick layers of well-rounded alluvial gravel. The Lengqu River section has a watershed area of 1884.89 km2, its elevation varies from 2673 to 5913 m, the slope range of it is 0–81°, but it is mainly concentrated in the range of 10–40°, and the length of its valley is about 106.73 km. The Lengqu River section is mainly composed of Duoni group, cretaceous diorite granite, Xiangdui group and Lagongtang group. Duoni group is mainly composed of gray and dark gray mudstone, shale, slate, sandstone, siltstone, feldspathic quartz sandstone, and locally contained volcanic rocks and mineable coal; cretaceous diorite granite shows a light flesh-colored medium- and fine-grained granite structure, with more potassium feldspar than plagioclase, followed by quartz, black mica and hornblende; Xiangdui group is mainly composed of purple-red and gray-violet feldspathic quartz sandstone, mud siltstone, siltstone, sandstone and conglomerate; Lagongtang group is mainly composed of gray and dark gray shale, siltstone shale interspersed with feldspathic quartz sandstone, quartz sandstone and lenticular chert. Due to the small distance among geological suture zones in the whole of southeast Tibet, the geological environment in the upper reaches of the Lengqu River section and nearby Nujiang River Basin is complex, and with fractures (especially two main fractures of the Nujiang River Fault and Basu Fault) and high mountain valleys developing, it is really a frequent place for geological disasters such as collapse, landslides and mudslides. It is particularly important to identify geological hazards in the upper reaches of the Lengqu River section and nearby Nujiang River Basin because the Sichuan–Tibet railway’s south Sichuan line runs through it [32]. The Lengqu River section studied in this research belongs to grade 10 watersheds in the HydroBASINS 12-level basin classification, which uses a sub-basin classification method from at least 100 km2 upstream of each branch of the river where the two branches meet. The study area is shown in Figure 1.

3. Research Data and Methods

3.1. Research Data

The data we used mainly include a 12.5 m DEM and resurgent GAL data, the main sources of which are shown in Table 1.
In addition, we conducted a secondary analysis based on the directly acquired DEM data and GAL resurgence data to obtain data for other subsequent analyses. The topography of the 12.5 m DEM is visualized in two dimensions, which makes the topography more clearly shown, and the GAL surfaces of the Lengqu River section are identified for subsequent analysis based on the 2D-visualized topography. The DEM in this research records the topography before the time of the published DEM, so the occurrence of the identified landslides is for landslides before this DEM time. In addition, the location of the identified landslide is not its original location, so the “seed grid” method is introduced in this research to correct the identified landslide location to some extent. The excess topography of the Lengqu River section at a certain threshold hillslope is extracted for subsequent analysis based on the 12.5 m DEM. The resurgent GAL data used are obtained based on the phase resonance enhanced InSAR (PRE-InSAR) technique by processing the Sentinel-1 dataset for every 30 periods of the 2019 lift-track and the PALSAR-1 dataset for the 2007–2011 lift-track, which reflect the activity characteristics of the GALs before resurgence, provided by the study of Yao et al. 2020 [33]. A total of 16 active landslide surfaces located in the Lengqu River section were monitored by Yao et al. By comparison with the location of GALs in the Lengqu River section, six of them belonged to GAL resurgence surfaces.

3.2. Research Methodology

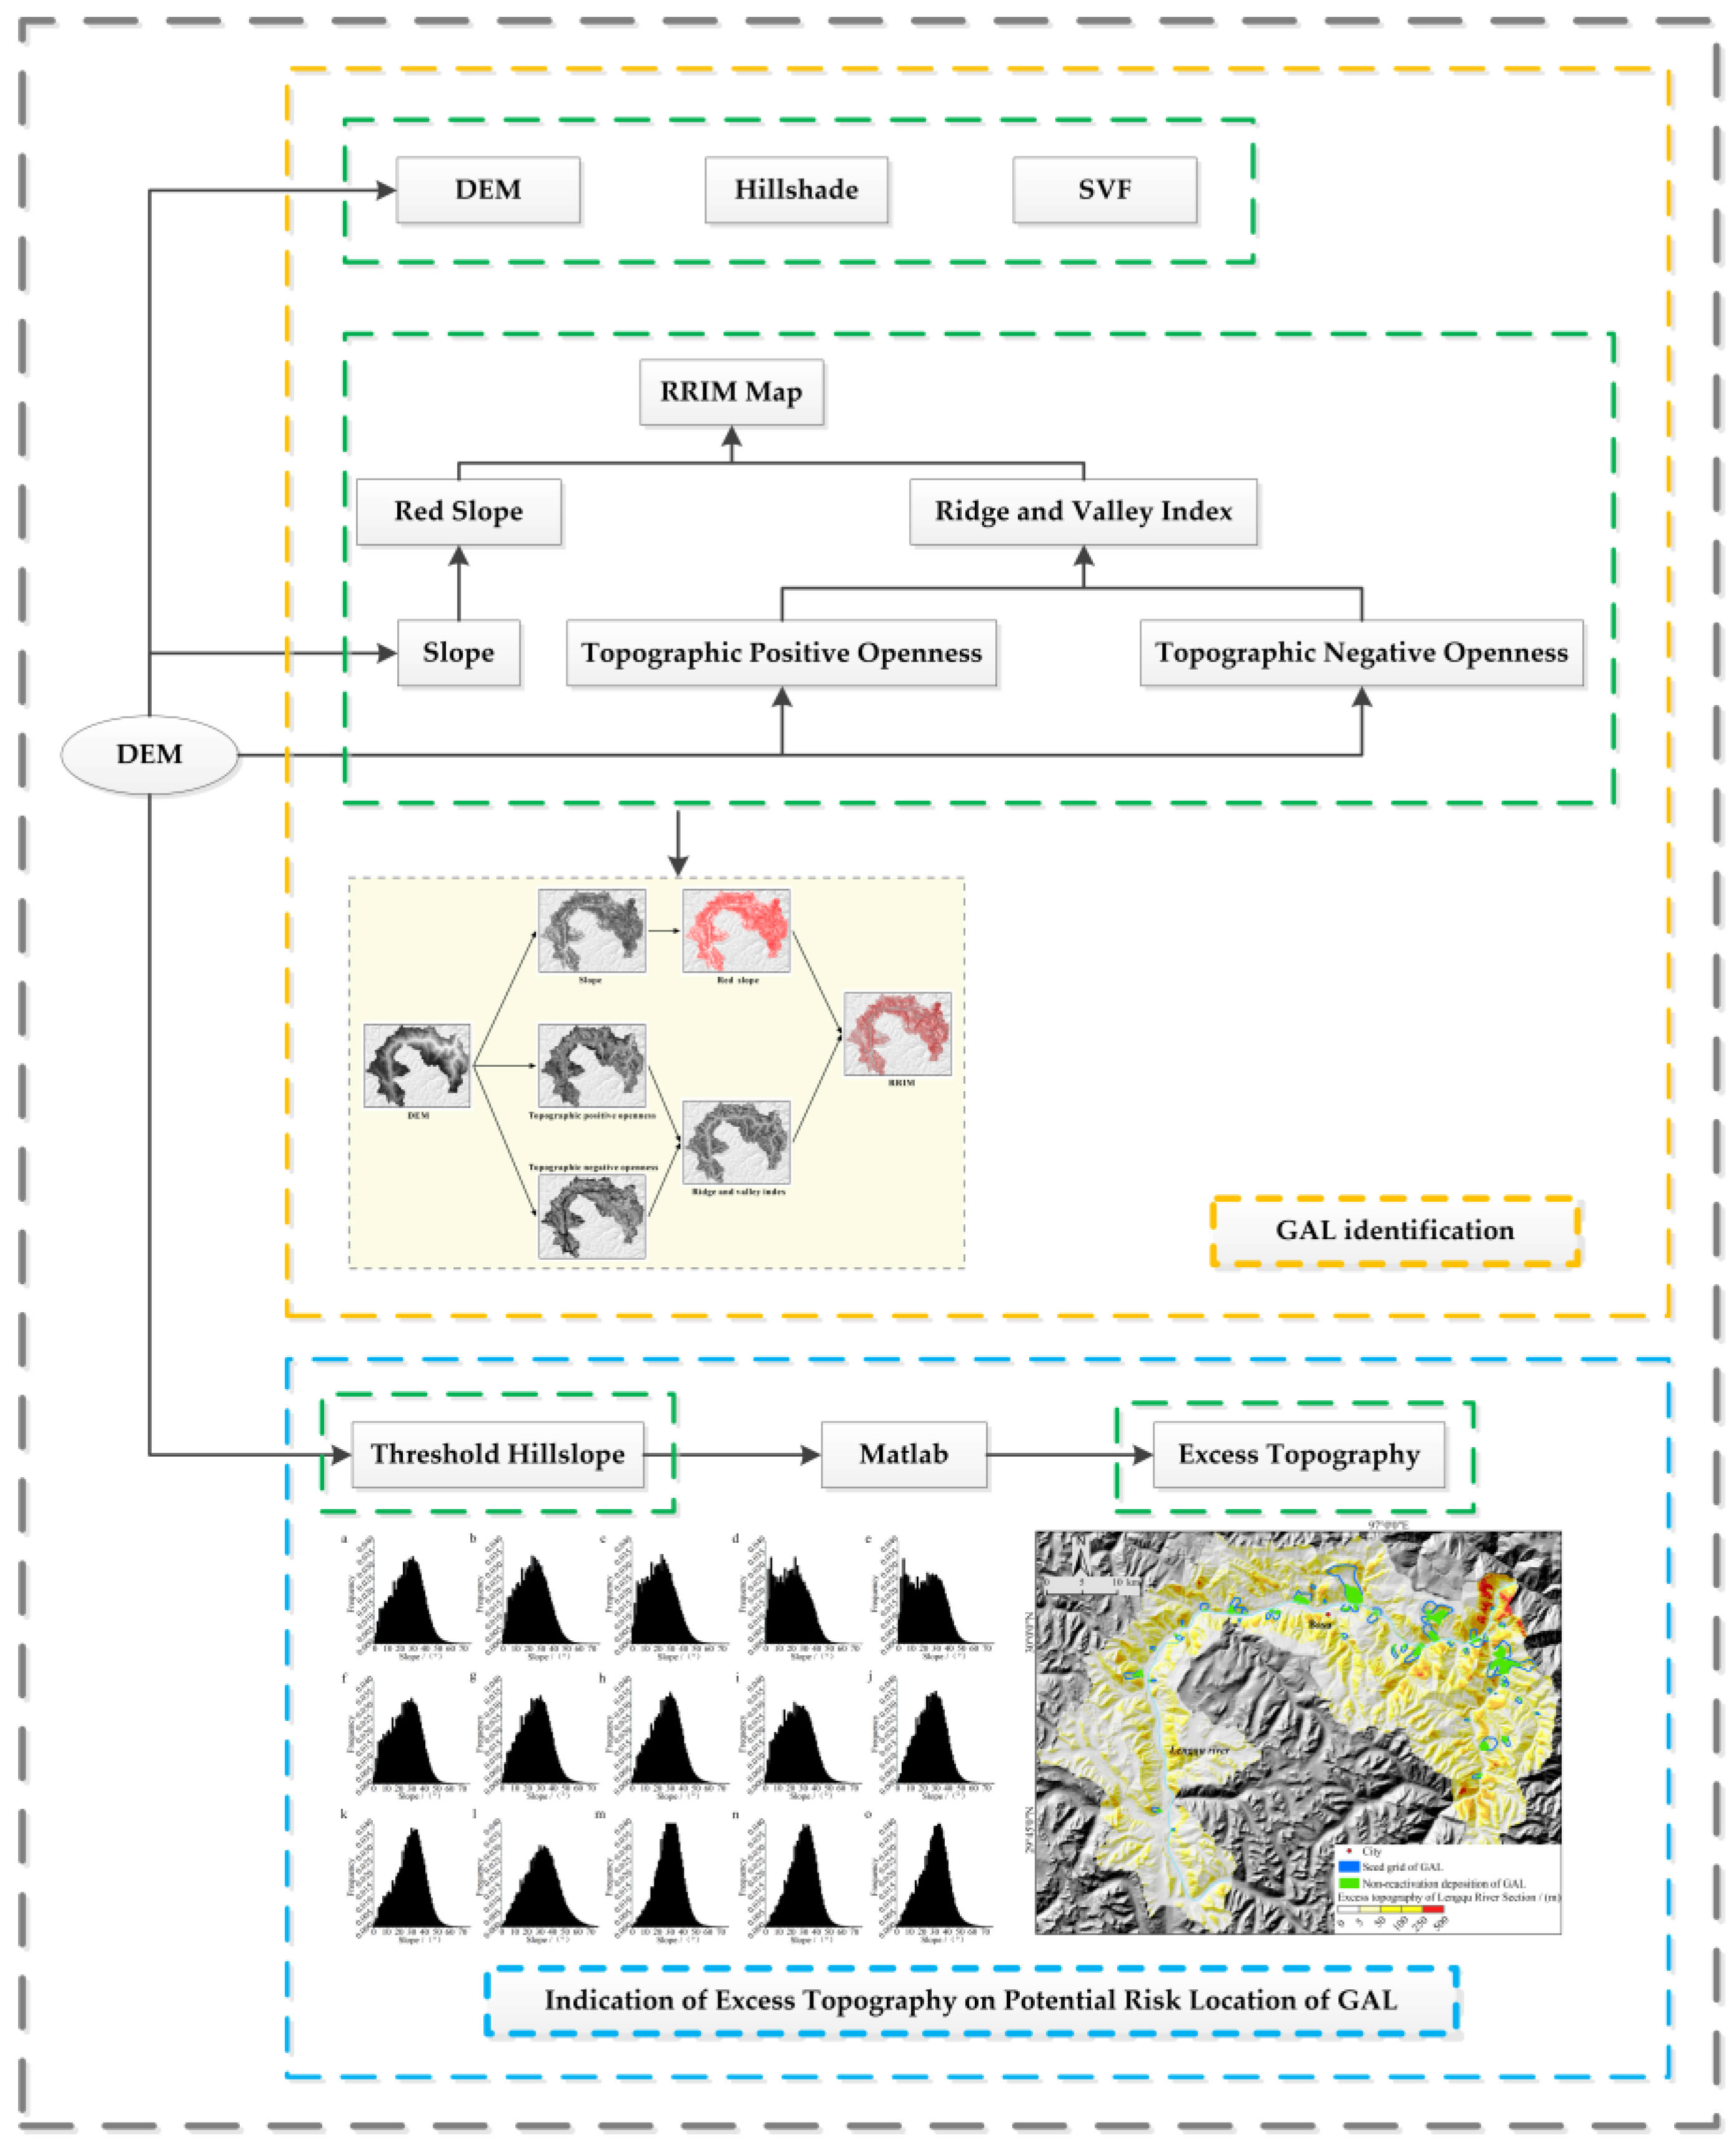
Figure 2 shows the flow chart of this research. In this research, a 12.5 m DEM of the Lengqu River section was first visualized and enhanced using the RRIM method, and the GALs in the Lengqu River section were identified based on the obtained RRIM map. The mean slopes of the sub-basins of the Lengqu River section were then extracted and analyzed to obtain the threshold hillslope of the whole Lengqu River section. Excess topography was extracted by using Matlab based on threshold hillslope; then, the relationships between GALs, resurgent GALs, the deposition of inactive GALs and excess topography were quantitatively analyzed separately, which enabled the identification of GALs for the indication of GAL risk locations.

3.2.1. RRIM Terrain Visualization Map

A RRIM terrain visualization map is calculated and converted from three elements: ground slope, topographic positive openness and topographic negative openness. The literature [26] proposes that topographic positive openness is the mean value of eight maximum zenith angles, expressed by O P , and topographic negative openness is the mean value of eight maximum bottom angles, expressed by O N . The larger the O P , the more convex the terrain, and the larger the O N , the more concave the terrain. An RRIM terrain visualization map can be obtained by overlaying the slope map after red transformation with the ridge and valley index I value map calculated by using the terrain positive openness and the terrain negative openness. The calculation formula of I is as follows [27]:
  I = ( O P O N ) 2
where O P is topographic positive openness, O N is topographic negative openness, and the I value is the newly generated elemental ridge and valley index.
The value range of ridge and valley index I is generally [–1, 1]. When I > 0, a larger I represents a more convex terrain, and the area shown in the figure is brighter. When ridge I < 0, the smaller the I value, the more concave the terrain and the darker the area shown in the figure [34]. In the RRIM map generated by the superposition of the I value map and the red slope map, the ground slope is shown in bright red, the top of the ridge is bright white, the valley at the bottom is shown in dark gray, and the flat surface (such as landslide steps) is visible in obvious gray.

3.2.2. Excess Topography

Excess topography refers to potentially unstable rock masses located above the threshold hillslope [31]. To obtain the distribution of excess topography, it is necessary to obtain the threshold hillslope value of the study area first, where the elevation Z ˙ of the idealized threshold hillslope surface is introduced, Z is the actual elevation and excess topography E is extracted according to the method proposed by Blothe et al. 2015 with the following equation [30]:
Z ˙ x ,   y = min ( s , t ) ( - , )   Z   x + s ,   y + t   + s t s 2 + t 2  
E = Z ˙ x ,   y   Z
where (x, y) is the coordinate point, s t is the threshold hillslope value (obtained by analyzing the distribution of slopes in the study area), s 2 + t 2 is the distance from the filter center to the point (x, y), and Z is the actual elevation value.
The threshold hillslope value of the Lengqu River section is obtained through the computational analysis of slope [35], the extraction of excess topography is performed on the 12.5 m DEM of the Lengqu River section based on the obtained threshold hillslope value, and the detailed extraction process is based on Matlab’s TopoToolbox [36].

4. Results

4.1. Identification and Preliminary Validation of GALs in Lengqu River Section Based on RRIM

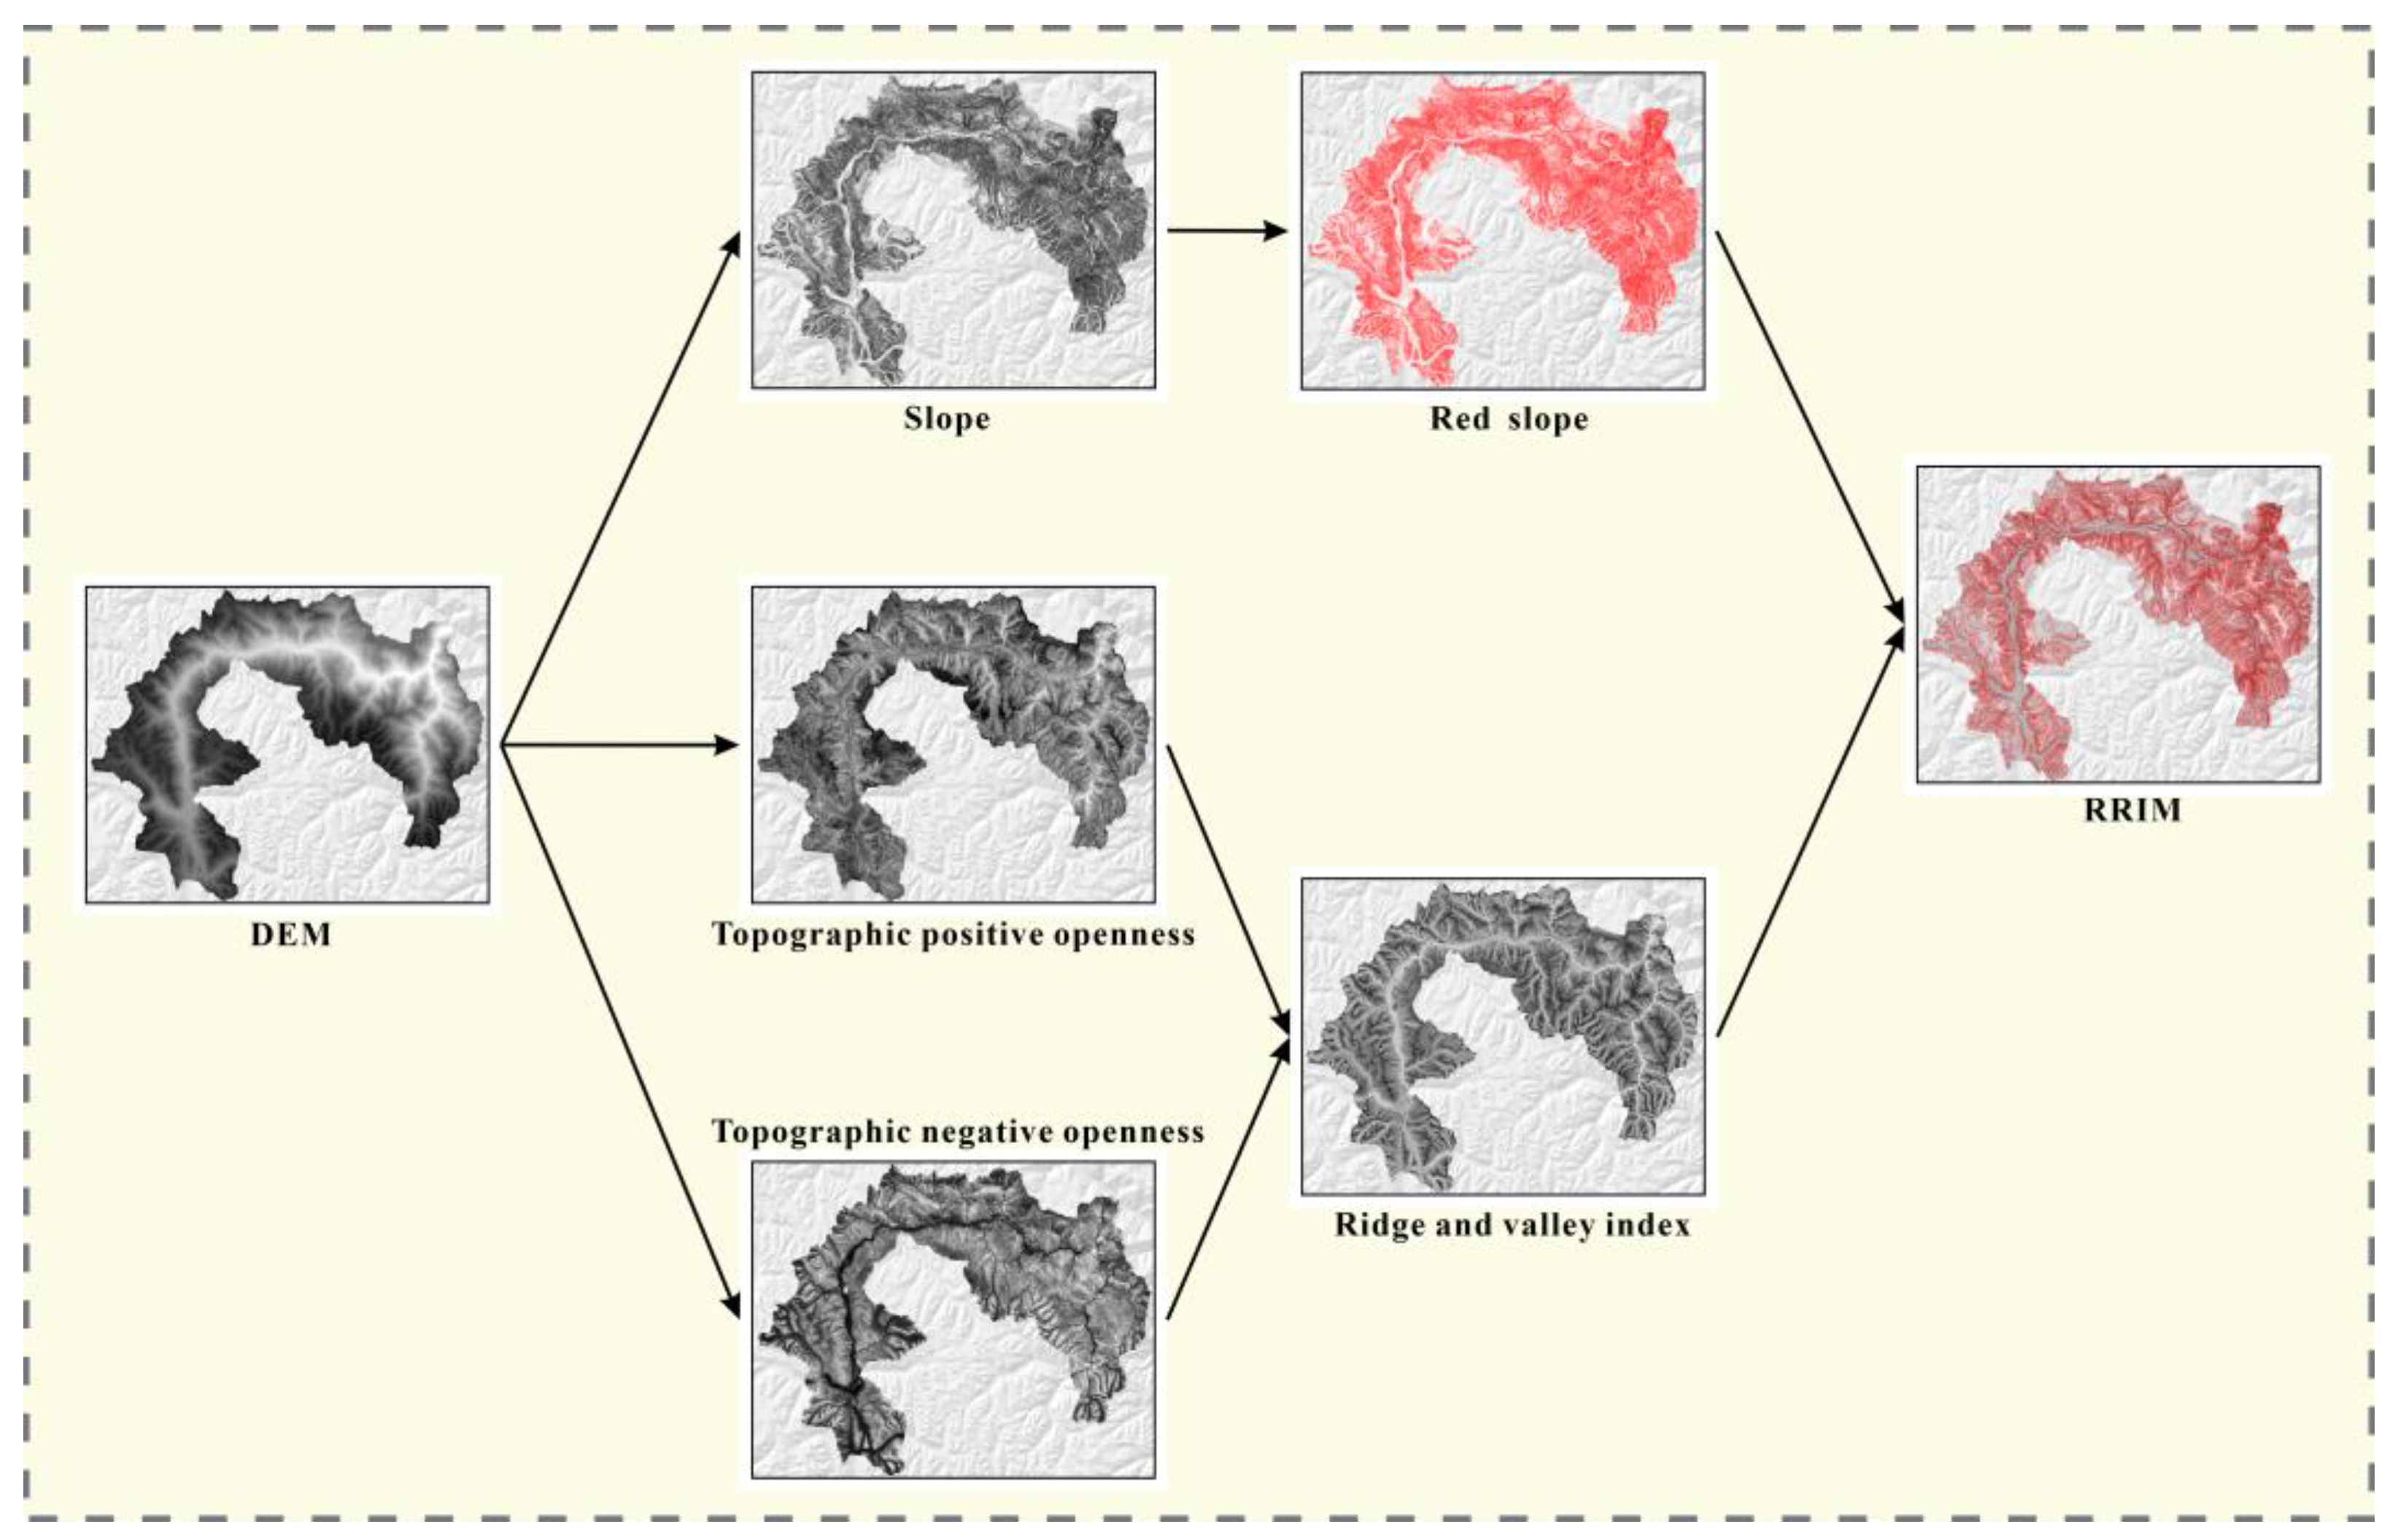
The process of synthesizing RRIM 2D-visualized terrain for the Lengqu River section mainly includes the extraction of the ground slope, calculation of topographic positive and negative openness, calculation of the ridge and valley index, rendering of the red slope map and the synthesis of final RRIM. The synthesis of RRIM for the Lengqu River section is shown in Figure 3.
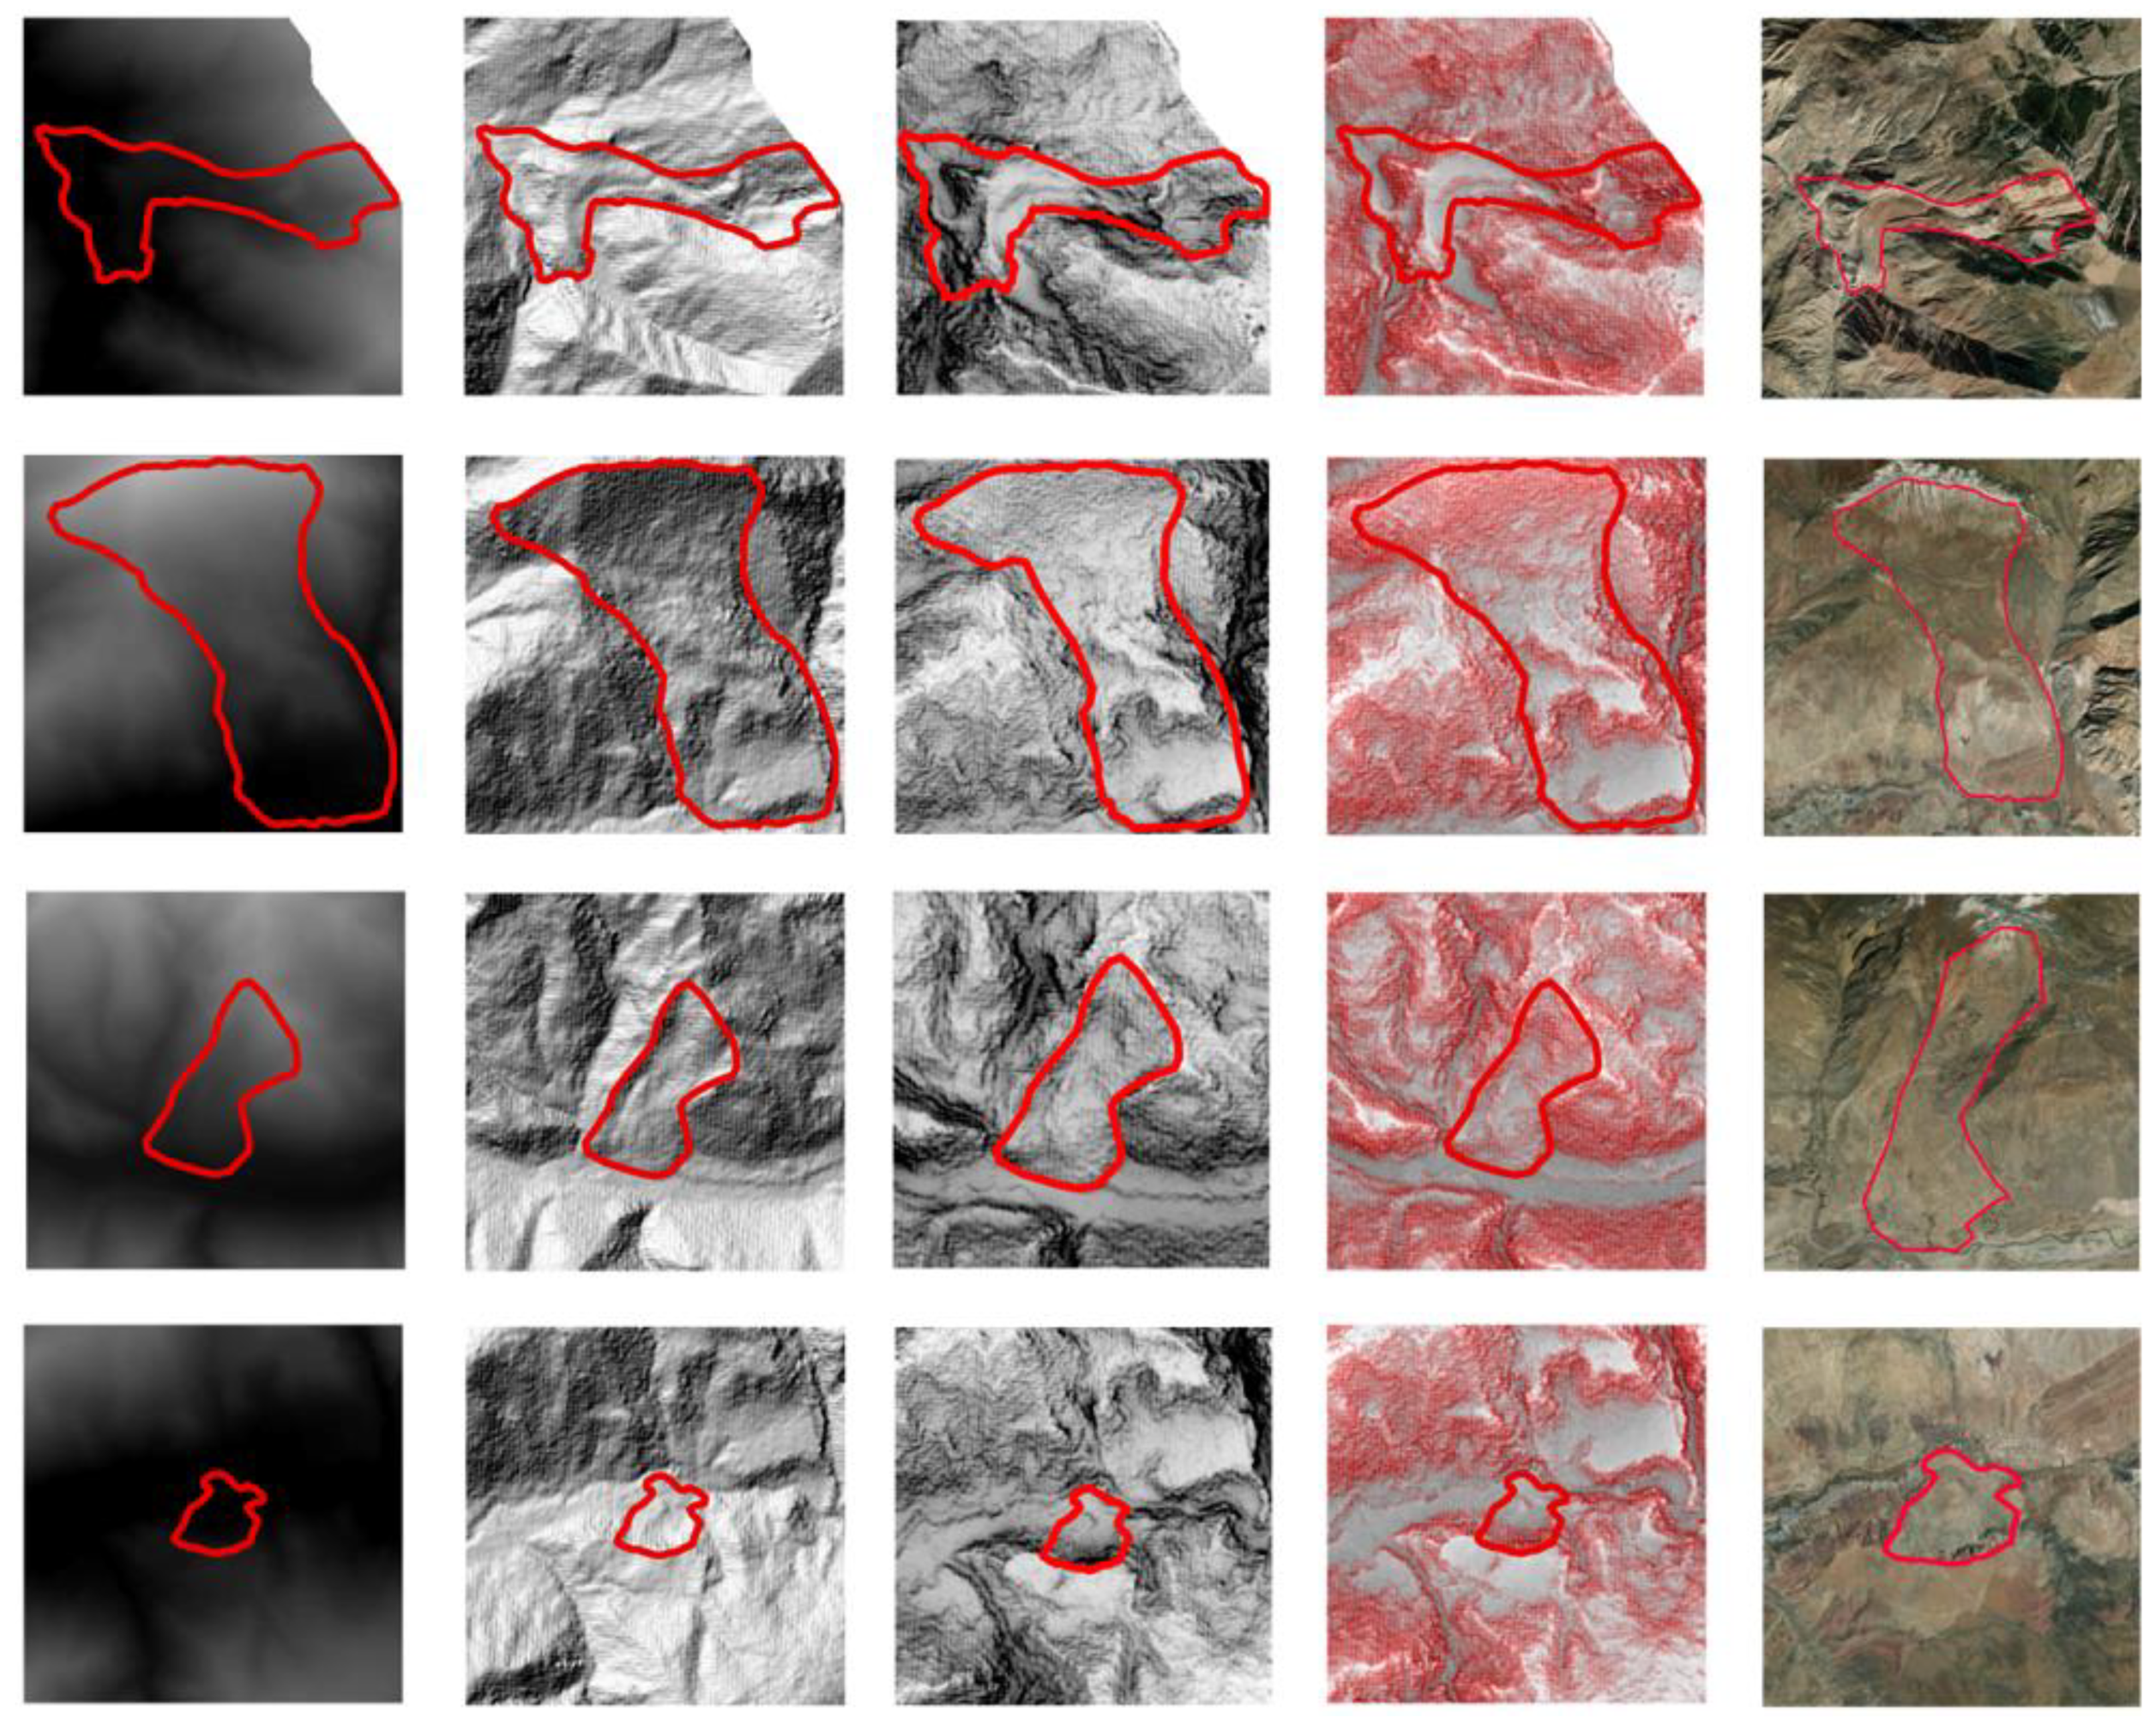
Figure 4 shows the DEM, hillshade transformed from DEM and SVF obtained from DEM either through SAGA software in the first, second and third column of the image, respectively, in the Lengqu River section: from the morphology of landslides, the areas where landslides occurred have more obvious landslide phenomena, and their shapes are mostly fan-shaped, tongue-shaped, skip-shaped, etc. In addition, some landslides can be seen with obvious depositions; it is difficult to judge only from the DEM and hillshade by the color of the landslides, as the color contrast between the overall landslide areas and the non-landslide areas is not obvious enough. Therefore, we chose to use SVF to show the whole geomorphological situation at the same time [37]. It is obvious from the figure that SVF can see the details on the geomorphology better than the original DEM and hillshade and can show the outline of GALs more clearly; the color of black and white contrast is stronger, but the specific composition of the landslide such as deposition is still difficult to identify. From the topography around the landslide occurrences, it is found that GALs are mainly distributed along rivers. In a word, the DEM and hillshade portrayed landslide surfaces roughly, so it is easy to misjudge landslides; even some of the more subtle structures of the landslide are not visible through SVF.
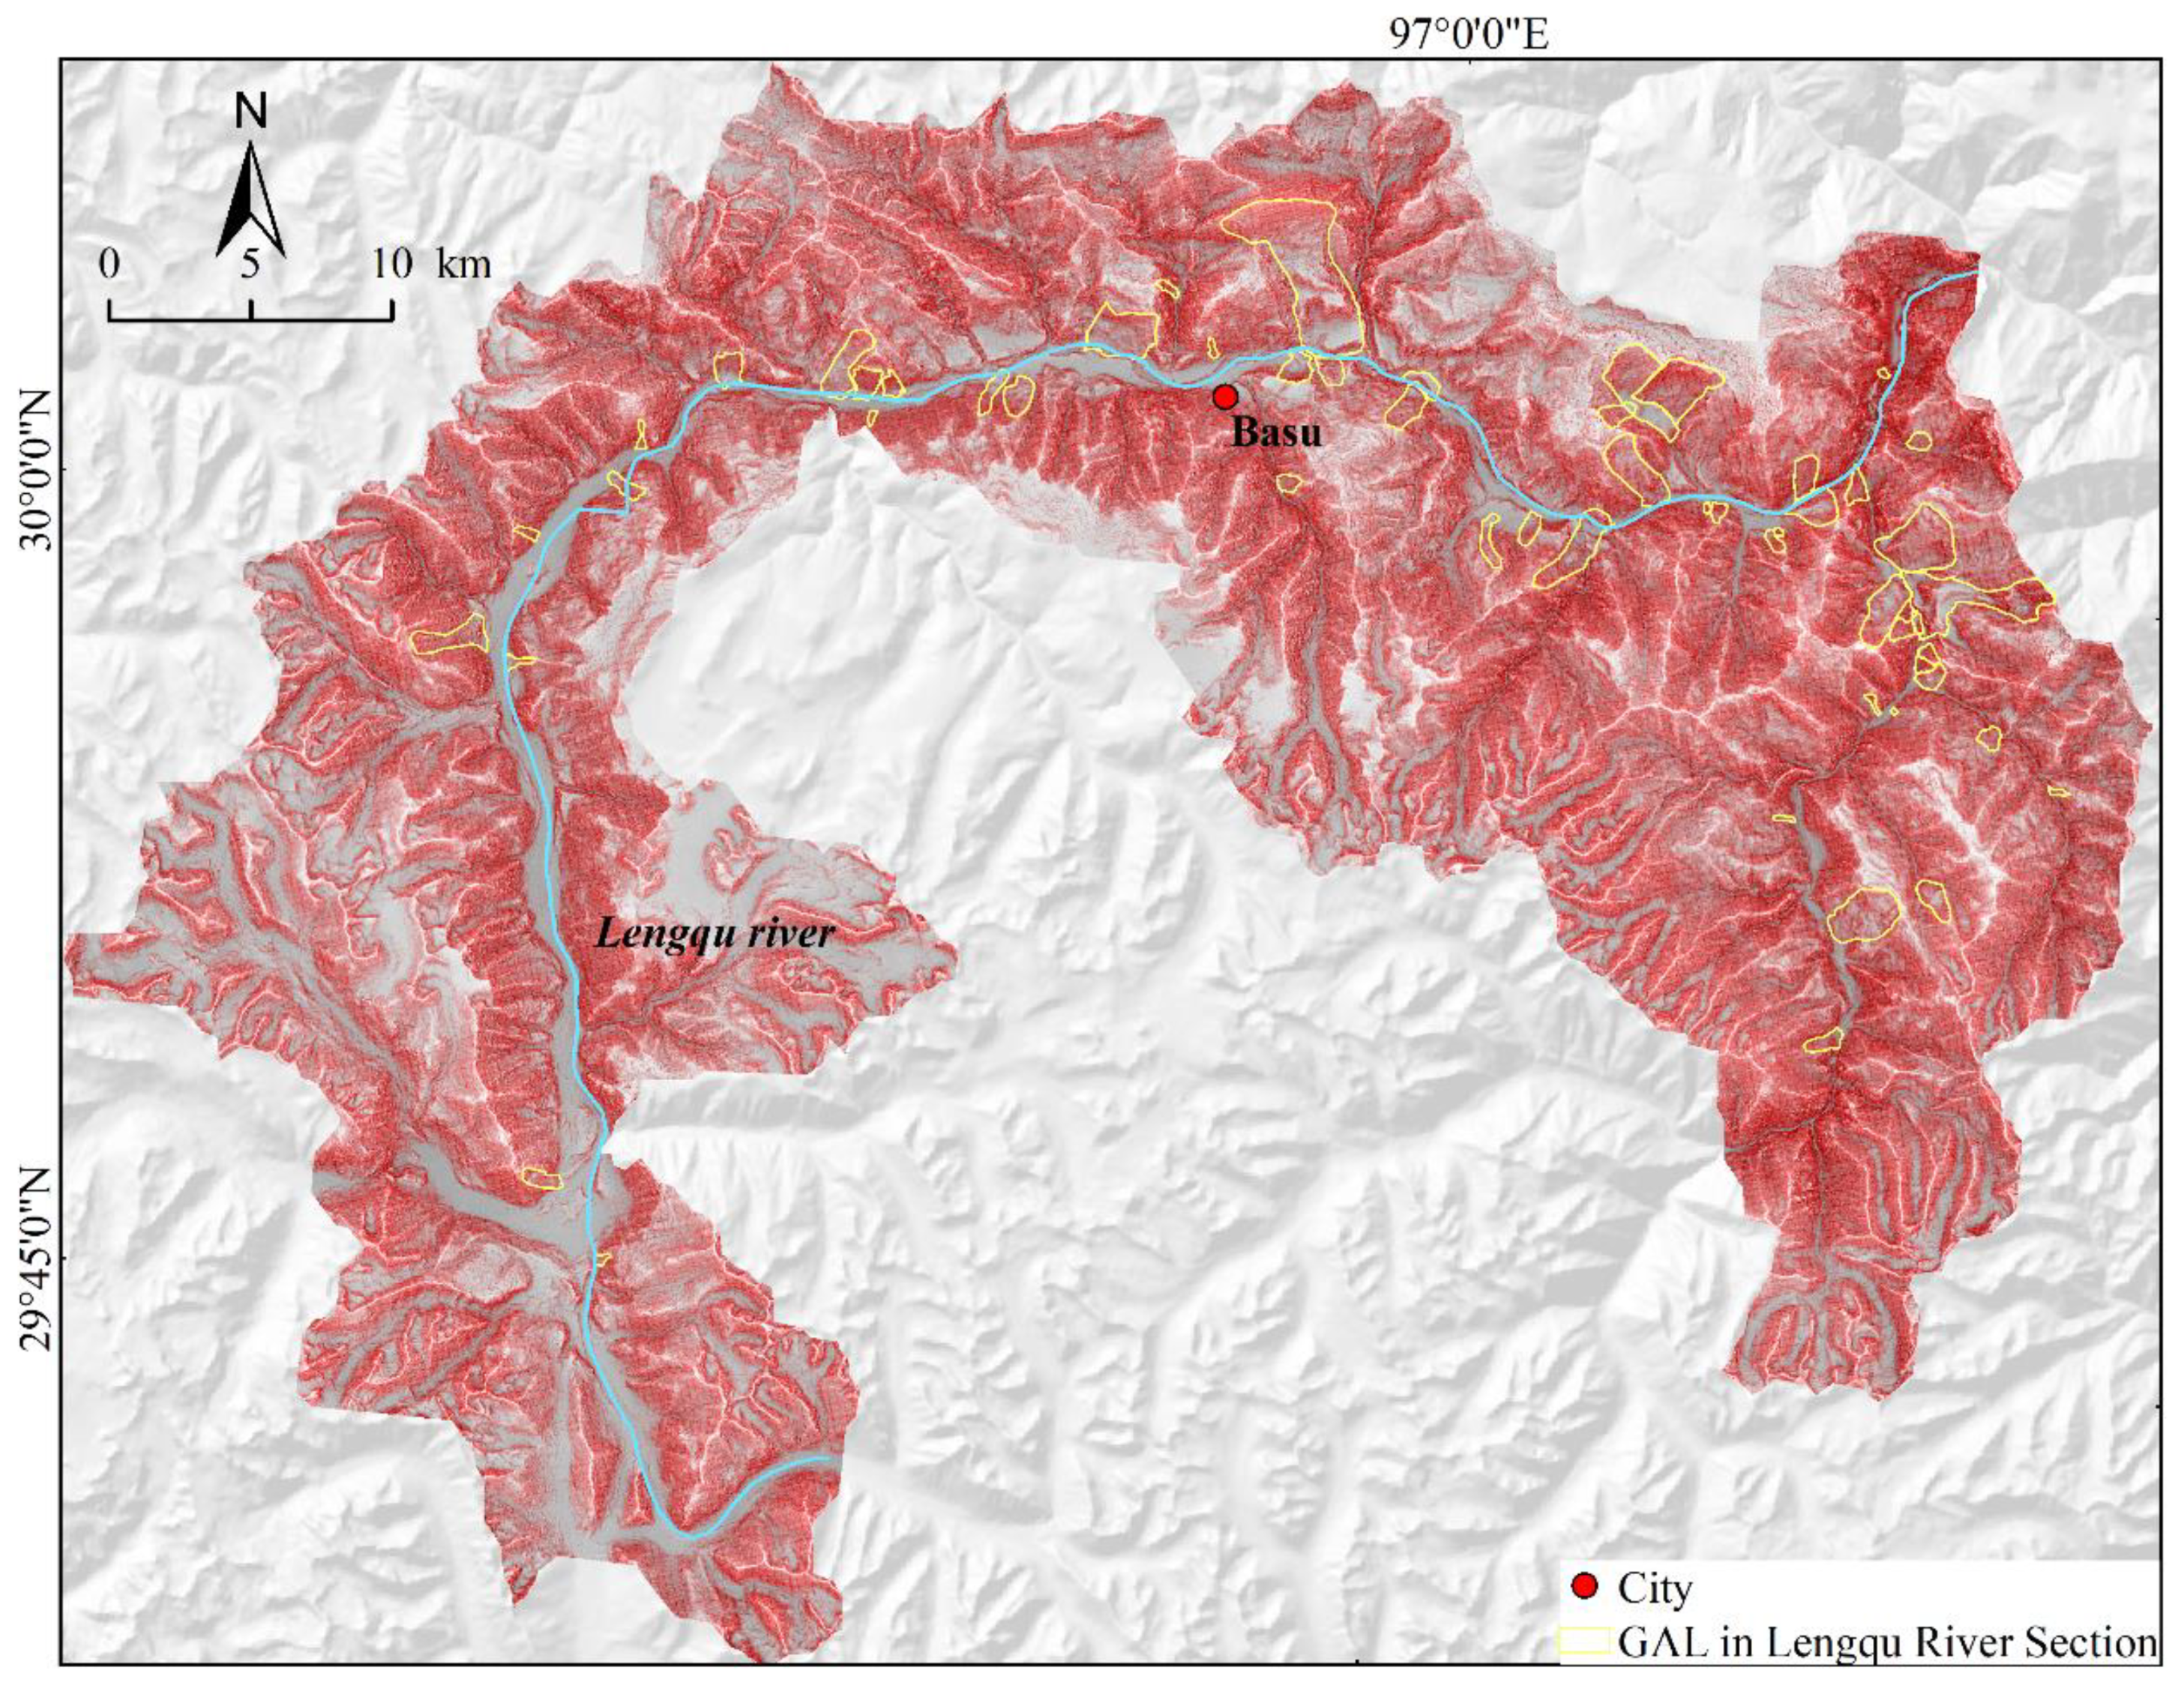
In order to be able to solve the problems encountered in the original DEM, hillshade and SVF methods for landslide identification, we introduce the RRIM method to the research. We identified GALs in the Lengqu River section based on an RRIM 2D-visualized topographic map with well-defined colors of valleys and ridges in Figure 5. A total of 54 GALs were identified based on the morphological features, color changes and changes in the topography around the landslides presented in the RRIM at last. The area range of the identified GALs is 0.036–13.348 km2, and their minimum area includes 230 grids. In Figure 5, we can see that the central and southern ridgelines of the Lengqu River section are dense, as well as the topographic changes through the undulation of the surface morphology, with a strong sense of three-dimensionality and obvious visual impact. Based on the morphological characteristics of the landslides, the DEM with RRIM changes can clearly identify the entire contour, back edge, steep walls on both sides and depositions of GALs, and some can even portray the local subtle features of the landslides, such as landslide steps, etc. Especially for the relatively giant landslide, we can not only see the contour and depositions of landslides but also the rocks or debris materials sliding down along the landslide profiles or even the slip zones. For relatively small landslides, we can see landslide profiles and depositions but cannot see the material characteristics of the landslide surface slip. In terms of color, there are gray rocks exposed at the location of GAL occurrences, and the color of the surrounding terrain is more uniform, which shows a red color. From the topography around the landslide occurrences, there are obvious depressions and ruptures in the terrain where the landslide occurred. In visual interpretation, the RRIM method is obviously better than the original DEM and hillshade transformation. Compared with SVF, its advantages mainly lie in the visual effect brought by the color transformation, which makes the landslide and the surrounding non-landslide landscapes better distinguished and the deposition and landslide wall more detailed so that the specific structural composition of the landslide can be better seen.
The results of the interpretation of GALs based on the RRIM in the Lengqu River section are compared with those in Google Earth through remote sensing image interpretation and fieldwork. Figure 4 shows four typical GALs in the Lengqu River section by field investigation, which are the Linka landslide, Basu landslide, Wangbi landslide and Duolashenshan landslide from top to bottom, and their surface areas are 6.102 km2, 13.348 km2, 2.060 km2 and 0.961 km2, respectively. Among them, the fourth and fifth columns are the four landslides identified based on the RRIM and Google Earth, respectively. It can also be found that the landslides identified by RRIM transformation are more detailed and distinctive than those identified by Google Earth, and the RRIM makes the location of landslide occurrences more prominent by weakening the irrelevant information around the landslides. In a word, the reliability of the identified landslides by the RRIM method is high.

4.2. Quantitative Analysis of the Relationship between GALs and Excess Topography in Lengqu River Section

Excess topography is an indication of potential slope above a certain threshold hillslope, that is, the slope above the excess topography is at risk of landslides; therefore, quantitative analysis of excess topography at the location of GALs, resurgent GALs and the deposition of inactive GALs can provide a basis for whether new landslides or resurgent GALs are prone to occur at the original location of GALs and avoid risk to a certain extent. For the quantitative analysis of landslides on excess topography, Liu et al. considered landslides as point data, Blothe et al. considered landslides as surface data, and this research used landslide surface data for relative analysis considering the small area of the Lengqu River section.
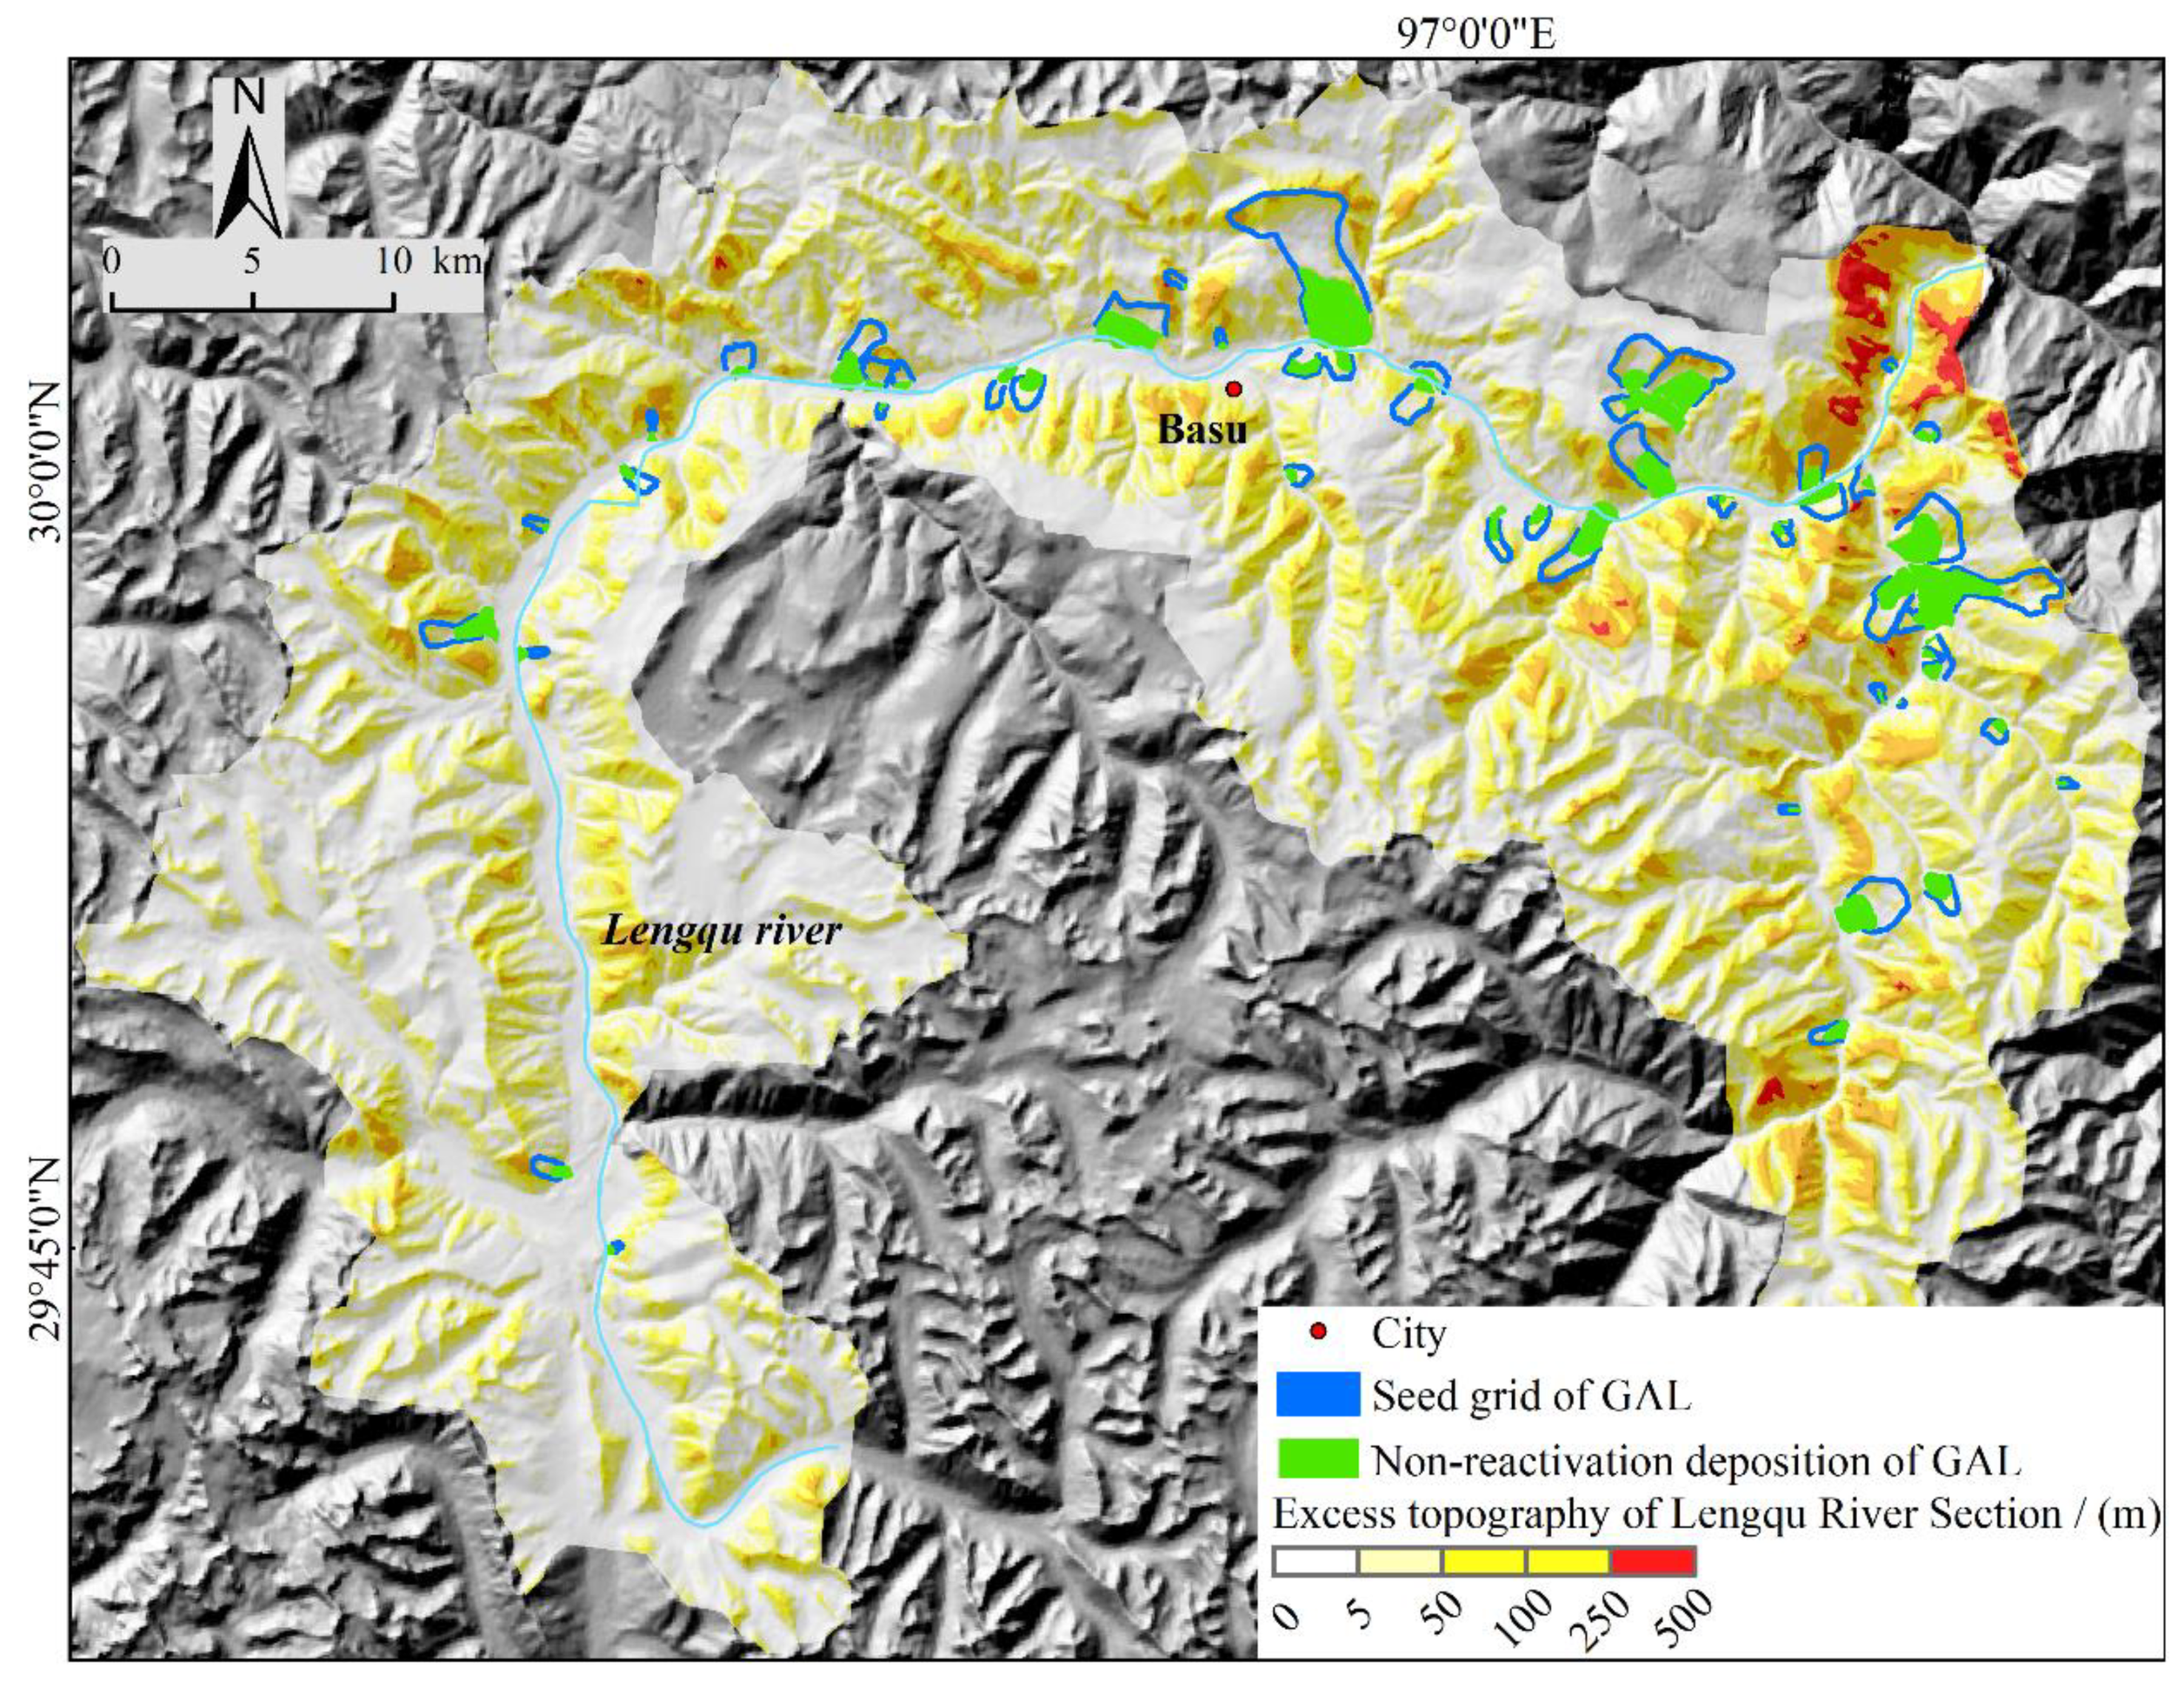
Based on 12.5 m DEM data, the slope of the Lengqu River section is extracted; as shown in Figure 6a, the plurality of slope in the Lengqu River section is 30°, and the mean value of its slope was found to be 26°. The Lengqu River section was then divided into 14 sub-basins according to the 10-level basin in the HydroBASINS 12-level basin dataset (as shown by the sub-watershed boundary in Figure 1), and the plurality value of slope in each sub-basin was extracted. As shown in Figure 6b–o, the slope plurality values of the 14 sub-basins are 23°, 23°, 23°, 4°, 30°, 30°, 30°, 30°, 23°, 30°, 30°, 30°, 30° and 34°, and these results are summarized in detail in Table 2. The slope plurality value of the fourth sub-basin is 4°, but it can be found that there is no distribution of GALs, so the slope plurality value of this basin is not considered. Based on the analysis of Figure 6, the threshold hillslope of the Lengqu River section is about 20–35°. Considering that the number of GALs distributed in 30° sub-basins accounts for 85.19%, the threshold hillslope of 30° is selected at last in order to compare with the previous results that were obtained by Liu et al. at the same time. The results of excess topography extraction in the Lengqu River section are shown in Figure 7, and the thickness of excess topography is divided into 5 subintervals: {(0, 5], (5, 50], (50, 100], (100, 250], (250, 500]} [27,29]. In Figure 7, it is shown that the excess topography is mainly distributed along the main Lengqu River and its tributaries, and the majority of the GALs are found to be developed on the excess topography on both banks of the river.

4.2.1. Quantitative Analysis of the Relationship between the Location of GALs and Excess Topography in Lengqu River Section

The surface morphology of GALs has changed over time, which means the deciphered GAL surfaces in Lengqu now are not in the same position as when the landslide first occurred. So, this research used a “seed grid” method to reprocess the existing 54 GAL surfaces. The “seed grid” [38] is to extract the effective areas around the existing landslide surfaces that can reflect the initial location of the landslides. Referring to the study of Bai 2005 [39], the steps of “seed grid” extraction for landslide surfaces in this research are as follows: refer to the location of ridge lines in the RRIM, buffer landslide surface outward at an interval of 50 m (4 cells) based on the buffer surface not exceeding the ridge line and then re-edit the obtained buffer surfaces, only retaining the part of the landslide crown and both sides above the deposition areas.
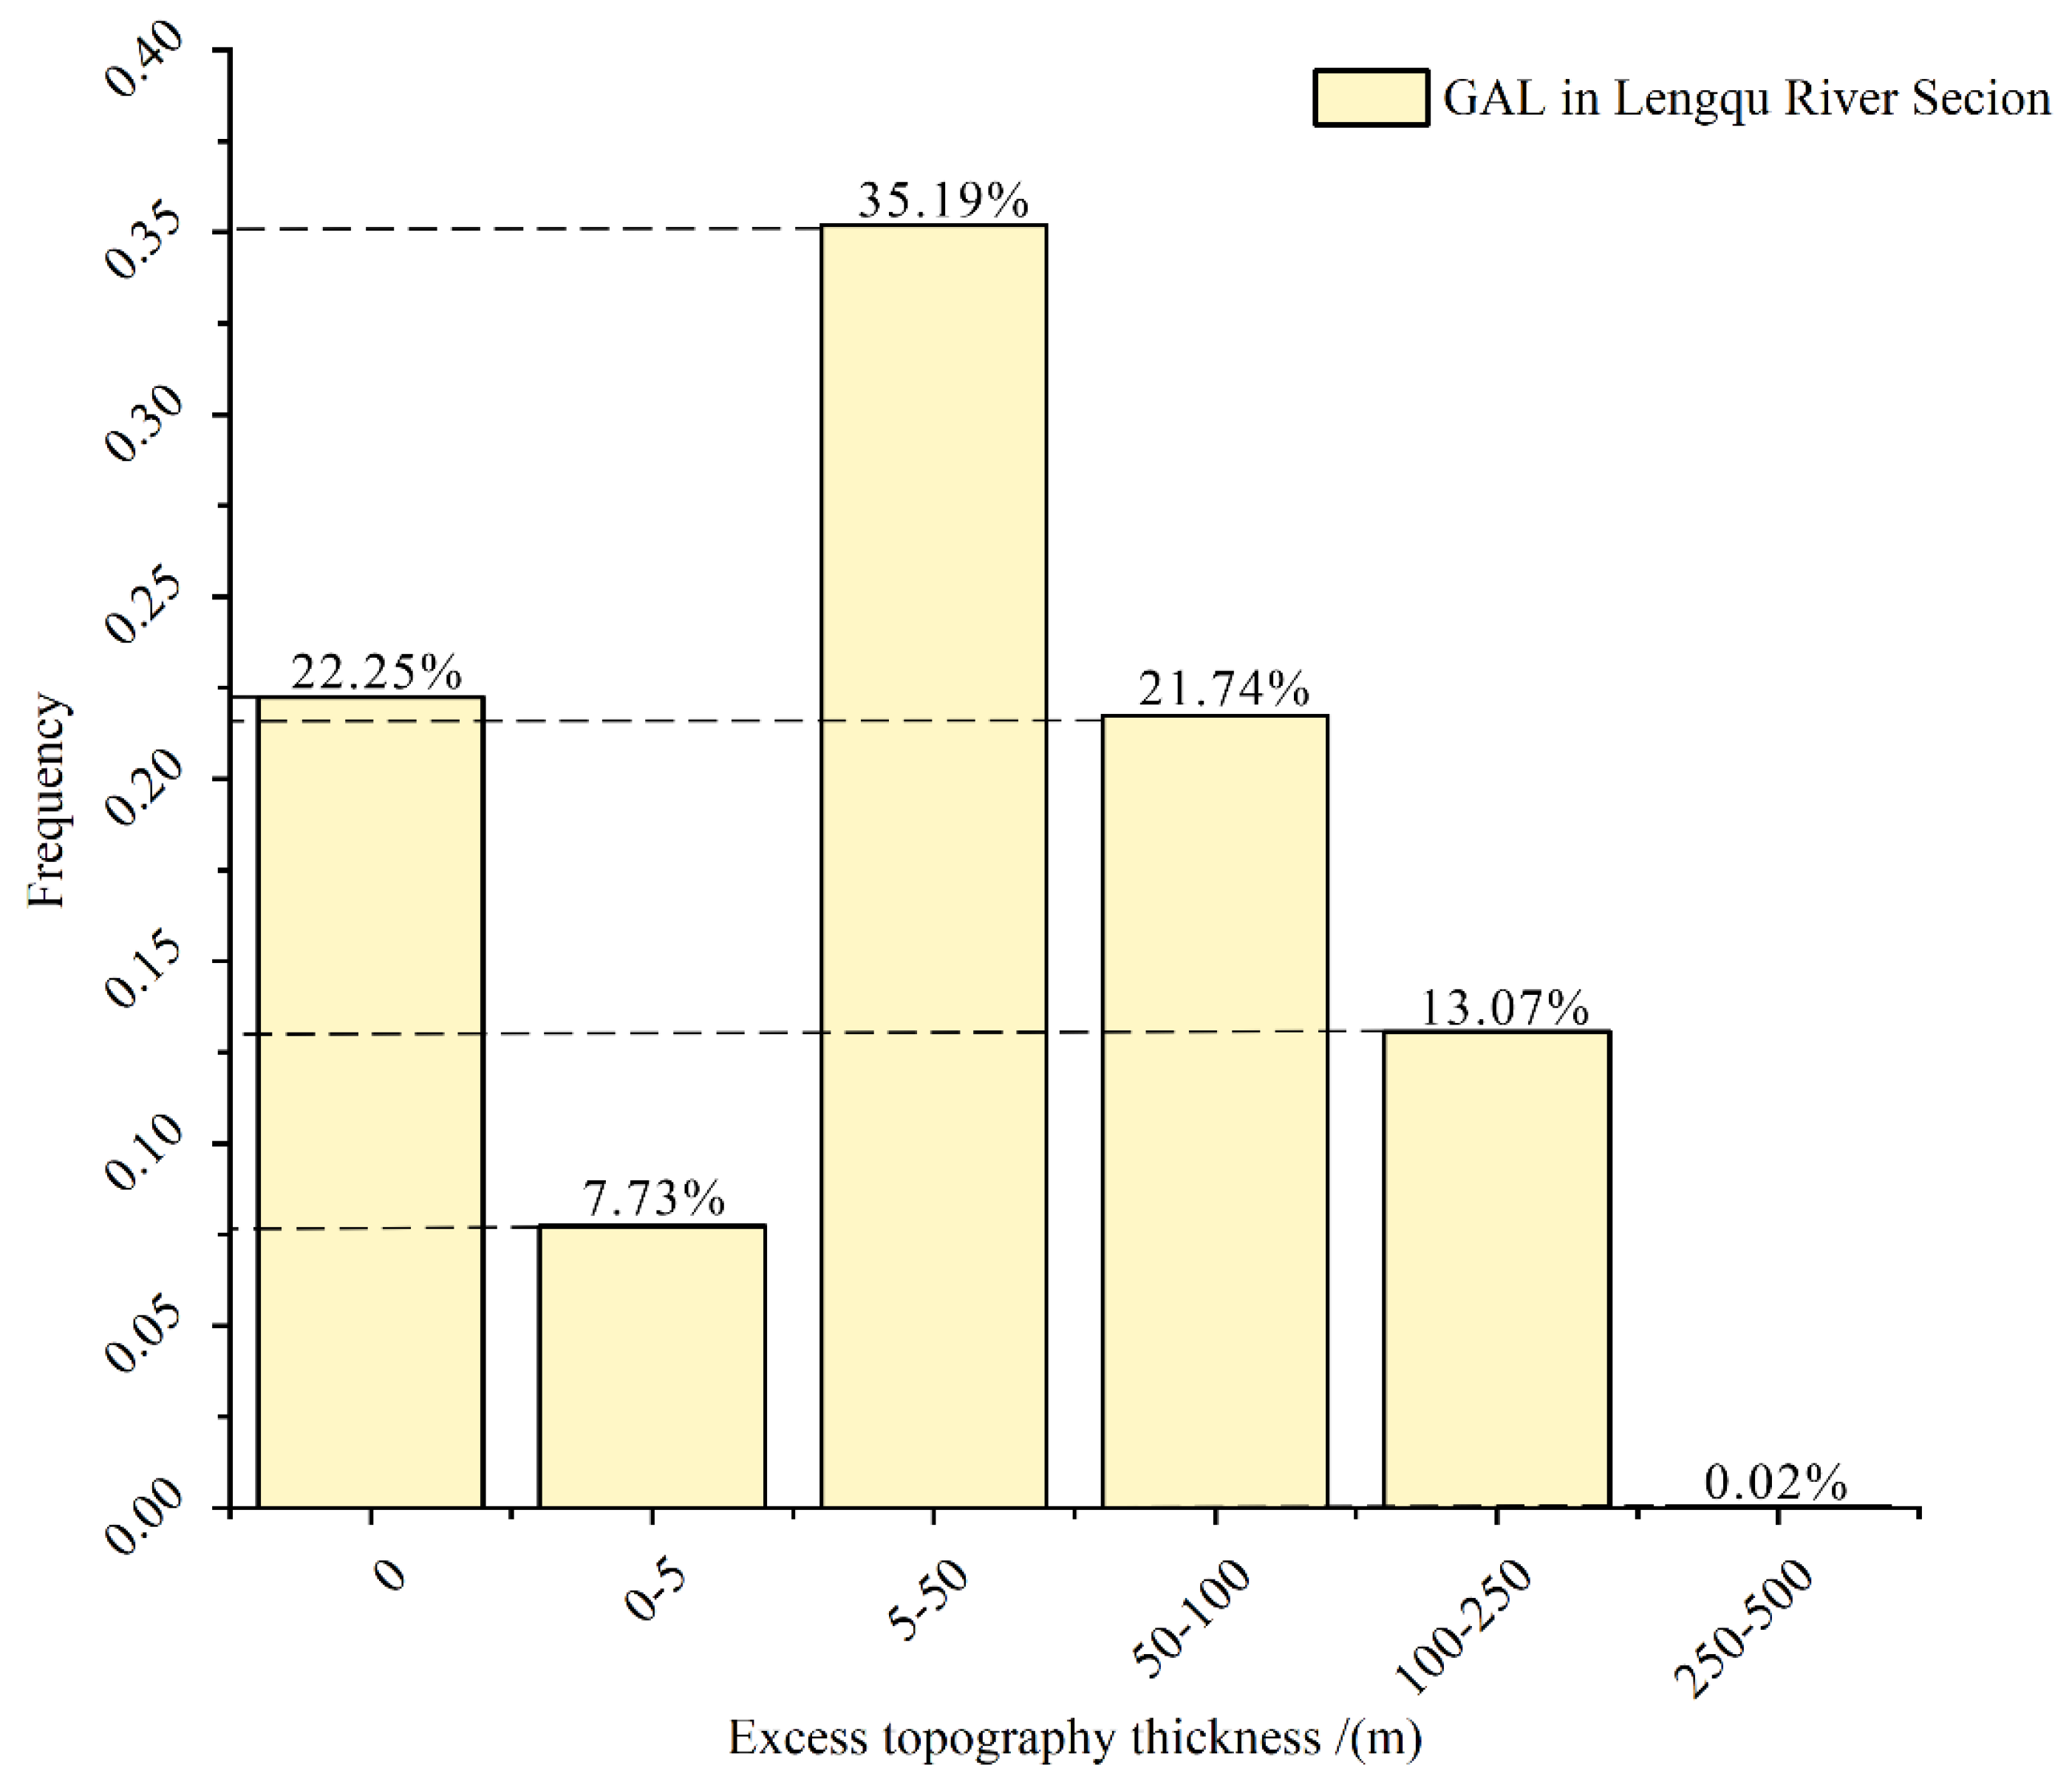
Based on the seed grid surface data of the 54 GALs, the relationship between GALs and excess topography is quantitatively analyzed, and the results are shown in Figure 8. The percentages of subintervals {(0, 5], (5, 50], (50, 100], (100, 250], (250, 500]} distributed on excess topography are 7.73%, 35.19%, 21.74%, 13.07% and 0.02%, respectively. A total of 77.75% of the GALs are distributed on the excess topography, which indicates that most of the GALs occur without changing the threshold hillslope at the location of occurrence.

4.2.2. Quantitative Analysis of the Relationship between Resurgent GALs and Excess Topography in Lengqu River Section

Comparing the active slopes in the Pan-Sanjiang parallel flow area, six resurgent GAL surfaces were found to be located in the Lengqu River section, and since it is more difficult to obtain resurgent GAL data, this research first conducted a quantitative analysis based on the six monitored resurgent GAL surfaces with excess topography. Related results are shown in Figure 9a, and the percentages of resurgent GAL surfaces distributed in each subinterval {(0, 5], (5, 50], (50, 100], (100, 250], (250, 500]} of excess topography are 10.85%, 38.97%, 5.63%, 0.02% and 0. We found that only 55.47% of resurgent GAL surfaces are distributed on excess topography, which is a decrease of 22.28% compared to 77.75% of GALs, and we speculate that it may be because GALs are mainly generated due to induced factors such as earthquakes and rainfall. While Liu et al.,1990 classified landslide resurgence patterns into four types [40], namely storm-induced, loading-induced, erosion-induced and submergence-induced, according to the dominant factors of resurgent GALs, which are classified as erosion-induced human unreasonable engineering activities that may make the resurrection of GALs not limited to the excess topography area, people’s excavation of the flatter non-excess topography can also make the foot of the slope destabilized, leading to GAL resurrection. From remote sensing images of the six resurgent GALs in the Lengqu River section, it is found that one GAL located in Lieri village has a flatter and longer deposition, many road constructions and land cultivated on it (which indicates more intense human activities), but most of this landslide is located on a non-excess topography area. In order to be able to conduct an in-depth study on the relationship between excess topography and resurgent GALs in the natural state, the GAL located in Lieri village is removed, and the relationship between the remaining five resurgent GALs that are almost unaffected by human activities and excess topography is analyzed again, and the results are shown in Figure 9b. The percentages of each subinterval {(0, 5], (5, 50], (50, 100], (100, 250], (250, 500]} distributed on the excess topography are 12.83%, 48.29%, 7.23%, 0.02% and 0, respectively, with 68.38% of the resurgent GALs distributed on the excess topography, and this result further illustrates the influence of human engineering activities on GAL resurgence. Based on this, we continue to quantitatively analyze the relationship between inactive GAL depositions [41] and excess topography. Even though inactive GALs have also suffered from human activities, the question of “whether GAL resurgence is also prone to occur on excess topography” can be further verified because they are not yet active. Related results are shown in Figure 9c. The percentages of each subinterval {(0, 5], (5, 50], (50, 100], (100, 250], (250, 500]} distributed on excess topography are 12.61%, 22.28%, 2.68%, 0.22% and 0, respectively, and 62.21% of the resurgent GALs are distributed on non-excess topography.

5. Discussion

5.1. Characteristic Basis for RRIM to Identify GALs in Lengqu River Section

The basis for generating an RRIM-visualized topographic map based on a 12.5 m DEM to identify GALs mainly includes the following.
Landslides identified based on the RRIM are basically real landslides when compared with the landslides actually investigated in the field, but we need to be able to summarize the characteristic law of landslides identified based on the RRIM, taking the GALs identified in the Lengqu River section as an example: firstly, the locations of landslides are determined along rivers, roads and fractures, and previous studies also show that landslides are often prone to occur here, while human activities are frequent near rivers and roads. In summary, more attention should be given to the areas around rivers and roads, both for the identification of GALs and for the consideration of human safety. The RRIM generated based on the 12.5 m DEM makes both the morphology and color features of GALs in the Lengqu River section significantly enhanced. In terms of morphology, there are more obvious landslide back edges, steep walls on both sides of landslides and depositions where landslides occur; in terms of color, gray rocks are exposed where landslide pullouts occur, while its surrounding area is red. Additionally, by comparing the landslide features presented on the RRIM with those presented on Google Earth, one can see that the landslide surfaces presented in the RRIM are more detailed, and since the RRIM simplifies the colors in the map to red and gray, it allows better identification of landslides if the features presented on the RRIM are grasped, without the obscuration of the landslide by the vegetation cover on Google Earth.

5.2. Indication of Excess Topography for the Re-Occurrence of New Landslides on GALs

In this research, the concept of excess topography is introduced to study the destructive effect of the occurrence of GALs on slopes. Based on the calculated threshold hillslope of 30°, quantitative analysis of the relationship between the cataloged surface data of GALs in the Lengqu River section and the excess topography is conducted. The result displays that 77.75% of GALs are still on excess topography, which means 77.75% of the threshold hillslope at the original location where the GALs occurred has not been changed. The results are consistent with the results of the quantitative relationship between landslides and excess topography obtained by Blothe et al., Liu et al. and others based on other different types of landslides; that is to say, there is a similar pattern for GALs in the Lengqu River section. This means that there is still a volume of objects on the threshold interface under the threshold hillslope of 30°, and when the trigger of a certain external condition such as rainfall or earthquake happens, there may occur new landslides or secondary resurgence, and it can be assumed that the generation of a single landslide usually did not cause the threshold hillslope to suffer complete damage.

5.3. Indication of Excess Topography for Secondary Resurgence of GALs

We had a new idea in addition to the quantitative analysis of the relationship between GALs and excess topography, which was that there is often a risk of secondary resurgence of GALs, so we tried to analyze the conceptual indication of the possible occurrence of landslides—i.e., the relationship between excess topography with the secondary resurgence of GALs. In order to explore the relationship between the secondary resurgence of GALs and excess topography, we needed to obtain the active GAL surfaces with the help of InSAR technology, which can monitor the activity of GALs before their real resurgence. So, based on the study of active landslides in Pan-Sanjiang obtained by Yao et al., and in order to reveal more about the indication of GALs in the natural state of excess topography, the relationship between resurgent GALs that are highly subject to large human activities, inactive GAL depositions and the excess topography were quantitatively analyzed. The quantitative analysis shows that 68.38% of the GAL resurrections in a relatively natural state are distributed on excess topography and that 62.21% of the inactive GAL depositions are distributed on the non-excess topography, which preliminarily indicate that if human activities on the GALs could be reduced, excess topography can effectively indicate the occurrence of GALs. The reason that we preliminarily speculate that there is also an important relationship between the secondary resurrection of GALs and excess topography is that the secondary resurrection of GALs is mainly the secondary resurrection of the depositions. The deposition of the first slide of the landslide may be piled up in the middle of the landslide, and it has not completely slipped down, which may make the place where the deposition is piled up reach the threshold hillslope, so, in the case of external factors such as rainfall, it may trigger a secondary resurgence. However, many of the resurrected GALs are not located on excess topography, which is mainly due to the instability of the foot of the non-excess topography area caused by human activities. Therefore, the current research can only say that the secondary resurrection of GALs is related to the excess topography under the small amount of human damage or the natural state.
The practice of using the RRIM to identify GALs in the Lengqu River section can be extended to other areas, and because the accuracy of the DEM used in this research is only 12.5 m, some smaller landslides are difficult to identify, so using publicly available, higher-accuracy DEM data can theoretically identify more ancient landslides. Additionally, the landslides identified based on the RRIM can provide sample support for regional landslide susceptibility assessments in the future. At the same time, the concept of excess topography can also be applied to other wider areas or to try to extract excess topography by using higher-precision DEM data, but the key to the application is to be able to select the appropriate threshold hillslope for landslides to be studied for the area. One of the disadvantages of the RRIM method is that it can only identify ancient landslides where the terrain has not been damaged, and the landslide contours could be wrongly traced if the pattern of landslide interpretation by the RRIM is not mastered. Another disadvantage is that only landslides prior to the monitored DEM time can be interpreted; one of the key points to extract the excess topography of a certain area is to be able to select the right threshold hillslope for the study area, which means that the selection of the threshold hillslope requires a large amount of analysis.

6. Conclusions

In this research, 54 GALs in the Lengqu River section were identified based on RRIM transformation, the relationships between GALs, resurgent GALs, inactive GAL depositions and excess topography were quantitatively analyzed, and the following conclusions were obtained:
(1)
The RRIM method used in the Lengqu River section makes visible the morphology and color features of the landslide occurrence that are obviously different from the surrounding areas, which provides good technical support for the census of GALs.
(2)
A total of 77.75% of the GALs in the Lengqu River section are still on excess topography, which means that the vast majority of the GALs are still at risk of new landslides; 68.38% of the 5 resurgent GALs, which are almost unaffected by human activities in the Lengqu River section, are on excess topography, 62.21% of the inactive GAL depositions are on the non-excess topography, and these results all indicate that the excess topography has an indicative effect on GAL resurrection in the natural state to a certain extent.
(3)
In the future, the RRIM method can be used to interpret smaller landslides with a higher-resolution DEM. At the same time, we can try to conduct quantitative analysis on the relationship between landslides in different regions, resurgent landslides and excess topography for further assessment of landslide risk with the help of the concept of excess topography. However, the decoding laws for smaller landslides based on the RRIM need to be recapitulated, and how to select the appropriate threshold hillslope for a new study area is also important.

Author Contributions

Conceptualization, X.W. and S.B.; Data curation, X.W. and S.B.; Formal analysis, X.W.; Funding acquisition, S.B.; Investigation, X.W. and S.B.; Methodology, S.B.; Project administration, S.B.; Resources, X.W. and S.B.; Software, X.W.; Supervision, S.B.; Validation, X.W. and S.B.; Visualization, X.W.; Writing—original draft, X.W.; Writing—review and editing, S.B. All authors have read and agreed to the published version of the manuscript.

Funding

This study was supported by the National Natural Science Foundation of China (grant nos. 41941017 and 41877522).

Institutional Review Board Statement

Not applicable.

Informed Consent Statement

Not applicable.

Data Availability Statement

Not applicable.

Conflicts of Interest

The authors declare no conflict of interest.

References

  1. Petley, D. Global patterns of loss of life from landslides. Geology 2012, 40, 927–930. [Google Scholar] [CrossRef]
  2. Singh, P.; Maurya, V.; Dwivedi, R. Pixel based landslide identification using Landsat 8 and GEE. In Proceedings of the IEEE International Geoscience and Remote Sensing Symposium IGARSS, Brussels, Belgium, 11–16 July 2021; Volume XLIII-B3, pp. 721–726. [Google Scholar]
  3. Mondini, A.C.; Guzzetti, F.; Reichenbach, P.; Rossi, M.; Cardinali, M.; Ardizzone, F. Semi-automatic recognition and mapping of rainfall induced shallow landslides using optical satellite images. Remote Sens. Environ. 2011, 115, 1743–1757. [Google Scholar] [CrossRef]
  4. Cheng, K.S.; Wei, C.; Chang, S.C. Locating landslides using multi-temporal satellite images. Adv. Space Res. 2004, 33, 296–301. [Google Scholar] [CrossRef]
  5. Lindsay, E.; Frauenfelder, R.; Ruther, D.; Nava, L.; Rubensdotter, L.; Strout, J.; Nordal, S. Multi-Temporal Satellite Image Composites in Google Earth Engine for Improved Landslide Visibility: A Case Study of a Glacial Landscape. Remote Sens. 2022, 14, 2301. [Google Scholar] [CrossRef]
  6. Handwerger, A.L.; Huang, M.H.; Jones, S.Y.; Amatya, P.; Kerner, H.R.; Kirschbaum, D.B. Generating landslide density heatmaps for rapid detection using open-access satellite radar data in Google Earth Engine. Nat. Hazards Earth Syst. Sci. 2022, 22, 753–773. [Google Scholar] [CrossRef]
  7. Sreelakshmi, S.; Vinod Chandra, S.S.; Shaji, E. Landslide identification using machine learning techniques: Review, motivation, and future prospects. Earth Sci. Inform. 2022, 15, 2063–2090. [Google Scholar]
  8. Ghorbanzadeh, O.; Blaschke, T.; Gholamnia, K.; Meena, S.R.; Tiede, D.; Aryal, J. Evaluation of Different Machine Learning Methods and Deep-Learning Convolutional Neural Networks for Landslide Detection. Remote Sens. 2019, 11, 196. [Google Scholar] [CrossRef] [Green Version]
  9. Shi, W.Z.; Zhang, M.; Ke, H.F.; Fang, X.; Zhan, Z.; Chen, S.X. Landslide Recognition by Deep Convolutional Neural Network and Change Detection. IEEE Trans. Geosci. Remote Sens. 2021, 59, 4654–4672. [Google Scholar] [CrossRef]
  10. Xie, M.L.; Zhao, W.H.; Ju, N.P.; He, C.Y.; Huang, H.D.; Cui, Q.H. Landslide evolution assessment based on InSAR and real-time monitoring of a large reactivated landslide, Wenchuan, China. Eng. Geol. 2020, 277, 105781. [Google Scholar] [CrossRef]
  11. Xie, M.W.; Huang, J.X.; Wang, L.W.; Huang, J.H.; Wang, Z.F. Early landslide detection based on D-InSAR technique at the Wudongde hydropower reservoir. Environ. Earth Sci. 2016, 75, 717. [Google Scholar] [CrossRef]
  12. Rosi, A.; Tofani, V.; Tanteri, L.; Stefanelli, C.T.; Agostini, A.; Catani, F.; Casagli, N. The new landslide inventory of Tuscany (Italy) updated with PS-InSAR: Geomorphological features and landslide distribution. Landslides 2018, 15, 5–19. [Google Scholar] [CrossRef] [Green Version]
  13. Su, X.J.; Zhang, Y.; Meng, X.M.; Yue, D.X.; Ma, J.H.; Guo, F.Y.; Zhou, Z.Q.; Rehman, M.U.; Khalid, Z.; Chen, G.; et al. Landslide mapping and analysis along the China-Pakistan Karakoram Highway based on SBAS-InSAR detection in 2017. J. Mt. Sci. 2021, 18, 2540–2564. [Google Scholar] [CrossRef]
  14. Zhou, C.; Cao, Y.; Hu, X.; Yin, K.L.; Wang, Y.; Catani, F. Enhanced dynamic landslide hazard mapping using MT-InSAR method in the Three Gorges Reservoir Area. Landslides 2022, 19, 1585–1597. [Google Scholar] [CrossRef]
  15. Mishra, V.; Jain, K. Satellite based assessment of artificial reservoir induced landslides in data scarce environment: A case study of Baglihar reservoir in India. J. Appl. Geophys. 2022, 205, 104754. [Google Scholar] [CrossRef]
  16. Ke, H.F. Research on DEM-Aided Landslide Extraction Method from Aerial Images. Master’s Thesis, Wuhan University, Wuhan, China, 2020. (In Chinese with English Abstract). [Google Scholar]
  17. Rui, J.; Jin, F.; Xie, H.; Wang, C.; Zhang, H. Landslide detection based on DEM matching. J. Geomat. Sci. Technol. 2018, 35, 477484, (In Chinese with English Abstract). [Google Scholar]
  18. Yokoyama, R.; Pike, R.J. Visualizing topography by openness: A new application of image processing to digital elevation models. Photogramm. Eng. Remote Sens. 2002, 68, 257–266. [Google Scholar]
  19. Chiba, T.; Kaneta, S.; Suzuki, Y. Red relief image map: New visualization method for three dimensional data. In Proceedings of the 21st International Society for Photogrammetry and Remote Sensing (ISPRS 2008), Beijing, China, 3 July 2008; pp. 2274–2279. [Google Scholar]
  20. Chiba, T.; Hasi, B. Ground surface visualization using red relief image map for a variety of map scales. Int. Arch. Photogramm. Remote Sens. Spat. Inf. Sci. 2016, XLI-B2, 393–397. [Google Scholar] [CrossRef] [Green Version]
  21. Gorum, T. Landslide recognition and mapping in a mixed forest environment from airborne LiDAR data. Eng. Geol. 2019, 258, 105155. [Google Scholar] [CrossRef]
  22. Zingaro, M.; Salandra, M.L.; Colacicco, R.; Roseto, R.; Petio, P.; Capolongo, D. Suitability assessment of global, continental and national digital elevation models for geomorphological analyses in Italy. Trans. GIS 2021, 25, 2283–2308. [Google Scholar] [CrossRef]
  23. Salandra, M.L.; Roseto, R.; Mele, D.; Dellino, P.; Capolongo, D. Probabilistic hydro-geomorphological hazard assessment based on UAV-derived high-resolution topographic data: The case of Basento river (Southern Italy). Sci. Total Environ. 2022, 842, 156736. [Google Scholar] [CrossRef]
  24. Luo, X.K. Study on the Relationship between Giant Ancient Landslides and River Terraces in the Middle Part of the Upper Minjiang River. Master’s Thesis, China University of Geosciences, Beijing, China, 2019. (In Chinese with English Abstract). [Google Scholar]
  25. Ma, Y.L.; Wu, H.; Zhang, W.H. Exploring the application of remote sensing technology in landslide identification. Technol. Innov. Appl. 2022, 12, 142–145, (In Chinese with English Abstract). [Google Scholar]
  26. Azarafza, M.; Azarafza, M.; Akgun, H.; Atkinson, P.M.; Derakhshani, R. Deep learning-based landslide susceptibility mapping. Sci. Rep. 2021, 11, 24112. [Google Scholar] [CrossRef]
  27. Nanehkaran, Y.A.; Licai, Z.; Chen, J.; Azarafza, M.; Yimin, M. Application of artificial neural networks and geographic information system to provide hazard susceptibility maps for rockfall failures. Environ. Earth Sci. 2022, 81, 475. [Google Scholar] [CrossRef]
  28. Nanehkaran, Y.A.; Mao, Y.M.; Azarafza, M.; Kockar, M.K.; Zhu, H.H. Fuzzy-based multiple decision method for landslide susceptibility and hazard assessment: A case study of Tabriz, Iran. Geomech. Eng. 2021, 24, 407–418. [Google Scholar]
  29. Nikoobakht, S.; Azarafza, M.; Akgun, H.; Derakhshani, R. Landslide Susceptibility Assessment by Using Convolutional Neural Network. Appl. Sci. 2022, 12, 5992. [Google Scholar] [CrossRef]
  30. Blothe, J.H.; Korup, O.; Schwanghart, W. Large landslides lie low: Excess topography in the Himalaya-Karakoram ranges. Geology 2015, 43, 523–526. [Google Scholar] [CrossRef]
  31. Liu, W.M.; Zhou, Z.; Zhou, L.Q.; Chen, X.Q.; Yanites, B.; Zhou, Y.L.; Li, X.M.; Zhang, X.G. Analysis of Hillslope Erosion Based on Excess Topography in Southeastern Tibet. Front. Earth Sci. 2021, 9, 684365. [Google Scholar] [CrossRef]
  32. Zhang, Y.S.; Hu, D.G.; Wu, Z.H.; Zhang, J.G. Study on Crustal Stability and Major Engineering Geological Problems along Yunnan Tibet Railway; Geological Publishing House: Beijing, China, 2009; (In Chinese with English Abstract). [Google Scholar]
  33. Yao, X.; Deng, J.H.; Liu, X.H.; Zhou, Z.K.; Yao, J.M.; Dai, F.C.; Ren, K.Y.; Li, L.J. InSAR preliminary identification and development law analysis of active landslides in the pan-three-river confluence area of the Qinghai-Tibet Plateau. Adv. Eng. Sci. 2020, 52, 16–37, (In Chinese with English Abstract). [Google Scholar]
  34. Wang, X.; Fan, X.M.; Yang, F.; Dong, X.J. Study on remote sensing interpretation of geological hazards in mountainous areas with dense vegetation. Geomat. Inf. Sci. Wuhan Univ. 2020, 45, 1771–1781, (In Chinese with English Abstract). [Google Scholar]
  35. Zhou, Z. Analysis of Slope Erosion in Hengduan Mountain Area Based on Critical Slope. Master’s Thesis, Southwest Jiaotong University, Chengdu, China, 2020. (In Chinese with English Abstract). [Google Scholar]
  36. Schwanghart, W.; Kuhn, N.J. TopoToolbox: A set of Matlab functions for topographic analysis. Environ. Model. Softw. 2010, 25, 770–781. [Google Scholar] [CrossRef]
  37. Dong, X.J.; Yin, T.; Dai, K.R.; Pirasteh, S.; Zhuo, G.C.; Li, Z.Y.; Yu, B.; Xu, Q. Identifying Potential Landslides on Giant Niexia Slope (China) Based on Integrated Multi-Remote Sensing Technologies. Remote Sens. 2022, 14, 6328. [Google Scholar] [CrossRef]
  38. Süzen, M.L.; Doyuran, V. Data driven bivariate landslide susceptibility assessment using geographical information systems: A method and application to Asarsuyu catchment, Turkey. Eng. Geol. 2004, 71, 303–321. [Google Scholar] [CrossRef]
  39. Bai, S.B. Study on Landslide Hazard Assessment Model Supported by GIS—A Case Study of Zhongxian-Shizhu Reach in the Three Gorges Reservoir Area. Ph.D. Thesis, Aanjing Normal University, Nanjing, China, 2005. (In Chinese with English Abstract). [Google Scholar]
  40. Liu, H.C.; Li, L.; Wu, B.X.; Yao, H.Q. The mode, mechanism and condition of landslide reactivation in a certain area. Geol. Hazards Environ. Preserv. 1990, 1, 37–45, (In Chinese with English Abstract). [Google Scholar]
  41. Zhang, Y.S.; Wu, R.A.; Guo, C.B.; Wang, L.C.; Yao, X.; Yang, Z.H. Research progress and prospect of ancient landslide reactivation. Adv. Earth Sci. 2018, 33, 728–740, (In Chinese with English Abstract). [Google Scholar]
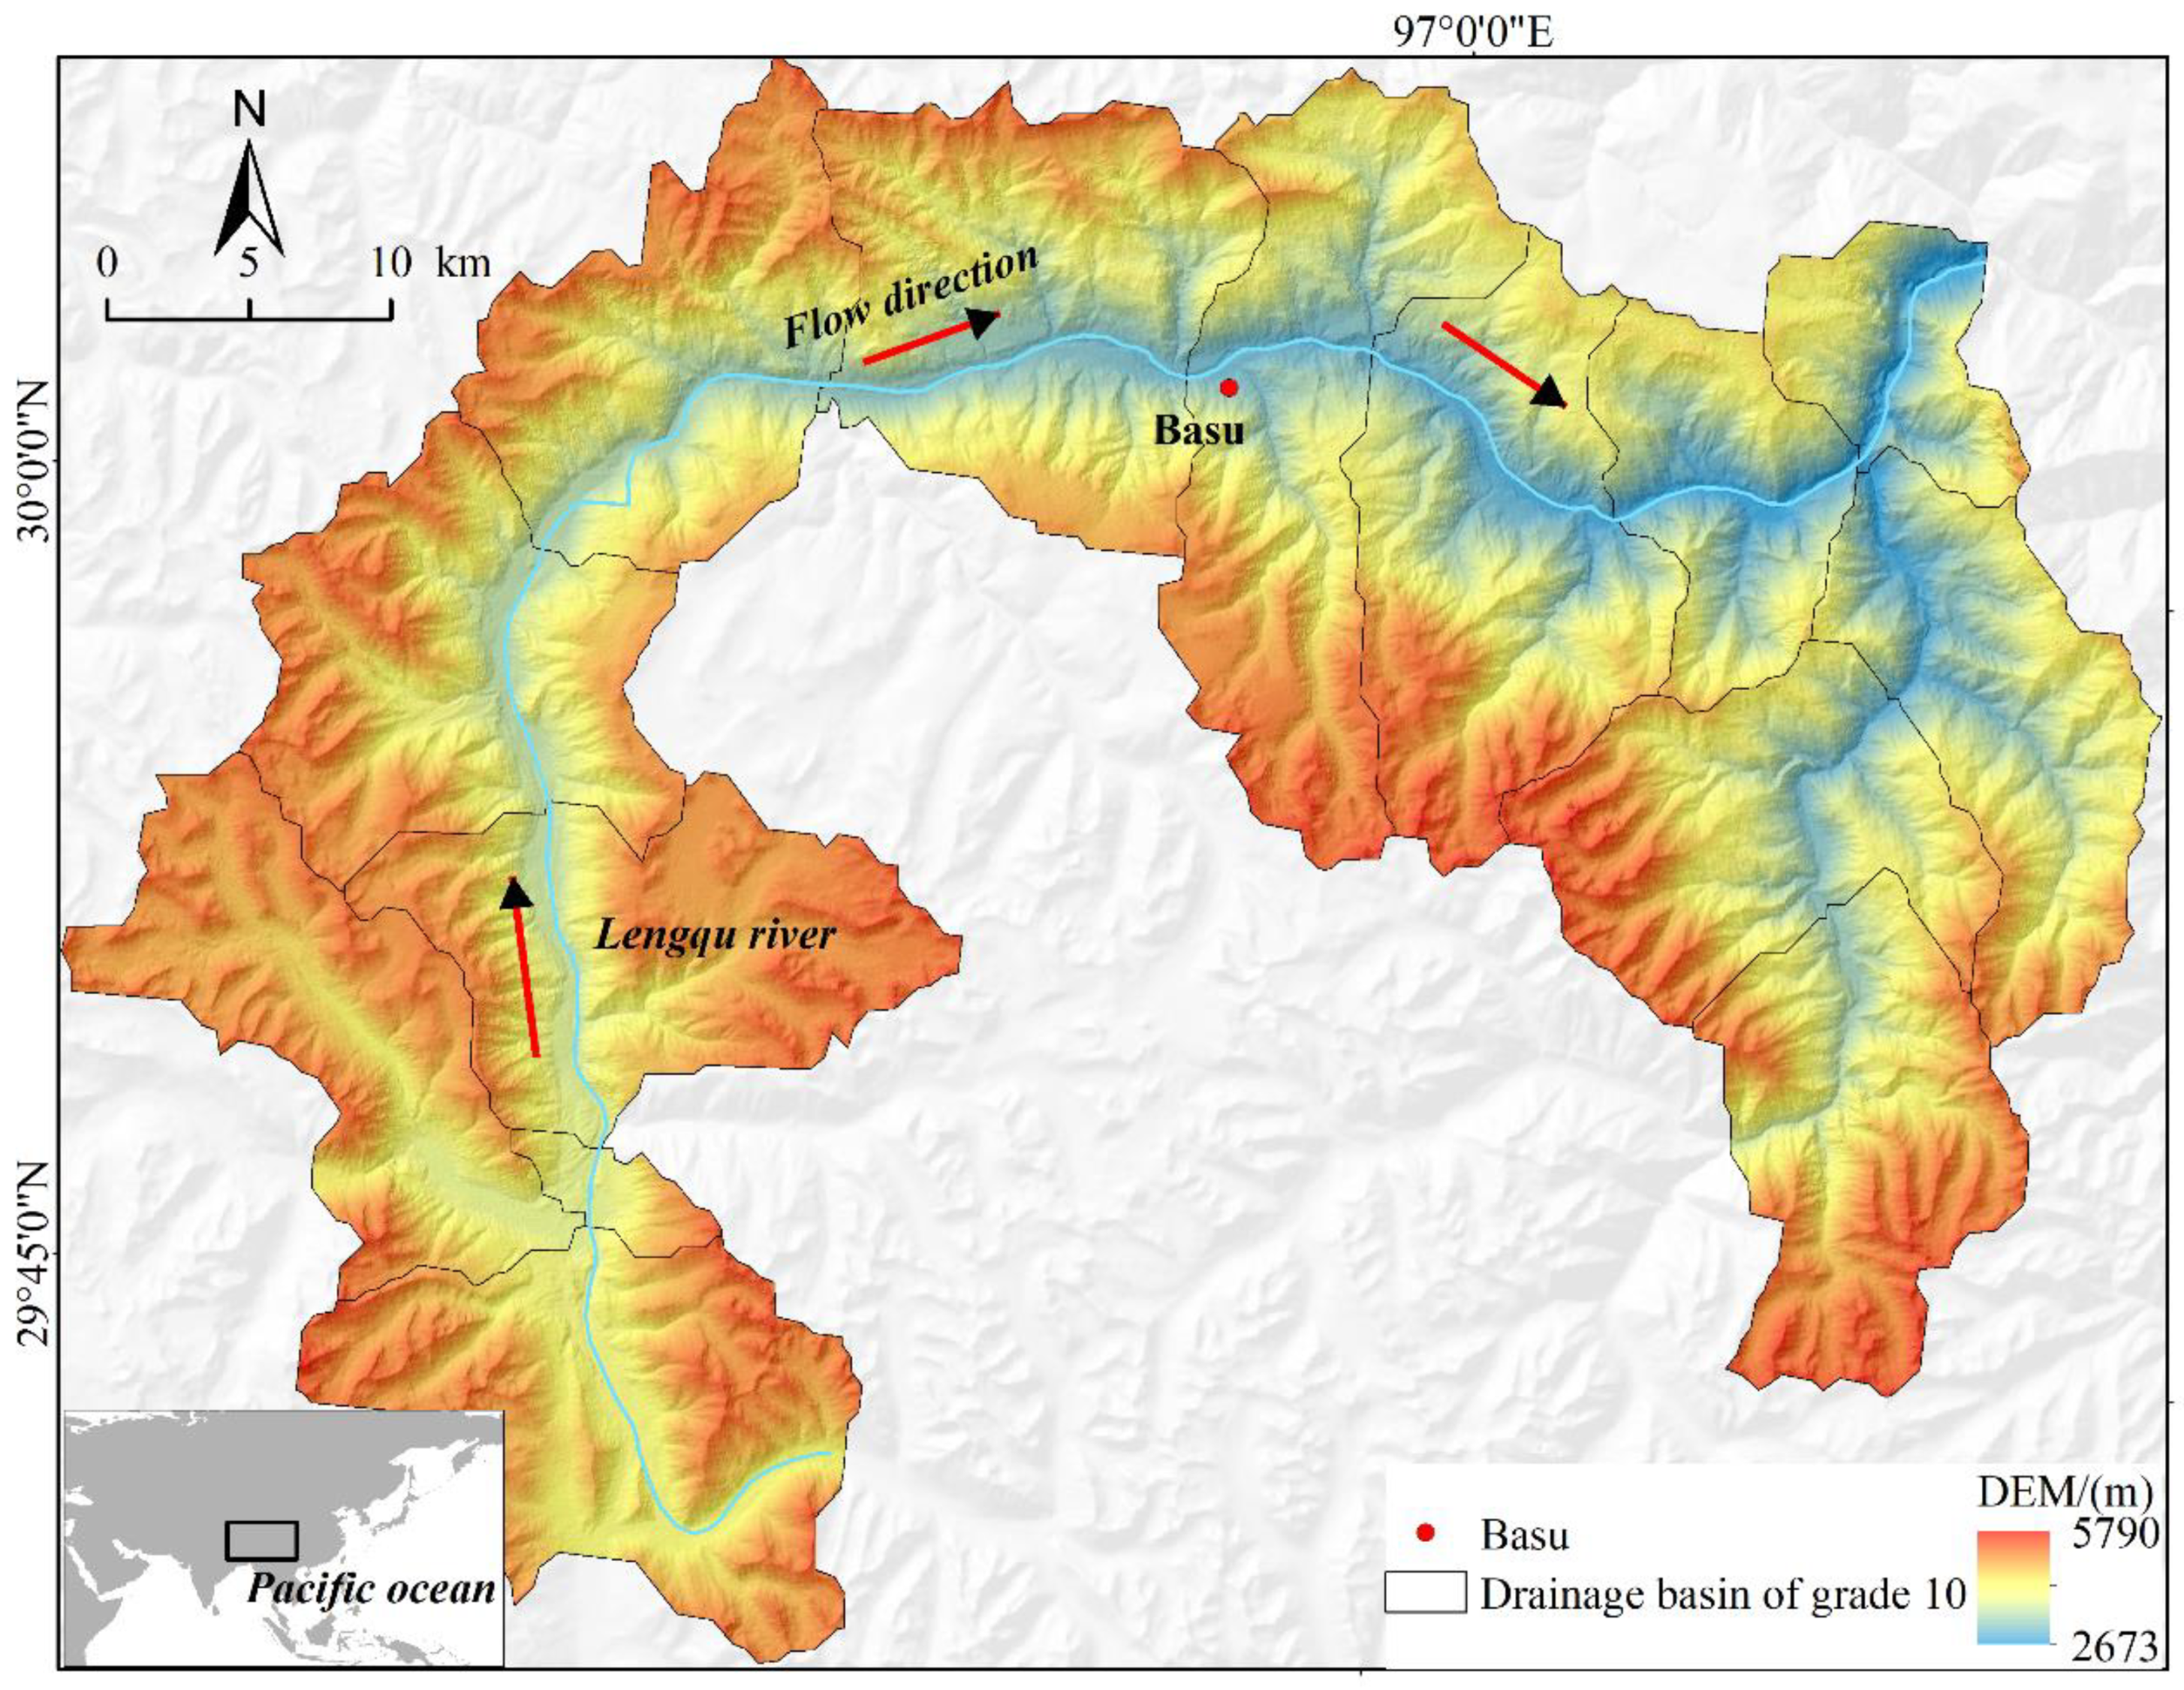
Figure 1. Overview of Lengqu River section.
Applsci 13 08085 g001
Figure 2. Research Flow Chart.
Applsci 13 08085 g002
Figure 3. Flow chart of RRIM synthesis in Lengqu River section (firstly, the DEM with 12.5 m spatial resolution is obtained to extract ground slope, topographic positive openness and topographic negative openness, and then the slope is rendered in red, the topographic positive openness and topographic negative openness are synthesized into ridge and valley index, and, finally, red slope and ridge and valley index are synthesized into RRIM map).
Applsci 13 08085 g003
Figure 4. Typical GALs identified by RRIM in Lengqu River section.
Applsci 13 08085 g004
Figure 5. Display of Lengqu River section GALs identified by RRIM.
Applsci 13 08085 g005
Figure 6. Slope distribution: (a) Slope distribution of the whole Lengqu River section; (bo) Slope distribution of 14 sub-basins in Lengqu River Section.
Applsci 13 08085 g006
Figure 7. Excess topography of Lengqu River section under 30° threshold hillslope.
Applsci 13 08085 g007
Figure 8. Quantitative analysis of the relationship between surface of GALs and excess topography in Lengqu River section.
Applsci 13 08085 g008
Figure 9. Quantitative relationship between resurgent GALs and excess topography in Lengqu River section: (a) Quantitative relationship between six resurgent GALs monitored by InSAR and excess topography; (b) Quantitative relationship between five resurgent GALs and excess topography; (c) Quantitative relationship between inactive GAL depositions and excess topography.
Applsci 13 08085 g009
Table 1. Source of data.
DataSource
12.5 × 12.5 m DEM
InSAR-based identification of resurgent GAL data in the upper reaches of Nujiang River Basin
https://search.asf.alaska.edu/ (1 January 2023)
Yao X. et al. Preliminary identification and developmental pattern analysis of active landslides based on InSAR in the pan-Sanjiang parallel flow area of Qinghai–Tibet Plateau
Table 2. Slope distribution of Lengqu River section.
LocationSlope
Mode slope in Lengqu River section30°
Mean slope in Lengqu River section26°
Sub-basin b23°
Sub-basin c23°
Sub-basin d23°
Sub-basin e
Sub-basin f30°
Sub-basin g30°
Sub-basin h30°
Sub-basin i30°
Sub-basin j23°
Sub-basin k30°
Sub-basin l30°
Sub-basin m30°
Sub-basin n30°
Sub-basin o34°
Disclaimer/Publisher’s Note: The statements, opinions and data contained in all publications are solely those of the individual author(s) and contributor(s) and not of MDPI and/or the editor(s). MDPI and/or the editor(s) disclaim responsibility for any injury to people or property resulting from any ideas, methods, instructions or products referred to in the content.