Article

Compression Behavior of Rubber–Bentonite Mixture under Different Salinities

1
School of Civil Engineering, Guangzhou University, Guangzhou 510006, China
2
Guangzhou Metro Design & Research Institute Co., Ltd., Guangzhou 510010, China
*
Author to whom correspondence should be addressed.
Appl. Sci. 2023, 13(14), 8134; https://doi.org/10.3390/app13148134
Submission received: 11 June 2023 / Revised: 3 July 2023 / Accepted: 10 July 2023 / Published: 12 July 2023

Abstract

:
This study investigated the engineering properties of a rubber–bentonite mixture under different salt solution concentrations, mass ratios, and consolidation pressures. In addition, the effects of different solute ion concentrations on the compression index of the samples were compared. The results showed that the compression coefficient could be reduced effectively by increasing the weight percentage of rubber without being affected by the salt solution. However, with the increase in the salt solution concentration, the compression coefficient of mixed materials with different mass ratios increased, and when the salt solution concentration exceeded 0.5 mol/L, the compression coefficient increased more obviously. In a 0.1 mol/L NaCl solution, the addition of different levels of rubber could increase the compression modulus of the mixed material and reduce the compression ratio of the mixed material. This showed that in an environment with a low salt solution concentration, adding rubber into the mixed material could enhance its compressive deformation resistance. However, when the rubber content exceeded 50%, significant pores appeared in the sample, and the effect of high salt solution concentration intensified. The rubber content also had an effect on the swelling properties of soil, and the degradation of rubber in the salt solution showed reduced mechanical properties. This emphasizes the need to consider the stability and resistance of saline–alkali areas to salt erosion.

1. Introduction

Bentonite is widely recognized in industry worldwide as one of the most suitable materials for buffer barrier systems in high-level radioactive waste disposal facilities owing to its exceptional swelling and impermeability properties [1,2]. However, the subsurface water at nuclear waste disposal sites is often salty in terms of temperature and chemical composition. As groundwater permeates through the ground, it can lead to changes in the permeability, compressibility, and strength of bentonite. This poses a risk of the direct erosion of the external structure of nuclear waste storage tanks by groundwater, potentially resulting in the outward migration of high-level radioactive nuclides. This can have a severe impact on the surrounding environment and ecosystem.
Rubber materials have emerged as crucial elements in the field of vibration reduction and sound insulation due to their favorable damping properties. These properties enable them to effectively absorb and disperse vibration energy within vibration isolators [3,4]. The application of rubber materials in the domain of vibration isolation offers remarkable comfort and protection. These materials exhibit high durability and stability, making them capable of withstanding varying pressures, weights, and environmental conditions [5,6,7]. Additionally, rubber materials possess resistance against corrosive substances like acids, alkalis, and chemical solutions. Given their exceptional properties, rubber materials find extensive usage in many projects such as construction, bridges, roads, railways, airports, and ports, as well as aerospace, military, medical, and other fields [8,9].
Rubber isolation pads represent a commonly employed form of rubber material for vibration reduction and isolation applications [10,11]. These pads consist of a layer of rubber and are placed between two vibration isolation structures to deliver optimal isolation performance. When subjected to vibration transmission, the rubber material absorbs energy and uniformly distributes the load to the surrounding environment. Another method of vibration isolation that relies on rubber materials is the employment of rubber shock absorber rods [12]. These rods, composed of one or more rubber pipes, find use in mechanical, construction, bridge, road, and similar applications and can withstand compression and shear forces while effectively reducing structural vibration. Consequently, they are highly suitable for managing substantial vibration levels.
Rubber isolation bearings also represent an application in which rubber materials are commonly employed for vibration reduction and isolation. Consisting of one or more layers of rubber pads, these bearings find placement in building structures, bridges, roads, and other relevant areas. They can support, disperse, and absorb the weight of structures, thereby reducing the impact of vibration and noise. Furthermore, rubber isolation bearings exhibit exceptional durability and stability, enabling them to withstand heavy loads. With their advantageous damping properties, they effectively minimize vibration transmission between a structure and its foundation. As a result, they find widespread use in buildings, roads, bridges, and various other infrastructure [13,14,15].
Research on the compaction characteristics of bentonite clay minerals began with the study of its mud state [16]. Researchers introduced water to bentonite to exceed its natural liquid limit [17] and investigated the changes in the porosity ratio under graded loading at a high water content to determine the optimal compaction performance. In practical engineering, compacted bentonite is commonly employed as an external buffer material for high-level radioactive waste storage tanks. By comparing the compression curves of compacted and mud-state bentonite [18,19,20], it is observed that in the compacted state, montmorillonite particles exhibit partial expansion of the diffuse double layer due to the smaller initial porosity [21]. The expansion of bentonite particles occurs gradually under initial pressure until reaching a stable state, initiating the compression process. When the initial load pressure is lower than the van der Waals force between bentonite particles, elastic compression occurs [22,23], resulting in relatively small deformation. As the load pressure gradually increases beyond the van der Waals force between particles, plastic compression is observed [24]. In the mud state, the diffuse double layer of bentonite particles is fully expanded. In a low-pressure state, the compaction of mud-state bentonite particles leads to water dissipation in the diffuse double layer and the compression of the large pores between aggregates [25], resulting in significant compression deformation between particles. However, under high-pressure conditions [26], the water in the interlayer is continuously expelled, leading to relatively small compression deformation.
Erdal Cokca et al. [27] conducted a series of studies on bentonite mixed with fly ash and rubber and discovered that the coefficient of volume compressibility values undergo changes in response to varying mixtures and curing periods. The overall observation indicated that as the percentage of rubber increases and the percentage of bentonite decreases, the coefficient of the volume compressibility values also increase. Additionally, applying either a 7-day or 28-day curing period leads to an increase in the coefficient of volume compressibility values. N. Mahesh Babu et al. [28] conducted a study on the mechanical properties of bentonite mixed with rubber fibers in the presence of two concentrations (0.1 mol/L and 1 mol/L) of salt solution. The findings revealed that utilizing salt solution as the saturated pore liquid led to a decrease in the time required for fiber-treated bentonite to achieve 90% consolidation. This increase in consolidation rate was accompanied by an increase in the consolidation coefficient (cv). Moreover, the compression index (Cc) decreased as the fiber content increased, reaching its lowest point at a 10% fiber content. However, for a fiber content of 15%, there was a slight increase in the Cc value. Additionally, the presence of salt pore fluid further reduced the Cc values, irrespective of the fiber content.
This study aimed to investigate the compression characteristics of bentonite–rubber particle mixtures under different salt solution concentrations and stress levels. The volume compression coefficient and compression modulus were obtained from one-dimensional solid consolidation tests. A combination of laboratory experiments and theoretical analysis was employed to explore the changes in the compression characteristics of bentonite/rubber mixtures for different hydrochemical characteristics of groundwater coupled with the effect of cyclic stress fields in the surrounding rocks.

1.1. Test Soil Sample, Rubber, and Solution

In this investigation, we focused on employing specific materials that would yield significant and insightful experimental outcomes. To achieve this, we utilized AQUAGEL GOLD SEAL bentonite (US HALLIBURTON Energy Limited Company, Tianjin, China) that falls under the BAROID brand). The selected bentonite demonstrated an impressive montmorillonite content of 94%, a water content of 8.4%, and a free swelling rate of 620%. Additionally, this study determined that the plastic limit was 29.7%, and the liquid limit reached 393.75%, resulting in a plasticity index of 364.05, highlighting the unique characteristics of bentonite.
For the rubber component, we sourced the particles from Lingshou County Jingjia Mineral Products Processing Plant. Produced in Shijiazhuang City, Hebei Province, China.These rubber particles possessed a density of 1.1 and 99.9% of the particles fell within the size range of 1–2.5 mm, ensuring consistency in the experimental setup.
Previous studies have consistently demonstrated a positive relationship between the cation valence present in the pore fluid and the permeability and compressibility of rubber–bentonite mixed soil [29,30]. To ensure that our experimental observations were more pronounced and easily interpreted, we chose to use NaCl solution as the salt solution in our experiments. By doing so, we could effectively investigate and analyze the effects of salt concentration on the behavior of the rubber–bentonite mixture, providing valuable insights into the permeability and compressibility characteristics of the material system.

1.2. Test Methods and Working Conditions

During the experimental process, this study conducted one-dimensional consolidation tests on the mixture of bentonite and rubber particles. Different mass ratios were used, including pure bentonite (B10), bentonite–rubber mass ratio of 8:2 (B8T2), bentonite–rubber mass ratio of 6:4 (B6T4), and bentonite–rubber mass ratio of 4:6 (B4T6). The specific mix ratio design of the experiment is shown in Table 1. The moisture content of each mixture was maintained at 40%. The mixed materials were immersed in a NaCl solution of 0~1 mol/L to simulate groundwater conditions. The steps of the one-dimensional consolidation test followed the relevant provisions specified in the “Standard Test Methods for Geotechnical Testing” (GB/T 50123-2019) [31]. After the preparation of the specimens, they were transferred to a consolidation apparatus for installation. The corresponding components were sequentially placed on the consolidation apparatus, including the external ring, permeable stones at the bottom, and filter paper. Then, the sample with a cutting ring was carefully placed into the protective ring and inserted into the external ring. A piece of filter paper was placed on the surface of the sample, followed by an upper layer of permeable stones. Finally, a pressure cap was placed, and the consolidation container was positioned under the displacement gauge frame, aligning it at the center of the displacement gauge frame. A dial gauge for recording displacement was installed. To ensure sufficient contact between the components of the consolidation apparatus during the experiment, an initial preloading pressure of 1 kPa was applied. Then, the range on the displacement gauge above was adjusted to read zero. Subsequently, an initial pressure of 50 kPa was applied to correct the errors in manual specimen preparation and ensure consistent initial conditions among specimens with different ratios. The loading time was 24 h. Then, a sodium chloride solution with concentrations of 0 mol/L, 0.1 mol/L, 0.5 mol/L, or 1 mol/L was added to the consolidation container. The samples were allowed to expand for 48 h in environments with different concentrations of saline solution. Then, the weights of weights to be added for each load level were determined according to the experimental design requirements. After applying the first load level, the consolidation compression was maintained for 24 h or until the change in dial gauge reading within 1 h did not exceed 0.01 mm to ensure stability under this load level. Once the reading on the dial gauge no longer changed, the reading on the dial gauge was recorded. The next load level was then applied, following this process until reaching the maximum applied load. After reaching the maximum experimental design load of 400 kPa, rebound tests were conducted until unloading reached the initial pressure load of 50 kPa. The stability requirements during unloading for each load level were consistent with the stability requirements during loading.
The aim of this investigation was to assess the deformation and compression capabilities of bentonite/rubber mixtures with different mass ratios under varying concentrations of salt solution. By analyzing the compression deformation characteristics, we investigated the influence of different variables on the behavior of the mixture to better understand its performance in different salt solution environments. This provides valuable insights into managing and predicting compression-related deformation in practical applications.

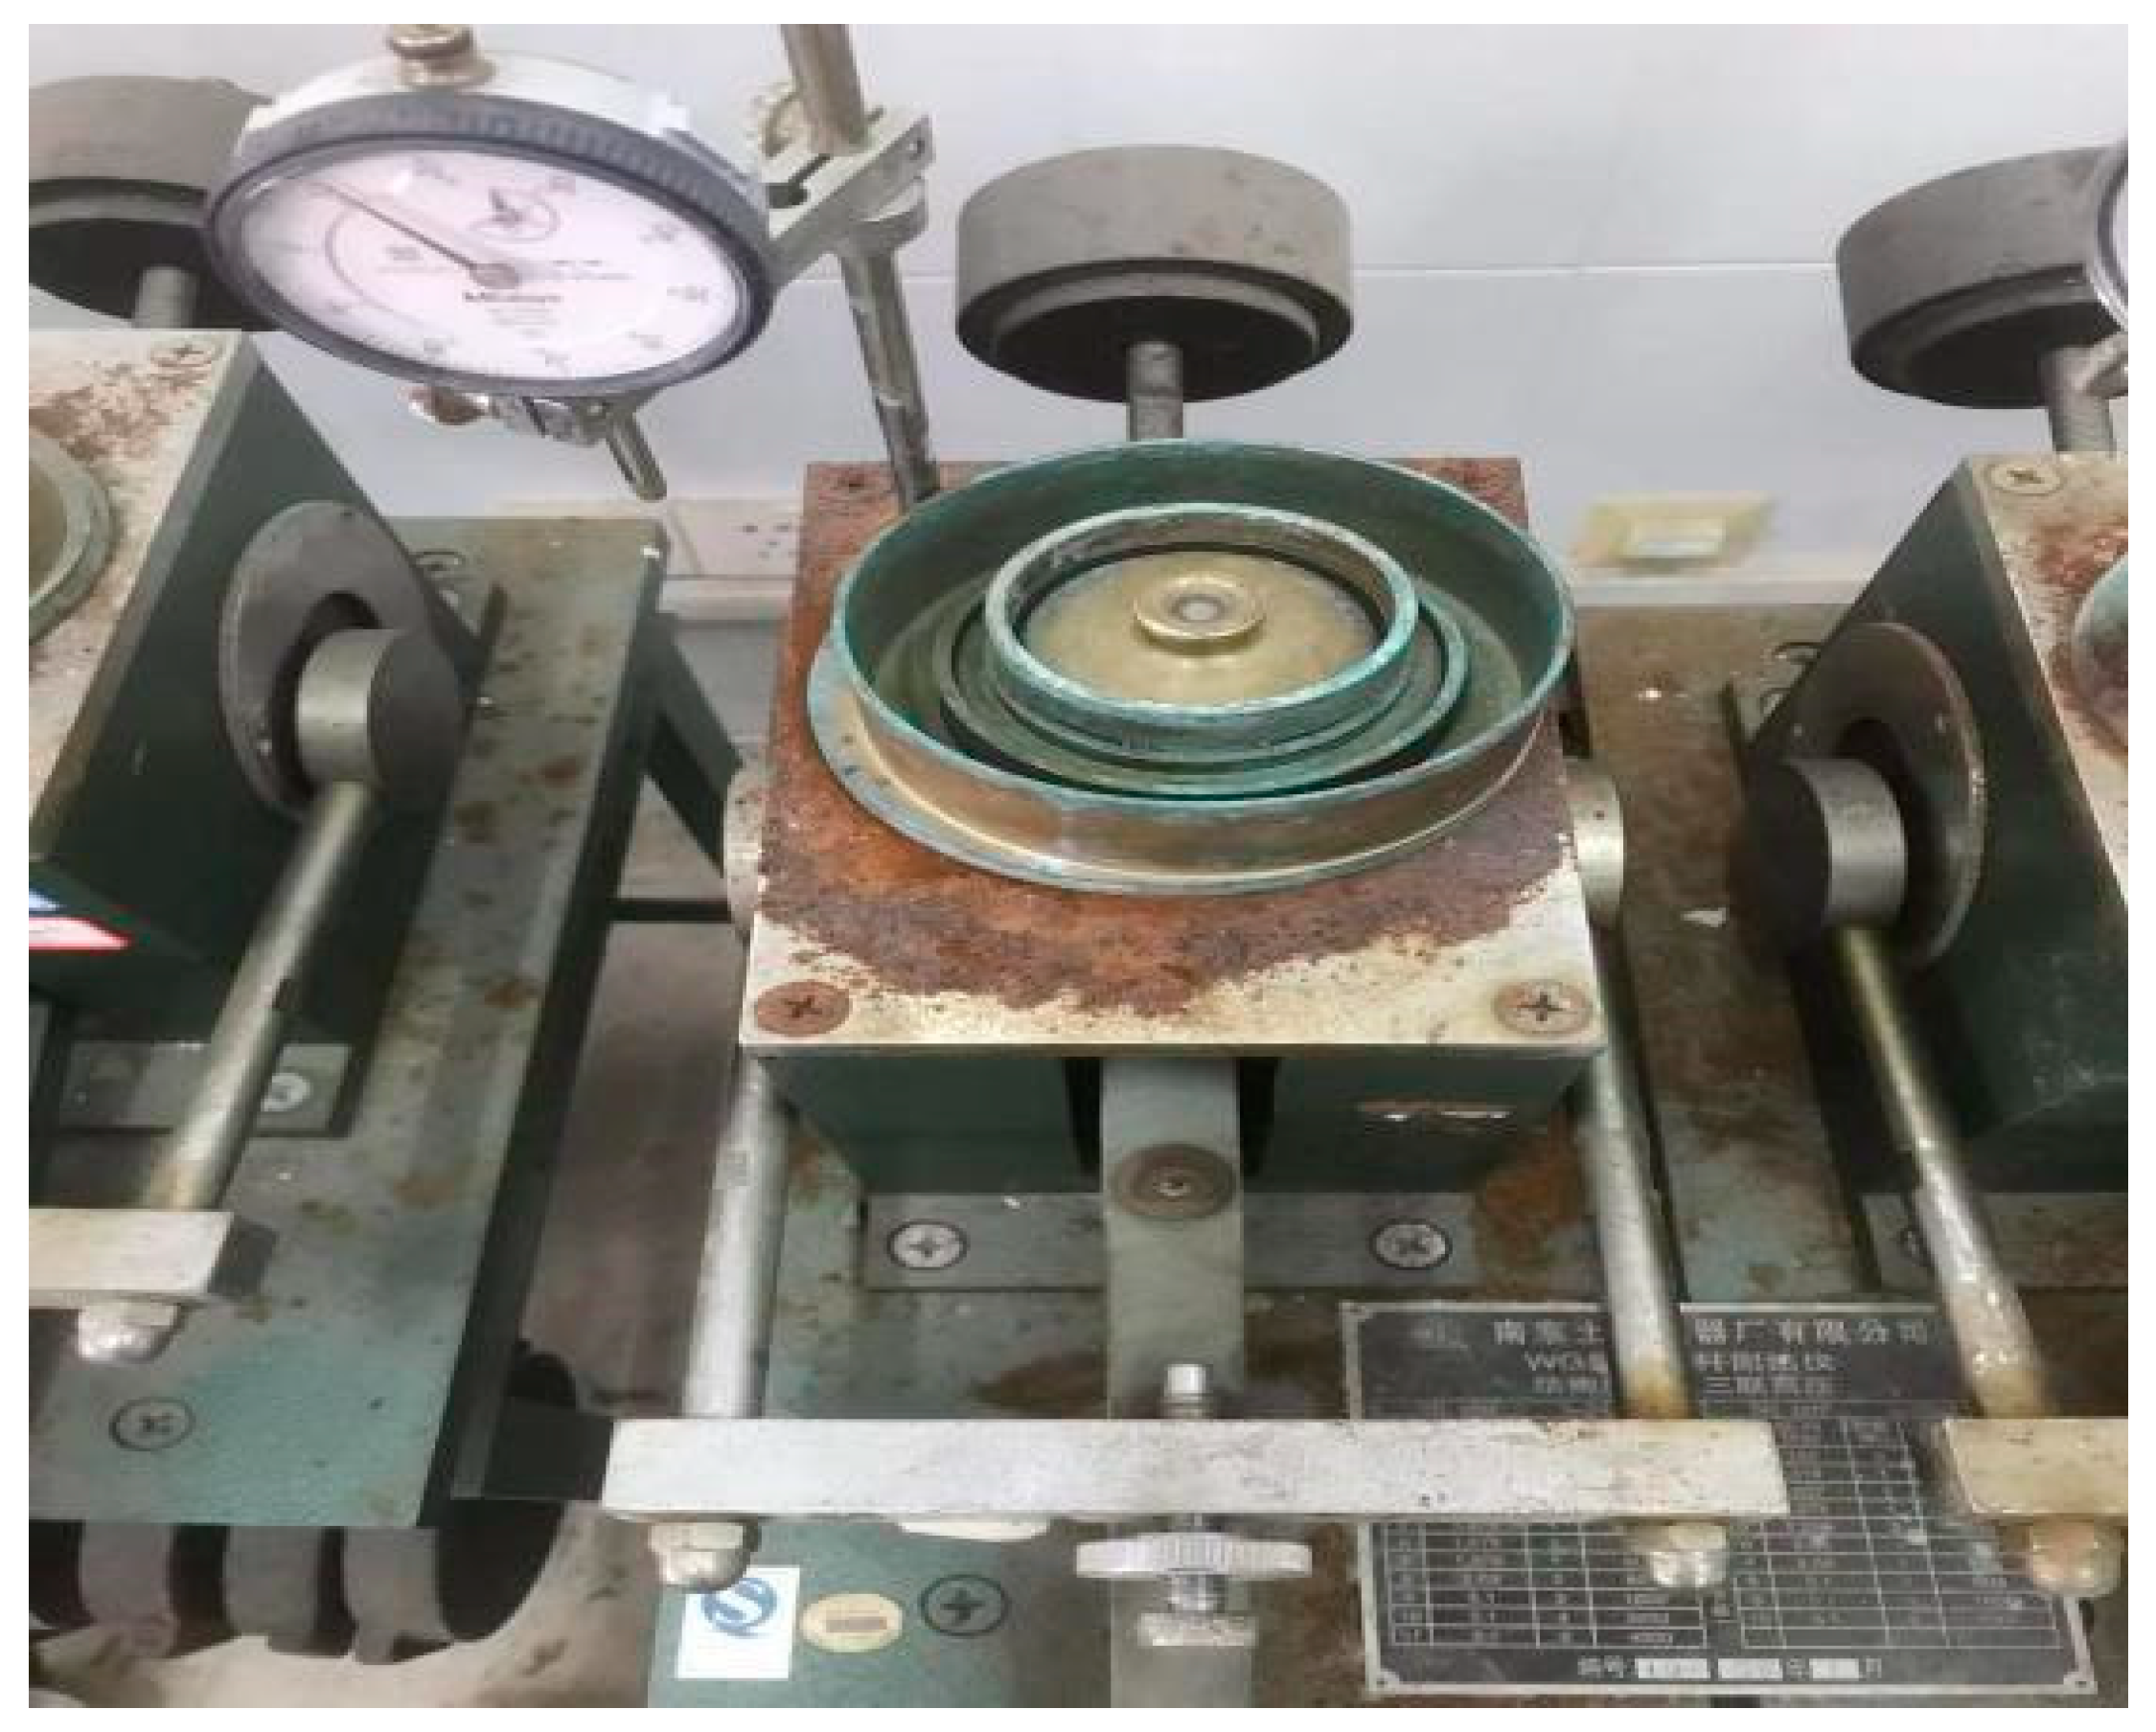
1.3. Test Instrument

The WG-type single-bar consolidation apparatus, produced by Nanjing Soil Instrument Factory Co., Ltd., was used for conducting the one-dimensional consolidation test. The apparatus is depicted in Figure 1.
To transfer and install the test sample onto the consolidation apparatus, the outer sleeve, permeable stone at the bottom, and filter paper were first placed in order. The sample prepared in the preliminary stage was carefully placed with the ring cutter into the protective ring and then inserted into the outer sleeve. A piece of filter paper was placed on the surface of the sample, which was then covered with another layer of permeable stone. Finally, a pressure cap was placed on top of the assembly. Once the sample was installed, the consolidation container was placed under the displacement gauge frame, with the center of the container aligned with the center of the displacement gauge frame. A percentimeter was installed to record the displacement.

2. Results and Discussions

2.1. Compression Coefficient Change of MX80 Bentonite/Rubber Mixture

The coefficient of volume compression is a key parameter used to assess soil compressibility. It quantifies the volume strain generated by a unit compressive stress under lateral confinement and characterizes the amount of volume reduction experienced by a soil sample during the consolidation process. This parameter is commonly expressed as a numerical value and plays a significant role in describing a soil sample’s susceptibility to substantial volume changes under pressure, indicating its capacity for compressive deformation. A higher coefficient of volume compression indicates that the soil sample is more prone to experiencing significant volume alterations when subjected to pressure, exhibiting larger compressive deformations. A lower coefficient of volume compression signifies minimal volume changes in response to a given pressure and indicates relatively smaller compressive deformations. Therefore, the coefficient of volume compression is a crucial parameter in geotechnical engineering research that is used to assess and understand the behavior of soil.
The coefficient of compression within a certain range of pressures should be calculated according to the following formula:
a v = e i e i + 1 p i + 1 p i × 10 3
where e 0 is the pore ratio at a certain pressure; p i is the unit pressure value (kPa); a v is the coefficient of compression over a range of pressures.
The experimental results of the compression coefficient of the sample tested according to rubber content, solution concentration, and vertical load as variablesare shown in Table 2.

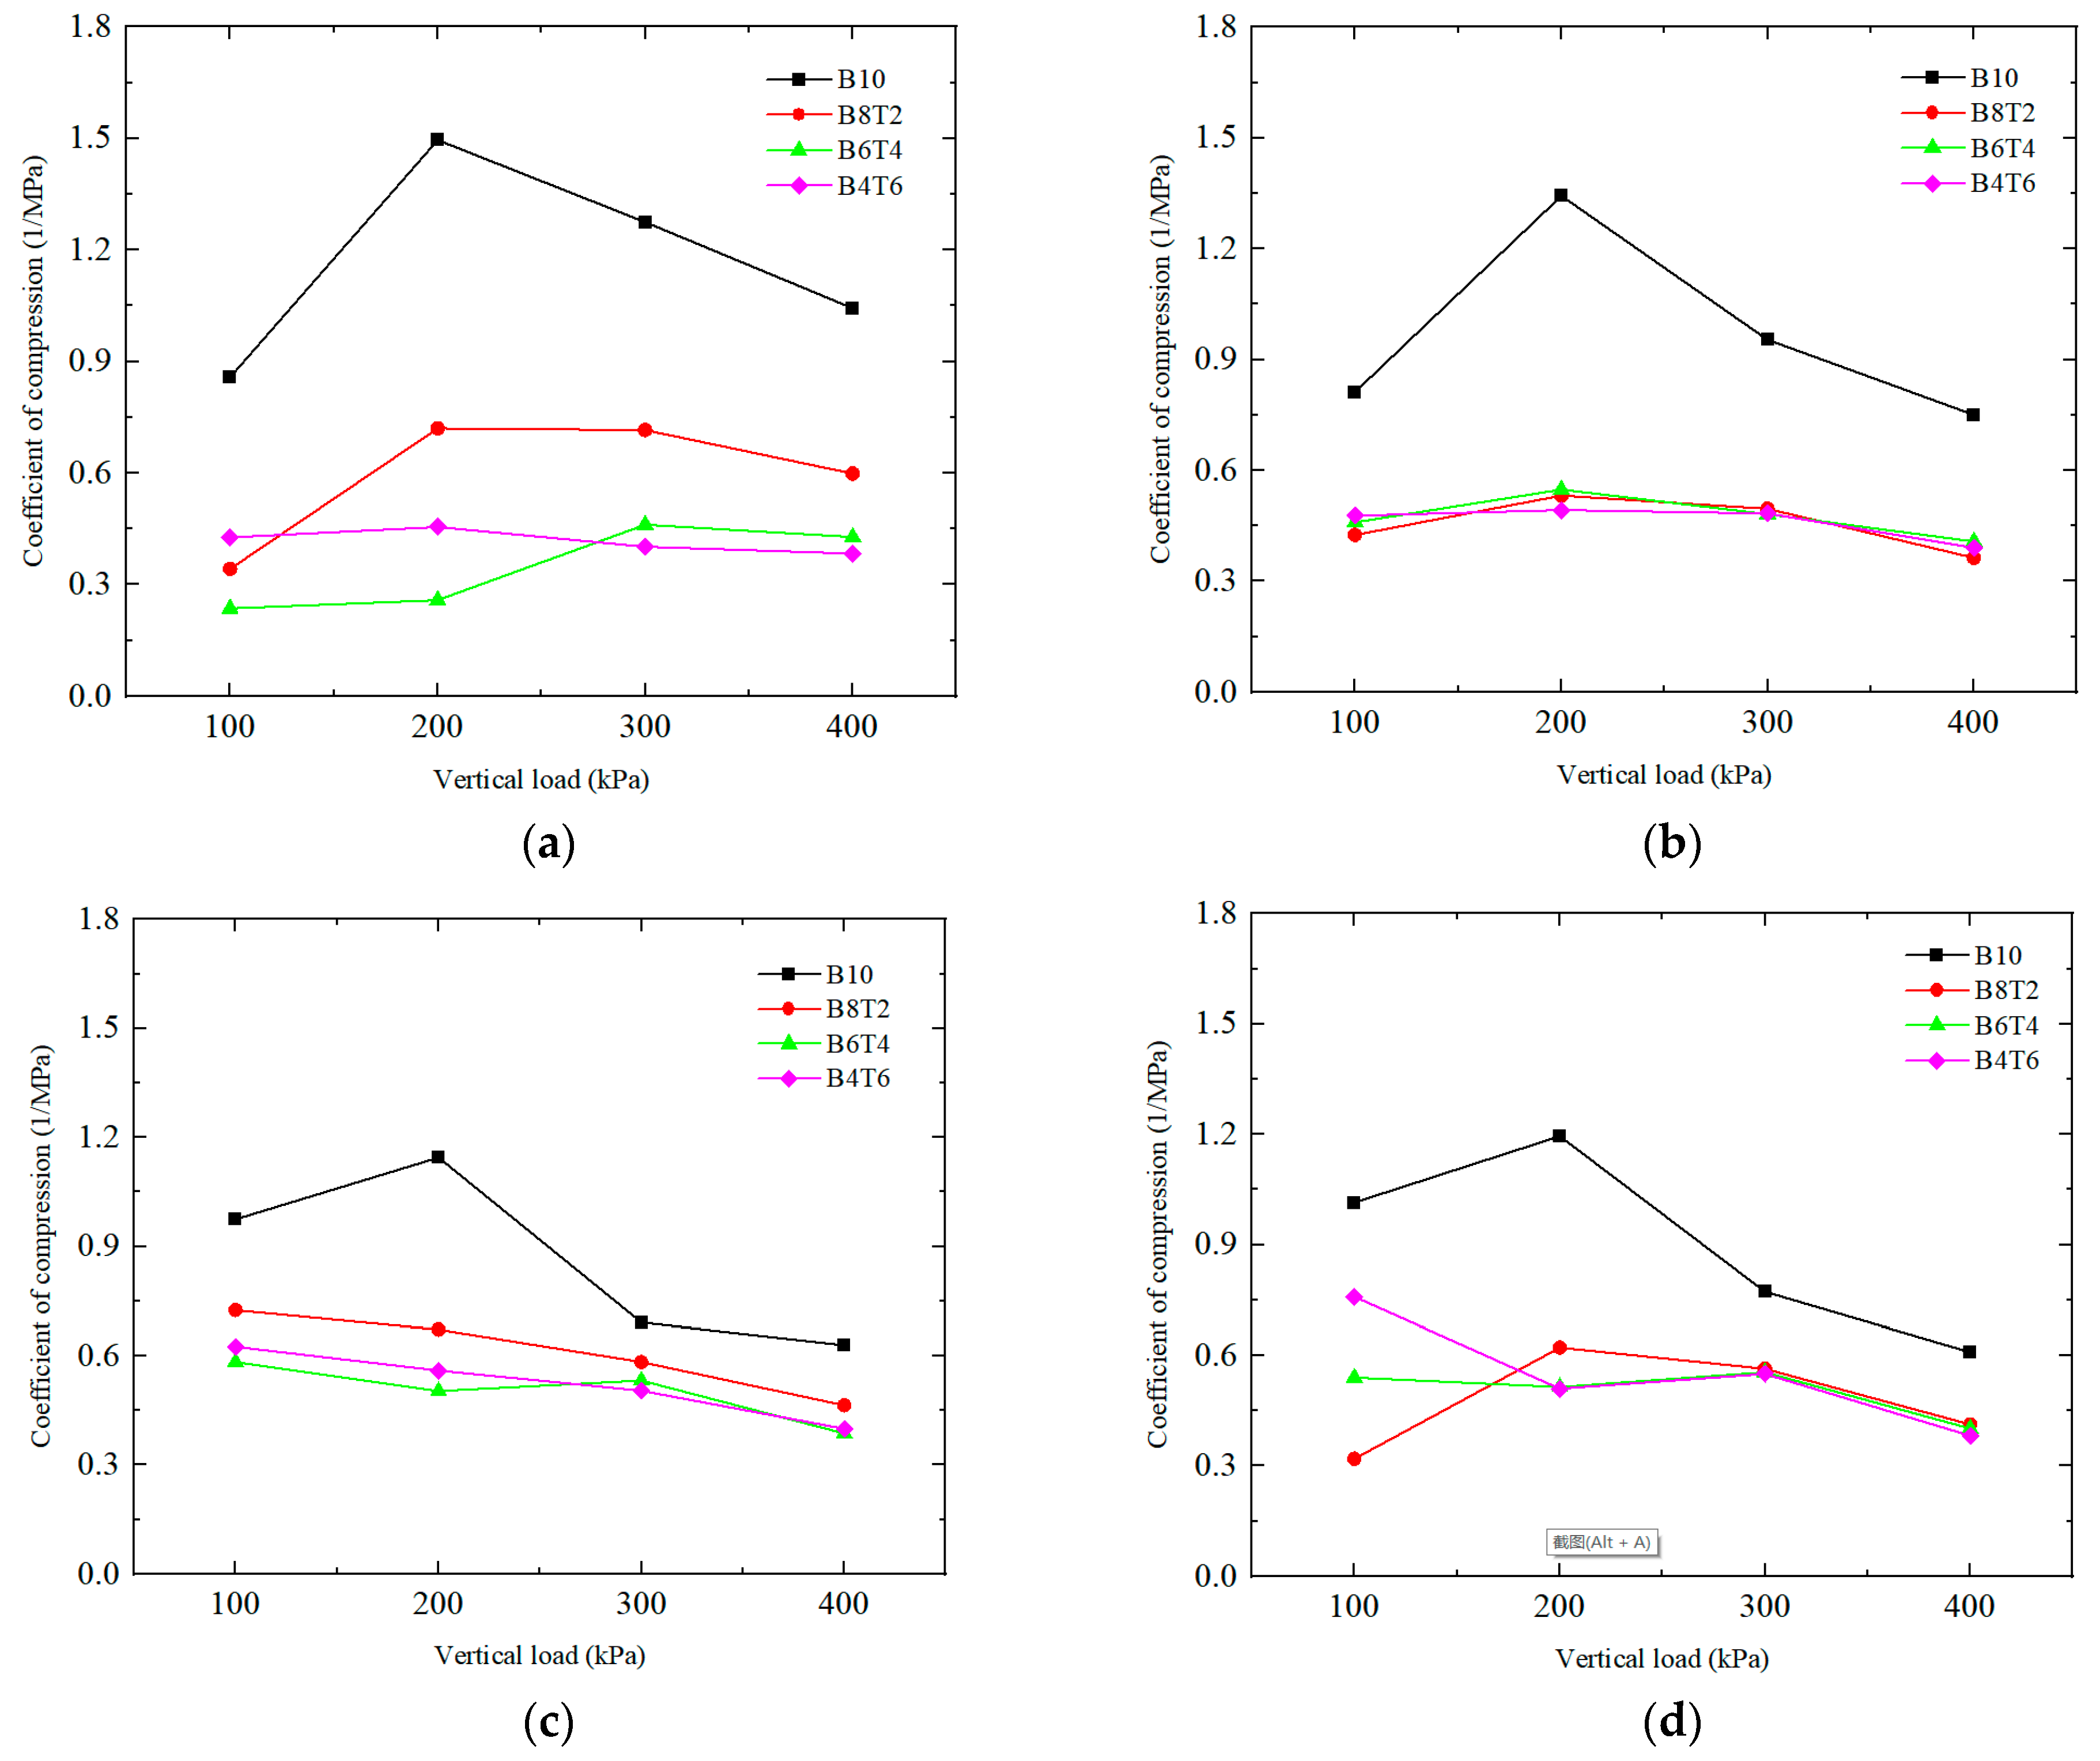
2.1.1. Influence of Different Mass Ratio on Compression Coefficient

According to the compression coefficient curve shown in Figure 2, it can be observed that there were differences in the compression coefficients between samples with different mass ratios in the same salt solution concentration environment. When the ion content of the salt solution was zero, the compression coefficients of samples B10 and B8T2 showed an increasing trend in the range of 100 kPa to 200 kPa. As the vertical load increased, the compression coefficient gradually decreased. For sample B6T4, the compression coefficient remained relatively stable when the vertical load reached 200 kPa. However, once the vertical load increased to 300 kPa, the compression coefficient increased significantly and then decreased. On the other hand, the compression coefficient of sample B4T6 remained relatively stable, and increasing the rubber content helped to reduce its compression coefficient. We added rubber fibers to bentonite to study its mechanical properties.
Melik Bekgiti et al. [32] analyzed the variation in the compression index for different tire rubber fiber and cement contents by adding rubber fiber to bentonite soil. They found that increasing the tire rubber fiber content by 0.5–2% could increase the compression index of the mixture from a minimum value of 0.25 to a maximum value of 0.85. This experiment focused on studying the compression coefficient of a composite bentonite–rubber material. It is important to note that the compression index and compression coefficient are reciprocals of each other. When the compression index increases, the compression coefficient decreases, and vice versa. Both parameters reflect the compression effect of the data, albeit in different forms. Therefore, based on this research and a comparison with previous experimental results, it can be concluded that increasing the rubber content improves the compressibility of the mixture.
Under different salt solution concentrations, the compressibility coefficients of both B10 and B8T2 samples increased from 100 kPa to 200 kPa as the vertical load increased and then gradually decreased. With an increase in the salt solution concentration, the compressibility coefficients of the B6T4 and B4T6 samples tended to increase. When the ion concentration in the salt solution exceeded 0.5 mol/L, the compressibility coefficients of both mass ratios tended to stabilize. In the 0.1 mol/L NaCl and 0.5 mol/L NaCl environments, the B6T4 and B4T6 samples exhibited similar compressibility coefficient values and variations. However, in an external 1 mol/L NaCl solution environment, the B4T6 sample expanded for 48 h under an initial load of 50 kPa, leading to a significant increase in the compressibility coefficient at 100 kPa and a larger internal pore channel. Under a 1 mol/L NaCl solution, after the internal structure of the B4T6 sample stabilized due to vertical compaction, the compressibility coefficient reached a steady state between 200 kPa and 300 kPa.
Overall, the compressibility coefficients of the samples with different mass ratios decreased as the load increased from 300 kPa to 400 kPa, indicating that higher vertical loads result in higher sample densities.

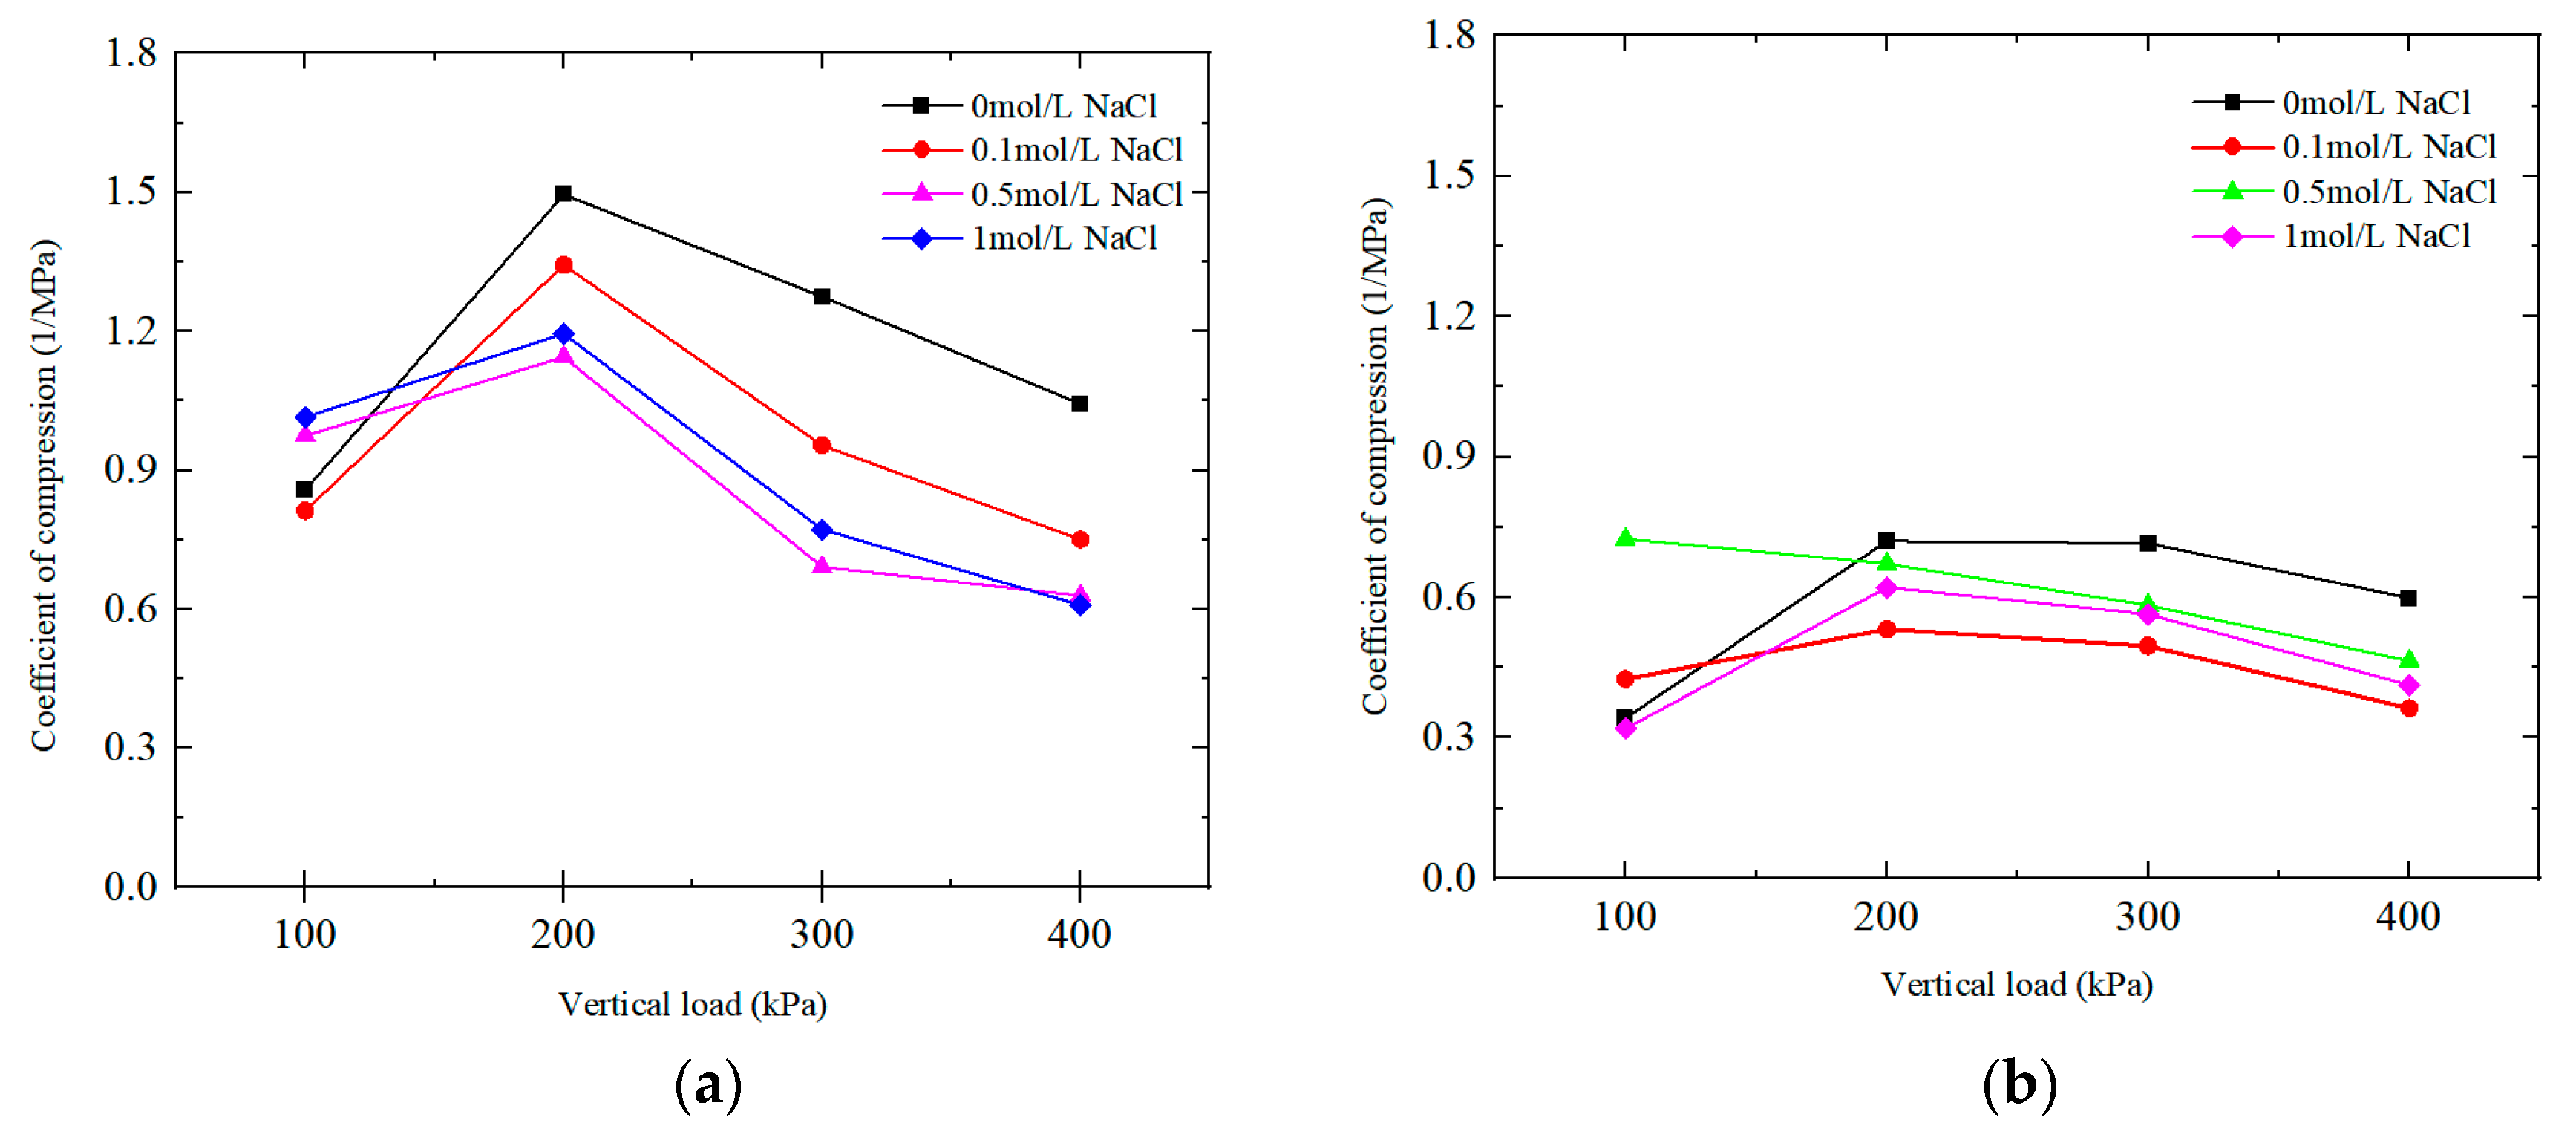
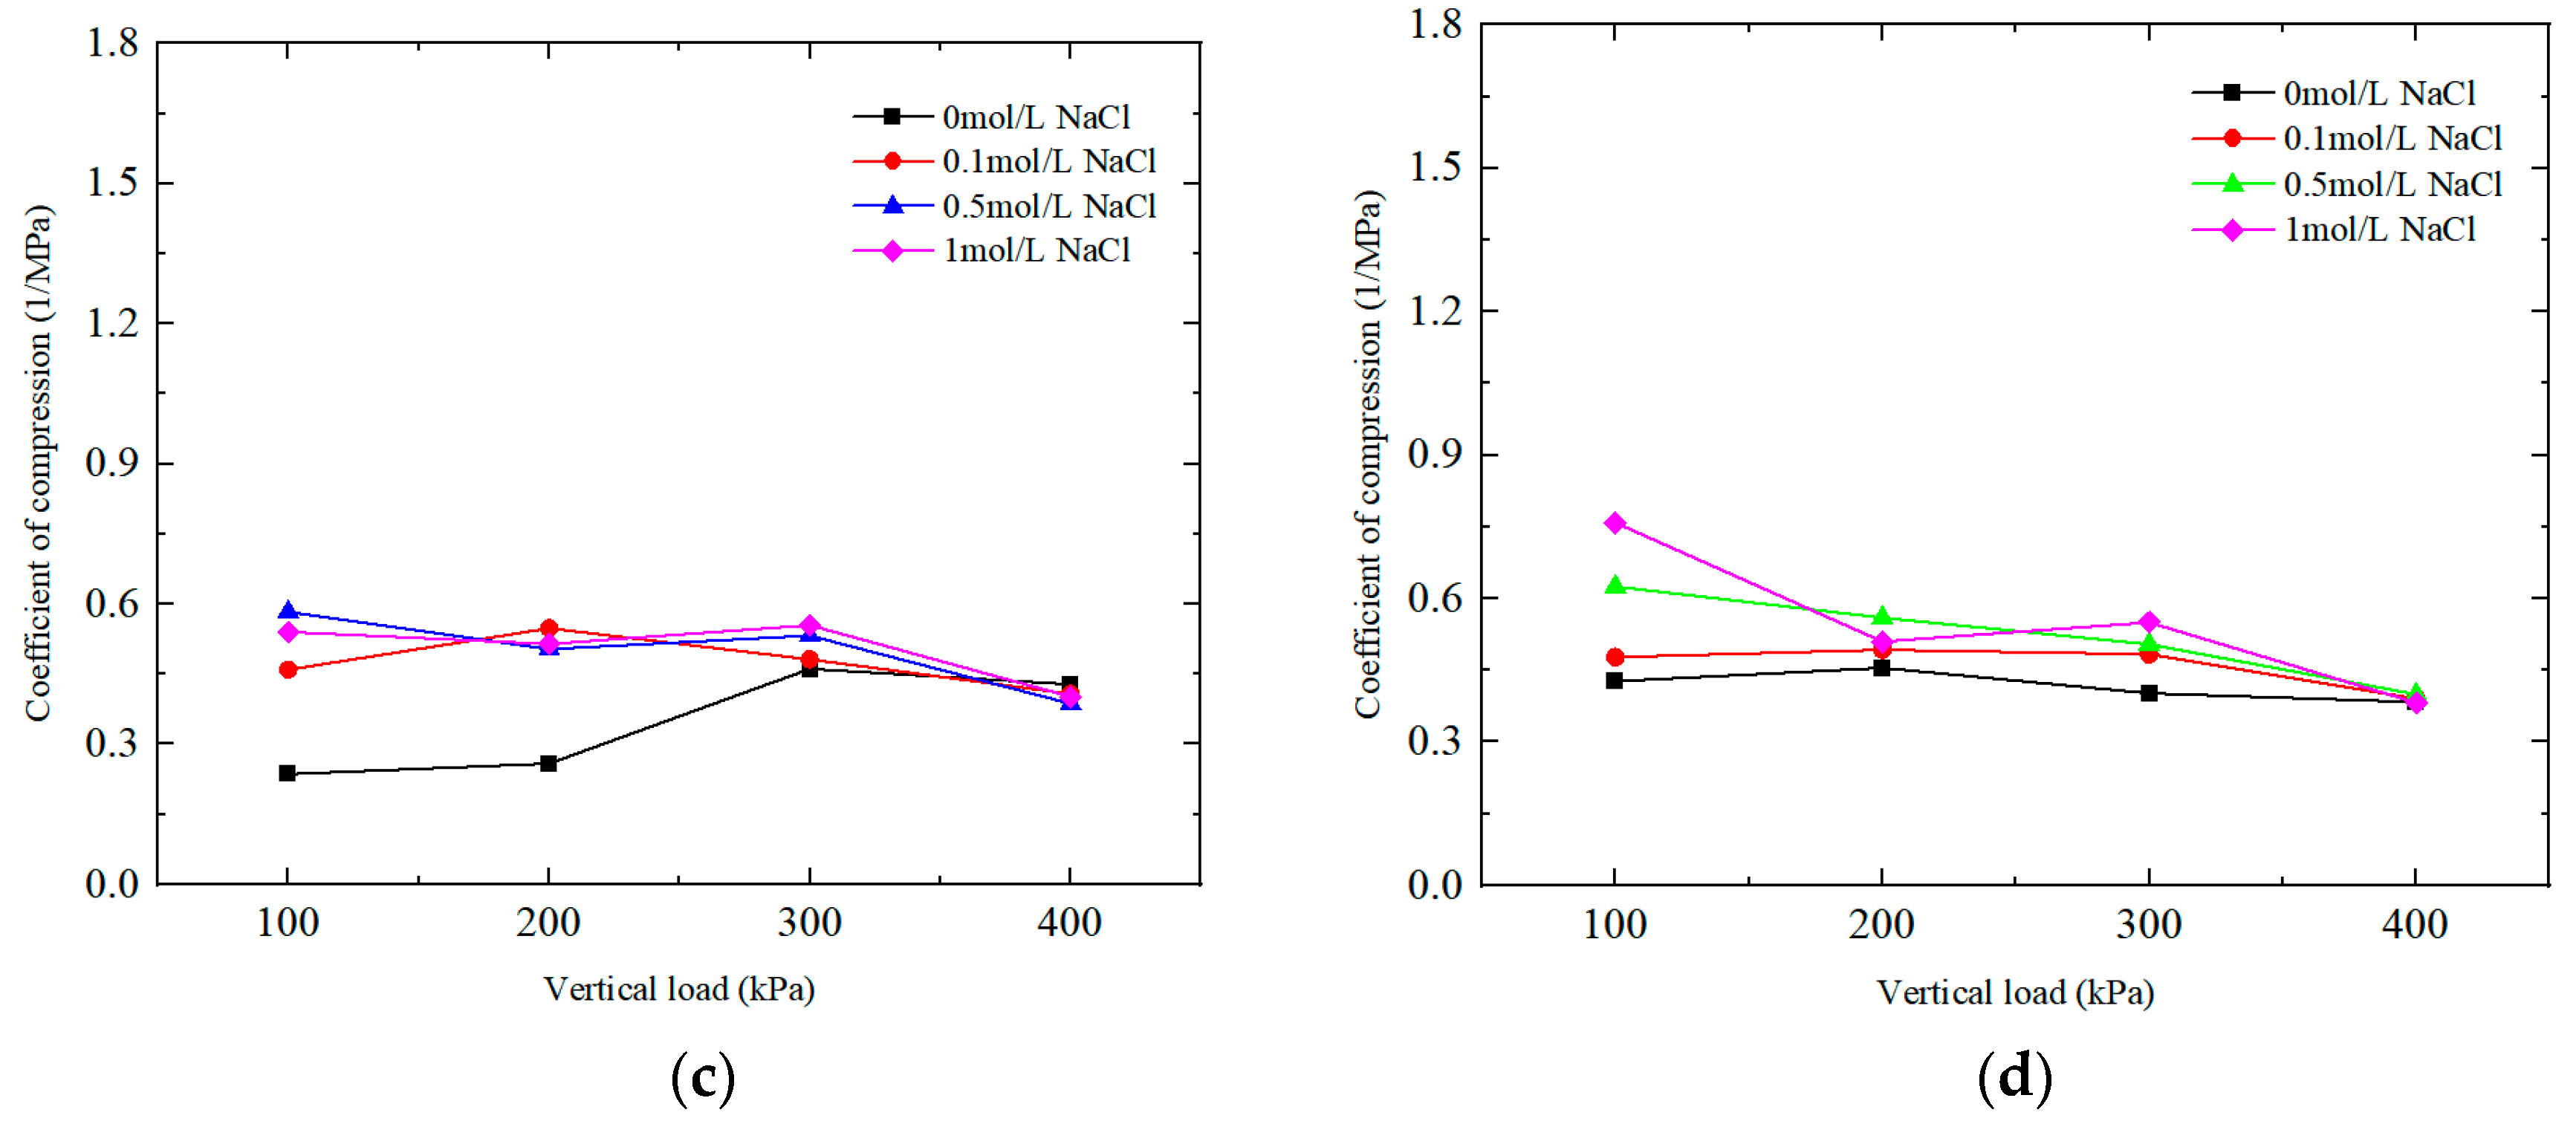
2.1.2. Influence of Salt Solution Concentration on Compression Coefficient

From the compressibility coefficient curves shown in Figure 3, the effect of salt solution concentration on the compressibility coefficients of the samples under different vertical loads can be observed. In the case of the B10 and B8T2 samples, the compressibility coefficients decreased as the vertical load gradually increased. With an increase in the salt solution concentration, both sample types exhibited similar variations within the range of vertical load from 200 kPa to 400 kPa.
For the B6T4 sample, the compressibility coefficient significantly increased when the salt solution concentration reached 0.1 mol/L. With further increases in the salt solution concentration, the compressibility coefficient fluctuated within a relatively stable range, and it increased with the increase in the vertical load. However, as the vertical load continued to increase, the compressibility coefficient started to decrease, indicating that the sample underwent further compression with the increase in vertical load.
For the B4T6 sample, regardless of the salt solution concentration in the environment, the compressibility coefficient remained relatively close at vertical loads of 200 kPa and 300 kPa. The compressibility coefficient stabilized below 0.40 MPa−1 at a vertical load of 400 kPa. However, at a vertical load of 400 kPa, the compressibility coefficient significantly decreased, indicating that a significant improvement in sample density only occurs when the rubber content mass ratio exceeds 40%. N. Mahesh Babu et al. [28] found that with the increase in rubber fiber content, the compression index (Cc) decreased until the fiber content was 10%. Subsequently, for a 15% fiber content, the Cc value increased slightly. In addition, the presence of salt pore fluid led to a slight reduction in Cc values regardless of fiber content.
These findings highlight the impact of salt solution concentration and vertical load on the compression coefficients of different sample types, providing valuable insights into their compressibility and compactness characteristics.

2.1.3. Effect of Salt Solution Concentration on Compression Modulus under Different Vertical Loads

From Figure 4a, it can be observed that at vertical loads of 100 kPa and 200 kPa, the compressive modulus of the B6T4 sample significantly decreased as the salt solution concentration increased from 0 mol/L to 0.1 mol/L. When the vertical load increased to 300 kPa and 400 kPa, the compressive modulus of the B6T4 sample remained within a stable range. On the other hand, for the B4T6 sample, under vertical loads of 100 kPa, 200 kPa, and 300 kPa, the compressive modulus decreased continuously with an increase in salt solution concentration. However, when the vertical load reached 300 kPa, the compressive modulus increased.
From Figure 4b, it can be seen that at any vertical load, the compressive modulus of the B10 sample gradually increased with an increase in salt solution concentration. Especially at a vertical load of 300 kPa, the compressive modulus of the B10 sample showed the most significant variation as the salt solution concentration increased from 0.1 mol/L to 0.5 mol/L NaCl.
N. Mahesh Babu et al. [28] observed the consolidation and hydraulic characteristics of rubber-fiber-mixed BC soil in the presence of two inorganic salt leachates (NaCl and CaCl2) at two concentrations (0.1 and 1 N). The study found that there was a slight reduction in the compression index when saltwater solutions were used as pore fluids. The reduction in the compression index was slightly greater when the concentration of the solution increased from 0.1 mol/L to 1 mol/L. The compression index values decreased for all fiber-treated soil samples observed under salt solutions.
These research findings indicate that the consolidation characteristics of rubber-fiber-mixed BC soil are influenced by the presence of saltwater solutions. Increasing the concentration of the solution further decreases the consolidation characteristics, while the addition of rubber fiber has a certain improvement effect on the compressibility performance of bentonite clay soil.
Overall, samples with different mass ratios responded differently to salt solution concentration and vertical load. The B6T4 and B8T2 samples, with higher rubber content, were less influenced by the salt solution concentration. In contrast, the B4T6 sample was more sensitive to the presence of salt solution ions. The B10 sample exhibited effective resistance to salt solution erosion under various conditions, and as the vertical load increased, its internal structure became more compact, resulting in an increase in the compressive modulus.

2.2. Modulus of Compression Change of MX80 Bentonite/Rubber Mixture

The compression modulus of soil pertains to the quantitative correlation between the compressive deformation of the soil and the load it experiences under specific loading conditions. This modulus represents a critical parameter that characterizes the compressibility of soil. It is typically expressed as the compressive strain per unit stress, thereby equating the compression modulus to the compressive strain under unit stress. This parameter significantly influences the bearing capacity, deformation characteristics, and stability of soil. In the field of geotechnical engineering, the precise measurement and analysis of the compression modulus of soil are imperative to guarantee the safety and stability of engineering constructions. By understanding and accurately assessing this modulus, engineers can make informed decisions regarding soil behavior and implement appropriate measures to mitigate risks and ensure the structural integrity of construction projects. The compression modulus within a certain pressure range should be calculated according to the following formula:
E s = 1 + e 0 a v
where e 0 is the initial void ratio; a v is the coefficient of compression over a range of pressures; E s is the modulus of compression over a range of pressures
The experimental results of the compression modulus of the samples tested according to rubber content, solution concentration, and vertical load as variables are shown in Table 3.

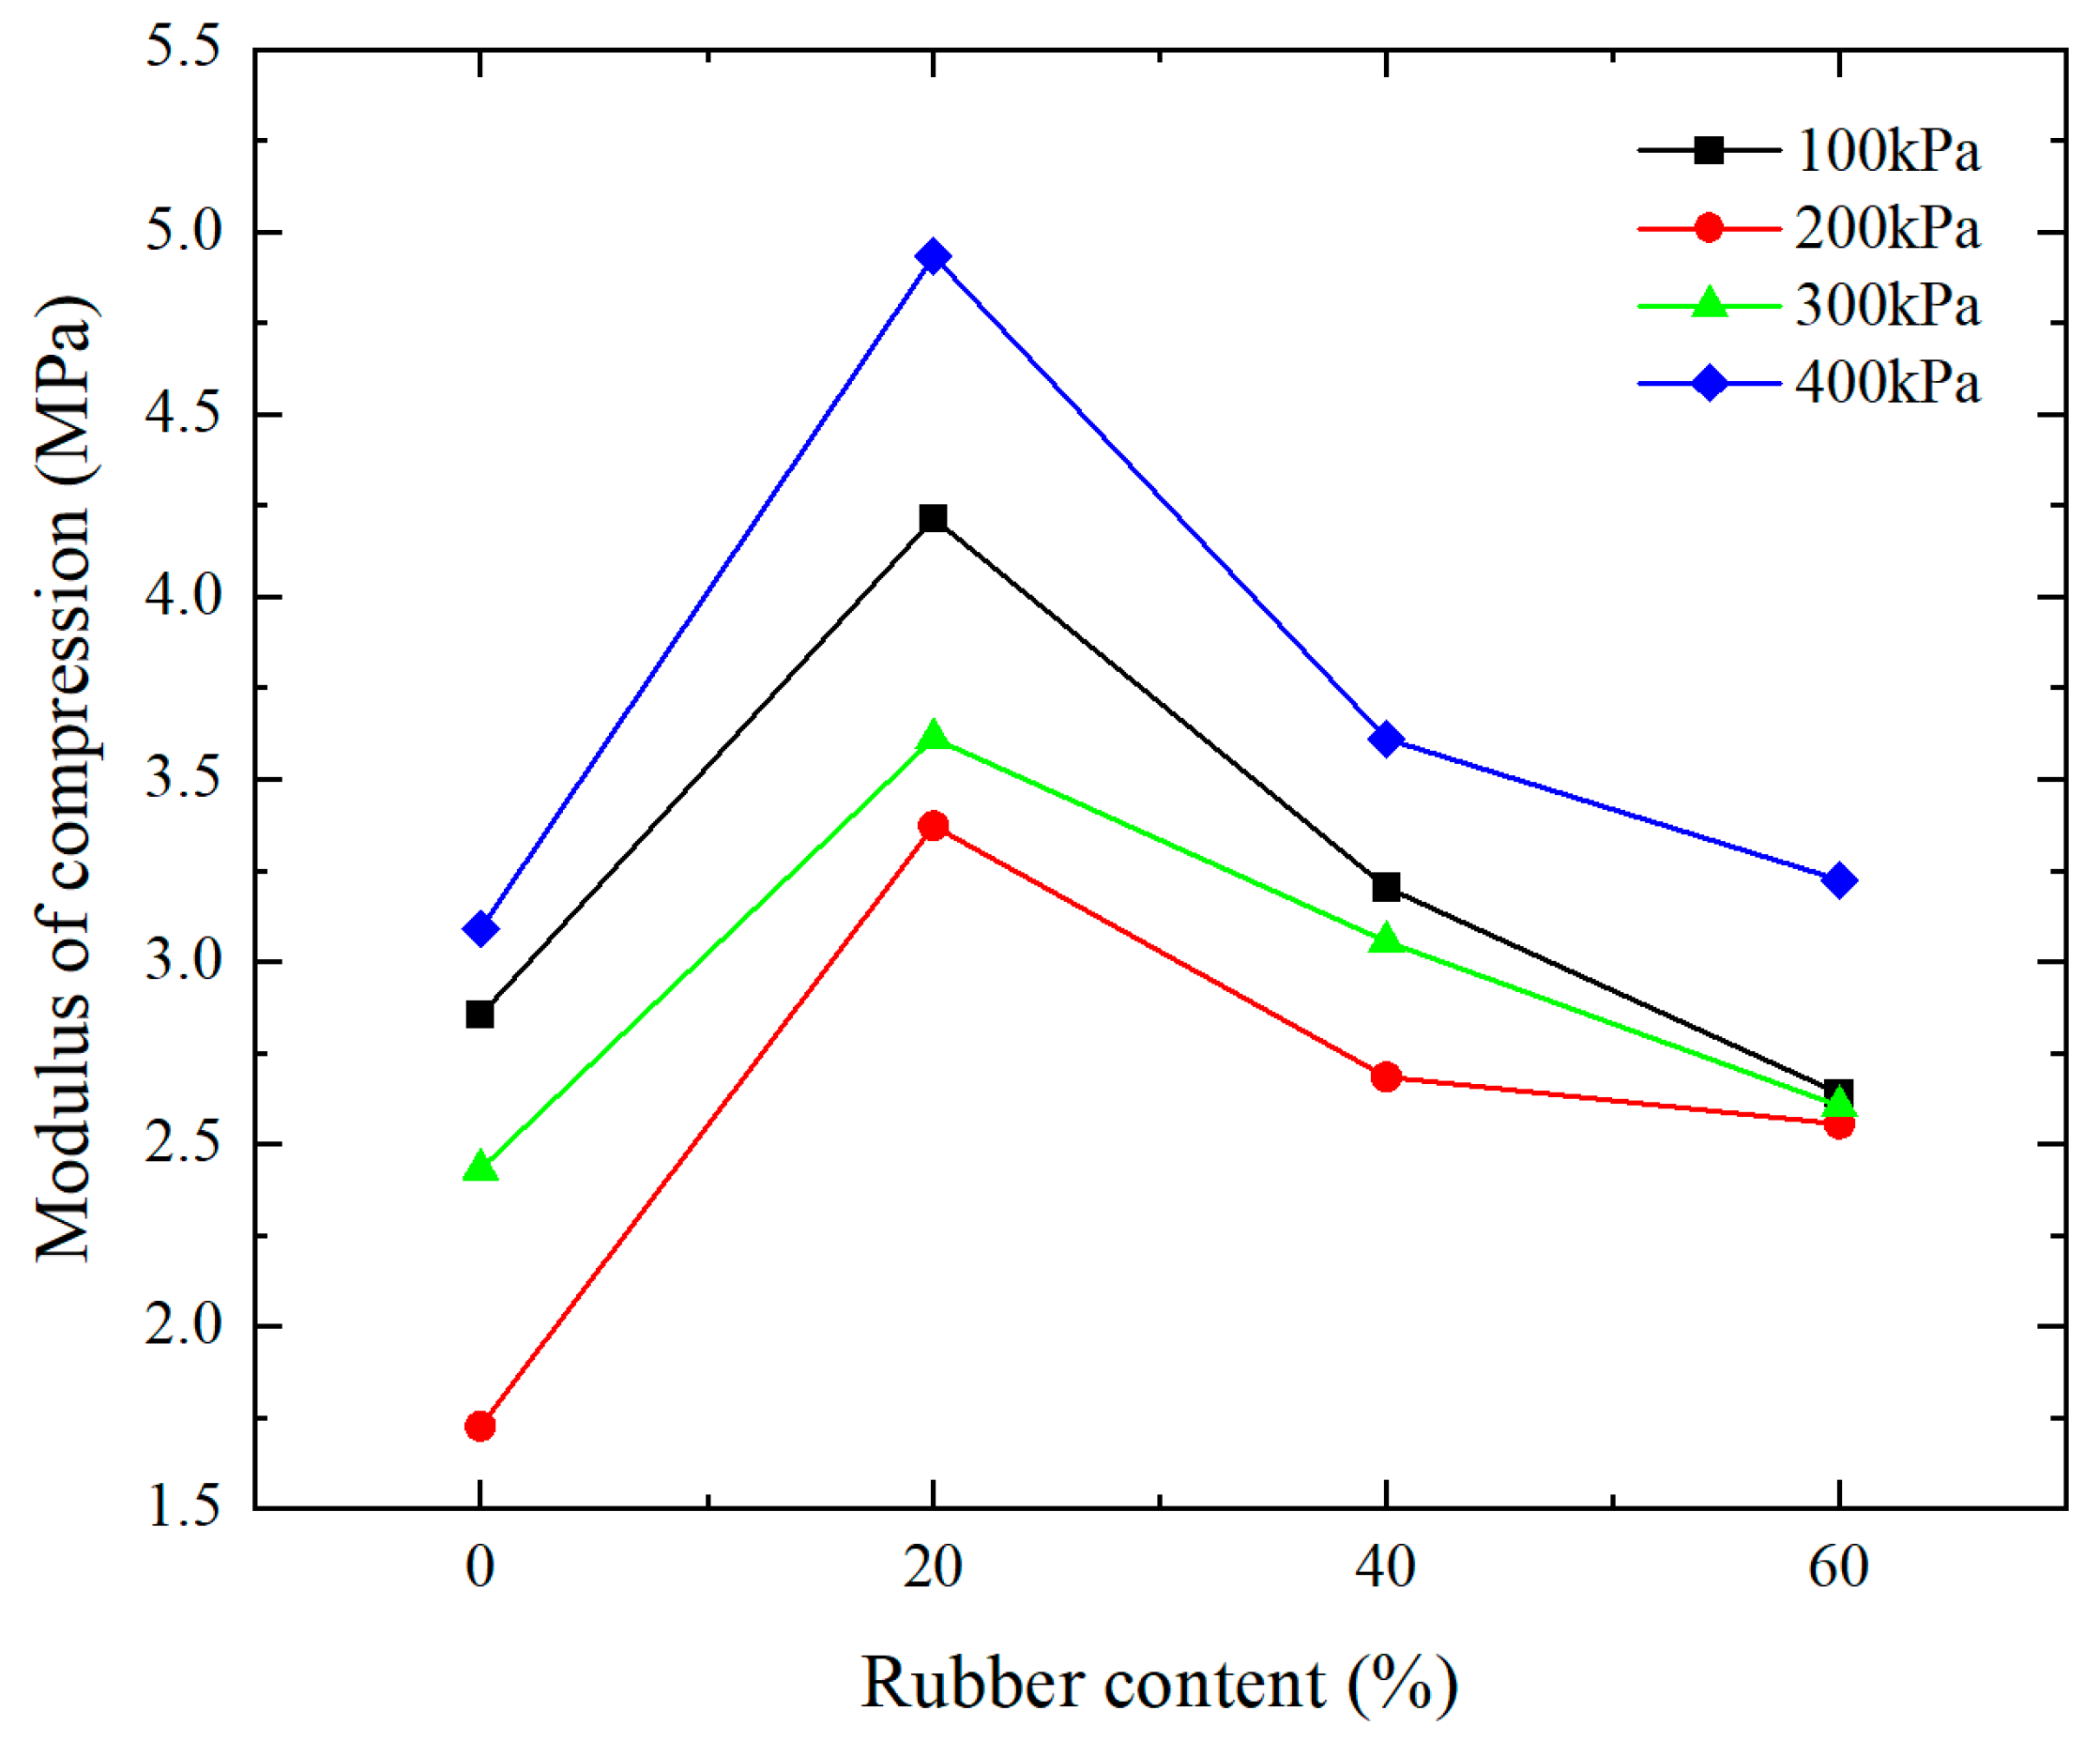
2.2.1. Effect of Rubber Content on Compression Modulus under Different Vertical Loads

Figure 5 shows the variation in the compressive modulus under different vertical loads and rubber contents in a 0.1 mol/L NaCl solution environment. The graph indicates a consistent trend in compressive modulus, where it increases with increasing percentage of rubber particles, regardless of the magnitude of the vertical load. The compressive modulus reaches its maximum value when the rubber particle content reaches 20%. As the rubber particle content further increases, the compressive modulus starts to decrease.
Additionally, the compressive modulus was influenced by different vertical loads. Specifically, at a vertical load of 100 kPa, the compressive modulus was higher but decreased with increasing vertical load. At a vertical load of 200 kPa, the compressive modulus was the lowest, and it gradually increased with the increasing vertical load, reaching its maximum value at a vertical load of 400 kPa. These observations emphasize the importance of considering load conditions when evaluating the behavior and performance of materials, highlighting the influence of vertical load on the compressive modulus.
Figure 6 illustrates the variations in compression modulus regarding rubber content and different vertical loads for various salt solution concentrations. Figure 6a shows the environment without NaCl, Figure 6b shows the environment with 0.5 mol/L NaCl, and Figure 7c shows the environment with 1 mol/L NaCl. The graph reveals that the compression modulus increased within the vertical load range of 300 kPa to 400 kPa. Additionally, at a vertical load of 400 kPa, the compression modulus demonstrated an upward trend with increasing salt solution concentration. Moreover, for a rubber mass content of 40%, the sample’s compression modulus under a vertical load of 200 kPa in the 0 mol/L NaCl solution surpassed that of other vertical load conditions. However, as the salt solution concentration rose, the compression modulus of the B6T4 sample at a vertical load of 200 kPa gradually declined. N. Mahesh Babu et al. [28] found that with an increase of solution concentration, the reduction rate of the compression index increased. In the high-concentration solution, the orientation of bentonite particles was more condensed to prevent settlement, and the compression index reduced. However, when the rubber fiber content reached 15%, the compression index of the sample increased slightly.
These observations indicated that increasing the rubber content to 40% effectively strengthened the sample’s compressive resistance in the absence of solute ions in salt solutions at this particular ratio. Nonetheless, as the salt solution concentration increased, solute ions permeated the internal structure of the sample, creating a disconnection between MX80 bentonite and rubber particles. As a result, the sample’s compressive resistance diminished, leading to a decrease in compression modulus and an increase in compressibility.

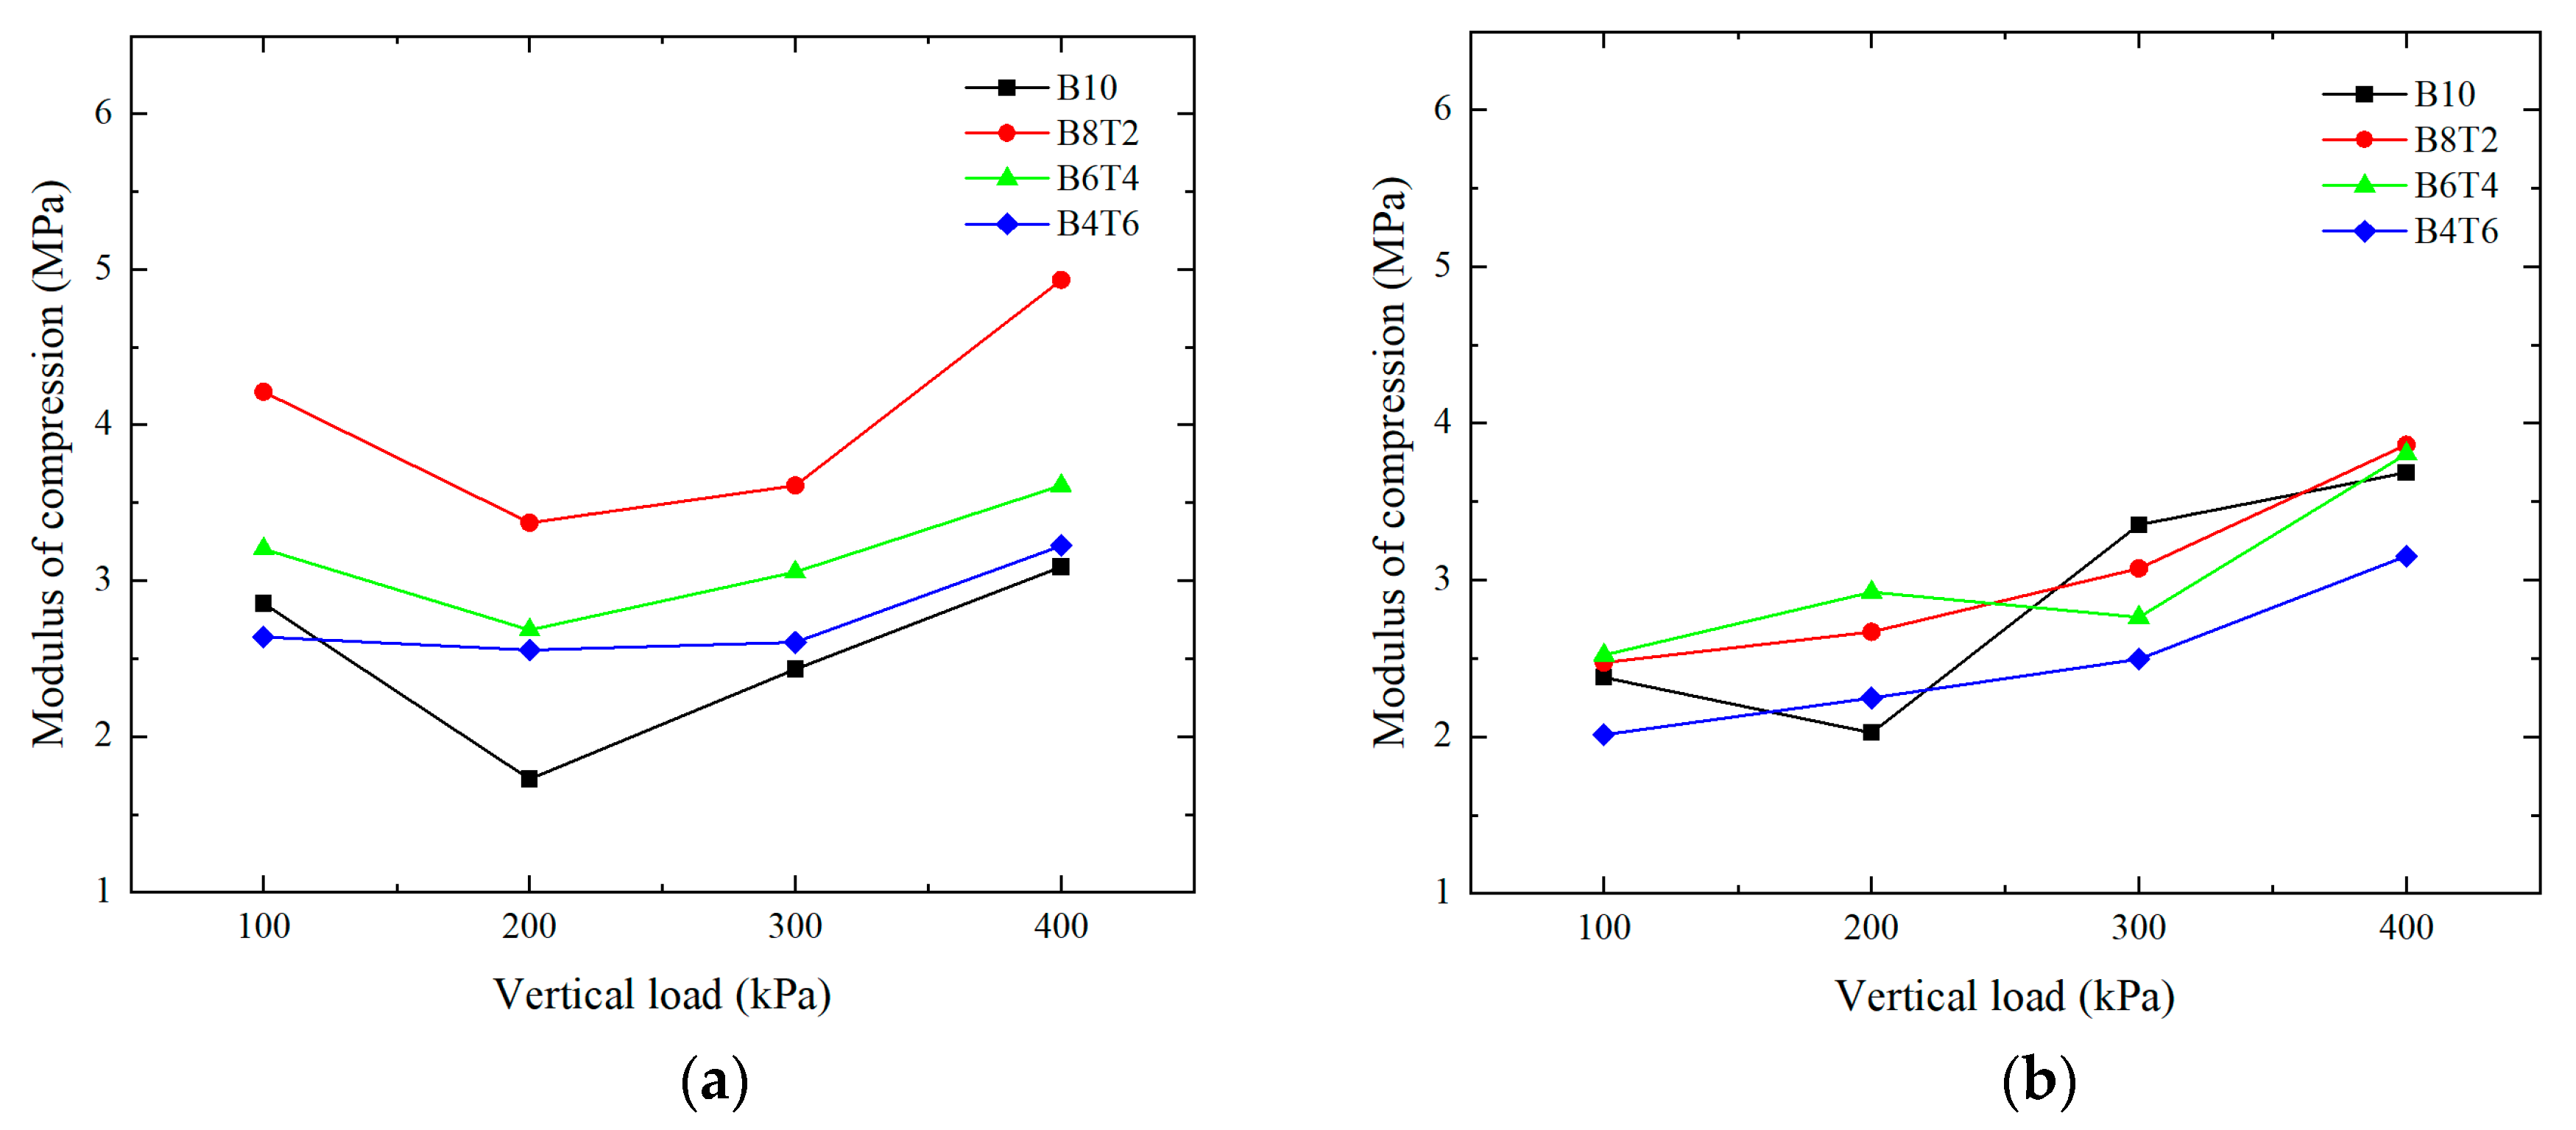
2.2.2. Influence of Different Mass Ratios on Compression Modulus

From Figure 7a, it can be observed that in the external environment of a 0.1 mol/L NaCl solution, except for the B10 sample, the compressive modulus decreased with increasing rubber content under different vertical loads.
Within the load range of 100 kPa to 200 kPa, the compressive modulus of the samples with different mass ratios decreased. Under the action of vertical load, the compressive modulus showed an increasing trend. When the ion concentration in the salt solution increased to 0.5 mol/L, the compressive modulus of samples with different mass ratios gradually increased with the increase in load. These results indicated that under high-concentration solution environments, the compressive modulus of samples with different mass ratios gradually increased with the increase in vertical load. However, compared to the 0.1 mol/L salt solution environment, the compressive modulus in the high-concentration salt solution environment decreased significantly, indicating that high-concentration salt solution environments are not favorable for samples with different mass ratios.
However, among the samples with different mass ratios, it can be clearly seen that at 20% and 40% mass ratios, increasing rubber content effectively alleviated the influence of salt solution ion concentration. This indicates the possibility of improving performance and stability under these conditions.

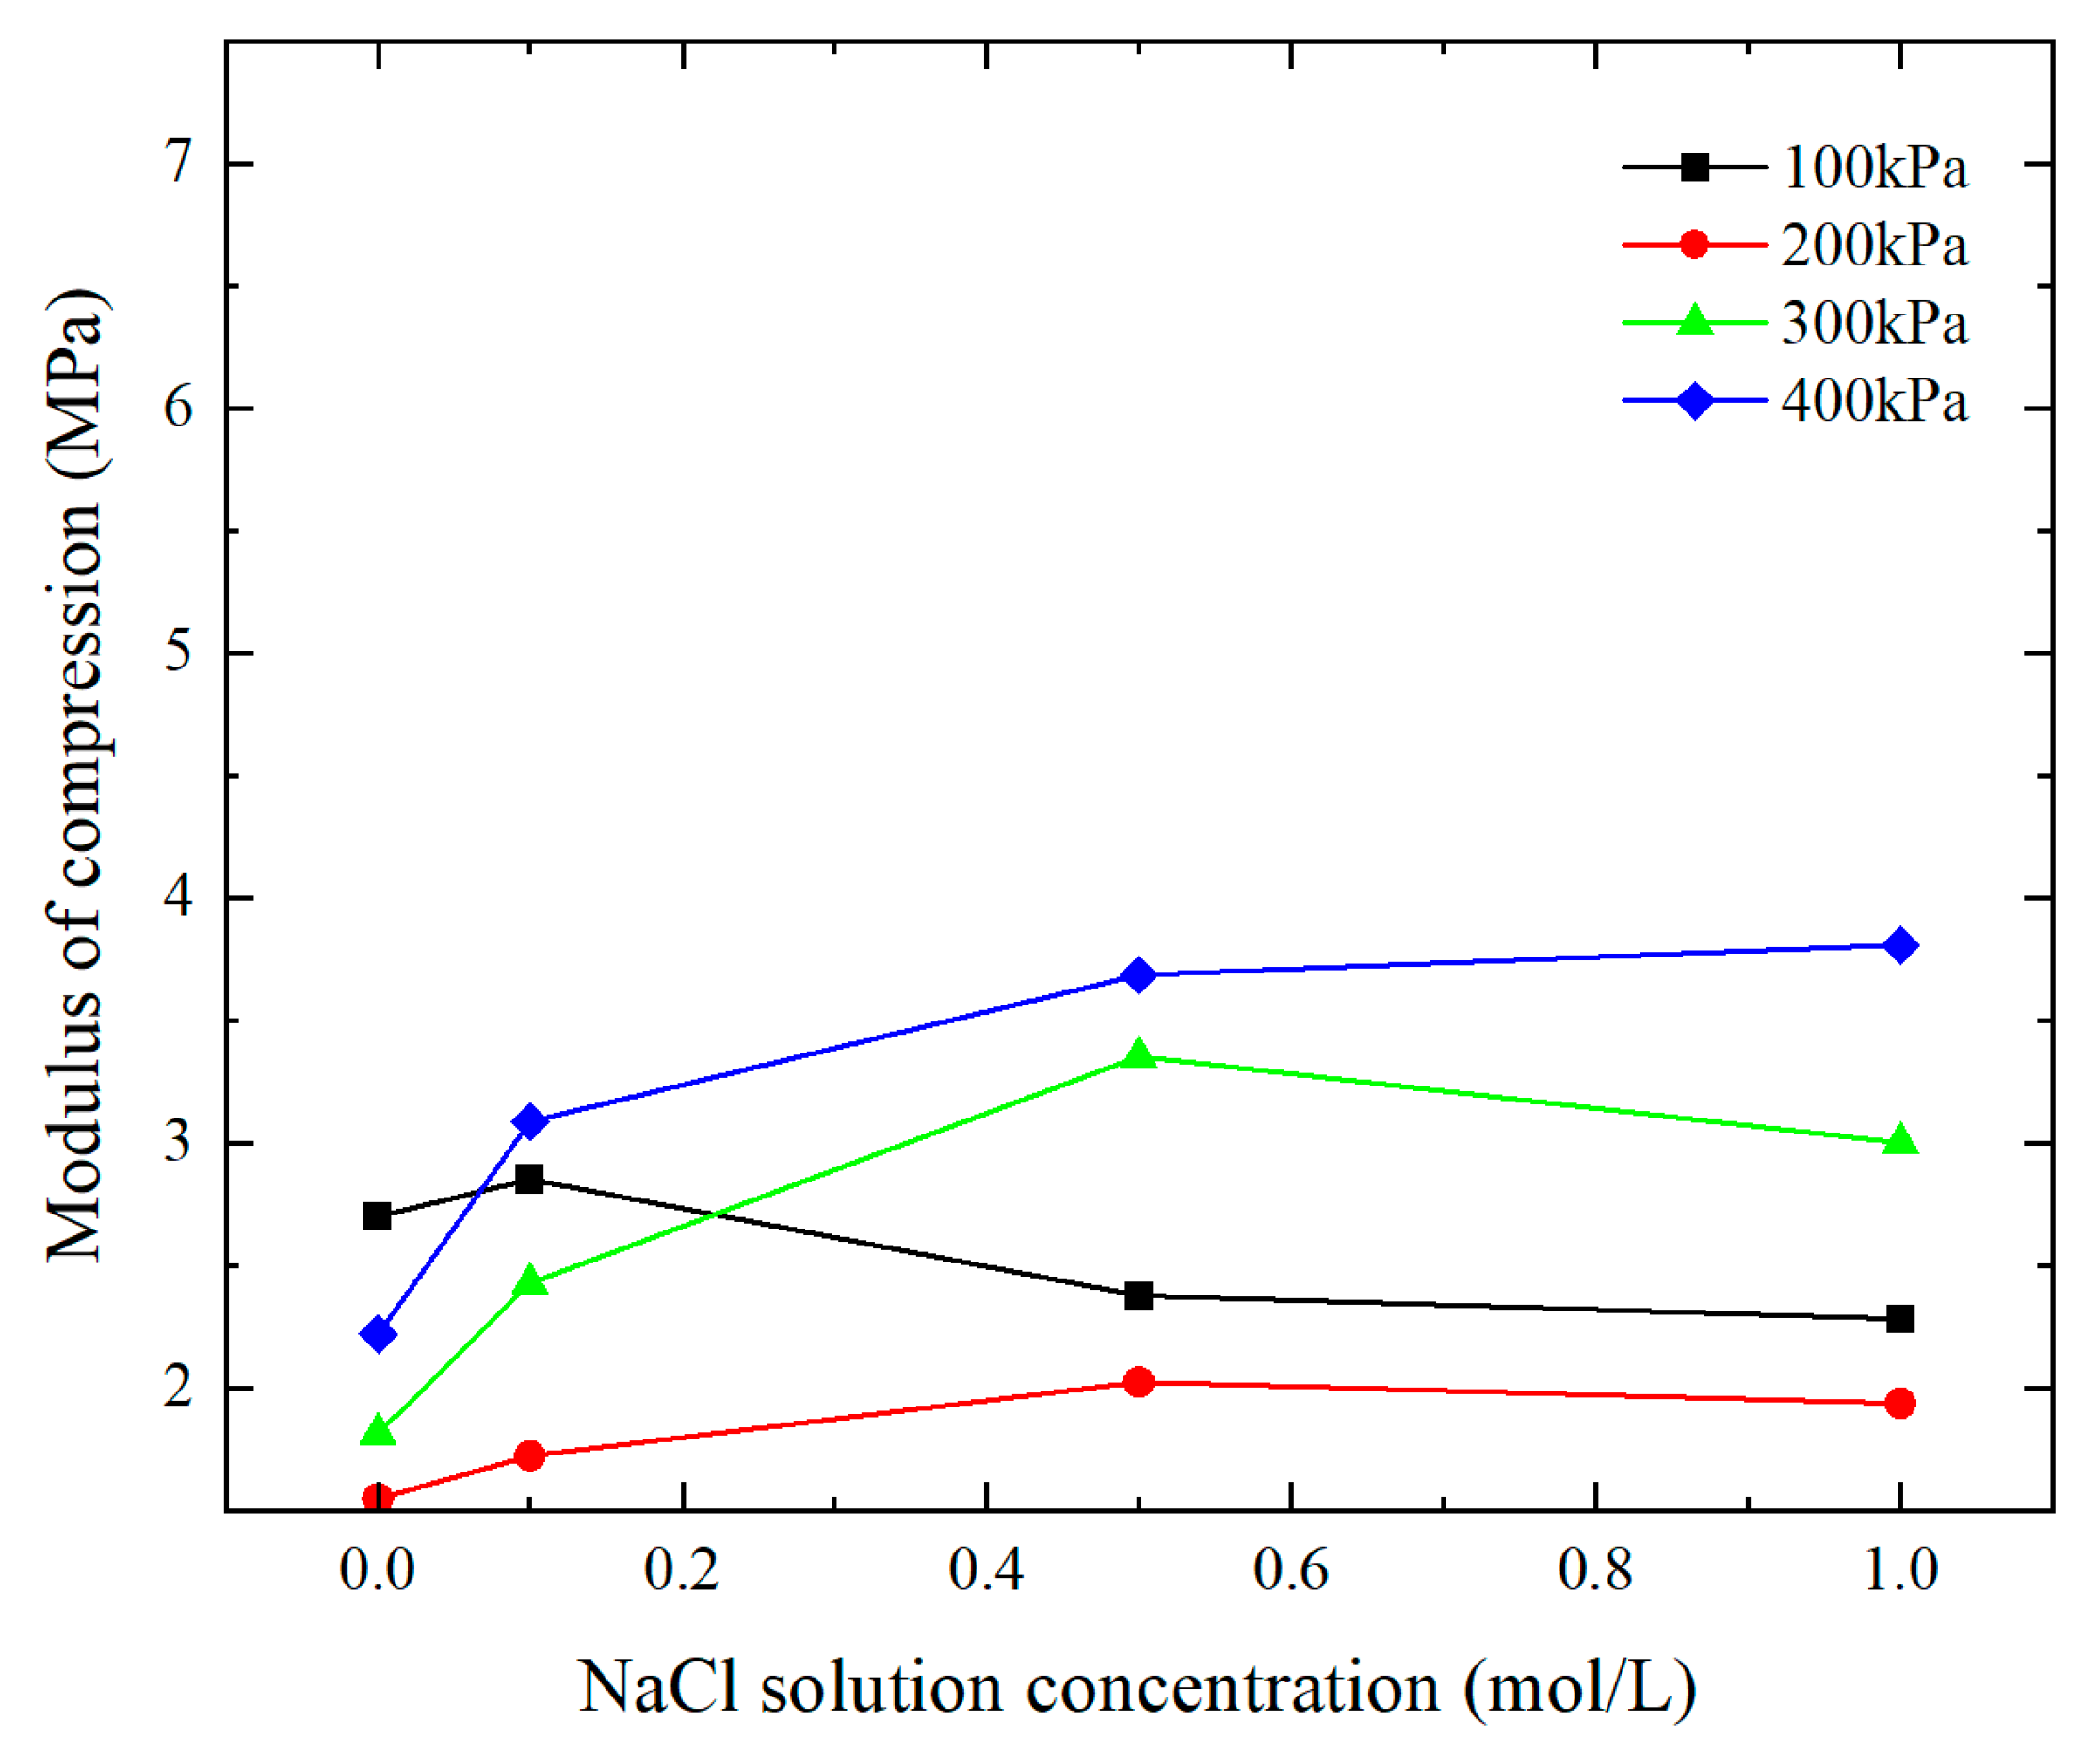
2.2.3. Effect of Salt Solution Concentration on Compression Modulus under Different Vertical Loads

Figure 8 displays the variations in compression modulus for the B6T4 and B4T6 samples under differing salt solution concentrations and vertical loads. In Figure 8a, a similar trend can be observed at vertical loads of 100 kPa and 200 kPa. As the salt solution concentration increased from 0 mol/L to 0.1 mol/L, a significant decrease in compression modulus was observed. However, as the salt solution concentration continued to increase, the compression modulus stabilized. These findings suggest that the B6T4 sample was sensitive to salt solution concentration in the external environment but only when the vertical load did not exceed 200 kPa. As the vertical load increased, the influence of salt solution ion concentration on the B6T4 sample showed no significant changes. Specifically, when the vertical load pressure escalated from 300 kPa to 400 kPa, the compression modulus displayed an increasing trend as compressibility decreased. In Figure 8b, the compression modulus of the B4T6 sample consistently decreases with increasing salt solution concentration under vertical loads of 100 kPa, 200 kPa, and 300 kPa. Moreover, the compression modulus only increases in correspondence with the vertical load increase. These results indicate that the B4T6 sample was more susceptible to the influence of the salt solution ion concentration, and the influence intensified as the vertical load reached 300 kPa, leading to increased internal compaction of the B4T6 sample. Additionally, the compression modulus maintained stability within a certain numerical range under a vertical load of 400 kPa.
Figure 9 illustrates the compression modulus variation in the B10 specimens under differing vertical loads and salt solution concentrations. The figure shows that the compression modulus of the B10 specimens increased with an increase in vertical load. The most significant change occurred between 200 kPa and 300 kPa, while the change from 300 kPa to 400 kPa occurred gradually. This observation indicated that under a vertical load of 300 kPa, the compactness of the B10 specimens improved significantly. The reduction in the pores between the internal montmorillonite particles led to a denser and compacted specimen structure. Additionally, regardless of the vertical load, the compression modulus of B10 specimens increased while the compressibility decreased with an increase in salt solution concentration. This finding suggested that elevated salt solution concentration had a positive impact on the compression modulus of B10 specimens. The slope of the compression modulus exhibited the most significant change for the B10 specimens under a vertical load of 300 kPa when the salt solution concentration increased from 0.1 mol/L to 0.5 mol/L NaCl. With the continuous augmentation of chloride solution ion concentration and increasing vertical load, the compactness within the specimens improved continually. This improvement can be attributed to the rise in solute ions within the pores of the specimens due to the increased salt solution concentration. As the vertical load increased further, the spacing between pores underwent further compression. Consequently, the contact between montmorillonite particles intensified, enhancing the internal compactness and structural integrity of the B10 specimens. Under the combined influence of the chemical and stress fields, the compression modulus increase while compressibility decreased in the B10 specimens.

3. Conclusions

This study analyzed the effects of solute ion concentrations on compression and rebound indices at different consolidation pressures. Rubber reduces the compression coefficient and compressibility of mixed soil, while higher salt concentrations increase the compression coefficient. In low-concentration salt solution environments, rubber enhances the soil’s resistance to compression deformation. The influence of salt solution on the compression index depends on the rubber content, with higher rubber contents demonstrating stronger resistance. Rubber also decreases the liquid and plastic limits, improving soil stability. However, high-concentration salt solutions degrade rubber and increase the limits, affecting the soil’s expansiveness. Recognizing the degradation of rubber in salt solutions is important for considering stability and salt erosion resistance in saline–alkali areas.
The article presented findings from a one-dimensional consolidation test of composite MX80 bentonite/rubber material in a saline solution environment, focusing on its compression characteristics. However, due to testing limitations and other factors, the depth and breadth of the discussion in the article are insufficient. To address these limitations, the authors suggest further research:
  • The effects of temperature and duration on the microstructural evolution mechanism of external cushion particles should be explored to address the release of decay heat from radioactive waste stored in a storage tank.
  • The impact of groundwater on the external cushion, particularly the microstructural evolution of free boundaries, during wetting–drying cycles should be considered. The effects of these cycles on the engineering mechanics properties of the cushion should be investigated to gain a comprehensive understanding of its horizontal and vertical stability.

Author Contributions

Conceptualization, T.W., Y.L. and S.L.; data curation, Z.X.; formal analysis, Z.Z., Z.X. and X.N.; funding acquisition, Y.L.; investigation, X.N.; methodology, Z.X.; project administration, Z.Z. and S.L.; validation, Z.Z. and X.N.; writing—original draft, T.W. and Y.L.; writing—review and editing, T.W., S.L. and X.N. All authors have read and agreed to the published version of the manuscript.

Funding

This work was supported by National Natural Science Foundation of China (No. 52108310) and the Ministry of Housing and Urban Rural Development (No. 2022-K-044).

Institutional Review Board Statement

Not applicable.

Informed Consent Statement

Not applicable.

Data Availability Statement

All data that support the findings of this study are included within the article.

Conflicts of Interest

The authors declare that they have no known competing financial interest or personal relationships that could have appeared to influence the work reported in this paper.

References

  1. Chai, M. Deep Processing and Application of Bentonite. Master’s Thesis, Jilin University, Changchun, China, 2013. [Google Scholar]
  2. Wen, Z.J. Selection and basic properties of buffer materials for deep geological disposal of high-level radioactive wastes in China. J. Petromineral. 2005, 6, 583–586. [Google Scholar]
  3. Zhang, N.; Wang, Z.; Li, Q.; Chen, X. Dynamic response of bridge abutment to sand-rubber mixtures backfill under seismic loading conditions. J. Vibroeng. 2017, 19, 434–446. [Google Scholar] [CrossRef]
  4. Yin, Z.; Sun, H.; Jing, L.; Dong, R. Geotechnical Seismic Isolation System Based on Rubber-Sand Mixtures for Rural Residence Buildings: Shaking Table Test. Materials 2022, 15, 7724. [Google Scholar] [CrossRef]
  5. Calabrese, A.; Serino, G.; Strano, S.; Terzo, M. Experimental investigation of a low-cost elastomeric anti-seismic device using recycled rubber. Meccanica 2015, 50, 2201–2218. [Google Scholar] [CrossRef]
  6. De Luca, A.; Guidi, L.G. Base isolation issues in Italy: Integrated architectural and structural designs. Soil Dyn. Earthq. Eng. 2020, 130, 105912. [Google Scholar] [CrossRef]
  7. Yan, L.; Li, G.; Gou, X.; Zhang, P.; Wang, X.; Jiang, Y. Seismic Performance and Engineering Application Investigation of a New Alternative Retainer. Polymers 2022, 14, 3506. [Google Scholar] [CrossRef]
  8. FE-Analysis of an Isolation Element Made of High Damping Rubber Undergoing Extreme Large Strains and Stresses. Available online: https://www.webofscience.com/wos/alldb/full-record/WOS:000251796000064 (accessed on 9 June 2023).
  9. Cheng, X.; Xu, X.; Jing, L.; Liang, H.; Cui, J. Seismic Behavior of Shear Keys Enhanced with Novel Energy Absorption Devices in Immersion Joints Based on Pseudo-Static Tests. Materials 2022, 15, 4579. [Google Scholar] [CrossRef]
  10. Habieb, A.B.; Milani, G.; Quaglini, V.; Milani, F. Experimentation and numerical modelling of recycled rubber pads for seismic isolation under accelerated ageing. In Proceedings of the Central European Symposium on Thermophysics 2019 (CEST), Banska Bystrica, Slovakia, 16–18 October 2019; p. 420006. [Google Scholar] [CrossRef]
  11. Wang, C.H.; Li, H.J.; Wu, J.F. Base-Isolated Multi-Storey Reinforced Concrete Frame Structure Modal Analysis. Appl. Mech. Mater. 2012, 204–208, 869–871. [Google Scholar] [CrossRef]
  12. Polukoshko, S.; Martinovs, A.; Gonca, V. Specifics of behavior and calculation of elastomeric shock absorber under impact loading. In Proceedings of the 17th International Scientific Conference Engineering for Rural Development, Jelgava, Latvia, 23–25 May 2018. [Google Scholar] [CrossRef]
  13. Pan, P.; Shen, S.; Shen, Z.; Gong, R. Experimental investigation on the effectiveness of laminated rubber bearings to isolate metro generated vibration. Measurement 2018, 122, 554–562. [Google Scholar] [CrossRef]
  14. Wang, L.; Oua, J.; Liu, W.; Wang, S. Full-scale tests and analytical model of the Teflon-based lead rubber isolation bearings. Struct. Eng. Mech. 2013, 48, 809–822. [Google Scholar] [CrossRef]
  15. Oh, J.; Kim, J.H. Prediction of long-term creep deflection of seismic isolation bearings. J. Vibroeng. 2017, 19, 355–362. [Google Scholar] [CrossRef] [Green Version]
  16. Kashif, N.; Albijanic, B.; Xu, J.J.; Syahida, S.; McGrath, T.; Tadesse, B.; Nazir, M.K. Grinding of highly viscous bentonite containing slurries. Appl. Clay Sci. 2023, 232, 106794. [Google Scholar] [CrossRef]
  17. Zeng, Z.; Cui, Y.-J.; Talandier, J. Compaction and sealing properties of bentonite/claystone mixture: Impacts of bentonite fraction, water content and dry density. Eng. Geol. 2021, 287, 106122. [Google Scholar] [CrossRef]
  18. Liu, Y.-M.; Xu, G.-Q.; Liu, S.-F.; Chen, Z.-R. Study on Compaction Expansion Characteristics of buffer/Backfill Materials in Chinese high-level waste disposal Repository. Uranium Geol. 2001, 1, 44–47. [Google Scholar]
  19. Zhang, J.-R.; Xu, S.-X. Study on compaction characteristics of lime and fly ash stabilized expansive soil subgrade. J. Wuhan Univ. Technol. 2002, 9, 27–30. [Google Scholar]
  20. Cheng, Y.; Shi, M.-L. Study on bimodal characteristics of compaction curve of Lime-modified expansive soil. Rock Soil Mech. 2011, 32, 979–983. [Google Scholar] [CrossRef]
  21. Wang, Q.; Meng, Y.; Wei, S.; Weimin, Y.; Chen, Y. Cracking and sealing behavior of the compacted bentonite upon technological voids filling. Eng. Geol. 2021, 292, 106244. [Google Scholar] [CrossRef]
  22. Chen, Z.-G.; Tang, C.-S.; Zhu, C.; Shi, B.; Liu, Y.-M. Compression, swelling and rebound behavior of GMZ bentonite/additive mixture under coupled hydro-mechanical condition. Eng. Geol. 2017, 221, 50–60. [Google Scholar] [CrossRef]
  23. Ye, W.; Zhang, Y.; Chen, B.; Zheng, Z.; Chen, Y.; Cui, Y. Investigation on compression behaviour of highly compacted GMZ01 bentonite with suction and temperature control. Nucl. Eng. Des. 2012, 252, 11–18. [Google Scholar] [CrossRef]
  24. Ito, H. Compaction properties of granular bentonites. Appl. Clay Sci. 2006, 31, 47–55. [Google Scholar] [CrossRef]
  25. Ye, W.-M.; Qian, L.-X.; Chen, B.; Yu, C. Microstructure of Gaomiaozi bentonite under high pressure. J. Tongji Univ. (Nat. Sci.) 2009, 37, 31–35. [Google Scholar]
  26. Qin, P.-J.; Ye, W.-M.; Chen, Y.-G.; Chen, B.; Cui, Y.-J. Influence of strain-rate on hydromechanical behavior of highly compacted GMZ01 bentonite. Eng. Geol. 2015, 195, 85–92. [Google Scholar] [CrossRef]
  27. Cokca, E.; Yilmaz, Z. Use of rubber and bentonite added fly ash as a liner material. Waste Manag. 2004, 24, 153–164. [Google Scholar] [CrossRef] [PubMed]
  28. Babu, N.M.; Mishra, A.K. Effect of salt permeants on the consolidation and hydraulic behaviour of fibre treated black cotton soil for landfill application. J. Clean. Prod. 2022, 369, 133339. [Google Scholar] [CrossRef]
  29. Effect of Inorganic Salt Solutions on Some Geotechnical Properties of Soil-Bentonite Mixtures as Barriers. Available online: https://www.webofscience.com/wos/alldb/full-record/WOS:000292123400004 (accessed on 4 June 2023).
  30. Mishra, A.K.; Ohtsubo, M.; Li, L.; Higashi, T. Controlling factors of the swelling of various bentonites and their correlations with the hydraulic conductivity of soil-bentonite mixtures. Appl. Clay Sci. 2011, 52, 78–84. [Google Scholar] [CrossRef]
  31. Standard for Geotechnical Test Methods. Available online: https://kns.cnki.net/kcms2/article/abstract?v=kxaUMs6x7-5KB1kF296ShrYo_9ZoYIWW4VfT4bfQP25xUu13oQ_hU6dQu3ie_tjMWuo5koMwfcWzLFYwXn6UEg%3d%3d&uniplatform=NZKPT (accessed on 4 June 2023).
  32. Bekhiti, M.; Trouzine, H.; Rabehi, M. Influence of waste tire rubber fibers on swelling behavior, unconfined compressive strength and ductility of cement stabilized bentonite clay soil. Constr. Build. Mater. 2019, 208, 304–313. [Google Scholar] [CrossRef]
Figure 1. Consolidation apparatus.
Applsci 13 08134 g001
Figure 2. Relationship between compression coefficient and vertical load for different samples in 0 mol/L NaCl (a), 0.1 mol/L NaCl (b), 0.5 mol/L NaCl (c), and 1 mol/L NaCl (d) solutions.
Applsci 13 08134 g002
Figure 3. Relationship between compression coefficient and vertical load of B10 (a), B8T2 (b), B6T4 (c), and B4T6 (d) samples under different NaCl solutions.
Applsci 13 08134 g003aApplsci 13 08134 g003b
Figure 4. Relationship between NaCl solution concentration and vertical load for B10 (a), B8T2 (b), B6T4 (c), and B4T6 (d) samples under different vertical loads.
Applsci 13 08134 g004
Figure 5. The variation in compression modulus with rubber content and under different vertical loads in a 0.1 mol/L NaCl solution.
Applsci 13 08134 g005
Figure 6. Relationship between rubber content and compression modulus under different vertical loads: 0 mol/LNaCl solution (a), 0.5 mol/LNaCl solution (b), and 1 mol/LNaCl solution (c).
Applsci 13 08134 g006
Figure 7. Relationship between vertical load and compression modulus for 0 mol/LNaCl solution (a) and 0.5 mol/LnaCl solution (b) for different samples.
Applsci 13 08134 g007
Figure 8. Relationship between different NaCl solution concentrations and compression modulus under different vertical loads: B6T4 (a) and B4T6 (b) samples.
Applsci 13 08134 g008
Figure 9. Effect of salt solution concentration on compression modulus of B10 sample under different vertical loads.
Applsci 13 08134 g009
Table 1. Consolidation test conditions.
Influencing FactorWorking Condition
Salt solution concentration0 mol, 0.1 mol, 0.5 mol, 1 mol
Rubber content (mass ratio)0%, 20%, 40%, 60%
Consolidation pressure100 kPa, 200 kPa, 300 kPa, 400 kPa
Total number of samples64 groups
Table 2. Sample compression coefficient.
Rubber
Content
Solution Concentration/Vertical Load100200300400Mean
Value
Standard
Deviation
Variance
000.8577241.4952221.2749961.0431781.1680.2770.077
0.10.8124941.3428730.9535520.7504290.9650.2660.071
0.50.9744661.1444290.6911910.6288690.8600.2420.059
11.0144641.1948140.7721190.6086790.8980.2590.067
20%00.3420220.7200470.7155470.5985390.5940.1770.031
0.10.42540.53170.49630.36340.4540.0750.006
0.50.72460.67160.58320.46390.6110.1140.013
10.31940.62120.56360.41260.4790.1380.019
40%00.2360.25810.46090.42770.3460.1150.013
0.10.45920.54810.48150.40740.4740.0580.003
0.50.58340.50330.53240.38650.5010.0830.007
10.53980.51430.55450.40120.5020.0700.005
60%00.42680.45460.4020.38350.4170.0310.001
0.10.4770.49270.48330.39040.4610.0470.002
0.50.6250.560.50440.39910.5220.0960.009
10.75820.50960.550.38210.5500.1560.024
Table 3. Sample compression modulus results.
Rubber
Content
Solution Concentration/Vertical Load100200300400Mean
Value
Standard
Deviation
Variance
002.7027031.5503881.8181822.2222222.0730.5020.252
0.12.8531581.726282.4310943.0891322.5250.5980.358
0.52.3789172.0256163.3538843.6862592.8610.7860.618
12.2851221.9401973.0023533.8085332.7590.8280.685
20%05.2414182.4896742.5053322.9950963.3081.3101.717
0.14.2141093.3716043.6120934.9330814.0330.6970.486
0.52.474032.669273.0738713.8643713.0200.6160.379
15.6126542.8858373.180774.3448424.0061.2431.544
40%06.2340885.7002893.1921133.4398994.6421.5492.401
0.13.203932.6842633.0555453.6113033.1390.3830.147
0.52.5218462.9231962.763423.8065843.0040.5600.314
12.7255372.8606742.6532823.667112.9770.4680.219
60%02.9490312.768693.1309613.2819983.0330.2220.050
0.12.6386722.554592.6042763.2239922.7550.3140.099
0.52.0138342.2475832.4953343.1537122.4780.4920.242
11.6600452.4698712.2884483.2940242.4280.6740.454
Disclaimer/Publisher’s Note: The statements, opinions and data contained in all publications are solely those of the individual author(s) and contributor(s) and not of MDPI and/or the editor(s). MDPI and/or the editor(s) disclaim responsibility for any injury to people or property resulting from any ideas, methods, instructions or products referred to in the content.

