1. Introduction
A signal is defined as periodic when the same sequence of values re-occurs after a fixed amount of time, defined as a period, whose inverse is the frequency. By Fourier’s principles, a real-world signal can be described as a sum of sinusoids (or “pure tones”) that only carry one frequency [
1]. The fundamental frequency, or F0, is defined as the lowest frequency describing a periodic component of a signal. In the audio domain, F0 is defined as the pitch, which in music is translated to a specific note.
Detecting the F0 of a signal is a crucial application in many fields, with audio, music, and speech processing being heavily reliant on pitch-detection-based technologies, as well as other fields such as fault detection of moving parts, which are related to their resonance frequency [
2], or sonar systems for target detection, classification and localization [
3]. Moreover, pitch detection can also be employed in the characterization of accurate sinusoidal voltages, as described by Krajewski et al. [
4].
The problem of pitch detection is crucial in all the applications that rely on knowing the fundamental frequency in order to perform periodicity-related computations, such as acoustic feature extraction relying on prosodic metrics such as HNR, jitter or shimmer that evaluate “cycle-to-cycle” variations [
5]. Moreover, professional audio relies on pitch detection to build tuners for real instruments, or for real-time pitch re-adjusting applications especially directed toward vocal tuning. Real-time detectors are thus necessary to enable performers to monitor pitch accuracy and trigger events in real time, especially related to MIDI applications [
6]. Additionally, fast, real-time pitch detection is valuable in interactive audio applications, such as games and virtual reality, where it enables dynamic audio synthesis and effects as well as responsive processing.
The two main characteristics of pitch detection algorithms are speed and accuracy, which often imply a trade-off depending on the specific application—for example, posterior analyses do not need real-time F0 estimation, as opposed to live music [
6].
With the diffusion of technologies such as “Autotune” for real-time pitch correction in singers [
7], and with the widespread use of MIDI instruments and/or live MIDI transformers to digitalize acoustic instruments, real-time pitch detection sees a crucial application in the music industry. Especially for MIDI purposes where a sound needs to be translated into a discrete note, speed is favored over accuracy due to the need for low-latency live solutions, and thanks to the fact that the detected frequency is discretized into a note of the tempered system allowing for a certain range for errors. The problem of detecting the fundamental frequency in real time is crucial whenever live performances are involved, as even minuscule latencies of a few milliseconds can be perceived by the musician or operator.
In speech analysis, F0 carries a crucial role as a biometric feature for characterizing voice impairment, up to singlehandedly being used for pre-diagnostic purposes, where F0-related features and their variations are used for the detection of respiratory [
8], phonatory [
9,
10] or neurodegenerative diseases [
11,
12,
13].
Given the multifaceted applications and different industry needs, the state of the art of pitch detection depends on the application.
From the mathematical point of view, although an ever-growing plethora of algorithms are being developed, the vast majority can be generally categorized into three approaches: time-based, frequency or Cepstrum-based, full heuristic. Time domain approaches are generally based on the mathematical principles behind autocorrelation, which inherently has peaks every time a signal repeats (maximum correlation with itself): the problem of pitch detection is thus translated into the problem of finding the maximum of the autocorrelation function. Frequency domain algorithms are based on Fourier domain or cepstral analysis, with the Harmonic Product Spectrum (HPS) [
14] as a notable example: it computes the product of the power spectra of a signal and its downsampled versions to emphasize harmonic components. The fundamental frequency is then estimated by identifying peaks in the resulting spectrum. In recent years, the research trend was predominantly based on Deep Learning methods based on Convolutional Neural Networks (CNN) [
15], which offer the advantages of being able to control the size of the computational net and also to specifically train on suitable data, since the problem of pitch detection is data-dependent [
16]. However, CNN-based methods are not easily generalizable, and require data and especially time for training time before they are usable in their “inference” form—which usually brings high accuracies but slightly less optimal speed [
17].
The prior definition of the latency/complexity of a pitch detection algorithm is hard to determine, since each algorithm and performance inherently depends on the acoustic and digital nature of the data—such as the number of bits for quantization.
Theoretically, HPS-based methodologies yield a complexity of O(NlogN), and straightforward autocorrelation is at O(N2), whereas FFT-based autocorrelation is O(NlogN) yet again, being comparable to HPS. The Fast Fourier Transform (FFT) algorithm is used to speed up the computation of autocorrelation. By leveraging the symmetry properties in the autocorrelation function, the complexity of FFT-based autocorrelation is reduced. The process involves padding the input signal to the nearest power of 2, computing the FFT of the padded signal, squaring the magnitude of each frequency bin to obtain the power spectrum, computing the inverse FFT of the power spectrum and normalizing the result by dividing it by the length of the input signal.
After a rough estimate of F0, many algorithms have to rely on some corrective heuristics to fine-tune the result and/or avoid octave errors. Common signal processing solutions may be employed for this purpose as well, with notable results such as the work by Khadem-hosseini et al. [
18] employing HPS and Euclidean summation. However, although this results in improved accuracy, it is an inherently computationally expensive mean, and real-time pitch detectors might choose to avoid relying on correctors—this is also the approach that we chose in the present paper.
Due to the inherent harmonic nature of most real-world sound signals, especially when dealing with speech or music analysis, octave errors are a common criticality among pitch detection algorithms, being triggered by the eventual presence of strong first- or second-order harmonics and, partially, by aliasing.
Two of the most widely used algorithms, SWIPE [
19] and YIN [
20], which will be detailed later in
Section 2, are based on autocorrelation. More algorithms are listed in the works by Camacho and Harris [
19] and Ruslan et al. [
1].
Attempts at fast pitch detectors are based on the simplification of the transformation procedures, such as the work by Grinewitschus et al. [
21], which leverages the constant-Q Gabor transform for a threshold-based approach within a four-dimensional logarithmic harmonic spectrum shift. A work by Mnasri et al. [
22] aims to avoid short-time analysis and thus the underlying approximations about local stationarity by employing the Hilbert transform to derive “instantaneous” frequency components to contour F0: the performances might be comparable to YIN or SWIPE, but no indication on speed is given.
In general, the problem of real-time, high-speed pitch detection has to be faced with the development of a computationally light algorithm that still retains a relative error suitable for the required application (mainly professional audio and live performances).
The scope of this paper is to propose a novel, high-speed implementation of a pitch detection algorithm based on a modified version of the autocorrelation, and to assess the performances of the most highly regarded algorithms in terms of speed and accuracy, on a suitable dataset purposefully built as a test bench.
For the purposes of testing pitch detection algorithms on sheer speed or recognition capabilities, a custom dataset named SYNTHPITCH was built by producing synthetic signals so that the original pitch/F0 is objective and priorly known.
Other algorithms such as YAAPT [
23], SHRP [
24] or the CREPE [
25] CNN approach have been experimented with, but their preliminary results were not notable with respect to the others considered, especially for the speed vs. accuracy tradeoff. With speed being the main characteristic to search for, non-notable algorithms that provide high accuracies but poor speed have not been included in the present assessment although experimentations were made on them in order to rule them out, and synthetic signals are employed to evaluate the sheer computational complexity, while not forgoing the ability to infer pitch.
The main contributions of this paper lie in the presentation of a novel pitch detection algorithm, based on a partially unexplored approach focused on high-speed and low bit depth, very suitable for hardware implementations. All of these characteristics make it a good candidate for live performance applications or MIDI instruments, which rely on real-time note detection. The mathematical and signal processing theories behind our novel algorithm explore the characteristics of the autocorrelation function, its maximization and its approximations, as well as the effect of quantization on the fundamental frequency of a signal.
Along with the new algorithm, a testing paradigm for evaluating the speed and computational complexity of pitch detection algorithms is proposed, and a custom, synthetic dataset is produced and made available to the public. State-of-the-art, pre-existing pitch detection algorithms, especially those focusing on speed, are thoroughly explored and tested. The article is organized as follows.
Section 2 presents the OneBitPitch algorithm along with its mathematical discussion, theoretical derivation and implementation, as well as three other algorithms (YIN, NLS, SWIPE) used for comparison and the custom SYNTHPITCH dataset produced and used in this paper.
Section 3 presents the numerical results obtained from the simulations, as well as a statistical analysis. Then,
Section 4 provides an in-depth discussion of the obtained results, especially focusing on real-time implementation and runtime speed, which are the main focuses of the analyses. The strengths and weaknesses of every algorithm are analyzed along with practical situations where each algorithm is best suited. Limitations and future works, especially regarding hardware solutions, are presented at the end of the Discussion and before the Conclusions.
2. Materials and Methods
This paper proposes a novel pitch detection algorithm called OneBitPitch, in short, OBP, based on a modified autocorrelation function applied to a one-bit version of the original signal, for maximum speed and hardware implementation capabilities. In order to evaluate the performance of the OneBitPitch algorithm, a custom synthetic dataset (SYNTHPITCH) was built and 4 different algorithms were compared on it.
The choice of the algorithms was based on well-known, state-of-the-art pitch estimators especially directed toward high speed or high accuracy. The main focus is the sheer algorithmic performance, although it is well known that the effectiveness of any pitch detection model is inherently dependent on the dataset and purpose (i.e., pure signals, voice data, etc.).
This section first presents the public dataset built for the purpose of this study, then details the OBP algorithm along with its mathematical basis and briefly presents the three algorithms used for comparison: YIN, SWIPE and NLS.
2.1. SYNTHPITCH Dataset
The SYNTHPITCH dataset was purposefully built for the scope of the analyses presented in this work, i.e., for testing pitch detection algorithms on arbitrarily complex signals in terms of fundamental frequency intelligibility, and to evaluate their computational complexity/speed.
All signals were sampled at 96 ksps and represented in floating points. A typical audio setup was reproduced, so a 20 kHz low-pass filter was applied. Twelve different categories are present, with each one encompassing 99 signals with increasing fundamental frequency, starting from 100 Hz up to 5000 Hz with a 50 Hz step size.
The categories were built with increasing pitch complexity, the simplest one being pure sine waves, to which multiple artifacts have been applied to generate sounds of increasing complexity. There are also two categories encompassing square waves; the amplitude of each starting wave is normalized to have a peak of 1.
Table 1 details the characteristics of each category and its name, as well as the number of artifacts applied, with the following macroscopic characteristics:
Harmonics: Addition of a number of harmonic frequencies, i.e., integer multiples of F0. The amplitude of each harmonic is a random number between 0 and 1, sampled from the Gaussian distribution, and eventually re-scaled if more/less amplitude is needed;
Partials: Addition of non-integer, random multiples of F0, with random starting amplitude linearly scaled according to the order, and random phase. The following formula explains the construction of an i-th order partial, with
,
and
being random amplitude (scaled according to the order), random frequency obtained by multiplying F0 by a random number between 0 and 1 (scaled according to the order) and random phase. All random quantities are obtained by sampling a Gaussian distribution with max = 1, and the formula is as follows:
White Gaussian Noise: Addition of white Gaussian noise of a given SNR, after measuring the power of the signal with added harmonics/partials;
Reverb: Addition of a reverberated copy of the signal with amplitude equal to 0.1 of the measured amplitude of the starting signal.
Figure 1 details some examples of signals found on the SYNTHPITCH dataset; notice how, with complex/dirty signals such as those present in the “full1” category, pitch and sinusoidal behavior become very hard to infer. The dataset is free to use for the public.
2.2. OneBitPitch Algorithm
The algorithm proposed in this paper is aimed at ultra-fast pitch detection, for real-time usage, and was developed as a starting point for future hardware implementation and for heavy-duty, latency-free live use.
With these premises, our proposed algorithm aims to reduce the computational complexity to its bare minimum, sacrificing accuracy while still staying in acceptable territories, to provide the highest possible speed performances.
The OneBitPitch (OBP for short) algorithm exploits a modified version of the autocorrelation in time approach highly optimized for execution time and computational complexity.
The basic idea is that reducing the resolution of a signal, i.e., the number of quantization bits, worsens the signal but retains its periodicity. Taking this idea to its limit, we can state the following:
Proposition 1. Let x be a digital signal modeled as a zero-average periodic sequence quantized with N bits and with F0 being its fundamental frequency. Re-quantizing x with M < N bits, the original F0 is preserved in the re-quantized signal.
This can be easily proven by considering that, for a periodic signal in which F0 is the reciprocal of a period T0, the time duration of such a period does not change with truncation (re-quantization), although the exact timeframe can be anticipated/delayed according to rounding conventions [
26,
27,
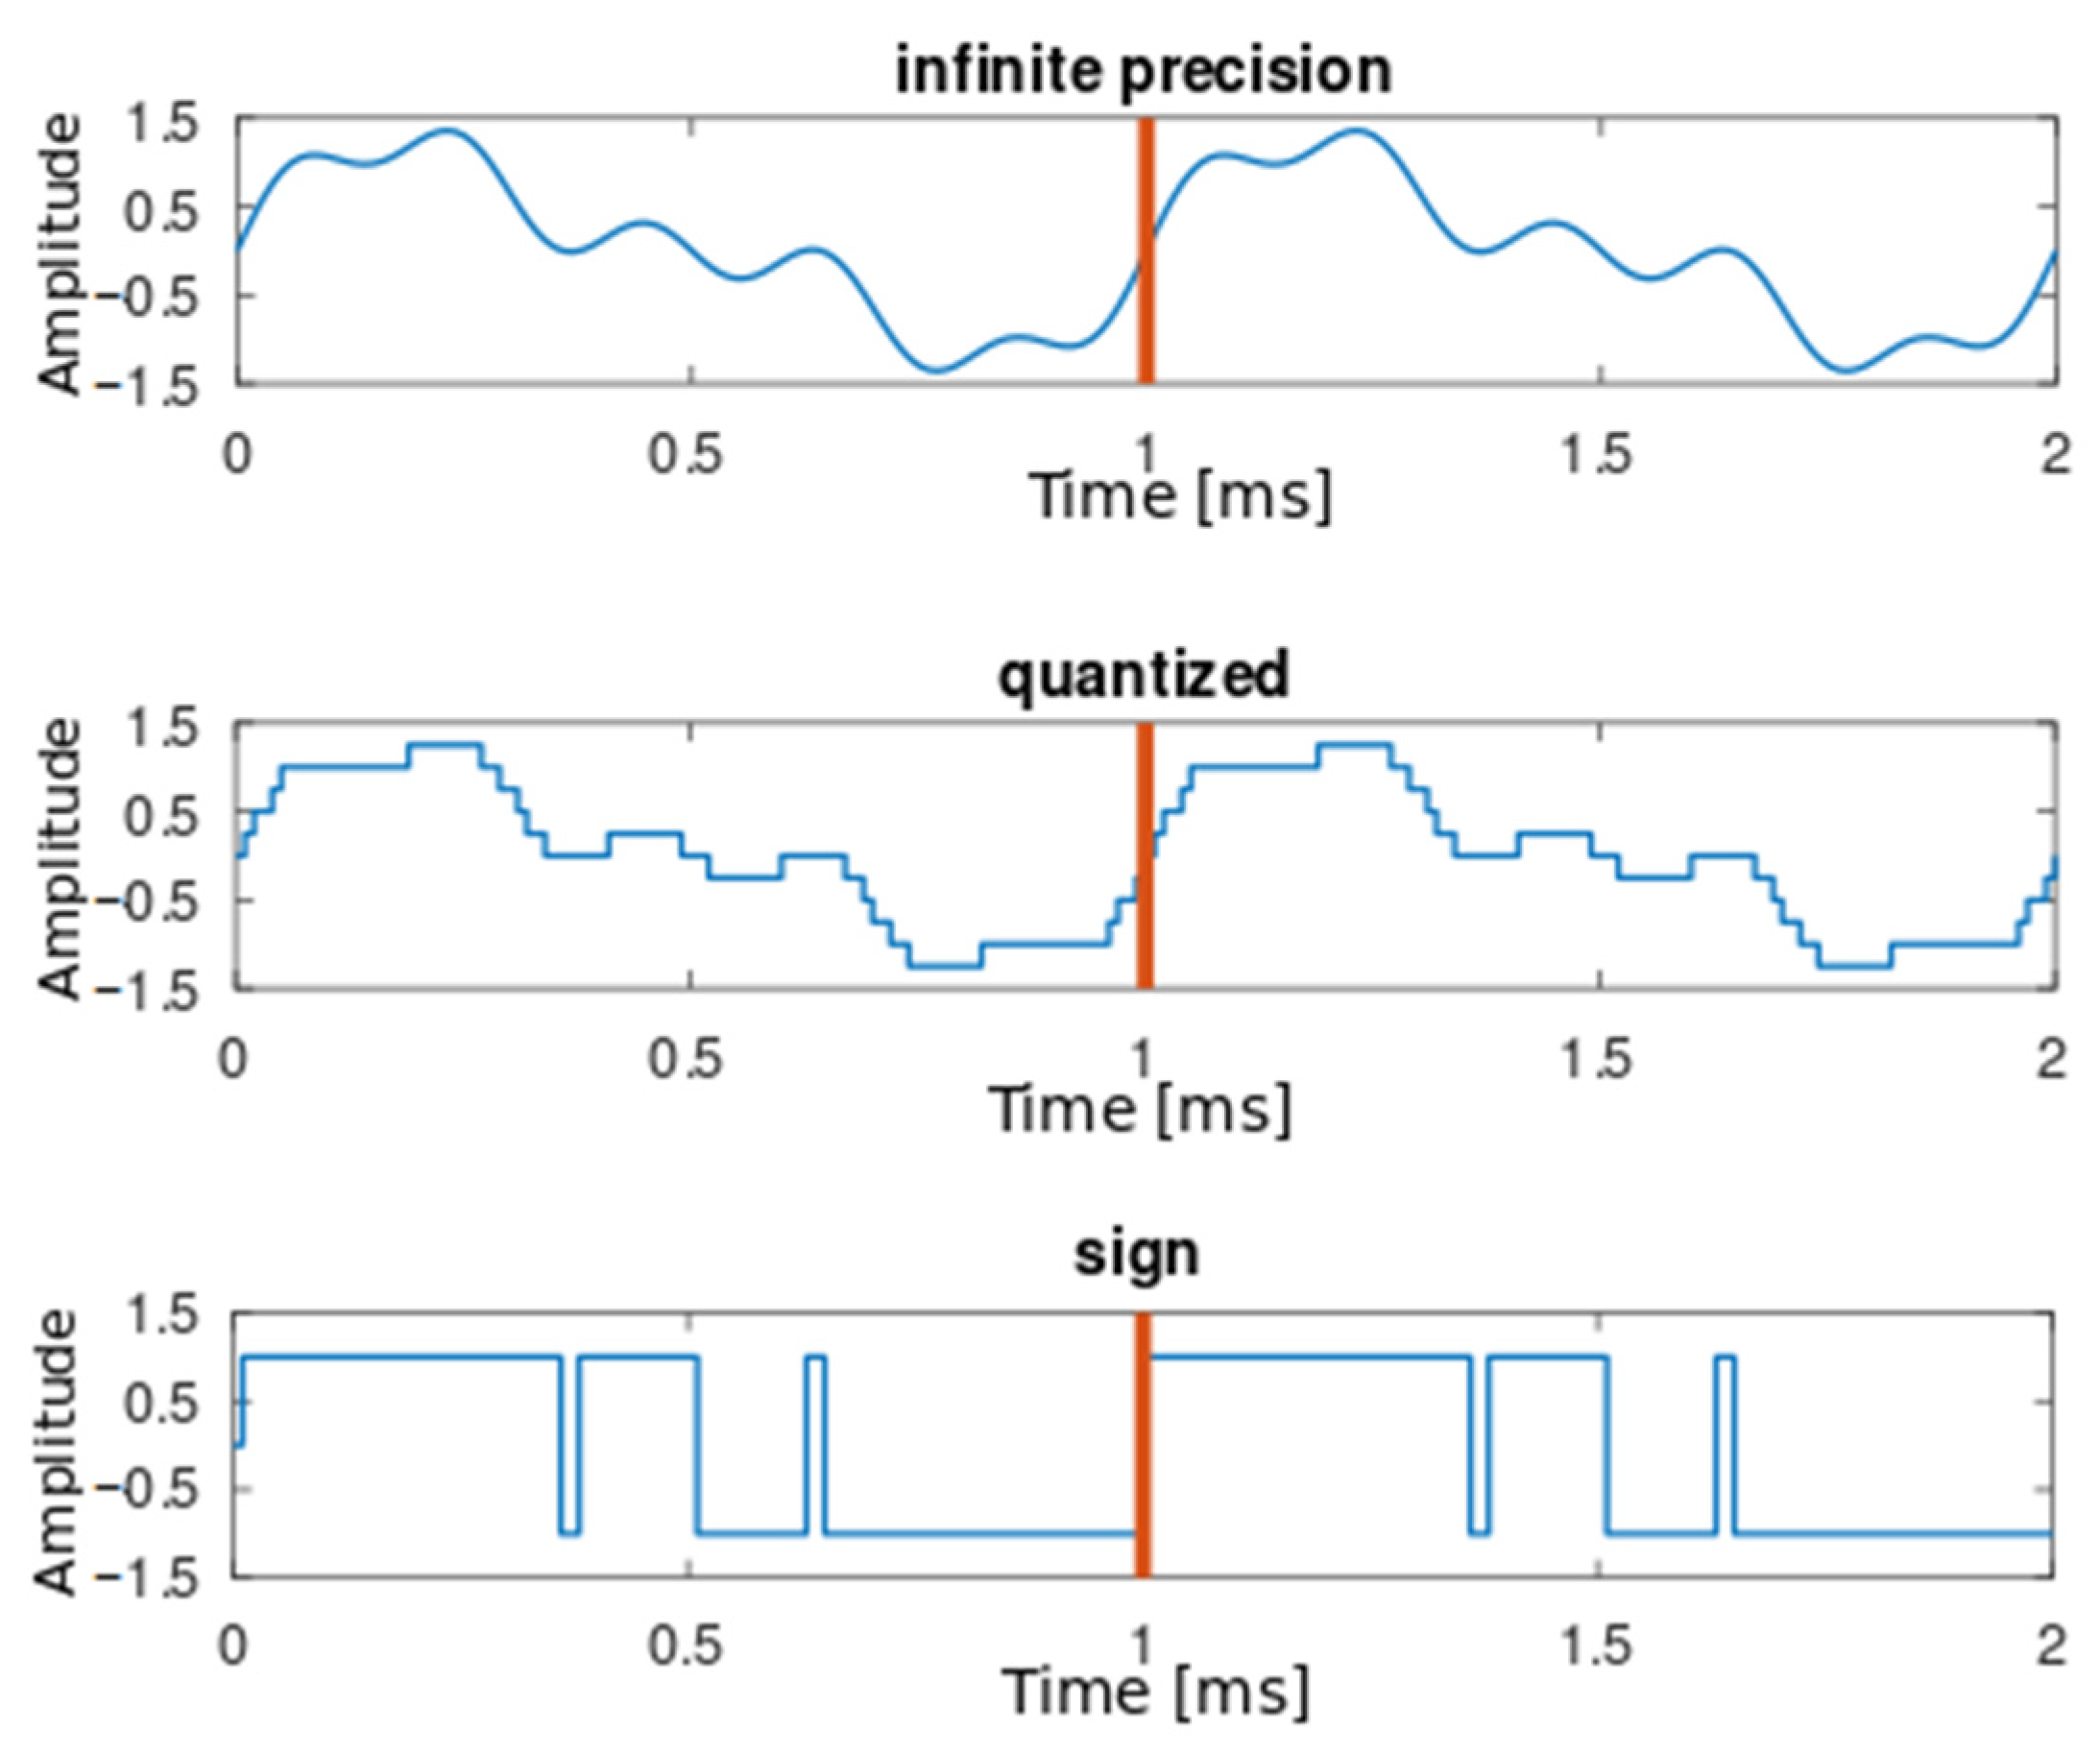
28]. With the assumption of no aliasing (anti-aliasing has been performed priorly), this holds true for any amount of bits, up to the minimum limit of 1-bit quantization, which basically results in the sign function. Although discretizing the amplitudes might indeed insert artifacts that generate new periodicities, the original frequency that acted as a fundamental is ultimately preserved. No matter how coarsely quantized, a sequence will still be repeating itself regardless of the discretization steps.
Figure 2 explains this by showing an infinite precision signal, a down-quantized version and a “sign” signal quantized with 1 bit. With the period starting at 0, it can be shown that all signals re-start at the exact same moment, despite the quantization error being increasingly high.
The mathematical principles for pitch detection are based on the intuition that the maximum of the autocorrelation [
29] of a signal is when such a signal repeats itself, i.e., at its fundamental frequency.
The common definition for the autocorrelation of a signal
x is [
30]:
With l being the “lag” (progressive shift of a signal to have it slide on the other), N is the length of the signal in terms of the number of samples, and k is the discrete time (number of samples).
Implementing a full autocorrelation function has some drawbacks: it is relatively computationally expensive due to the need for reiterated multiplications, leading to a complexity of O(N
2), and further normalization is required because the output is heavily dependent on the magnitude of the input signal and its variations, which skew the autocorrelation [
20].
However, for a periodic signal, which can be defined as
x(
k), which repeats after a period of
T samples, so that
x(
k) =
x(
k +
T), a “difference function” can be defined so that its minimum corresponds to the period. The formula, expressed in terms of the lag
l as the independent variable (in a digital sequence simply refers to the sample number), is the following:
with
l being the lag (sample), and
N is the length of the signal x in samples. This formula will be referred to, for simplicity, as “modified autocorrelation”, with the basic idea that instead of searching for the maximum of the product like pitch detection algorithms employing “usual” autocorrelation, we can search for the minimum of the difference. Moreover, this function is inherently independent of the input amplitude and its variations [
31].
Figure 3 displays an example comparing the autocorrelation and the difference function (“modified autocorrelation”), showing how the maxima of the first roughly correspond to the minima of the latter.
The operation to make the sum independent from negative values can be the square, as implemented by de Cheveignè and Kawahara [
20], or the absolute, as we chose. In our specific case, this actually becomes irrelevant due to the 1-bit quantization, which essentially renders this formula into an XOR operation, which is inherently optimized for hardware implementations and parallelization.
However, for more than 1-bit quantization, the absolute is still more efficient, especially for FPGA implementations, because it can essentially be realized with a multiplexer for the MSB and a conditioned re-assign of the sign.
From the O(N
2) computational complexity of the normal autocorrelation function, a single-bit XOR implementing the difference autocorrelation yields a theoretical constant complexity of O(1), being essentially a binary addiction without carry [
32,
33].
The idea behind the OBP algorithm is thus to apply an optimized autocorrelation-based pitch detection to a 1-bit version of the original signal, which drastically decreases computation complexity, especially considering that common bit depths employ 16 to 64 bits. Within this picture, Kawecka and Podahjecki explored the probabilistic properties of quantizers [
34]. The operation of using 1 bit is logically equal to the “sign” operation. In the most common digital representations (two’s complement, floating-point IEEE-754 [
35], sign/magnitude [
36]), the MSB (most significant bit) is used as the sign and thus a simple truncation of the original sequence is required—this could also be performed in the hardware domain for maximum speed.
The building blocks of the OBP algorithm are represented in
Figure 4 and described as follows:
Input: The input signal is assumed to be limited in band, with no DC components, which can be obtained before ever entering the digital realm by analog filtering; this also guarantees the zero average.
Sign: From the original signal, only the sign is extracted; in any common digital environment, this is obtained by just retaining the MSB. For different kinds of representation, a comparator would be required.
Buffer: It is needed to store a fixed amount of the previous samples of the signal and its length is related to the minimum frequency that needs to be detected (Fmin). With Fs being the sampling rate, a buffer length of Fs/Fmin samples is required.
Modified autocorrelation: The difference autocorrelation previously defined is applied to the sign signal within the buffer. Instead of performing a circular correlation, like other algorithms (namely, YIN), a linear correlation is applied on a total frame length of one buffer and a half to avoid phase jumps. For periodic signals, autocorrelation tends to rise and fall from/to the minimum symmetrically: for this reason, the center of the minimum is to be considered to evaluate the period.
Threshold: The search for the minimum of the difference autocorrelation function is simply performed by thresholding the signal with a fixed threshold. This can be visualized with a “Thresholding” logical signal that is 1 only when the autocorrelation is under the threshold. Although more sophisticated methods can be implemented, such a naïve implementation is computationally efficient and has been empirically observed to be a good trade-off between accuracy and speed.
Output: As previously stated, the very minimum point is the center of the sections below the thresholds, which is equal to a logical 1 in the “Thresholding” signal. The frequency result is simply obtained by counting the number of samples between two minima.
Figure 5 displays the progression of the algorithm by showing each internal signal.
2.3. YIN Algorithm
The YIN algorithm [
20] is an autocorrelation-based pitch estimator allegedly bringing high speed and good accuracy with few parameters to tune. It utilizes a modified autocorrelation difference function called Cumulative Mean Normalized Difference Function, used iteratively to avoid zero lag and to normalize the difference function with respect to large lags. Parabolic interpolation is then employed to obtain sub-sampling resolutions. In order to reduce octave errors and optimize the result, the search for the pitch candidate is aided by a heuristic based on range reduction. As for many algorithms, additional tuning possibilities are forecasted for unclean signals (i.e., presence of additive noise or additive frequencies/harmonics), such as comb filtering.
2.4. SWIPE (Sawtooth-Inspired Pitch Estimator) Algorithm
SWIPE was developed by Camacho and Harris [
19]. It consists of measuring the average distance between valleys and peaks on the spectrum, at harmonics of the pitch. After the first estimation, SWIPE tries to refine the output by exploiting a variable window size and evaluating the best pitch candidate.
The pitch is estimated by comparing the spectrum of the signal to the sawtooth waveform whose spectrum is most similar. This is achieved by calculating a normalized inner product between the signal spectrum and a modified cosine. The analysis window size is adjusted to align the main lobes of the spectrum with the positive lobes of the cosine and parabolic interpolation is employed for added accuracy. SWIPE’ (or SWIPE prime or SWIPEP) is a variant of SWIPE built to minimize subharmonic errors, which the original algorithm was prone to, by only employing the first harmonic and the prime ones. It is the most widespread version, present in advanced libraries such as Tsanas’ Voice Analysis Toolbox [
37], and will thus be the one used in this paper.
2.5. NLS (Nonlinear Least Squares) Algorithm
The Nonlinear Least Squares (NLS) principle is based on a statistical Maximum Likelihood (ML) candidate research [
38,
39]. This class of algorithms can theoretically achieve the highest degree of accuracy, especially on discretized pitches, at the cost of greater computational complexity.
The algorithm proceeds by iteratively minimizing the cost function for the estimation error.
The algorithm starts by selecting a range of pitch candidates that cover the expected range of the fundamental frequency: this operation requires a prior setup of the algorithm, which adds latency before being usable. For each candidate, a synthesized signal is generated with harmonics or sinusoids at that pitch frequency. The objective is to find the pitch candidate that best matches the observed signal by minimizing the sum of squared differences between the observed and synthesized signals. Optimization techniques like gradient descent are used to update the pitch candidates iteratively until convergence. Finally, the pitch candidate with the minimum objective function value is selected as the estimated fundamental frequency or pitch of the signal.
The NLS algorithm is known for its ability to handle complex harmonic structures, variable pitch signals, and noisy environments. It is particularly effective when the signal contains multiple overlapping or interfering harmonic components.
For the purpose of this study, a fast implementation of an NLS-based algorithm by Wang et al. [
40] is employed, shown to reduce the complexity by solving two Toeplitz-plus-Hankel systems of equations and using the recursive-in-order matrix structures.
2.6. Test Conditions
All the algorithms were tested on the same set of signals from the SYNTHPITCH dataset. The sampling rate was 96 KHz, the considered duration of the signals was 100 ms (9600 samples) and the frequency limits for algorithms that require it (e.g., YIN needs to set the minimum detectable frequency) were between 50 and 5000 Hz, in order to also observe eventual subharmonic errors on even the lowest of the frequencies in the dataset (which is 100 Hz). This resulted in buffer lengths of Fs/Fmin = 1920 samples. The following hyperparameters and setup were employed for each algorithm under test:
OBP: Our algorithm is used with a fixed threshold at 400. Tuning the threshold, predictably, allows us to adapt to different input classes or characteristics.
YIN: The resolution for the parabolic interpolation is 1 cent, the fixed threshold is at 0.1.
SWIPE: The resolution for the parabolic interpolation is 1 cent, the harmonics considered are only the first and the prime ones (making it SWIPEP), the timeframe is at 10 ms and the final result is the mean of the tracked frequencies. Using a bigger or smaller timeframe does not sensibly change the elapsed time due to the inherent nature of SWIPE and it being reliant on generating sawtooth waves.
NLS: An NLS-based model is generated from a synth sample having a number of harmonics equal to 4. Increasing the number of harmonics, in the case of the present study, leads to sensibly higher elapsed times while not improving accuracy. The time needed to generate the model, i.e., the unavoidable latency at the beginning, is on average around 40 ms. For simplicity and uniformity, this latency will not be considered when discussing elapsed times, with the assumption that in a real-world scenario, the model is pre-made. However, this is a small disadvantage.
The test involves running all of the algorithms on each signal (duration = 100 ms) in each category of the SYNTHPITCH dataset. The main metrics are time elapsed in seconds (TE) and relative absolute error (RAE) computed by comparing the estimated frequency with the known F0 of each signal according to the following formula:
with
being the estimated value and
y being the real/target one.
Both the RAE and the TE are averaged for each category. Due to the real-world applications of pitch detection algorithms, and also taking into account the fact that real-world signals might not present a discrete F0, the accuracy within a certain range is also presented. Specifically, the ranges 1%, 2% and 10% of the true F0 are considered, producing the metrics ACC-1, ACC-2 and ACC-10. These accuracies are presented as averages over categories as well.
The ranges were chosen empirically, with 2% being a truly “acceptable” error in most music/MIDI-related applications, and with 10% ruling out octave errors, which inherently produce 100% or above errors. Acceptable RAE values can be approximately below 0.025, because most musical applications use discretized pitches that do not result in note errors if within a range < 2.5% around the starting pitch. We chose 2% as a safety measure: this range is well represented by the “ACC-2” metric, which is the percentage of instances in which the algorithm brings an error equal to or lower than 2%.
Section 4 will further detail this.
In order to assess the statistical validity of the results, a Mann–Whitney U-test was performed on each table reporting RAE, TE and ACC metrics within the results [
41]. With OBP as the main algorithm under test, U, Pearson’s
p (or “rho”) and the z-score were derived for each one-vs.-one comparison, with
p < 0.05 used as the significant threshold [
42].
4. Discussion
The premises of this study, besides the presentation of the custom-made SYNTHPITCH dataset, were to implement an ultra-fast pitch detection algorithm for real-time applications and ease of hardware implementation. Our proposed algorithm, OneBitPitch (OBP), despite running on a software environment, confirms the premises by providing by far the fastest results in terms of time elapsed for pitch detection. On the other hand, as is expected due to its nature, SWIPE is the heaviest algorithm and takes an average of 256 ms to be executed, despite the “large” window frame selected and the SWIPEP variant.
YIN, considered one of the fastest pitch detection algorithms, being based on a modified autocorrelation, was about nine times faster than SWIPE, with only a 38 ms average. NLS needs a special mention, as its accuracy values are outstanding, and, on synthetic signals, its time performances are too, with only a 27 ms average.
However, OBP shows its real strength with an average elaboration time of only 4.6 ms. It is 50 times faster than SWIPE and even 9 times faster than YIN, which is considered a fast algorithm.
Figure 7 displays an alternative visualization of the performance of the four algorithms in terms of speed, plotting the elapsed time, which immediately shows the differences in speed.
Other works such as that by Grinewitschus et al. [
21] report speed as a multiplier of the “realtime”, which is the duration of the audio segment to be evaluated. Their approach, based on leveraging the constant-Q Gabor Transform followed by harmonic shift algorithms and corrective heuristics, reaches a declared 0.29 × realtime speed on a more powerful machine than what has been used in the present work; nonetheless, OBP reaches 0.046 × realtime.
The choice of the right algorithm for a specific application is mainly based on the latency and accuracy tradeoff required, and the computational power available, so it is safe to say that each of the proposed algorithms has a specific field and reason to be applied.
Looking at the RAE and accuracies, the NLS appears as the best-performing algorithm, always providing less than 1% RAE on average, followed by SWIPE. It is, however, worth noting that the NLS was one of the algorithms suffering the most from octave errors, especially when processing noisy signals or square waves. Moreover, this test confirms the noise-robust nature of SWIPE, performing well even with harsh signals like square waves and/or noise.
Looking at the accuracy tables for ACC-1, ACC-2 and ACC-10, NLS confirms its performances by always providing the highest accuracy, at 93%. However, this value stays the same for all three ranges, which indicates that all the errors reported by NLS within these tests were greater than 10% in RAE, which is a good indicator of a certain proneness to octave errors.
Although OBP underperforms when it comes to 1% accuracy, that is to be expected: only 42% of the time was the error smaller than 1%. On the other hand, its performances become comparable to YIN and SWIP for ACC-2, which represents the acceptability range. The discrete nature of musical notes within the Western tempered system is so that a 2.5% error still leads to a discretized pitch being correct.
For larger-scale errors, OBP actually brings better ACC-10 values than YIN and SWIPE, with more than 90% accuracy.
TE can be considered as the most crucial metric for the present paper, due to the improvement that OBP aims to bring, which is specifically in terms of speed.
Within this context, the differences between all of the algorithms considered, especially OBP, have been proven to be statistically significant with a Mann–Whitney test yielding a U close to 0, which brings p < 0.00001, which is much lower than the desired threshold of 0.05. A z-score < −4 points to a confidence higher than 99.997%.
RAE and ACC-1 also generally present statistical significance in the comparisons, especially when OBP is involved. On the other hand, results regarding ACC-10 are not statistically significant (all of the algorithms perform similarly).
In general, differences between YIN and SWIPE within this picture appear to bear less statistical significance, being only significant for the TE—which is the most crucial metric for the scope of this study.
These results in terms of time vs. accuracy are completely in line with the premises, since OBP was designed to be minimalistic, forgoing sheer, pinpointed accuracy (hence the lower ACC-1 values) but still staying within an acceptable range for most applications (hence the higher ACC-2 values), with an inherent observed robustness with respect to signal variations and to octave errors.
It is worth noting that despite the average accuracy, the average RAE of OBP is comparable to the YIN algorithm.
Moreover, all the presented algorithms have been used in one fixed setup with a fixed threshold. However, in real-world applications, hyperparameters can be tuned to better adapt to the nature and variation of the input: in fact, manually changing the threshold of the OBP algorithm provides better performances on certain datasets, especially the noisiest.
The noisiest, most unclean dataset categories are full1, full2, 4harm_4part_wgn15 and 4harm_high: on these sets, most algorithms provide poor performances. However, the average RAEs that would be obtained on all of the other sets are as follows:
YIN: 0.077680, i.e., 7.7% average error;
SWIPE: 0.007548, i.e., 0.7% average error;
NLS: 0, i.e., no errors. Due to its heuristic-powered nature, NLS is able to pinpoint discrete frequencies on synthetic datasets;
OBP: 0.018396, i.e., 1.8% average error.
On cleaner signals, such as those produced by many musical instruments that do not have added noise, OBP actually performs better in terms of error than YIN, while providing more than acceptable results overall.
The minimalistic, stripped-down nature of OBP does not allow it to reach almost-perfect accuracy levels; however, it is critical to assess its “acceptability” ranges, given that it is by far the fastest [
44].
YIN, on the other hand, is a fast and simple algorithm. It suffered from octave errors 12% of the time, but when the estimation was right, the precision was satisfying, with an 87% chance of obtaining a result with less than 1% error.
The OBP algorithm presents a peculiar behavior because it has only a 4% chance of suffering from octave errors.
An advantage of the mathematical model behind OBP over other similar autocorrelation-based methods is that, being based on the product of signals, the output heavily depends on the magnitude of the input and its variations. Because of that, an additional normalization process is usually needed, increasing the computational complexity, requiring knowledge of the energy of the signals and adding more multipliers.
On the other hand, OBP only processes sign signals, inherently independent from the original magnitude, removing the need for explicit normalization procedures.
Despite the performances reported in these tests, different environments and data see the algorithms behave differently, at least in terms of accuracy. In fact, SWIPE is one of the gold standards for feature extraction for medical or Machine Learning purposes, due to it being well suited for noisy environments and due to the applications not needing real-time elaboration. On the other hand, NLS is not robust with respect to the nature of the input and is more prone to suffer from octave errors, making it sometimes an inconsistent choice despite the high performances on the proposed synthetic dataset.
This study employed the SYNTHPITCH dataset because the large-scale speed was the main indicator to be evaluated; however, future steps will evolve around the experimentation on real-world, validated data for pitch detection, which also leads to the application of pitch-tracking, to follow in real-time the varying pitch of a real sound/speech signal [
45].
Future Works
We are currently working on expanding the present experimentation with other test datasets, focusing especially on real-world scenarios such as sounds from real instruments (as those employed for MIDI conversion) or vocal signals.
Technically speaking, the most likely future implementations of OBP will definitely focus on hardware implementation, due to its bitwise nature and maximum speed. Its simple structure and the low usage of memory and computations make it perfectly suitable for a hardware-only implementation—for example, with a DSP—to exploit its speed capabilities and inherent characteristics suitable for digital electronics. A future FPGA implementation is foreseen, aimed to produce a stand-alone IpCore that, using just a small amount of logic, can provide ultra-low-latency pitch tracking [
46,
47]. With the increasing trend and the low cost/low performance of System on a Chip (SoC) technologies, the OBP algorithm can be a perfect candidate for wearable electronic, embedded music processors for Autotune or real-time MIDI conversion [
48], as well as IoT applications, surveillance or vocal recognition. We can thus summarize some of the future directions of OBP as follows:
Test on real-world datasets, especially within the professional audio/musical department;
Full-hardware FPGA implementation;
Addition of optional features such as posterior (heuristic) correction for added accuracy at the cost of speed, selectable N-bit expansion, etc.
5. Conclusions
In this paper, a novel algorithm was proposed for ultra-fast pitch detection for real-time applications, based on a modified autocorrelation implemented on a single-bit signal. The OneBitPitch (OBP) algorithm was compared with the most widely used models for high-speed F0 detection, namely, YIN, SWIPE and an NLS-based implementation. Additionally, a custom dataset made of synthetic waves has been proposed and made available to the public: the SYNTHPITCH dataset encompasses sinusoidal and square waves with added artifacts for an increasing pitch complexity, realized through the addition of harmonics, partials, white noise and reverb.
OBP is shown to be an ultra-fast, reliable pitch detection algorithm for real-time applications: it has been built with a minimalist approach that aims to reduce all computationally expensive steps in pitch detection, which are mainly represented by a multi-bit elaboration, the transformation/metric production and the eventual presence of corrective heuristics.
The focus of the OBP algorithm is solely on speed, provided that acceptable accuracy levels are reached, and its characteristics make it exceptionally suitable for an easy and lightweight hardware implementation on FPGA or SoC, for ever-higher customization possibilities as well as lower latencies.
The comparison of different state-of-the-art algorithms shows that OBP is 9 times faster than the peak speed of the other algorithms (namely, YIN) and 50 times faster than SWIPE. OBP is shown to be the fastest pitch detection algorithm within the presented test, with only 4.6 ms of mean elapsed time on each data instance, or 0.046 × realtime runtime, which is the lowest reported to date.
On the other hand, although relative error might be increased for certain datasets, OBP is less prone to octave errors, and in general demonstrates the ability to stay within the acceptability range on most of the tested signals. The main compromise was between speed and accuracy, and OBP stays within acceptable ranges of 2% accuracy, with a 72% average that peaks at almost 82% for less noisy signals, which is enough for most discrete-note musical applications. The NLS-based algorithm is the most accurate one, although it is less robust to noise or input variations and requires a prior building of a model; in fact, SWIPE is one of the most employed algorithms in real-world applications not centered on speed. Additional tests are needed on real-world signals, such as validated voices of known F0, and a hardware implementation, with more parameters and selectable options is foreseen for the OBP algorithm.


