Article

Life Assessment for Motorized Spindle with Zero Traumatic Failure Data Based on Subdistribution Competing Risk Model

1
Key Laboratory of Reliability of CNC Equipment, Ministry of Education, Changchun 130022, China
2
School of Mechanical and Aerospace Engineering, Jilin University, Changchun 130022, China
*
Author to whom correspondence should be addressed.
Appl. Sci. 2023, 13(14), 8230; https://doi.org/10.3390/app13148230
Submission received: 24 March 2023 / Revised: 8 July 2023 / Accepted: 10 July 2023 / Published: 15 July 2023

Abstract

:
Considering the influence of performance degradation on a product’s traumatic failure, under the condition that only degradation data are observed and no traumatic failure data are observed, this paper proposes a subdistribution competing risk model to achieve a motorized spindle life assessment. This paper assumes that the failure rate ratio of the tested products does not change with time under different stress levels. Basic reliability with zero traumatic failure data is modeled by a unilateral confidence limit method under a two-parameter Weibull distribution. Performance degradation data are taken as covariates. The regression coefficients of the covariates are calculated by SPSS software. Then, a subdistribution competing risk model is constructed, which reflects the dependency relationship between reliability and performance degradation, and the product’s reliability life can be evaluated accordingly. The correctness and advantages of the model built in this paper are verified by a case analysis combined with the performance degradation information of a motorized spindle.

1. Introduction

For products like motorized spindles, which have high reliability and long life, it is difficult to obtain traumatic failure information in the short term due to constraints such as time or funding. Therefore, the life assessment of such products has always been a research hotspot and difficulty.
Because of the characteristics of these products’ long life and high reliability, there are very few traumatic failures in their whole life cycle. Therefore, many references have conducted research on product reliability modeling and life assessment methods with zero traumatic failure information [1,2,3,4]. Fu, H.M. and Zhang, Y.B. [5] presented a method of reliability analysis of the time-truncated zero-failure data based on the Weibull distribution under the zero-failure test data circumstances. Jiang et al. [6] solved the problem that traditional maximum likelihood estimation (MLE) cannot be used to estimate the parameters of a reliability model under zero-failure data and proposed a modified MLE method. Byeong, M.M. et al. [7] recommended the Bayes method to deal with zero-failure data. However, the key to Bayes’ application is to obtain prior information correctly. Kaufman, L.M. et al. [8] introduced the concept of modeling uncovered faults when a product test reveals no failures and applying the statistics of the extremes to estimate the coverage. Kayis, S.A. [9] and Zhan et al. [10] proposed that parameters related to product reliability should be used as random variables. They then used zero-failure test data to estimate the parameters of different confidence intervals and obtained the product reliability under a unilateral confidence limit directly. They thus simplified the calculation process of product reliability and improved the efficiency of evaluation. Han [11] used the unilateral confidence limit method to calculate the confidence limits of relevant parameters under exponential distribution and Weibull distribution; however, the test sample size under the Weibull distribution affects the true value of the shape parameter, which in turn affects the product reliability. Therefore, Li et al. [12] proposed a modified unilateral confidence limit evaluation method by introducing failure information into the confidence limit analysis. With the introduction of failure information, the Bayesian estimator of product failure rate was obtained, then the product reliability and MTBF were obtained by using the failure rate estimator and the modified unilateral confidence limit method. However, the above-mentioned research only studied the reliability of products with zero-failure data from the perspective of traumatic failure, ignoring the impact of product performance degradation on product reliability, so the research results are biased.
As the performance of products always degrades during the period of use, the degradation information is easily available. So, the product reliability study is usually carried out in combination with the degradation information [13,14,15]. However, some scholars found that the degradation process of products often comes with traumatic failure. In general, the more degraded the performance, the more likely it is to be accompanied by traumatic failure. The failure phenomenon with both traumatic failure and degradation failure is called competing failure [16]. Therefore, Su et al. [17] established a competing failure reliability evaluation model. At present, a lot of research has found that products are prone to traumatic failure as the performance gradually degrades. Therefore, it better reflects engineering reality to model the reliability and evaluate the product’s life from a competing point of view.
At present, there are many modeling methods of competing failure [18,19,20,21,22]. Wu et al. [23] introduced the Cox proportional risk regression model to analyze the relationship between traumatic failure time and degradation value and gave the general model and parameter estimation method of competing failure when traumatic failure and degradation failure coexist; Su [24] constructed a competing failure model under the assumption that traumatic and degradation failures were dependent and that traumatic failure obeyed the Weibull distribution and degradation failure obeyed the Wiener process. The results showed that if only degradation failure is considered, the evaluation results would be optimistic, and the correlation between traumatic failure and degradation failure had a great impact on the accuracy of reliability evaluation. However, the above studies constructed competing failure models when traumatic failure information existed but did not involve the zero traumatic failure data situation.
To summarize, it better reflects engineering reality to model the reliability and evaluate a product’s life from competing points of view. However, many studies constructed competing failure models when traumatic failure information existed [25,26,27,28]. They did not involve a zero traumatic failure data situation, which is the most common actual engineering situation during the period of using a product with high reliability. In order to solve the above problems, supposing that the failure rate ratio of the tested products does not change with time under different stress levels, this paper built a subdistribution competing risk model. Basic reliability with zero traumatic failure data is modeled by the unilateral confidence limit method under a two-parameter Weibull distribution. Performance degradation data are taken as covariates. The regression coefficients of the covariates are calculated and tested by SPSS software (version 22) [29]. The correctness and rationality of the method proposed in this paper are verified by a comparison with the modified maximum likelihood parameter estimation method [30], which does not consider competing failure and is only based on degradation information.
The rest of this paper is organized as follows. Section 2 introduces the modeling process of the subdistribution competing risk model with zero traumatic failure data. Section 3 evaluates the life of a motorized spindle using the subdistribution competing risk model proposed in this paper and compares the result with the other method. Section 4 analyzes the evaluation results. Some concluding remarks are presented in Section 5.

2. Construction of Subdistribution Competing Risk Model with Zero Traumatic Failure Data

2.1. Subdistribution Competing Risk Model

Competing risk means that when the interested events occurred to the subject we studied, there are other outcome events that may happen at the same time, which will prevent or reduce the occurrence probability of the interested events, forming a so-called “competing” relationship among the outcome events; this series of events is called competing events, as shown in Figure 1.
In Figure 1, assuming that an individual has an initial state and a set of ending events caused by reason n n = 1 , , k , for the individual, the k ending events are competing with each other. If the interested event is the ending event caused by reason 1, then other ending events are the competing events of the ending event caused by reason 1. In this case, if the competing events are treated as censored data, there will be a large deviation when estimating the interested event’s incidence risk using the Kaplan–Meier method [31]. So, the competing risk model should be used in this situation.
The proportional risk model is a kind of competing risk model put forward by D. R. Cox [32]. It has been used in the field of medical survival analysis at first. Because it can deal with the relationship between the multivariate and the interest events without knowing the basic failure rate function, recently it has also been applied in many aspects, such as product reliability [33], product failure impact analysis [34], and product maintenance strategy [35]. It is a multivariate regression model, and it takes the influence degree of multi-factors related to product life into account. The model can be constructed by estimating the regression coefficients [36].
Cox proportional risk model treats competing events as censored data, making it overestimate the incidence risk of the interested events, resulting in competing risk bias. Special studies have found that about 46% of the literature may have such bias. In 1999, Fine and Gray proposed a semi-parametric proportional risk model of partial distribution, namely the subdistribution competing risk model, also known as the Fine–Gray Model [37].
In the subdistribution competing risk model, the subdistribution risk of the interested event k is defined as the probability of failure caused by k at an infinitesimal time interval Δ t , on the condition that no event occurred to the individual before time t or no event different from k occurred to the individual before time t . The subdistribution risk λ t can be expressed as follows:
λ t = lim Δ t 0 P t T < t + Δ t , D = k | T t T < t , D k Δ t
where T is the time when competing event k occurs; D = k means the failure occurs and is caused by event k .
Cox-based subdistribution competing risk model is
λ t X = λ 0 t e x p β T X
where λ t | X is the failure rate function of the interested event at time t ; λ 0 t is the basic failure rate function of the interested event at time t ; X is covariate vector, also called factors that affect the failure rate; β is parameter vector, also called regression coefficient vector.
The relationship between failure rate function λ t | X and the subdistribution distribution function F t | X is shown as follows:
F t X = 1 e x p 0 t λ t X d t
Therefore, F t | X can be directly obtained from the estimation value of the regression covariate coefficient β and the basic failure rate function λ 0 t .
Perform logarithmic operation on both sides of Equation (2); Equation (4) is obtained:
ln λ t X / λ 0 t = β T X
If the regression coefficient β is greater than 0, λ t | X is greater than the basic failure rate function, these covariates X are called risk covariates. If the regression coefficient β is less than 0, λ t | X is less than the basic failure rate function; these covariates X are called protection covariates.
If there are p covariates at the same time, because of e x p β T X = e x p j = 1 p β j X j , the product failure rate function and reliability function can be, respectively, expressed as follows:
λ t X = λ 0 t e x p j = 1 p β j X j
R t X = e x p 0 t λ 0 τ e x p j = 1 p β j X j d τ = e x p ( 0 t λ 0 τ d τ ) e x p j = 1 p β j X j = e ( 0 t λ 0 τ d τ ) e x p j = 1 p β j X j = e 0 t λ 0 τ d τ e x p j = 1 p β j X j = R 0 e x p j = 1 p β j X j
where R 0 t is the basic reliability function.

2.2. Construction of Subdistribution Competing Risk Model with Zero Traumatic Failure Data

According to Equation (6), in order to establish a subdistribution competing risk model, it is necessary to establish a basic reliability function based on known product information and calculate the regression coefficient.
The process of the method proposed in this paper is shown in Figure 2.

2.2.1. Collection of Product Degradation Information with Zero Traumatic Failure Data

In order to save time and cost, fixed-time truncated reliability tests are carried out on the samples to monitor and collect performance degradation information.

2.2.2. Basic Reliability Modeling with Zero Traumatic Failure Data Based on Unilateral Confidence Limit

Because the Weibull distribution has a wide range of applicability, it is assumed that the tested sample’s lifetime follows a two-parameter Weibull distribution with a known shape parameter. According to the relationship between reliability life, total test time, and confidence level under the zero traumatic failure data situation, a reliability function R B t based on the unilateral confidence lower limit method is established.
The situation of exponential distribution is analyzed first, and then the situation of Weibull distribution is deduced accordingly. The exponential distribution function and its reliability function are as follows:
F t , θ = 1 e x p t θ R t , θ = e x p t θ
where t is survival time, t > 0 ; θ is an unknown parameter, θ > 0 .
If a fixed time-truncated test with the fixed time of t 0 is carried out on n products of this type of distribution, the total test time is n t 0 . According to reference [38], the optimal lower confidence limit of θ at the confidence level γ is
θ L = n t 0 / ln γ
The optimal lower confidence limit of the reliability R t , θ at the confidence level γ is
R B t = e x p ln γ t n t 0
To the reliability life t R θ = θ ln 1 R , the optimal lower confidence limit of t R θ at the confidence level γ is
t R L = n t 0 ln R ln γ
If the product life obeys a Weibull distribution with shape parameter m > 0 and scale parameter η > 0 , which is written as T ~ W e i b u l l ( m , η ) , the product reliability function is
R T = e x p T η m T > 0
Let t = T m , θ = η m , then, the product life t obeys an exponential distribution with the parameter θ = η m .
If a fixed time-truncated test with the fixed time t 0 is carried out on n products of this type of Weibull distribution, the total test time is n t 0 . The optimal lower confidence limit of θ at the confidence level γ is as follows:
θ L = η L m = n t 0 m l n γ
If the shape parameter m m > 0 of the Weibull distribution is known, the optimal lower confidence limit of the reliability R at the confidence level γ is
R B t = e x p l n γ n t t 0 m

2.2.3. Regression Coefficient Calculation of Subdistribution Competing Risk Model Based on Performance Degradation Data

The lower confidence limit of product reliability under the two-parameter Weibull distribution at the confidence level γ with zero traumatic failure data obtained in Equation (13) is used as the basic reliability function R 0 t . Substituting covariate optimal degenerate model X t to the covariate vector. According to Equations (6) and (13), a subdistribution competing risk model with zero traumatic failure data can be obtained as follows:
R t | X t = R 0 t e x p j = 1 p β j X j t = e x p l n γ n t t 0 m e x p j = 1 p β j X j t
Because the subdistribution competition risk model has no restrictions on the distribution of outcome variables (reliable lifetime in this paper), therefore, COX proposed a partial likelihood function [39] to evaluate β j :
L β = i = 1 n e x p j = 1 p β j X i j / s C t i e x p j = 1 p β j X s j
where P is the number of covariates. n is the number of covariates degradation data. C t i is degradation data set without failure after time t i .
Let L β j / β j = 0 , and the maximum partial likelihood estimation value can be obtained. Its numerical calculation can be carried out through SPSS by inputting covariates degradation data, degradation time, and degradation status.
Through calculating in SPSS, the regression coefficients β j 1 j p , P value of β j , the model’s −2log-likelihood function value, and the upper and lower confidence limits of e x p β j 1 j p at the confidence level of 90% are obtained. When the −2log likelihood value of this model with covariates is smaller than the −2log likelihood value of the no-covariates model, this risk model is considered to be valuable, and all covariates in the model have a significant combined impact on the dependent variable, but not on the contrary. To each covariate, when its p value is smaller than 0.05, it means this covariate is a significant factor to the dependent variable when it is separated from other covariates, when its p value is larger than 0.05, it means that it has no significant effect on the dependent variable.

2.2.4. Reliability Life Assessment of Products Based on Subdistribution Competing Risk Model

According to the character of reliability, its value is less than or equal to 1. That is, R 0 ( t ) = R B t is less than or equal to 1. Therefore, the upper and lower confidence limits of e x p β j 1 j p correspond to the lower and upper confidence limits of the reliability R ( t | X t ) of the subdistribution competing risk model, respectively.
R L t | X t = R 0 t e x p j = 1 p β j X j t U = R 0 t j = 1 p e x p β j X j t U = R 0 t j = 1 p e x p β j U X j t = exp l n γ n t t 0 m j = 1 p e x p β j U X j t
R U t | X t = R 0 t e x p j = 1 p β j X j t L = R 0 t j = 1 p e x p β j X j t L = R 0 t j = 1 p e x p β j L X j t = e x p l n γ n t t 0 m j = 1 p e x p β j L X j t
where subscript L represents the lower confidence limit and U represents the upper confidence limit.
The reliability life interval estimation corresponding to different reliability levels are T L ,   T U . T L is the reliability life corresponding to R L t | X t . T U is the reliability life corresponding to R U t | X t .

3. Case Analysis

Taking the degradation information of motorized spindle as an example, the reliability life of motorized spindle under different reliability levels is evaluated by using the subdistribution competing risk model with zero traumatic failure data established in this paper. Compared with the modified maximum likelihood parameter estimation method [30] based on degradation information, the correctness and rationality of the method proposed in this paper are verified.

3.1. Collection of Degradation Information of Motorized Spindle

In reference [30], axial end radial runout is selected to characterize the performance of the electric spindle; the fixed time-truncated test is carried out to 170MD18Y16 motorized spindle, which is a high-speed grinding spindle for machine tools to obtain the reliability model. FT5070F laser displacement sensor, which has high precision and strong anti-interference ability, is selected to detect the axial end runout degradation data every 12 h. The test conditions are as follows: stress load F Y is 81.1 N, the spindle rotation speed ω Y is 9000 r/min, fixed time-truncated test time is 1700 h according to the GJB899A-2009 standard [40]. The termination conditions are as follows: (1) reaching the scheduled fixed time-truncated test time; (2) the test value of several consecutive axial end radial runout exceeds 1.6 times the initial value. Partial information on axial end runout degradation data is shown in Table 1.
The optimal degradation model of the spindle’s axial end runout is obtained in reference [30] as follows:
X t = 3.876 t 0.0858

3.2. Reliability Model Obtained by the Modified Maximum Likelihood Estimation Method

Reference [30] assumes that the spindle’s life follows the Weibull distribution. According to the degradation data and the modified maximum likelihood estimation method, reference [30] obtained the shape parameter m = 1.6472 and the scale parameter η = 2494 ; therefore, the reliability function is
R t = e x p 2.5388 × 10 6 t 1.6472

3.3. Construction of Subdistribution Competing Risk Model for Motorized Spindle with Zero Traumatic Failure Data

Because of the invariance of the product failure mechanism, in this paper’s model, the basic reliability functions of the motorized spindle also obey the Weibull distribution with a shape parameter of 1.6472, let the confidence level γ = 0.90 , n = 1 . Substituting γ and n into Equation (13) to calculate basic reliability functions:
R B t = e x p t 1 . 6472 1988463
Since R B t is regarded as basic reliability R 0 t , substituting R B t into Equation (14), we can obtain the subdistribution competing risk reliability model as follows:
R t | X t = e x p t 1 . 6472 1988463 e x p β X t
Let axial end runout degradation data be the covariate. Put covariates degradation data, degradation time, and degradation status in SPSS; the regression coefficient of the covariate can be calculated by SPSS software(version 22). The covariant coefficients of the spindle are shown in Table 2.
In Table 2: β is the regression coefficient of the covariate, the regression coefficient of the spindle’s axial end runout is β X = 0.185 ; df is the number of the covariates; in this paper, we take only one covariate into account, d f = 1 ; EXP( β ) reflects the change of failure rate for each unit variable added to the covariate. It means when the axial end runout is added 1 μm, the failure rate will change 1.203 times. 90% EXP( β ) of CI indicates the confidence interval of EXP ( β ) with a confidence level of 90%.
From Table 2, we know that the −2log likelihood values are smaller than the −2log likelihood value of the no-covariates model, respectively, and p values are smaller than 0.05, respectively. This means that the covariate of the risk model has a significant effect on the dependence variable.
Substituting β X into Equation (19), the reliability models based on the subdistribution competing risk model with zero traumatic failure data can be obtained as follows:
R t | X t = e x p t 1.6472 1988463 e x p 0.185 X t = e x p t 1.6472 1988463 e x p 0.185 × 3.876 t 0.0858
The reliability curves of R t | X t and R t are shown in Figure 3, and the difference curve between the two reliability is shown in Figure 4.

3.4. Testing of Model Goodness-of-Fit

Select the Wiener degradation process reliability model to test the model proposed in this paper. The reliability model obtained from the Wiener process is
R k = Φ w μ k t k σ k t k e x p 2 μ k w σ k 2 Φ w μ k t k σ k t k
where μ k = 1 k i = 1 k g i g i 1 t i t i 1 , σ k 2 = 1 k i = 1 k g i g i 1 μ k t i t i 1 2 t i t i 1 .
Firstly, perform K-S testing on the basic reliability shown in Equation (13).
Calculate the test statistic D max ,
D max = max R 0 t k R k t k
After calculating, D max = 0.0902 < D n = 0.103 , D n can be obtained by querying the K-S test statistical table. It can be seen that the basic reliability model is reasonable.
Then, perform a correlation index test on Equations (18) and (20).
Calculate the correlation index k ,
k = 1 Y M Y ^ M 2 Y M Y ¯ 2
where Y M is the true value of reliability obtained by the Wiener degradation process reliability model; Y ^ M is the fitting value of reliability obtained by the reliability model proposed in this paper in Equation (20) or the reliability model using the modified maximum likelihood estimation method in Equation (18); and Y ¯ is the average value of Y M .
After the calculation, the correlation index results are k c p = 0.79 for the model proposed in this paper; k M M L E = 0.72 for the model based on the modified maximum likelihood estimation method. The closer the calculated value is to 1 ( k 0 , 1 ), the more the data follows the assumed distribution model and the more reasonable the distribution is. Therefore, the method proposed in this article is more reasonable than the modified maximum likelihood estimation method.

3.5. Life Assessment of Motorized Spindle Based on Subdistribution Competing Risk Model

From Table 2, the confidence upper and lower limits of the reliability of the motorized spindle sample can be obtained by the proposed method: ( R L ( t | X ( t ) ) , R U ( t | X ( t ) ) ) .
where   R L t | X t = e x p t 1.6472 1988463 e x p β X U X t = e x p t 1.6472 1988463 1.306 3.876 t 0.0858 ; R U t | X t = e x p t 1.6472 1988463 e x p β X L X t = e x p t 1.6472 1988463 1.096 3.876 t 0.0858
The curves of R L t | X t , R U t | X t , R t | X t , and R t are shown in Figure 5.
The life of the motorized spindle is evaluated. At different reliability levels, let T R t | X t be the reliability life estimated by the method proposed in this paper, the corresponding confidence interval of the reliability life is T L ,   T U , let T R t be the reliability life evaluated by the modified maximum likelihood parameter estimation method. The results are shown in Table 3.

4. Analysis

From Figure 3, the spindle reliability curve based on the model presented in this paper R t | X t declines slower than the curve established by the modified maximum likelihood parameter estimation method R t . Assuming that the motorized spindle works 8 h a day and 252 days a year, the reliability of the motorized spindle is 0.575 and 0.4944, respectively, when it works for 1 year. It indicated that the reliability calculated by the competing risk model established in this paper is higher than the other one. It is more coincides with the high-reliability characteristic of the motorized spindle.
From Figure 4, it can be seen that the difference increases at first and then decreases, reaching its maximum at about 2200 h with the value 0.08, which is very small, indicating the rationality of the proposed method. In Figure 5, R ( t ) is also within the confidence interval of product reliability obtained by the method proposed in this paper. In addition, according to the correlation index test method, the correlation index of the model proposed in this paper is 0.79, and the correlation index of the model obtained by the modified maximum likelihood estimation method is 0.72. This shows that the fitting of the method in this paper is closer to reality.
As can be seen from Table 3, T R t | X t is larger than T R t at each reliability value. When the reliability is 0.368, spindle characteristic lifetime can be obtained, and are 2815 h and 2490 h, respectively, it means that about 36.8% of the spindles with the same type have a lifetime of more than 2815 h according to the model proposed in this paper. When the reliability is 0.5, spindle median lifetime can be obtained, and are 2285 h and 1997 h, respectively, which means that about half of the spindles with the same type have a lifetime of more than 2285 h according to the model proposed in this paper, which coincides with the long-life characteristic of the motorized spindle.
According to the characteristics of high reliability and the long life of motorized spindles, the method proposed in this paper is more in line with engineering practice.

5. Conclusions

(1)
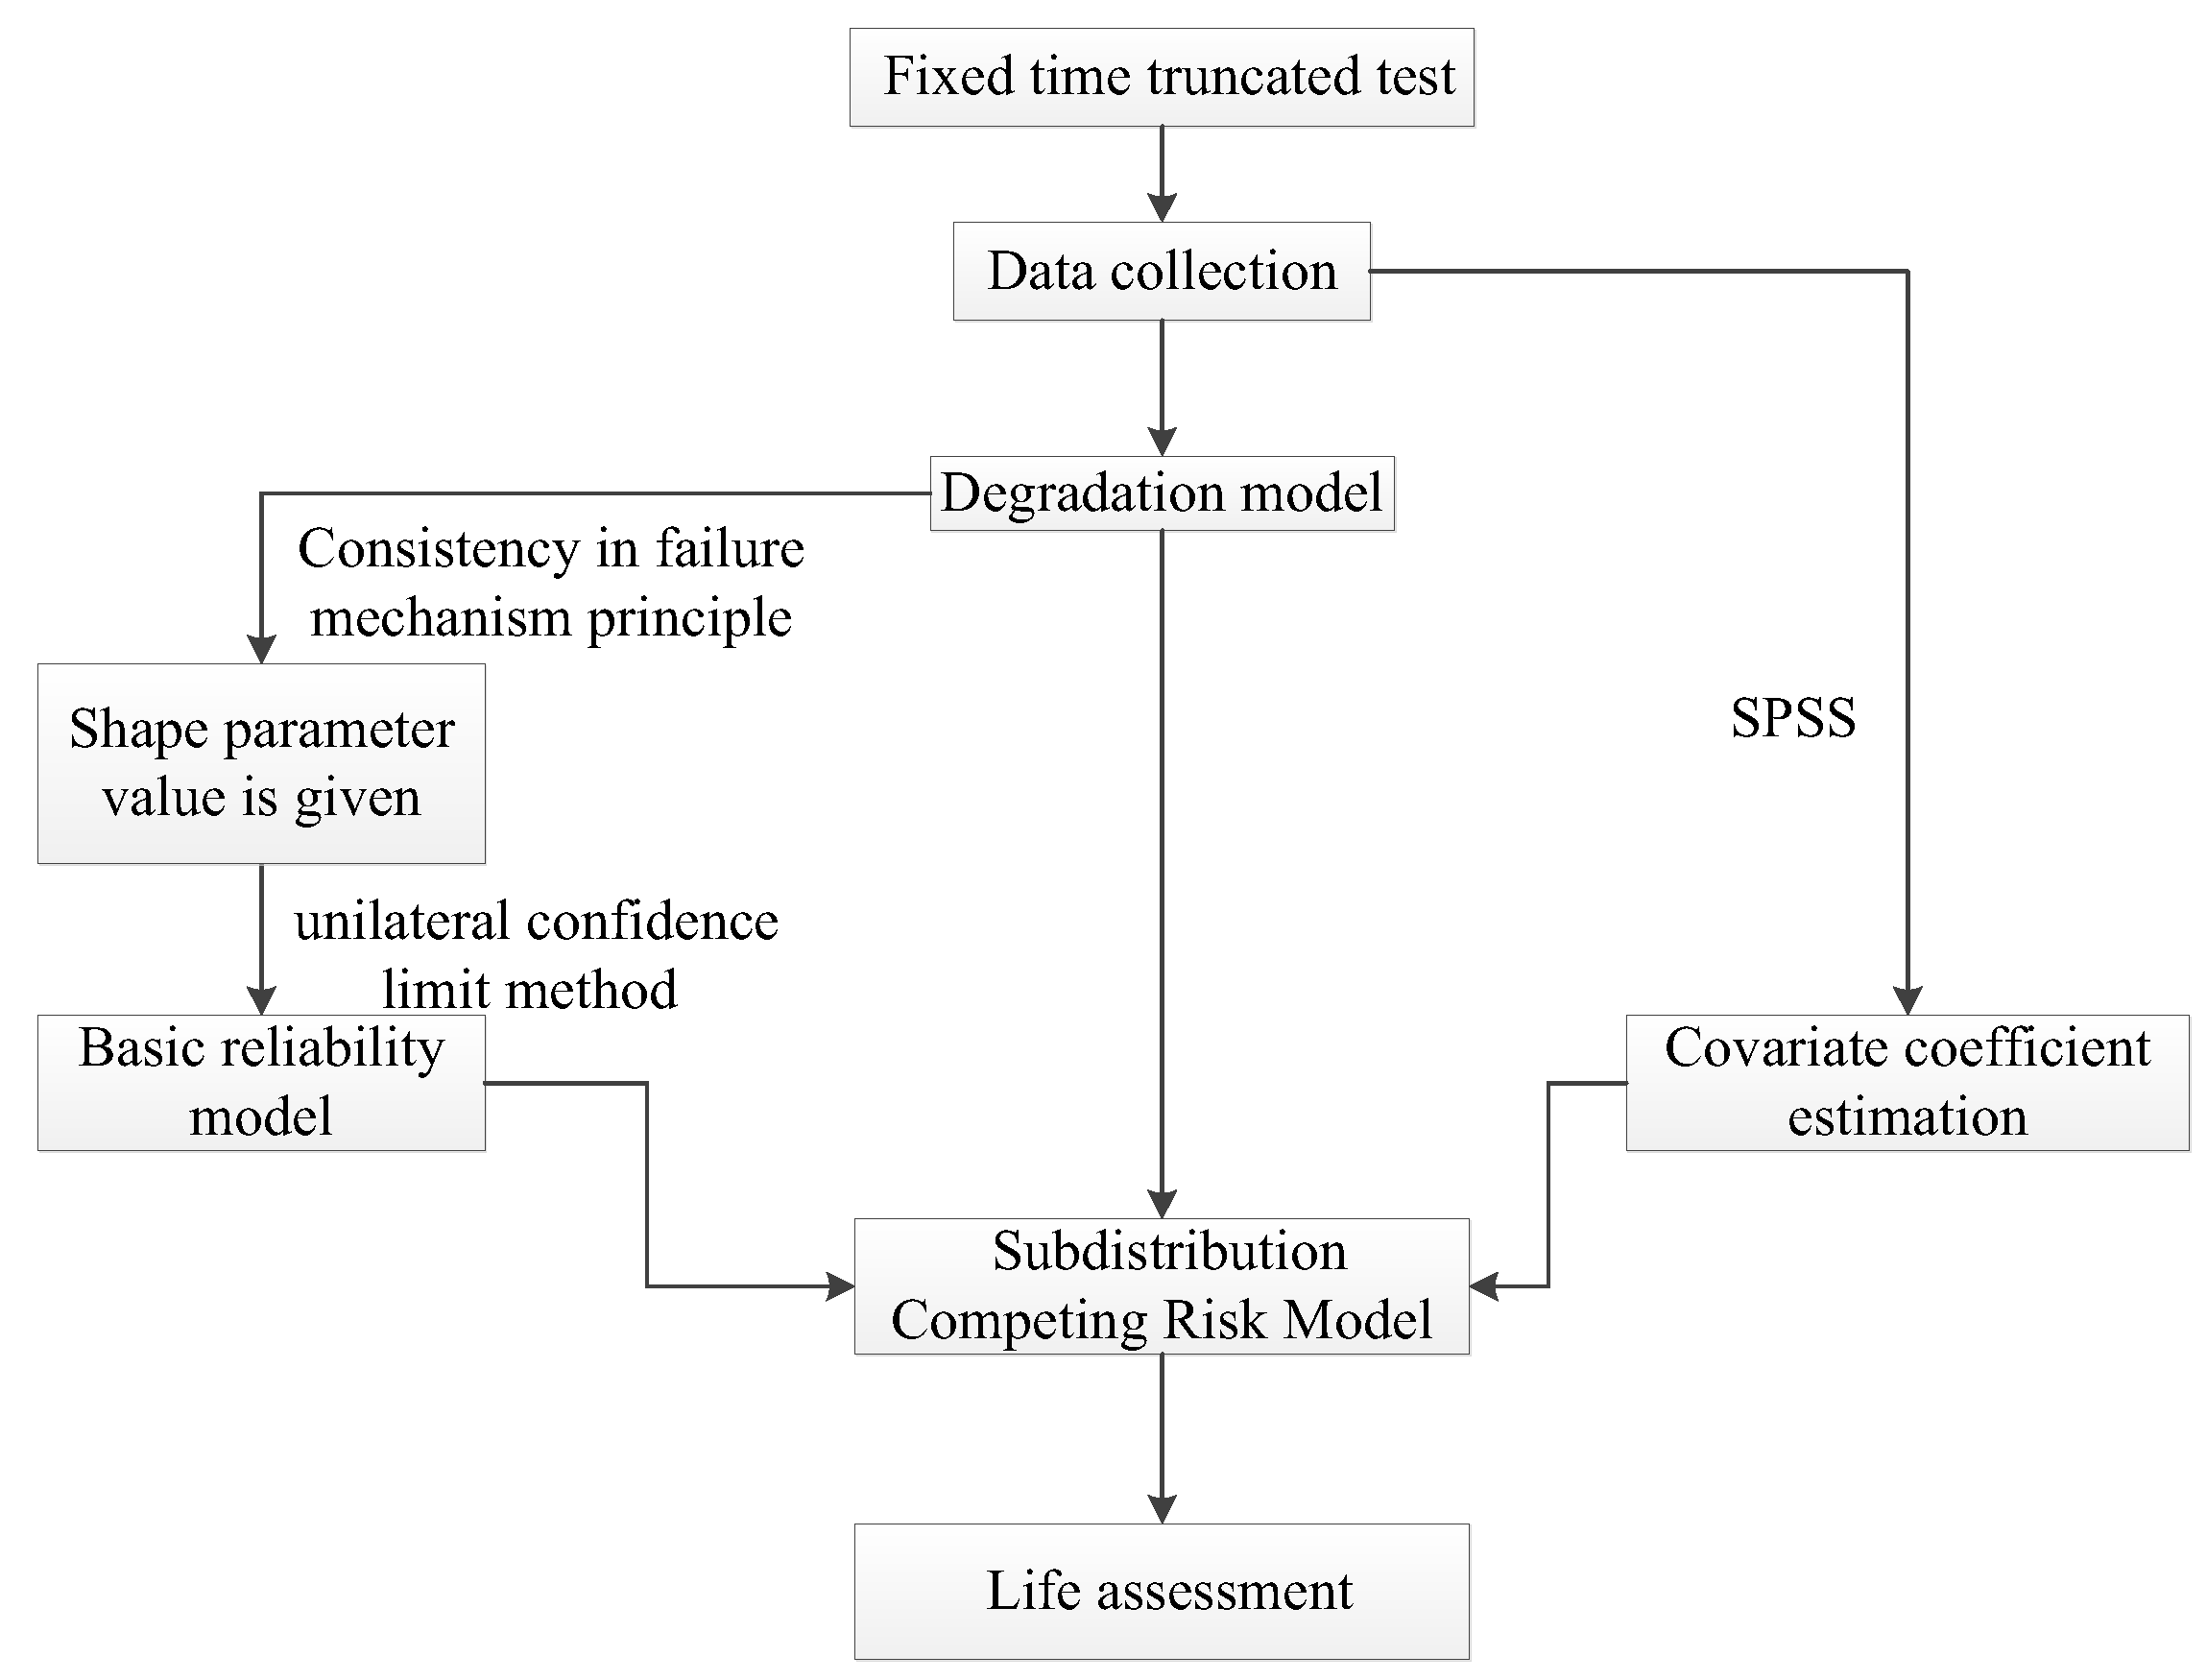
Aimed at fixed time-truncated test with zero traumatic failure data of motorized spindle, supposing that the failure rate ratio of the tested products does not change with time under different stress levels and that performance degradation will lead to traumatic failure, a subdistribution competing risk modeling method from the perspective of competing failure is proposed, and confidence interval estimation of reliability life is obtained. Its modeling principle conforms to the engineering reality.
(2)
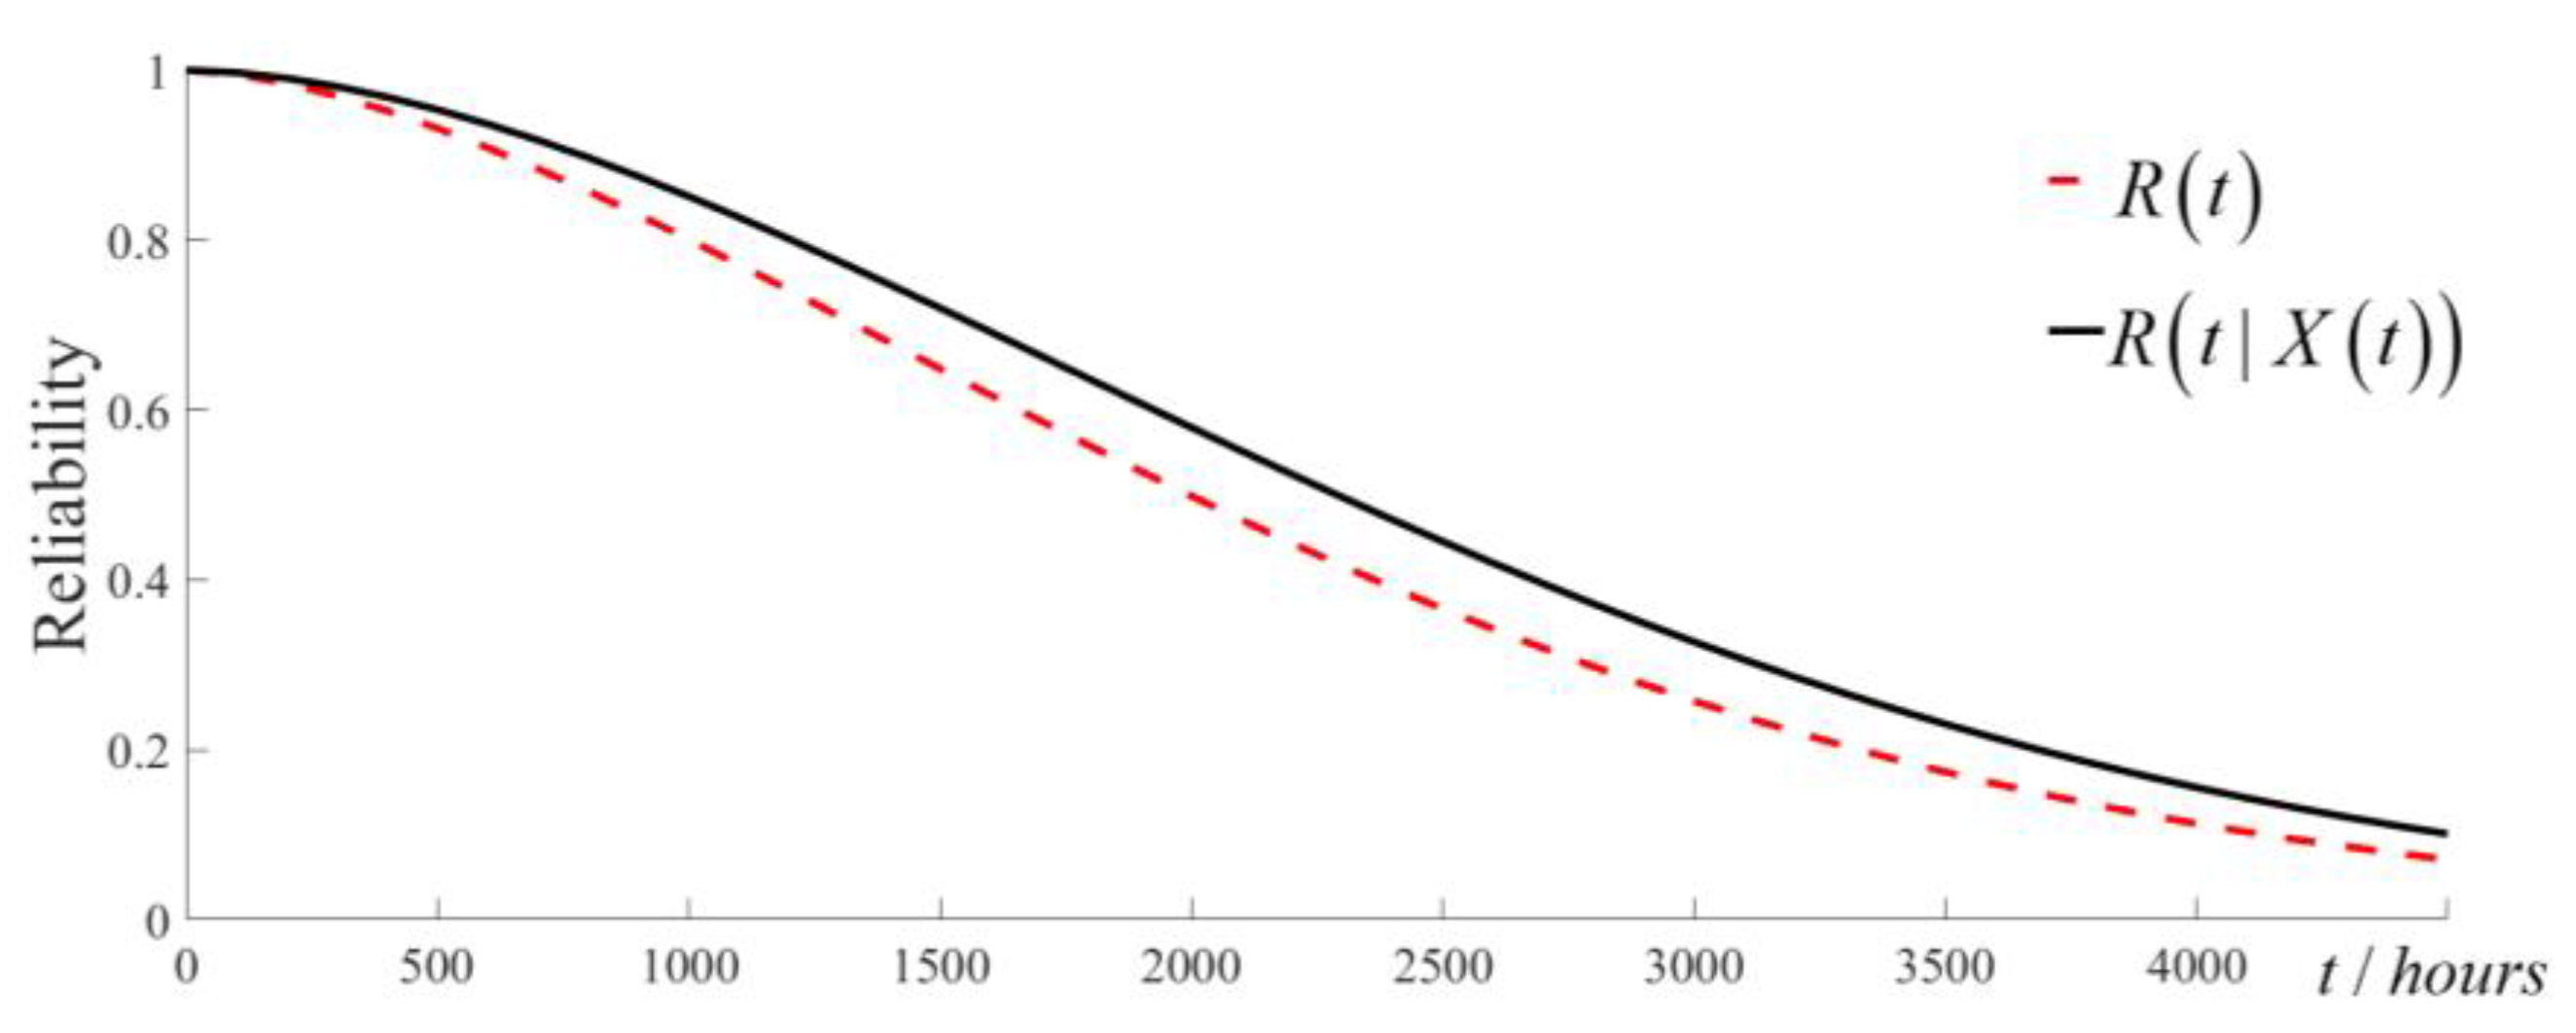
Assessed the life of motorized spindle, at any reliability value, the reliability life estimated by the subdistribution competing risk model is greater than that estimated by the modified maximum likelihood parameter estimation method. Calculated reliability after one-year use, the reliability estimated by the subdistribution competing risk model is greater than the other one. It indicated that the competing risk model established in this paper is more in line with the engineering practice.
(3)
By comparing the reliability values obtained by the two methods, it was found that the maximum difference between the two is 0.08, indicating the rationality of the proposed method. In addition, according to the correlation index test method, the correlation index of the model proposed in this paper is 0.79, and the correlation index of the model obtained by the modified maximum likelihood estimation method is 0.72. This shows that the fitting of the method in this paper is closer to reality.
(4)
The model proposed in this article only considered one performance degradation parameter (axial end radial runout). Future research should simultaneously consider more performance degradation parameters in order to comprehensively evaluate its reliability.

Author Contributions

Conceptualization, Y.Z. (Yingzhi Zhang) and Y.Z. (Yutong Zhou); methodology, Y.Z. (Yingzhi Zhang) and Y.Z. (Yutong Zhou); software, Y.Z. (Yutong Zhou); validation, Y.Z. (Yingzhi Zhang) and Y.Z. (Yutong Zhou); formal analysis, Y.Z. (Yingzhi Zhang); investigation, Y.Z. (Yutong Zhou) and B.C.; resources, Y.Z. (Yingzhi Zhang); data curation, Y.Z. (Yingzhi Zhang); writing—original draft preparation, Y.Z. (Yutong Zhou); writing—review and editing, Y.Z. (Yutong Zhou); visualization, B.C. and H.Z.; supervision, Y.Z. (Yingzhi Zhang); project administration, Y.Z. (Yingzhi Zhang); funding acquisition, Y.Z. (Yingzhi Zhang). All authors have read and agreed to the published version of the manuscript.

Funding

This research was funded by Jilin Province Science and Technology Development Plan Project (grant no. 20190302104GX).

Institutional Review Board Statement

Not applicable.

Informed Consent Statement

Not applicable.

Data Availability Statement

Data can be obtained from the corresponding author upon reasonable request.

Conflicts of Interest

The authors declare no conflict of interest.

References

  1. Jia, X.; Wang, X.L.; Guo, B. Reliability assessment for very few failure data and zero-failure data. J. Mech. Eng. Sci. 2016, 52, 182–188. [Google Scholar] [CrossRef]
  2. Li, H.Y.; Xie, L.Y.; Li, M.; Ren, J.G.; Zhao, B.F.; Zhang, S.J. Reliability assessment of high-quality and long-life products based on zero-failure data. Qual. Reliab. Eng. Int. 2019, 35, 470–482. [Google Scholar] [CrossRef] [Green Version]
  3. Li, H.Y.; Zheng, Z.Y. Reliability Estimation for Zero-Failure Data Based on Confidence Limit Analysis Method. Math. Probl. Eng. 2020, 2020, 7839432. [Google Scholar] [CrossRef]
  4. Zhang, C.W. Weibull parameter estimation and reliability analysis with zero-failure data from high-quality products. Reliab. Eng. Syst. Saf. 2021, 207, 107321. [Google Scholar] [CrossRef]
  5. Fu, H.M.; Zhang, Y.B. Method of reliability analysis for time truncated zero-failure data based on Weibull distribution. J. Aerosp. Power. 2010, 25, 2807–2810. [Google Scholar]
  6. Jiang, P.; Lim, J.H.; Zuo, M.J.; Guo, B. Reliability estimation in a Weibull lifetime distribution with zero-failure field data. Qual. Reliab. Eng. Int. 2010, 26, 691–701. [Google Scholar] [CrossRef]
  7. Byeong, M.M.; Chinuk, L.; Seung-gyo, G.; Byung, T.R.; Suk, J.B. A Bayesian approach for predicting functional reliability of one-shot devices. Int. J. Ind. Eng. 2019, 76, 72–82. [Google Scholar]
  8. Kaufman, L.M.; Johnson, B.W.; Dugan, J.B. Coverage estimation using statistics of the extremes for when testing reveals no failures. IEEE Trans. Comput. 2002, 51, 3–12. [Google Scholar] [CrossRef]
  9. Kayis, S.A. Evaluation of confidence limit estimates of cluster analysis on molecular marker data. J. Sci. Food Agr. 2012, 92, 776–780. [Google Scholar] [CrossRef] [PubMed]
  10. Zhan, W.; Niu, S.W. Analysis of confidence lower limits of reliability and hazard rate for electronic stability control systems. Qual. Reliab. Eng. Int. 2013, 29, 621–629. [Google Scholar]
  11. Han, M. Confidence Limits of Reliability Parameters for Weibull Distribution. J. Mech. Strength 2009, 31, 59–62. [Google Scholar]
  12. Li, H.Y.; Xie, L.Y.; Li, M.; Li, Q.; Zhong, H. Research on a New Reliability Assessment Method for Zero-Failure Data. Acta Armamentarii 2018, 39, 1622–1631. [Google Scholar]
  13. Zi, J.J.; Liu, H.Z.; Jiang, X.; Liu, L.L. Reliability Assessment of Electric Spindle Based on degradation Values Distribution. Chin. J. Mech. Eng.-En. 2014, 25, 807–812. [Google Scholar]
  14. Li, W.H.; Zhou, L.L.; Lu, W.D. Reliability analysis of the sealed relay based on degradation data. IEEJ Trans. Electr. Electron. Eng. 2018, 13, 362–366. [Google Scholar] [CrossRef]
  15. Wang, X.F.; Wang, B.X.; Wu, W.H.; Hong, Y.L. Reliability analysis for accelerated degradation data based on the Wiener process with random effects. Qual. Reliab. Eng. Int. 2020, 36, 1969–1981. [Google Scholar] [CrossRef]
  16. Wei, H.; Ronald, G.A. Reliability analysis of electronic devices with multiple competing failure modes involving performance aging degradation. Qual. Reliab. Eng. Int. 2003, 19, 241–254. [Google Scholar]
  17. Su, C.; Zhang, H. Reliability Assessment Based on Performance Degradation Data and Competing Failure Analysis. J. Mech. Strength 2011, 33, 196–200. [Google Scholar]
  18. Liu, B.L.; Zhang, Z.Q.; Wen, Y.Q.; Kang, S.G.; Guo, Y.X.; Qiu, Q.A. Reliability analysis for complex systems subject to competing failure processes in an uncertain environment. J. Intell. Fuzzy Syst. 2020, 39, 4331–4339. [Google Scholar] [CrossRef]
  19. Bian, L.N.; Wang, G.J.; Liu, P. Reliability analysis for multi-component systems with interdependent competing failure processes. Appl. Math. Model. 2021, 94, 446–459. [Google Scholar] [CrossRef]
  20. Yan, T.; Lei, Y.G.; Li, N.P.; Wang, B.; Wang, W.T. Degradation modeling and remaining useful life prediction for dependent competing failure processes. Reliab. Eng. Syst. Safe. 2021, 212, 107638. [Google Scholar] [CrossRef]
  21. Zeng, Y.N.; Sun, Y.C. A reliability modeling method for the system subject to common cause failures and competing failures. Qual. Reliab. Eng. Int. 2022, 38, 2533–2547. [Google Scholar] [CrossRef]
  22. Gao, H.D.; Kong, D.J.; Sun, Y.X. Reliability modeling and analysis for systems governed by multiple competing failures processes. Proc. Inst. Mech. Eng. Part O J. Risk Reliab. 2022, 236, 256–265. [Google Scholar] [CrossRef]
  23. Wu, J.H.; Xu, D.M. Reliability analysis with competing failure models based on PHM. J. Naval. Univ. Eng. 2007, 19, 46–49. [Google Scholar]
  24. Su, C. System reliability assessment based on Wiener process and competing failure analysis. J. Southeast Univ. 2010, 26, 405–412. [Google Scholar]
  25. Chen, Y.X.; Zhang, Q.; Cai, Z.Y.; Wang, L.L. Storage reliability assessment model based on competition failure of multi-components in missile. J. Syst. Eng. Electron. 2017, 28, 606–616. [Google Scholar]
  26. Qin, L.S.; Chen, X.Y.; Shen, X.J. Reliability assessment of bearings based on competing failure under small sample data. J. Vibr. Shock. 2017, 36, 248–254. [Google Scholar]
  27. Wang, X.G.; Zhang, X.Y.; Yang, L.J.; Ma, R.M. Tool reliability analysis for wear degradation data under competitive failure conditions. Chin. Mech. Eng. 2020, 31, 1672–1677. [Google Scholar]
  28. Bentolhoda, J.; Saurabh, J.; Lance, F.; Ravishankar, K.I. Data-Driven Application-Oriented Reliability Model of a High-Performance Computing System. IEEE Trans. Reliab. 2022, 71, 603–615. [Google Scholar]
  29. Chrisirian, F.S. SPSS Regression Analysis; Electronic Industry Press: Beijing, China, 2015; pp. 218–264. [Google Scholar]
  30. Qiu, R.H.; Ju, K.L.; Dong, Y.G.; Qu, P.G.; Liu, H.Z. Research on Reliability Test Based on Small Sample Motorized Spindle Performance Degradation. Chin. J. Mech. Eng.-En 2016, 27, 2738–2748. [Google Scholar]
  31. Jager, K.J.; van Dijk, P.C.; Zoccali, C.; Dekker, F.W. The analysis of survival data: The Kaplan-Meier method. Kidney Int. 2008, 74, 560–565. [Google Scholar] [CrossRef] [Green Version]
  32. Cox, D.R. Regression models and life-tables. J. R. Stat. Soc. Ser. B 1972, 34, 187–220. [Google Scholar] [CrossRef]
  33. Li, L.L.; Ma, D.J.; Li, Z.G. Cox-Proportional Hazards Modeling in Reliability Analysis—A Study of Electromagnetic Relays Data. IEEE Trans. Compon. Packag. Manuf. Technol. 2015, 5, 1582–1589. [Google Scholar]
  34. Tang, Z.Y.; Zhou, C.K.; Jiang, W.; Zhou, W.J.; Jing, X.P.; Yu, J.H.; Alkali, B.; Sheng, B.J. Analysis of significant factors on cable failure using the cox proportional hazard model. IEEE Trans. Power Deliv. 2021, 29, 951–957. [Google Scholar] [CrossRef] [Green Version]
  35. Mazidi, P.; Bertling, T.; Sanz, B. Wind turbine prognostics and maintenance management based on a hybrid approach of neural networks and a proportional hazards model. Proc. Inst. Mech. Eng. Part O J. Risk Reliab. 2017, 231, 121–129. [Google Scholar] [CrossRef]
  36. Gray, R.J. Modeling Survival Data: Extending the Cox Model. J. Am. Stat. Assoc. 2002, 97, 353–354. [Google Scholar] [CrossRef]
  37. Fine, J.P.; Gray, R.J. A proportional hazards model for the subdistribution of a competing risk. JASA 1999, 94, 496–509. [Google Scholar] [CrossRef]
  38. Chen, J.D.; Sun, W.; Li, B. Confidence Limits in the Case of No Failure Data. Acta Math. Appl. 1995, 18, 90–100. [Google Scholar]
  39. Cox, D.R. Partial likelihood. Biometrika 1975, 62, 269–276. [Google Scholar] [CrossRef]
  40. GJB 899A-2009; Reliability Testing for Qualification and Production Acceptance. General Equipment Department: Beijing, China, 2009.
Figure 1. Competing risk model: an initial state and k mutually independent ending events.
Applsci 13 08230 g001
Figure 2. The process of the construction of subdistribution competing risk model with zero traumatic failure data.
Applsci 13 08230 g002
Figure 3. Reliability curve of R t | X t and R t .
Applsci 13 08230 g003
Figure 4. Reliability difference curve of R t | X t and R t .
Applsci 13 08230 g004
Figure 5. The curves of R L t | X t , R U t | X t , R t | X t , and R t .
Applsci 13 08230 g005
Table 1. Performance degradation test data of motorized spindle (axial end runout) μm.
Time/hDegradation Test DataTime/hDegradation Test Data
1211.424012.9
2411.825213.2
3611.326413.0
4810.527613.4
6010.728813.4
7211.830012.7
8412.631213.0
9612.532413.3
10812.733613.1
12012.034813.2
13212.536014.2
14412.437214.1
15612.438415.0
16812.939614.4
18012.240814.5
19212.742014.4
20413.343213.4
21612.444414.1
22813.3
Table 2. Covariate regression coefficients.
Axial End Runout Calculation Results
β0.185
df1
EXP(β)1.203
p0.01
−2log 31.503
−2log of no-covariates66.435
90% EXP(β) of CI lower1.096
90% EXP(β) of CI upper1.306
Table 3. Reliability life comparison table.
ReliabilityReliability Life/hReliable Life Interval Estimation/h
T R t T R t | X t T L T U
0.3682490281519854288
0.51997228516303454
0.61659190213772890
0.71332157011302340
0.8100012008701770
0.96367705701140
0.95411515385750
0.98233305225432
Disclaimer/Publisher’s Note: The statements, opinions and data contained in all publications are solely those of the individual author(s) and contributor(s) and not of MDPI and/or the editor(s). MDPI and/or the editor(s) disclaim responsibility for any injury to people or property resulting from any ideas, methods, instructions or products referred to in the content.

