Abstract
The content of minerals and bioactive compounds in wine depends on various factors, among which are the origin of the grapes, their phenolic composition, and the winemaking process. This study monitored the physicochemical parameters, phenolic compound contents, and antioxidant capacity of the red grape Vitis vinifera L. “Cabernet Sauvignon” harvested in three Mexican vineyards during the first nine days of the fermentation process. The bioactive compounds and elemental composition (determined by inductively coupled plasma–optical emission spectrometry, ICP-OES) were correlated. The fermentation process decreased from 22 to 5 °Bx in all cases, while the acidity increased from 6.5 to 8 g of tartaric acid/L, decreasing the pH. The phenolic compounds extracted during the winemaking ranged from 1400 to 1600 gallic acid equivalent/L, while the antioxidant capacity was 9 mmol Trolox equivalent. The bioactive compounds identified by HPLC were resveratrol, piceid, catechin, and epicatechin. The presence of Na, Mg, and Fe was correlated with antioxidant capacity, while higher Mn, Pb, Zn, and Cu contents were related to the presence of resveratrol, piceid, and catechin in Cabernet Sauvignon wine. Thus, certain minerals present in the soil that were transferred to the V. vinifera grapes can influence the amount and type of bioactive compounds present in the wine. The phenolic content and, therefore, the organoleptic characteristics of the wine are related to the mineral composition of the vine-growing soil (origin).
1. Introduction
Several studies have demonstrated the relationship between moderate red wine consumption and a lower prevalence of cardiovascular diseases and metabolic syndromes [1,2,3,4]. The impact of red wine consumption on human health is associated with factors such as lower consumption of sweetened beverages in Mediterranean countries [5], but its benefits are also attributed to the phenolic compounds in grapes. Red wine has the highest phenolic content and free-radical-scavenging capacity among other grape products and alcoholic beverages [6]. Red wine also has a natural balance between desirable flavors and bitter components, such as epicatechin, quercetin, rutin, procyanidins, anthocyanins, hydroxybenzoic acid, hydroxycinnamic acid, and resveratrol [7]. The presence of phenolic compounds in the vine and grapes protects plants from adverse environmental conditions, removes reactive oxygen species (ROS), and chelates heavy metals with hydroxyl (-OH) and carboxylic acid (-COOH) [8]. Furthermore, drought conditions are related to increased antioxidant activity [9], and the accumulation of phenols is an adaptive response to abiotic stress.
All the biochemical reactions that occur during the growth of grapes and the different stages of the winemaking process are associated with innumerable factors. The origin of the grapes and the mineral composition of the cultivated soil are the main factors that influence the chemical composition of the fruits and their products. As evidence of the relationship between elemental composition and phenolic components, it has been reported that corn plants (Zea mays L.) increase their catechin and quercetin concentration when grown in soils with aluminum ions, while the betalain level of sugar beets (Beta vulgaris) increases under Cu and Ni stress [10]. Another important factor is the microbiology of the grape, which may be associated with factors such as the insects around the vineyard, which will affect the final quality of the wine [11]; this is just one aspect of the complex matrix involved in winemaking. According to sommeliers and others who work with wine, another important factor related to the taste of wines is the geographic location of the vineyard, which can give some wines “mineral, salty, or marine” flavors [12]. In this example, the saline stress induces a response in the fruit, translating into a higher bioactive compound content [13]. Moreover, higher amounts of antioxidant compounds have also been related to a bitter taste [14]. The wine produced in Baja California, Mexico, has a characteristic mineral flavor [15]. Furthermore, the type and quantity of bioactive compounds are attributed to two main factors: the initial phenolic components of the grapes and the winemaking process. In a previous study, correlations were found between the elemental composition (Sr, Mn, Si, and Pb) of the soil and the phenolic content of Cabernet Sauvignon red grapes [15]. Certain elements, such as zinc in some wines, help prevent diseases caused by viruses and bacteria in the environment. Zinc is important for immune health as it helps stop virus replication. It has been hypothesized that a combination of zinc and a zinc ionophore can reduce the risk of contracting a COVID-19 infection. Researchers have reported using hydroxychloroquine and zinc to prevent COVID-19, but other antioxidants present in wine, such as quercetin and resveratrol, could perform the same function [16,17].
Grapes from the Querétaro and Baja California states were chosen to make the wine and to perform the present study. The individual bioactive components were monitored quantitatively during the fermentation process. The elemental composition of the final product was determined. In addition, the correlation between the mineral composition and the bioactive content was obtained; the results were compared with commercial wines from the same regions and the same Cabernet Sauvignon (CS) grapes. A study of the winemaking residues was included because it has been reported that they contain considerable amounts of bioactive compounds, even after the vinification process; these materials could be used as functional food additives.
We hypothesize that, based on previously reported studies, the fermentation process of the grapes to obtain the wine causes changes in the chemical composition due to the process conditions, such as the time, temperature, type of grape, etc., which was expected with the present study using Mexican wines. Some minerals present in wine have a relationship with the type of bioactive compounds present in wines.
2. Materials and Methods
2.1. Collection of Cabernet Sauvignon (CS) Grapes and Wines
The grapes used for this work were obtained from a vineyard in the state of Querétaro (20°42′ N, 99°52′ W) and two vineyards in the state of Baja California (32°7′ N, 116°31′ W). All of the vineyards had a drip irrigation system, 1.2 m vine-to-vine separation, and 2.2 m row-to-row separation. All grapes were harvested in 2015 when winemakers decided that the grapes were ready for winemaking. The grape samples were identified as Querétaro (QRO), Baja California Valley (BC1), and Baja California Hill (BC2). Samples of 20 kg of grapes were obtained from each vineyard and kept frozen until analysis.
2.2. Winemaking Process
Laboratory-made wines were obtained using 5 kg of grapes in a winemaking process similar to that of López et al. [18]. The grapes were rinsed, mashed to produce a must, and fermented for 9 days. Then, following previous fermentation tests, it was determined that QRO had enough endogenous yeast to ferment in 9 days, while BC1 and BC2 lacked this yeast, so 0.25 g/kg of Saccharomyces cerevisiae Saf-Instant® (Lesaffre México, Toluca, Mexico) yeast was added to achieve fermentation in 9 days. The fermentation occurred under anaerobic conditions and darkness, at 22 °C in a 5 L glass container with an air trap and an outlet for CO2 for 9 days in triplicate for each vineyard sample. The container had a tube for sampling. Each day, 10 mL of the liquid phase was collected. Note: previous fermentation tests were carried out in which it was determined that the QRO sample had enough endogenous yeast to ferment in 9 days, while BC1 and BC2 lacked said yeast. Different doses of added yeast were tested in BC1 and BC2 samples, and it was determined that by using a dose of 0.25 g/Kg of Saccharomyces cerevisiae Saf-Instant® yeast, fermentation was achieved in 9 days.
2.3. Determination of Physicochemical Parameters
During the winemaking process, samples were taken to observe changes in their physicochemical characteristics, such as °Bx using an Abbe refractometer Mod ZWAJ and titratable acidity using volumetric titration with 0.1 M NaOH and expressed as tartaric acid/L. The pH was measured with a glass electrode connected to a HANNA HI2221-01 potentiometer. All measurements were performed in triplicate.
2.4. Antioxidant Properties
Ethanolic extracts. Samples taken during fermentation were analyzed directly (no extraction was performed). The grape samples were extracted by taking 2 g of crushed grapes without breaking the seeds. The extracts were filtered with Whatman 40 paper. Because some methodologies for the extraction of phenolic compounds have been reported in the literature, the extraction tests were performed based on a 22 factorial design with a duplicate center point. The factors studied were stirring time and ethanol percentage, and the best extraction conditions were determined. The design matrix was stirring time (h) and % ethanol (2, 20; 4, 20; 2, 60; 4, 60).
Total phenolic content (TPC). The total phenolic content (TPC) was quantified according to the Folin–Ciocalteu method [19]. Briefly, 0.2 mL of the grape extract or wine sample, 0.2 mL of Folin–Ciocalteu reagent, and 4 mL of 0.7 M Na2CO3 were mixed for 5 min. After 30 min, the absorbance was read using a Thermo Scientific Orion AquaMate 7000 spectrophotometer at 750 nm using gallic acid as the standard. The results were reported as gallic acid equivalents (GAEs/L).
Antioxidant capacity. The antioxidant capacity was determined using 1,1-diphenyl-2-picryl hydrazyl (DPPH). In brief, 15 μL of the grape extract or wine sample was mixed with 4 mL of DPPH in ethanol (100 mM). The absorbance was measured with the same spectrophotometer at 515 nm using the Trolox reagent as a standard to report the Trolox equivalents per liter (TE)/L of the sample [20]. Commercial CS red wines from the same region were purchased and analyzed under the same parameters. Commercial wine from Baja California in 2011 was identified as CBC, and that from Querétaro in 2011 was called CQRO. The reagents used in all the determinations were HPLC-grade and obtained from Sigma-Aldrich, Saint Louis, MO, USA.
2.5. Quantification of Individual Phenolic Compounds
The ethanolic extracts of the grapes and wines were used to determine the individual phenolic compounds using an Agilent Technologies Infinity 1260 high-performance liquid chromatography (HPLC) system coupled to a detector with a diode arrangement. Data were gathered and recorded with OpenLab software. Analyses were performed at 30 °C using a Supelco C-18 column (5 μm particle size, 250–4.6 mm). The mobile phase consisted of a gradient from water (A) to acetonitrile (B), both mixed with 0.5% acetic acid (v/v) at a flow rate of 1 mL/min. The elution program used was based on Breksa et al. [21]. The sample injection and standard volume were 10 μL. The standards used in this study were (−)-epicatechin, and the equation of the standard curve was y = 6173.2x + 11,998; r2 = 0.991, (+)-catechin (y = 10,234x − 12,659, r2 0.9813), trans-resveratrol (y = 60,839x + 93,548; r2 = 0.9843), and piceid (y = 35,155x + 29,189; r2 0.9943). All the standards were HPLC-grade from Sigma-Aldrich.
2.6. Elemental Composition
The elemental compositions of the red wine samples were analyzed using 1 mL of each sample digested with 5 mL of concentrated HNO3, 2 mL of concentrated HCl, and 2 mL of 30% H2O2 in a reaction tube (Pressure Vessel HF 100 MW 3000). The samples were then heated in a Multiwave 3000 microwave system (Anton Paar, Markham, ON, Canada) from 0 to 600 W for 5 min and then maintained at 800 W for 20 min. Samples were adjusted to 25 mL with distilled water, and the elemental composition was determined using inductively coupled plasma–optical emission spectrometry (ICP-OES, PerkinElmer, Waltham, MA, USA) with a 21-standard mix (High-Purity Standards) as a reference. Measurements were performed in triplicate. Graphs were plotted using OriginPro.
2.7. Phenolic Compound Contents of Fermentation Process Residues
The residues obtained from the vinification process were studied by evaluating their phenolic compound contents and antioxidant activity using a microwave oven for the extraction. Casazza et al. [22] used extraction times between 15 and 90 min and found slight increases in the phenolic compound contents. In this work, shorter times were used to prevent rapid increases in high temperatures from degrading the compounds present. Moreover, the experiments were designed using a commercial microwave to determine the influence of time and power to extract the phenolic compounds from the residues. The experiment design was conducted with times from 10 to 30 s with powers of 100 to 300 W using 3 g of residues macerated in 15 mL of acidified 70% ethanol.
2.8. Statistics Analysis
The statistical analysis of the data was carried out using the Minitab 16.1.0 2010 program. The data were reported as mean ± standard deviation of an average of six repetitions. One-way analysis of variance (ANOVA) was performed using Tukey’s method, using 95% confidence to determine significant differences in the comparison of results. Principal component analysis (PCA) was performed to identify correlations among all the studied variables of the nine triplicate samples of wine [23]. Principal component analysis (PCA) is a statistical technique that seeks to synthesize information by reducing the number of variables that explain a phenomenon without this reduction causing a significant loss in information. The main components or factors are a linear combination of the original variables and meeting the condition of being independent of each other, that is, each one of the components will explain the variability of a certain number of the original variables, and the variability that it is not capable of explaining will be explained by the next main factor and so on.
3. Results and Discussion
3.1. Physicochemical Properties
The physicochemical changes during the fermentation of the musts prepared using red CS grapes from three vineyards (QRO, BC1, and BC2) are shown in Figure 1. In general, a decrease in °Bx, an increase in acidity, and a slight decrease in pH were observed. These changes are due to the native yeast present in the grapes, which consumed glucose and caused the decreased °Bx of the red grapes by producing alcohol and CO2, as well as small quantities of lactic acid, succinic acid, and acetic acid [24]. The increase in acidic species explains the small decrease in pH compared to the initial must. Similar results have been reported by [18], who observed increased acidity from 6.8 to 8 g of tartaric acid/L using CS grapes. The changes in the physicochemical characteristics of all the samples were similar and not significantly different (p > 0.05).
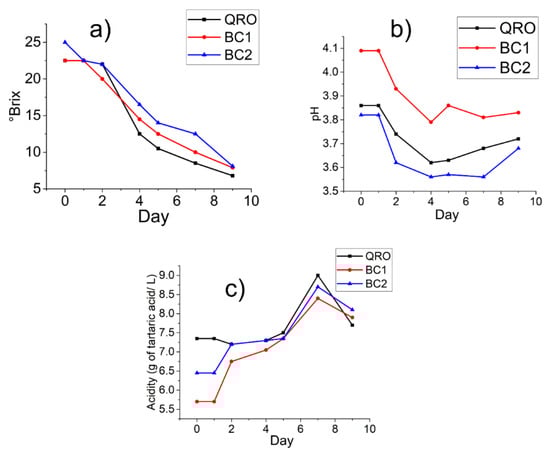
Figure 1.
Physicochemical changes during fermentation of Cabernet Sauvignon grapes harvested in Queretaro (QRO) and Baja California (BC1 and BC2). (a) °Brix, (b) pH, and (c) acidity expressed as g of tartaric acid/L. Each point is the average of n = 3.
The alcohol content of the samples at the end of the fermentation was also determined; the values obtained were as follows: QRO, 12.5; BC1, 13.3; BC2, 13.5; CQRO, 13; and CBC, 13.5 °GL. These values are in the common range of wines, which is from 11.2 to 14.6° G.L. [25]; this indicates that the fermented product obtained in the laboratory had the physicochemical characteristics to be considered wine.
3.2. Ethanolic Extracts
The results of the factorial design are shown in the Pareto chart given in Figure 2a. It shows the degree to which each factor affects the quantification of phenols on Fisher’s F scale. The effect of B (% ethanol) is significant (p < 0.05). These results reinforce the importance of the presence of ethanol to solubilize the phenolic compounds. Without it, both the phenol content and the antioxidant capacity decreased. To determine the best extraction conditions for the phenolic content, a response surface analysis was performed using higher concentrations of ethanol (Figure 2b). The best results occurred for 70% ethanol and 3 h of shaking.
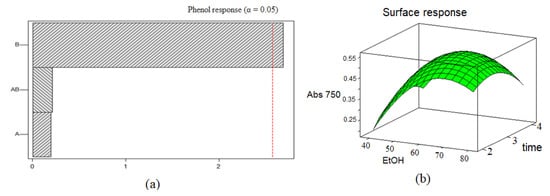
Figure 2.
(a) Pareto chart to determine the main effect on Fisher’s F scale. A: time, B: % ethanol, and AB: time–ethanol. If F > Ftables (dotted line), there was a significant effect. (b) Response surface to quantify phenols.
3.3. Antioxidant Properties
Total phenolic content. The total phenolic contents of the must fermentation of CS red grapes from the QRO, BC1, and BC2 vineyards are shown in Figure 3a, where an increase in the phenolic compounds in the must can be observed throughout the fermentation process. The phenolic content of the QRO samples increased from 500 to 2000 mg GAE/L over 7 days but decreased to 1600 mg GAE/L on the last day of the fermentation process. The decrease in this value is due to the fact that the maximum level of phenolic compounds initiates the polymerization degradation processes; in addition, after a certain amount of contact time between the skin of the grape and the wine, there is no increase in the concentration of phenolic compounds [26].
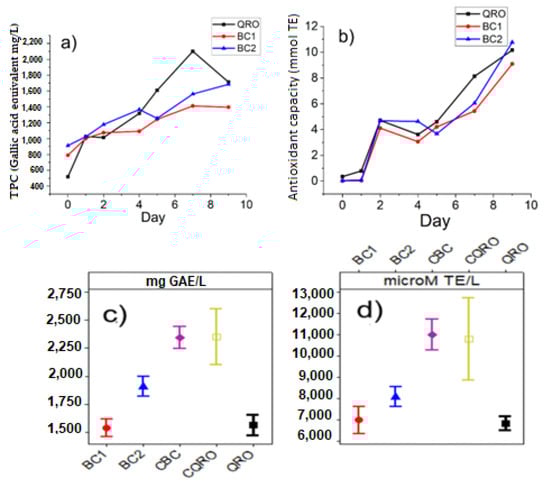
Figure 3.
(a) Total phenolic content (TPC) expressed as mg of gallic acid equivalent per liter. (b) Antioxidant capacity (AC) as mmol of Trolox equivalent during fermentation of Cabernet Sauvignon grapes harvested in Queretaro (QRO) and Baja California (BC1 and BC2). Each point is the average of n = 3. (c,d) Graph of boxes of the content of phenolic compounds and antioxidant activity respectively in lab-made red wine from different regions (one month of storage) and commercial wines (CBC and CQRO).
The phenolic content of BC1 increased from 800 to 1300 mg GAE/L and that of BC2 increased from 900 to 1600 mg GAE/L during the must fermentation. There is no evidence that a longer contact time could increase their concentration in the wine. The TPC during the must fermentation in this study is comparable to those reported in other CS wines, in the range of 900 and 2000 mg GAE/L [26,27].
Antioxidant capacity. The antioxidant capacity of the musts during the fermentation process is shown in Figure 3b. During the first 24 h, the antioxidant capacity was almost 0, but it increased to approximately 4 to 5 mmol TE on the second day. However, it was unstable until the fifth day, when the antioxidant capacity increased to between 9 and 10.5 mmol TE until the end of the test. This behavior has been described by [28]; at the beginning of the fermentation process, the phenolic acids of the grape pulp have no antioxidant capacity, but as the process continues, anthocyanins and flavonoids, such as catechin and epicatechin, can be extracted. These compounds contribute 50% to 60% of the antioxidant capacity. Other authors have reported a range from 6 to 12 mmol TE/L for commercial CS red wines [28,29].
3.4. Storage Time of Laboratory-Made Wine
Filtered and pasteurized laboratory-made wines were stored for a month in darkness at 12 °C. Although the aging time of commercial wines differs from those produced in this work, a comparison of the bioactive compounds present in each sample was made. Figure 3c,d show the total phenolic compounds and antioxidant capacity, respectively, of the laboratory-made wines (QRO, BC1, and BC2) and the commercial CS red wines (CQRO and CBC). The laboratory-made Querétaro wine did not show changes in TPC after one month of storage; however, its antioxidant capacity was reduced after this time. Laboratory-made wines showed a significant difference (p < 0.05) from the commercial wines, which presented higher values. This difference can be explained by the harvest year, the storage time, and the process conditions [30]. Some winemakers consider the mixture of grapes from different vineyards to equilibrate acidity and taste. However, there was no significant difference (p > 0.05) in the antioxidant capacity or total phenolic compounds among the commercial wines from the different zones studied. The BC2 wine had the highest phenolic content and antioxidant capacity. According to our previous work [15], this geographic region is associated with higher Cu, Fe, Al, and Mg contents in grapes, as well as higher soil electrical conductivity and Fe content. Thus, these characteristics are related to higher phenolic compound contents and antioxidant activity in the wines produced here. Nonetheless, in grapes, many factors during the winemaking process can increase the phenolic content, such as the relationship between peel and pulp, pH, and the presence of yeast favoring the extraction of phenolics from the peel of the grape into the wine [18].
3.5. Individual Bioactive Compounds
The phenolic compounds quantified by HPLC in the laboratory-made wines (QRO, BC1, and BC2) and commercial wines (CQRO and CBC) are shown in Table 1. Catechin, epicatechin, piceid, and resveratrol were quantified for each wine sample. Catechin and epicatechin were the most abundant phenolic compounds, and piceid was found at a higher concentration than resveratrol in the red wine samples. The laboratory-made QRO wine had the highest concentrations of catechin and resveratrol. The laboratory-made wine samples had higher epicatechin concentrations but lower piceid concentrations than the commercial wine samples. Conversely, the commercial wine samples had lower epicatechin concentrations but higher piceid concentrations than the laboratory-made wines. Meanwhile, due to condensation and polymerization of catechin and epicatechin during aging in wood barrels, the amounts of catechin and epicatechin decreased, and piceid and resveratrol increased in the commercial wines [31]. Plants produce an amazing diversity of secondary metabolites, like phenolic compounds. They are the most stable products in the plant kingdom. The synthesis and concentration of the accumulated phenolics depend on many internal and external factors, such as plant physiology, age, development stage, climate, and the type of pathogen attack [32].

Table 1.
Individual phenolic compounds in grape and red wine samples.
3.6. Elemental Composition of Red Wine
To explore the correlation between the bioactive compounds of the wines and their mineral contents, their elemental composition was determined. The results are shown in Table 2; the three wine samples contain different amounts of minerals.
Table 2.
Elemental composition of red wines in mg/L.
This variability is similar in grapes and soils from the same vineyards, as reported by Acuña et al. [15]. Kment et al. [33], have reported the same findings when comparing soils and wines: these variations were due to the fabrication process, the bottling and storage conditions, and the heterogeneity of some elements [34]. In our study, the most abundant element was K, with an average content above 10,000 mg/L. A high K content is common in almost all fruits. In wine, tartaric acid forms potassium bitartrate, one of the most abundant components in wine [35], which stabilizes the color of red wine [35]. In contrast, the K content reported is ten times higher than that reported by Kment et al. [33], Gonzalez and Peña [35], and Czibulya et al. [36]. According to winemaking experts, wines from the USA, Mexico, Argentina, and Australia contain more K, Na, and Cl, than wines of other regions, and this is related to seawater. The Cl ion content of European wines is approximately 0.69 mM, while in Australia and America, it averages approximately 3.78 mM [37].
The order of abundance for these elements from most to least was K > Ca > Mg > Na > Fe > Mn in Czech viticulture regions [32]. In the present work, the order was K > Na > Ca > Mg > Fe > Zn > Mn; Na is abundant in Mexican wines, and it is responsible for the mineral taste in red wine [38]. The K and Na contents were higher for BC1, BC2, and CBC than for QRO and CQRO. This trend reflects the higher K and Na contents in Mexican wines, especially in Baja California. In general, the mineral contents in the wines analyzed in this work were higher than those studied by Kment et al. [33]. Therefore, the elemental composition of the wines is determined mainly by the soil in which the vine is grown.
3.7. Principal Component Analysis (PCA)
The PCA to correlate the physicochemical properties, phenolic contents, and elemental compositions of the laboratory-made wines (QRO, BC1, and BC2) and commercial red wines (CQRO and CBC) is shown in Figure 4. The PCA is presented as two axes corresponding to the highest sources of variability, known as the principal components (PC1 and PC2), which correlate variables and characteristics. Dark lines indicate the relationships between the variables and the principal components and among the variables; red points represent sample information and are distributed across the PCA plot. The overlapping dark lines indicate that the variables are related, such as the phenolic content, Na, and the antioxidant activity (in the blue circle); if the variables trend in opposite directions, they have an inverse correlation, such as alcohol and resveratrol content. Finally, if the lines are perpendicular, there is no correlation between variables. The two principal components explain only 55% of the data variation and are sufficient to identify the wine zone.
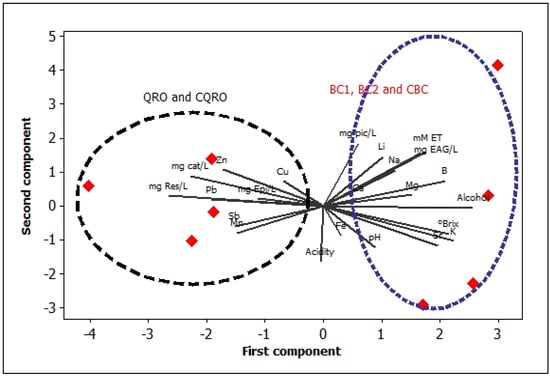
Figure 4.
Principal component analysis (PCA) for correlation among the physicochemical, phenolic, and elemental composition of lab-made red wines from Queretaro (QRO) and Baja California (BC1 and BC2) and commercial Cabernet Sauvignon red wines (CQRO and CBC). Red diamond represents: the BC samples are located on the right and the QRO samples on the left side of the plot.
Some variables, such as resveratrol, potassium, alcohol, and TPC, had the longest lines, which indicates that these variables are associated with the wine zone. An unexpected correlation occurred between the antioxidant activity and the sodium content, which is highly associated with a mineral taste and the geographic localization of the vineyard. However, there was no evidence that the phenolic compounds are related to sodium content, except for a slight connection to the piceid content. Otherwise, heavy metals such as Pb, Mn, and Zn positively correlated with the resveratrol content. A previous study [15] observed that Sr, Mn, and Pb correlated with all of the phenolic compounds and with the antioxidant activity of grapes from QRO. In the corresponding soil, the concentration of Pb was the highest. Mg and Fe were abundant in the grapes and soils from BC1 and BC2. Some metals found in the soils and grapes were also present in the wines, such as Pb for the QRO samples, and there was a slight correlation between Mn and Fe in the BC1 and BC2 wines. Most of the metals had no significant effect in the PCA because the elemental composition of the laboratory-made and commercial red wines was strongly dispersed. In addition to the relationships obtained between the bioactive compounds and minerals in the wine, the presence of resveratrol and zinc in the wines is significant. These are two readily available nutraceuticals known to enhance the immuno-inflammatory response of the body to viral infection (antiviral activity via antioxidants) [17].
3.8. Content of Phenolic Compounds in Residues of the Fermentation Process
After the fermentation process, between 250 and 350 g of residue per kg of grape used was generated. This significant amount of residue is important from a nutraceutical point of view due to its high content of phenolic compounds [25,39]. The content of phenolic compounds in a mixture of the residues obtained using the method in this work was quantified, and an average of 2771 mg EAG/100 g on a dry basis was determined. In order to save time, the experiment design was performed using a commercial microwave to determine the influence of time and power on the extraction of phenolic compounds from grape residues. Casazza et al. [22] used extraction times between 15 and 90 min and reported slightly increased phenolic compound contents. In the present work, much shorter times were used to prevent large increases in temperature from degrading the compounds present. The design was enacted with times between 10 and 30 s and powers from 100 to 300 W on 3 g of residues macerated in 15 mL of 70% acidified ethanol. The results obtained are presented in Table 3.
Table 3.
Recovery of phenolic compounds by short microwave extraction.
The highest recovery percentage was 65% when extraction was performed at 300 W for 30 s. The time factor was significant (p < 0.05); that is, in 30 s, a greater quantity of phenols was recovered than in 10 s of extraction, regardless of the microwave power used (Figure 5). Li et al. [39] reported that phenolic compounds can be extracted from grape seeds using microwaves in 4.6 min, obtaining compounds that are normally determined in a 24 h maceration, and they reported that time is a significant factor in phenol extraction, while potency is not a significant factor.
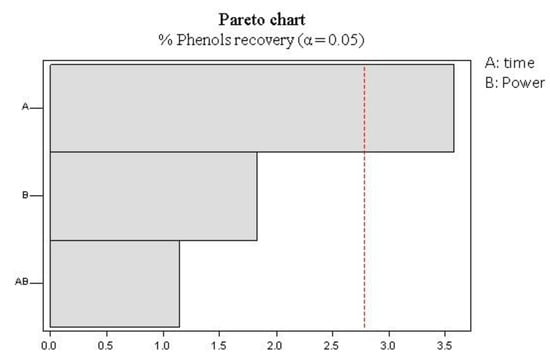
Figure 5.
Pareto diagram, where A: time, B: power, AB: time–power interaction (the x-axis represents Fisher’s F value, and the red dotted line is the error limit allowed when α = 0.05).
4. Conclusions
The physicochemical and antioxidant characteristics of wine samples were used to distinguish wines from two different regions, despite variations in the vineyard age and the climate conditions, which may alter the elemental compositions of the wines. There was a large difference between the elemental composition and the physicochemical characteristics of the laboratory-made and commercial red wines analyzed in this study due to the storage time and origin. Correlations between the Mg, Na, and Fe contents in the wines and the TPC and antioxidant capacity were obtained. The Pb, Zn, Mn, and Cu contents were correlated with resveratrol, piceid, and epicatechin. With the results obtained in this work, some elements, such as Mg, Na, Fe, Pb, Zn, Mn, and Cu, could be related to the bioactivity of red grapes and CS wines. Although studies of this type of relationship between mineral and bioactive elements in wine have already been reported, this study supports the fact that the mineral flavor attributed to wines produced in Baja California (Mexico) can be attributed to the elements in the soil where the wine grape is grown. The principal component analysis allowed for identifying the wine region of origin, either Querétaro or Baja California. In this case, some variables, such as the content of resveratrol, potassium, alcohol, and gallic acid equivalents, could be variables more associated with the origin of these wines. In addition to bioactive compounds, certain minerals, such as zinc and Cu, may also be present in the residues of wine processing; thus, these residues could be used to obtain an extract with functional properties. Microwave extraction allows the recovery of phenolic compounds from residues of the fermentation process of wine with advantageous short times and low temperatures, which does not affect the bioactive content.
Author Contributions
Methodology, P.E.A.-A., M.S.V.-M. and M.T.H.-B.; formal analysis, P.E.A.-A. and S.C.-C.; investigation, M.S.V.-M., O.R.-M. and M.d.S.L.-C.; writing–review & editing, M.d.S.L.-C. All authors have read and agreed to the published version of the manuscript.
Funding
The financial support provided by the Secretary of Research and Postgraduate of Instituto Politécnico Nacional (SIP-IPN) is appreciated (Proyect SIP 20151386 and 20161513).
Institutional Review Board Statement
Not applicable.
Informed Consent Statement
Not applicable.
Data Availability Statement
Not applicable.
Conflicts of Interest
The authors have no competing interest to declare that are relevant to the content of this article.
References
- Artero, A.; Artero, A.; Tarín, J.J.; Cano, A. The impact of moderate wine consumption on health. Maturitas 2015, 80, 3–13. [Google Scholar] [CrossRef] [PubMed]
- Tresserra-Rimbau, A.; Medina-Remón, R.M.; Lamuela-Raventós, M.; Bulló, J.; Salas-Salvadó, D.; Corella, M.; Fitó, A.; Gea, E.; Gómez-Gracia, J.; Lapetra, F.; et al. Moderate red wine consumption is associated with a lower prevalence of the metabolic syndrome in the PREDIMED population. Br. J. Nutr. 2015, 113, S121–S130. [Google Scholar] [CrossRef] [PubMed]
- Snopek, L.; Mlcek, J.; Sochorova, L.; Baron, M.; Hlavacova, I.; Jurikova, T.; Kizek, R.; Sedlackova, E.; Sochor, J. Contribution of red wine consumption to human health protection. Molecules 2018, 23, 1684. [Google Scholar] [CrossRef] [PubMed]
- Liberale, A.L.; Bonaventura, F.; Montecucco, F.; Dallegri, F.; Carbone, F. Impact of red wine consumption on cardiovascular health. Curr. Med. Chem. 2019, 26, 3542–3566. [Google Scholar] [CrossRef] [PubMed]
- Martínez-González, M.A.; Hershey, M.S.; Zazpe, I.; Trichopoulou, A. Transferability of the Mediterranean diet to non-Mediterranean countries. What is and what is not the Mediterranean diet. Nutrients 2017, 9, 1226. [Google Scholar] [CrossRef]
- Moreno-Montoro, M.; Olalla-Herrera, M.; Gimenez-Martinez, R.; Navarro-Alarcon, M.; Rufián-Henares, J.A. Phenolic compounds and antioxidant activity of Spanish commercial grape juices. J. Food Compos. Anal. 2015, 38, 19–26. [Google Scholar] [CrossRef]
- Somkuwar, R.G.; Bhange, M.A.; Oulkar, D.P.; Sharma, A.K.; Shabeer, T.A. Estimation of polyphenols by using HPLC–DAD in red and white wine grape varieties grown under tropical conditions of India. J. Food Sci. Technol. 2018, 55, 4994–5002. [Google Scholar] [CrossRef]
- Chen, S.; Wang, Q.; Lu, H.; Li, J.; Yang, D.; Liu, J.; Yan, C. Phenolic metabolism and related heavy metal tolerance mechanism in Kandelia Obovata under Cd and Zn stress. Ecotoxicol. Environ. Saf. 2019, 169, 134–143. [Google Scholar] [CrossRef] [PubMed]
- Puente-Garza, C.A.; Meza-Miranda, C.; Ochoa-Martínez, D.; García-Lara, S. Effect of in vitro drought stress on phenolic acids, flavonols, saponins, and antioxidant activity in Agave salmiana. Plant Physiol. Biochem. 2017, 115, 400–407. [Google Scholar] [CrossRef]
- Naikoo, M.I.; Dar, M.I.; Raghib, F.; Jaleel, H.; Ahmad, B.; Raina, A.; Ahmad, K.F.; Naushin, F. Role and regulation of plants phenolics in abiotic stress tolerance: An overview. Plant Signal Mol. 2019, 157–168. [Google Scholar] [CrossRef]
- Lam, S.S.; Howell, K.S. Drosophila-associated yeast species in vineyard ecosystems. FEMS Microbiol. Lett. 2015, 362, 170. [Google Scholar] [CrossRef] [PubMed]
- Maltman, A. Minerality in wine: A geological perspective. J. Wine Res. 2013, 24, 169–181. [Google Scholar] [CrossRef]
- Galicia-Campos, E.; Ramos-Solano, B.; Montero-Palmero, M.B.; Gutierrez-Mañero, F.J.; García-Villaraco, A. Management of Plant Physiology with Beneficial Bacteria to Improve Leaf Bioactive Profiles and Plant Adaptation under Saline Stress in Olea europea L. Foods 2020, 9, 57. [Google Scholar] [CrossRef] [PubMed]
- Merkyte, V.; Morozova, K.; Boselli, E.; Scampicchio, M. Fast and simultaneous determination of antioxidant activity, total phenols and bitterness of red wines by a multichannel amperometric electronic tongue. Electroanalysis 2018, 30, 314–319. [Google Scholar] [CrossRef]
- Acuña, P.E.; Vásquez-Murrieta, M.S.; Franco-Hernández, M.O.; López-Cortéz, S. Relationship between the elemental composition of grapeyards and bioactive compounds in the Cabernet Sauvignon grapes Vitis vinífera harvested in Mexico. Food Chem. 2016, 203, 79–85. [Google Scholar] [CrossRef]
- Derwand, R.; Scholz, M.; Zelenko, V. COVID-19 outpatients: Early risk-stratified treatment with zinc plus low-dose hydroxychloroquine and azithromycin: A retrospective case series study. Int. J. Antimicrob. Agents 2020, 56, 106214. [Google Scholar] [CrossRef]
- Kelleni, M.T. Resveratrol-zinc nanoparticles or pterostilbene-zinc: Potential COVID-19 mono and adjuvant therapy. Biomed. Pharmacother. 2021, 139, 111626. [Google Scholar] [CrossRef] [PubMed]
- López, N.; Puértolas, E.; Hernández-Orte, P.; Álvarez, I.; Raso, J. Effect of a pulsed electric field treatment on the anthocyanins composition and other quality parameters of Cabernet Sauvignon freshly fermented model wines obtained after different maceration times. LWT-Food Sci. Technol. 2009, 42, 1225–1231. [Google Scholar] [CrossRef]
- Gerardi, G.; Cavia-Saiz, M.; Rivero-Pérez, M.D.; González-SanJosé, M.L.; Muñiz, P. The dose–response effect on polyphenol bioavailability after intake of white and red wine pomace products by Wistar rats. Food Funct. 2020, 11, 1661–1671. [Google Scholar] [CrossRef]
- Eriotou, E.; Kopsahelis, N.; Lappa, I.; Alimpoumpa, D.; Diamanti, V.; Koulougliotis, D. Identification of Indigenous Yeast Strains from Spontaneous Vinification of Grapes from the Red Variety Avgoustiatis Zakynthou (Ionian Islands, Greece) and Antioxidant Activity of the Produced Wine. J. Food Chem. Nanotechnol. 2020, 6, 48–55. [Google Scholar] [CrossRef]
- Breksa, A.P.; Takeoka, G.R.; Hidalgo, M.B.; Vilches, A.; Vasse, J. Antioxidant activity and phenolic content of 16 raisin grape (Vitis vinifera L.) cultivars and selections. Food Chem. 2010, 121, 740–745. [Google Scholar] [CrossRef]
- Casazza, A.A.; Aliakbarian, B.; Mantegna, S.; Cravotto, G.; Perego, P. Extraction of phenolics from Vitis vinifera wastes using non-conventional techniques. J. Food Eng. 2010, 100, 50–55. [Google Scholar] [CrossRef]
- Franco Hernández, M.O.; Vásquez Murrieta, M.S.; Patiño-Siciliano, A.; Dendooven, L. Heavy metals concentration in plants growing on mine tailings in Central Mexico. Bioresour. Technol. 2010, 101, 3864–3869. [Google Scholar] [CrossRef] [PubMed]
- Lu, Y.; Chua, J.Y.; Huang, D.; Lee, P.R.; Liu, S.Q. Biotransformation of chemical constituents of durian wine with simultaneous alcoholic fermentation by Torulaspora delbrueckii and malolactic fermentation by Oenococcus oeni. Appl. Microbiol. Biot. 2016, 100, 8877–8888. [Google Scholar] [CrossRef]
- Peralbo Molina, Á.; Luque de Castro, M.D. Potential of residues from the Mediterranean agriculture and agrifood industry. Trends Food Sci. Technol. 2013, 32, 16–24. [Google Scholar] [CrossRef]
- Atanacković, M.; Petrović, A.; Jović, S.; Gojković-Bukarica, L.; Bursać, M.; Cvejić, J. Influence of winemaking techniques on the resveratrol content, total phenolic content and antioxidant potential of red wines. Food Chem. 2012, 131, 513–518. [Google Scholar] [CrossRef]
- Cetó, X.; Gutiérrez, J.M.; Gutiérrez, M.; Céspedes, F.; Capdevila, J.; Mínguez, S.; Del Valle, M. Determination of total polyphenol index in wines employing a voltammetric electronic tongue. Anal. Chim. Acta 2012, 732, 172–179. [Google Scholar] [CrossRef] [PubMed]
- Villano, D.; Fernández-Pachón, M.S.; Troncoso, A.M.; García-Parrilla, M.C. Influence of enological practices on the antioxidant activity of wines. Food Chem. 2006, 95, 394–404. [Google Scholar] [CrossRef]
- Mulero, J.; Pardo, F.; Zafrilla, P. Antioxidant activity and phenolic composition of organic and conventional grapes and wines. J. Food Compos. Anal. 2010, 23, 569–574. [Google Scholar] [CrossRef]
- Schwarz, M.; Rodríguez, M.C.; Guillén, D.A.; Barroso, C.G. Evolution of the colour, antioxidant activity and polyphenols in unusually aged Sherry wines. Food Chem. 2012, 133, 271–276. [Google Scholar] [CrossRef]
- Guld, Z.; Racz, A.; Tima, H.; Kallay, M.; Nyitraine Sardy, D. Effects of aging in oak barrels on the trans -resveratrol and anthocyanin concentration of red wines from hungary. Acta Aliment. 2019, 48, 349–357. [Google Scholar] [CrossRef]
- Ozyigit, I.I.; Kahraman, M.V.; Ercan, O. Relation between explant age, total phenols and regeneration response of tissue cultured cotton (Gossypium hirsutum L.). Afr. J. Biotechnol. 2007, 6, 3–8. [Google Scholar]
- Kment, P.; Mihaljevič, M.; Ettler, V.; Šebek, O.; Strnad, L.; Rohlová, L. Differentiation of Czech wines using multielement composition–A comparison with vineyard soil. Food Chem. 2005, 91, 157–165. [Google Scholar] [CrossRef]
- Fiket, Ž.; Mikac, N.; Kniewald, G. Arsenic and other trace elements in wines of eastern Croatia. Food Chem. 2011, 126, 941–947. [Google Scholar] [CrossRef]
- González, G.; Peña-Méndez, E.M. Multivariate data analysis in classification of must and wine from chemical measurements. Eur. Food Res. Technol. 2000, 212, 100–107. [Google Scholar] [CrossRef]
- Czibulya, Z.; Horváth, I.; Kollár, L.; Kunsági-Máté, S. Unexpected effect of potassium ions on the copigmentation in red wines. Food Res. Int. 2012, 45, 272–276. [Google Scholar] [CrossRef]
- De Orduna, R.M. Climate change associated effects on grape and wine quality and production. Food Res. Int. 2010, 43, 1844–1855. [Google Scholar] [CrossRef]
- Cruz, T.L.E.; Esperanza, M.G.; Wrobel, K.; Barrientos, E.Y.; Aguilar, F.J.A.; Wrobel, K. Determination of major and minor elements in Mexican red wines by microwave-induced plasma optical emission spectrometry, evaluating different calibration methods and exploring potential of the obtained data in the assessment of wine provenance. Spectrochim. Acta B Atomic Spectrosc. 2020, 164, 105754. [Google Scholar] [CrossRef]
- Li, Y.; Skouroumounis, G.K.; Elsey, G.M.; Taylor, D.K. Microwave-assistance provides very rapid and efficient extraction of grape seed polyphenols. Food Chem. 2011, 129, 570–576. [Google Scholar] [CrossRef]


Disclaimer/Publisher’s Note: The statements, opinions and data contained in all publications are solely those of the individual author(s) and contributor(s) and not of MDPI and/or the editor(s). MDPI and/or the editor(s) disclaim responsibility for any injury to people or property resulting from any ideas, methods, instructions or products referred to in the content. |
© 2023 by the authors. Licensee MDPI, Basel, Switzerland. This article is an open access article distributed under the terms and conditions of the Creative Commons Attribution (CC BY) license (https://creativecommons.org/licenses/by/4.0/).