Article

Flexural Behavior of Corroded High-Speed Railway Simply Supported Prestressed Concrete Box Girder

1
School of Civil Engineering, Central South University, Changsha 410075, China
2
China Energy Construction Group Shanxi Electric Power Survey and Design Institute Co., Ltd., Taiyuan 030001, China
*
Author to whom correspondence should be addressed.
Appl. Sci. 2023, 13(14), 8396; https://doi.org/10.3390/app13148396
Submission received: 19 June 2023 / Revised: 17 July 2023 / Accepted: 18 July 2023 / Published: 20 July 2023
(This article belongs to the Section Civil Engineering)

Abstract

:
Simply supported prestressed concrete (PC) box girders have been widely adopted in high-speed railway bridges. In complex climatic environments, the corrosion of the prestressing strands always occurs and deteriorates the flexural behavior of PC box girders. In the present study, six T-shaped scaled beams were designed and fabricated according to the specifications for a high-speed railway PC box girder. The corrosion process of the prestressing strand in scaled beams was experimentally simulated by using the constant current accelerated corrosion method. The flexural behavior of corroded high-speed railway simply supported PC box girders was then investigated through four-point bending tests and theoretical investigation. The experimental results showed that strand corrosion significantly decreased the flexural behavior of the test beams. When the mass loss was 12.30%, the cracking load, ultimate load, and ductility decreased by 27.8%, 29.9%, and 11.5%, respectively. The effect of strand corrosion on flexural stiffness displayed a difference before and after concrete cracking. The failure mode changed when strand mass loss was above a critical value (7%). The flexural bearing capacity degradation law of corroded PC beams could be divided into two distinct stages. A strand mass loss of less than 7% could lead to a linear degradation law with a relatively slight reduction. As mass loss increased, it exhibited an exponential and sharp declining trend. An analytical model including the effects of strand cross-section reduction, strand property deterioration, and concrete cracking was also proposed to predict the flexural behavior of corroded PC beams. By comparison with the experimental data, it was found that the model could predict the cracking moment, flexural bearing capacity, and failure mode well.

1. Introduction

Recently, the high-speed railway industry has been developing rapidly worldwide [1]. In China, the mileage of the Chinese high-speed railway reached 40,000 km by 2021, ranking first among all countries and regions. Simply supported prestressed concrete (PC) box girders are used extensively in high-speed railway bridges due to their high strength, excellent resistance to cracking, and outstanding seepage resistance [2]. Complex climatic environments increase the chances of chlorides reaching the surface of the prestressing strands and causing them to corrode [3]. Owing to a high stress level in prestressing strands, the collapse of corroded PC beams usually exhibits a brittle failure without apparent signs [4]. The effect of strand corrosion on flexural behavior deserves in-depth investigation to ensure the safety of corroded PC beams.
The corrosion characteristics and property degradation of corroded prestressing strands are essential for predicting the flexural behavior of PC beams. In general, the degree of strand corrosion is assessed by comparing the mass loss before and after corrosion. However, Li et al. [5] observed that prestressing strands mainly exhibited inhomogeneous corrosion in a chloride salt environment and usually suffered fracture in the most corroded areas. In references [6,7,8], a nonuniform chloride-induced corrosion model was used to estimate the residual area of steel bars, which in turn provided new insights into the seismic response and seismic fragility estimates of aging highway concrete structures. Jeon et al. [9,10] acquired corroded strands from actual structures, and they classified the corrosion pit configuration into three types. By analyzing the reduction in tensile strength and ductility of the corroded strands, they proposed an equivalent stress–strain constitutive model. Furthermore, Vecchi et al. [11] conducted a 3D laser scan of 24 strands within a 10-year-old naturally corroded prestressing beam. They found that the majority of the corrosion pits belonged to Types I and Ⅲ, with only a very small number belonging to Type Ⅱ. Yu et al. [12] adopted the constant current accelerated corrosion method to investigate the effect of different mass losses on the degradation of strand mechanical properties. Then, a bilinear constitutive model for corroded prestressing strands was proposed.
However, there is excellent scope for exploring flexural behavior such as the flexural stiffness, cracking moment, and ultimate bearing capacity of corroded PC beams. Strand corrosion could decrease the flexural stiffness of PC beams because it induces prestress [13,14,15]. Harries et al. [16] tested the flexural bearing capacity of two concrete box girders serviced for 42 years. They found that strand corrosion could cause reduced flexural bearing capacity. Rinaldi et al. [17] experimentally investigated the flexural properties of nine pretensioned PC beams with different mass losses. They observed that when the strand mass loss was higher than 7%, the failure mode of the PC beams changed. The test beams had two different failure modes: concrete crushing and wire rupture. Through 10 specimens with different strand mass losses, Wang et al. [18] found that the degree of bond degradation and the mass loss were not simply linear. In addition, considering the cross-section reduction and mechanical property degradation of the corroded strand, some empirical models [19,20,21] were proposed to predict the flexural behavior of corroded PC beams.
The above-mentioned flexural experiments have achieved some research results, but specific investigation of the flexural behavior of corroded high-speed railway simply supported PC box girders is limited. In addition, there are fewer empirical models for cracking moment prediction, and the above empirical models cannot predict the failure mode of corroded PC beams. In the present study, six T-shaped scaled beams were designed and fabricated according to the specifications for a high-speed railway PC box girder. The corrosion process of the prestressing strands in scaled beams was simulated by using the constant current accelerated corrosion method. The flexural behavior of scaled beams was revealed through four-point bending tests. Afterward, an analytical model including the effects of strand cross-section reduction, strand property deterioration, and concrete cracking was proposed and verified by comparison with the experimental results. This study can provide some useful suggestions for assessing the flexural behavior of the high-speed railway simply supported PC box girder subjected to complex climatic environments.

2. Experiment Details

2.1. Design and Fabrication of Scaled Beams

The present experimental study is mainly concerned with the flexural behavior of PC box girders. As the prototype box girder was not suitable for carrying out series tests, we first designed the scaled beam according to the similarity theory [22,23,24]. The standard 32 m double-line PC simply supported box girder of Chinese high-speed railway bridges (referred to as 2322A-II in Tong Bridge (2008)) was taken as the prototype structure. This prototype structure is a typical single-box, single-room PC box girder with equal height, whose length and width are 32.6 m and 12.0 m, respectively. To arrange the prestressing strands at 120–140 kN/m prestress, a total of 246 strands were required. Detailed dimensions of the PC box girder are shown in Figure 1.
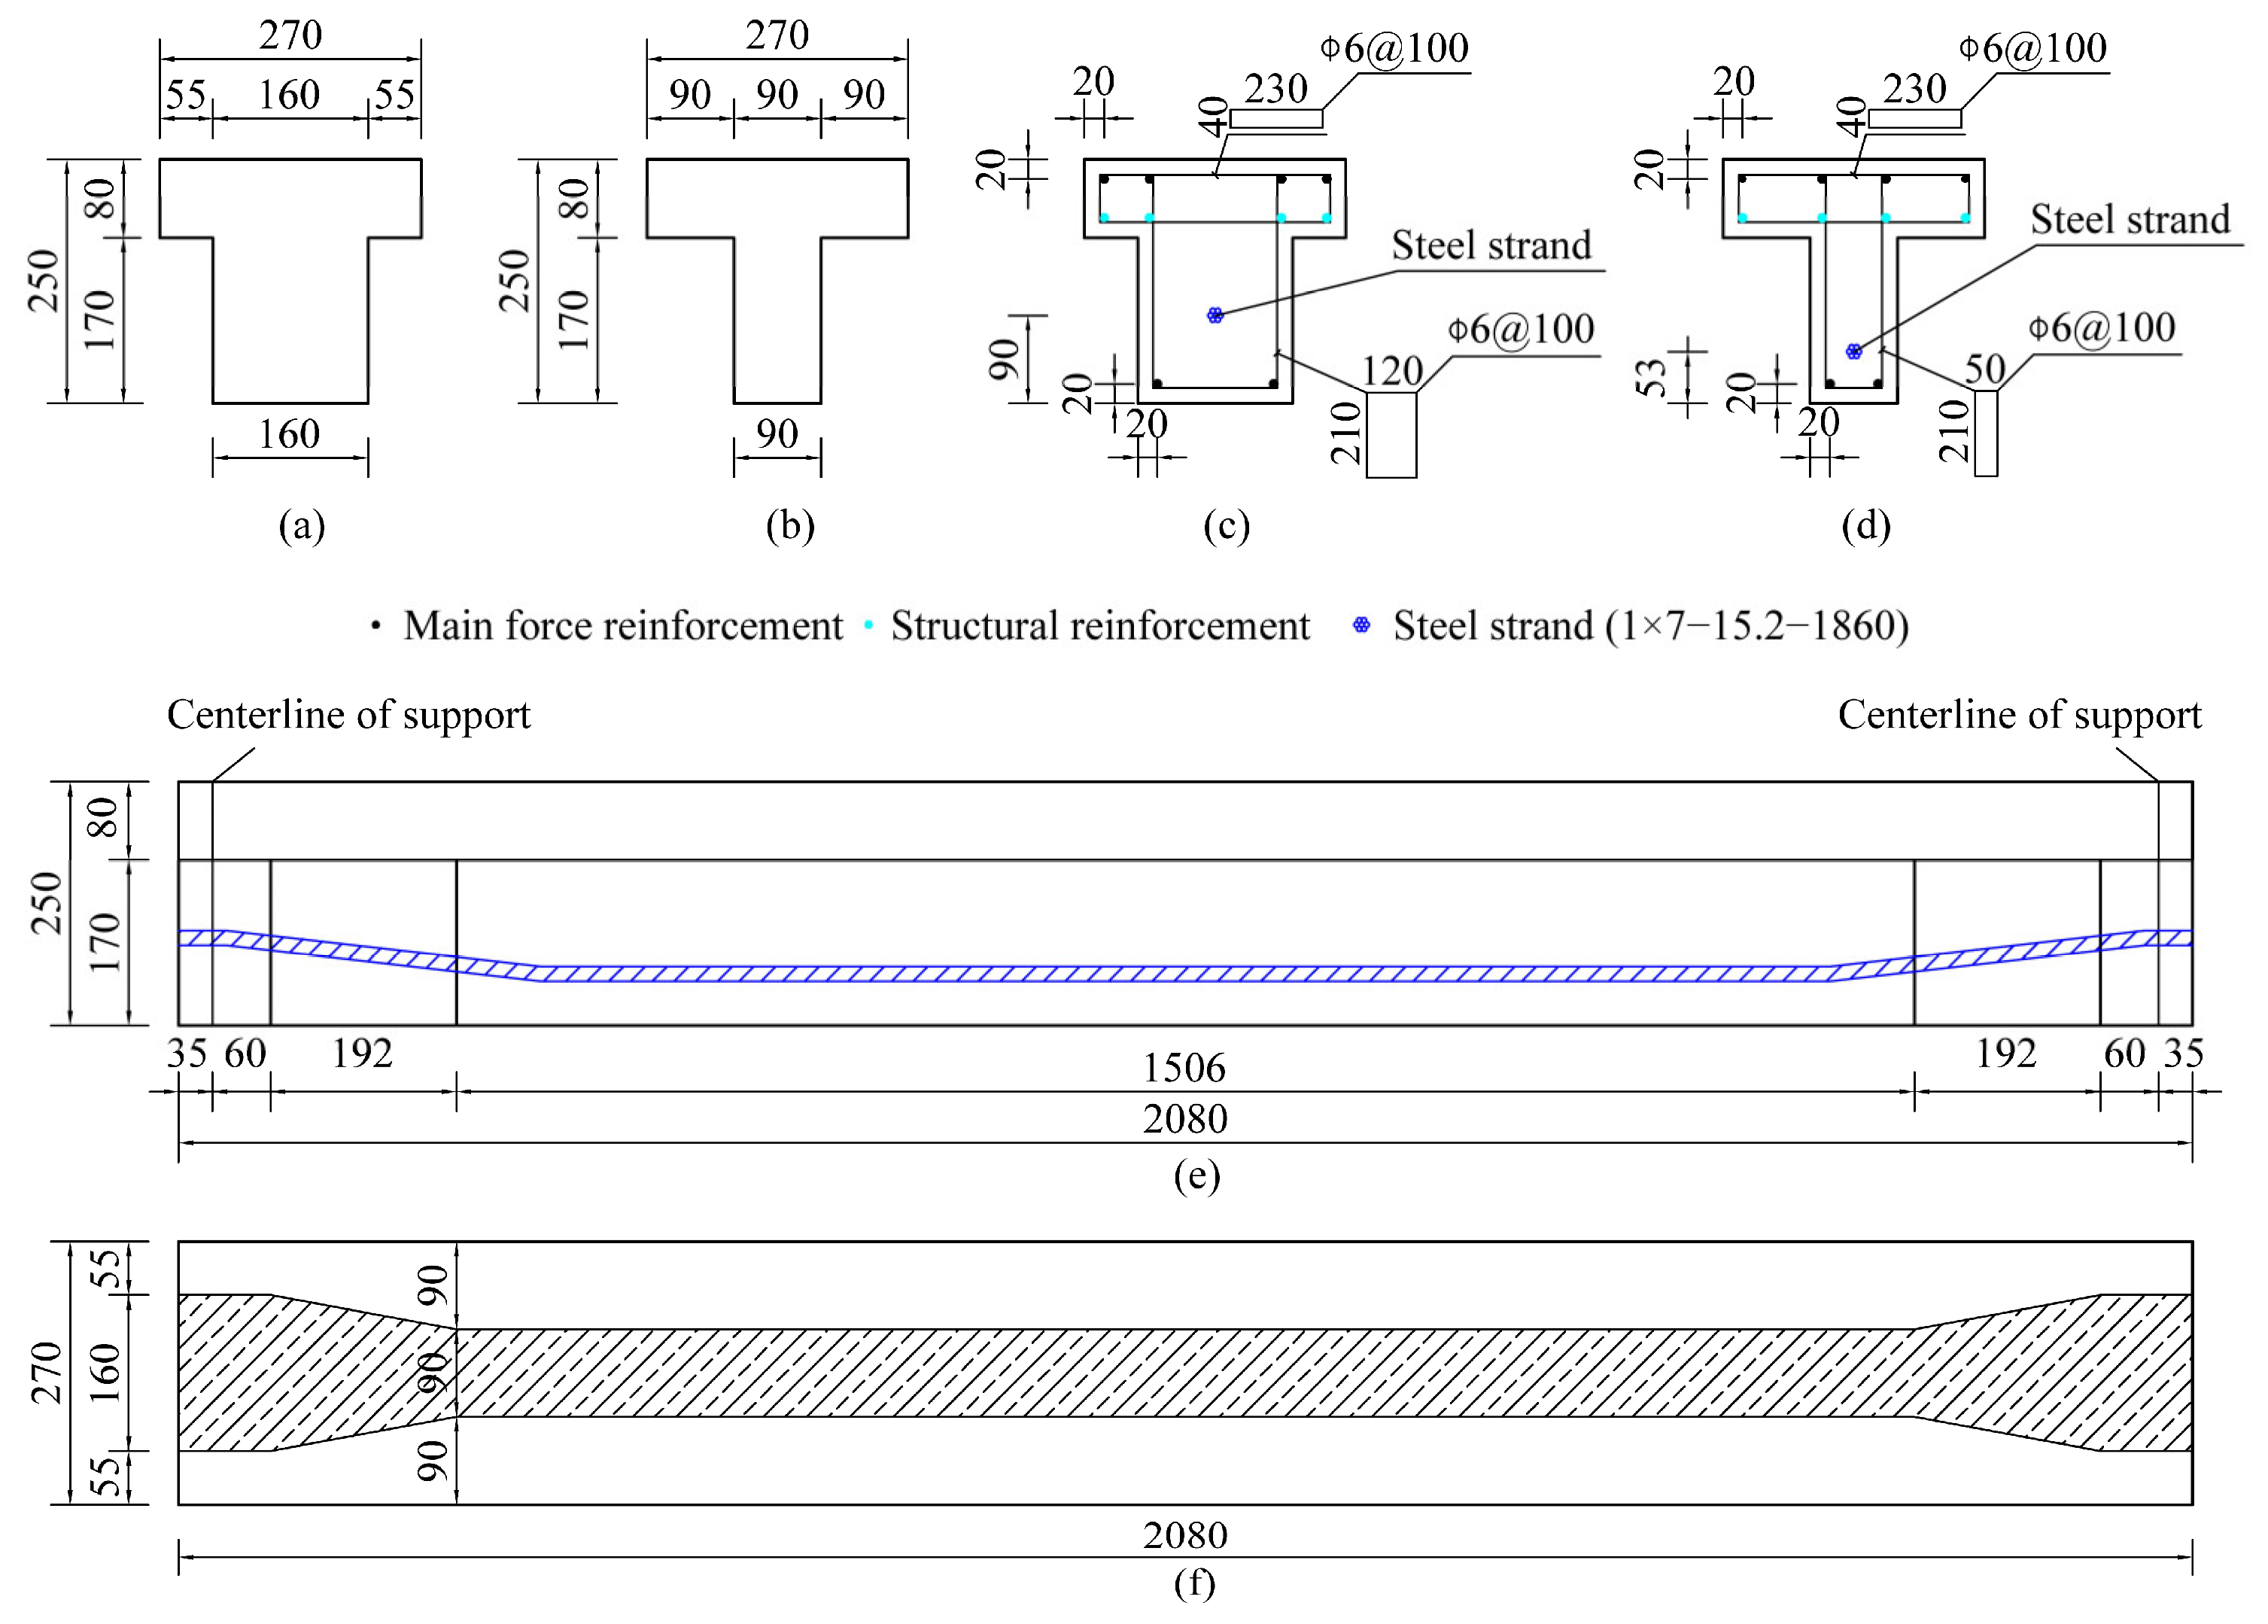
Similarity theory in structural testing needs to follow both geometric similarity and physical similarity requirements. Geometric similarity means that the linear dimensions, cross-section area, section moment of inertia corresponding to the prototype structure, and scaled beam are in a certain proportion. The beam should be designed as a scaled box beam, but the web and bottom plates in this condition were too thin to be fabricated. Therefore, the test beam was designed as a T-section by matching the flexural stiffness of the scaled box beam. To arrange only one strand in the test beam for subsequent analysis of the effect of strand mass loss on the flexural properties of the test beam, the scale ratio was set as 1:15.68 according to the principle of prestressing similarity. The dimensions of the scaled beam were calculated and are shown in Figure 2. Table 1 compares some geometric parameters of the scaled beam and the prototype structure. The theoretical similarity ratio and actual similarity ratio are, respectively, the design scale ratio and measured scale ratio of the model beams. Small differences can be found between these two similar ratios due to the construction, fabrication, and concrete protective layer requirements of the specimens. However, the differences are relatively small, which indicates that the dimensions of the model beam were chosen reasonably.
Physical similarity requires the stress, strain, stiffness, and deformation to be similar between the scaled beam and the prototype structure. All materials used for the scaled beam were therefore strictly consistent with the prototype structure. The standard value of concrete strength was designed to be 50 MPa, a grade of C50 in the Chinese code [25]. To match the concrete mix ratio of the prototype structure exactly (as shown in Table 2), the laboratory self-mixing method was used to fabricate the test beam. The gelling materials included 425# low-alkali silicate cement, first-grade fly ash, and S95-grade finely ground mineral powder. Three standard cubic concrete specimens were cast simultaneously as the test beam. Due to the uneven mixture in the laboratory, the measured 28-day compressive strength was 45.24 MPa [25], which was slightly lower than the design value. The prototype girder has a total of 246 seven-wire strands. According to the similarity requirement of effective prestress, the scaled beams had only one seven-wire strand with an outer diameter of 15.2 mm and a standard ultimate strength of 1860 MPa. A metal bellow with a diameter of 50 mm was used to fix the strand position. In addition, the normal reinforcement bars of the scaled beams were calculated according to the similarity requirement of normal stress and constructional requirements of T-shaped beams. Eight HRB335 bars with a diameter of 8 mm at the top and two HRB335 bars with a diameter of 8 mm at the bottom were used as non-prestressed reinforcement. A stirrup with a diameter of 6 mm, spacing of 100 mm, and a grade of 235 MPa was used to resist external shear forces. The arrangement of reinforcement bars of the scaled specimen is shown in Figure 2. Table 3 briefly reports the uncorroded mechanical properties obtained from standard tensile tests [26].
Six T-shaped scaled beams, L1, L2, L3, L4, L5, and L6, were fabricated using the post-tension method. After pouring concrete and removing formwork, the beams were cured using the steam curing method for 28 days. The strand in scaled beams was prestressed by controlling both tension and elongation indexes, with an initial strand prestress of 0.72 times the yield strength. According to the similarity theory, the final tensioning control stress was set as 157 kN, and the corresponding elongation was 12 mm. The grout (425# ordinary silicate cement:grouting agent:water = 1370:152.3:487) was injected into the metal bellow with a high-pressure grouting pump.

2.2. Corrosion Scheme

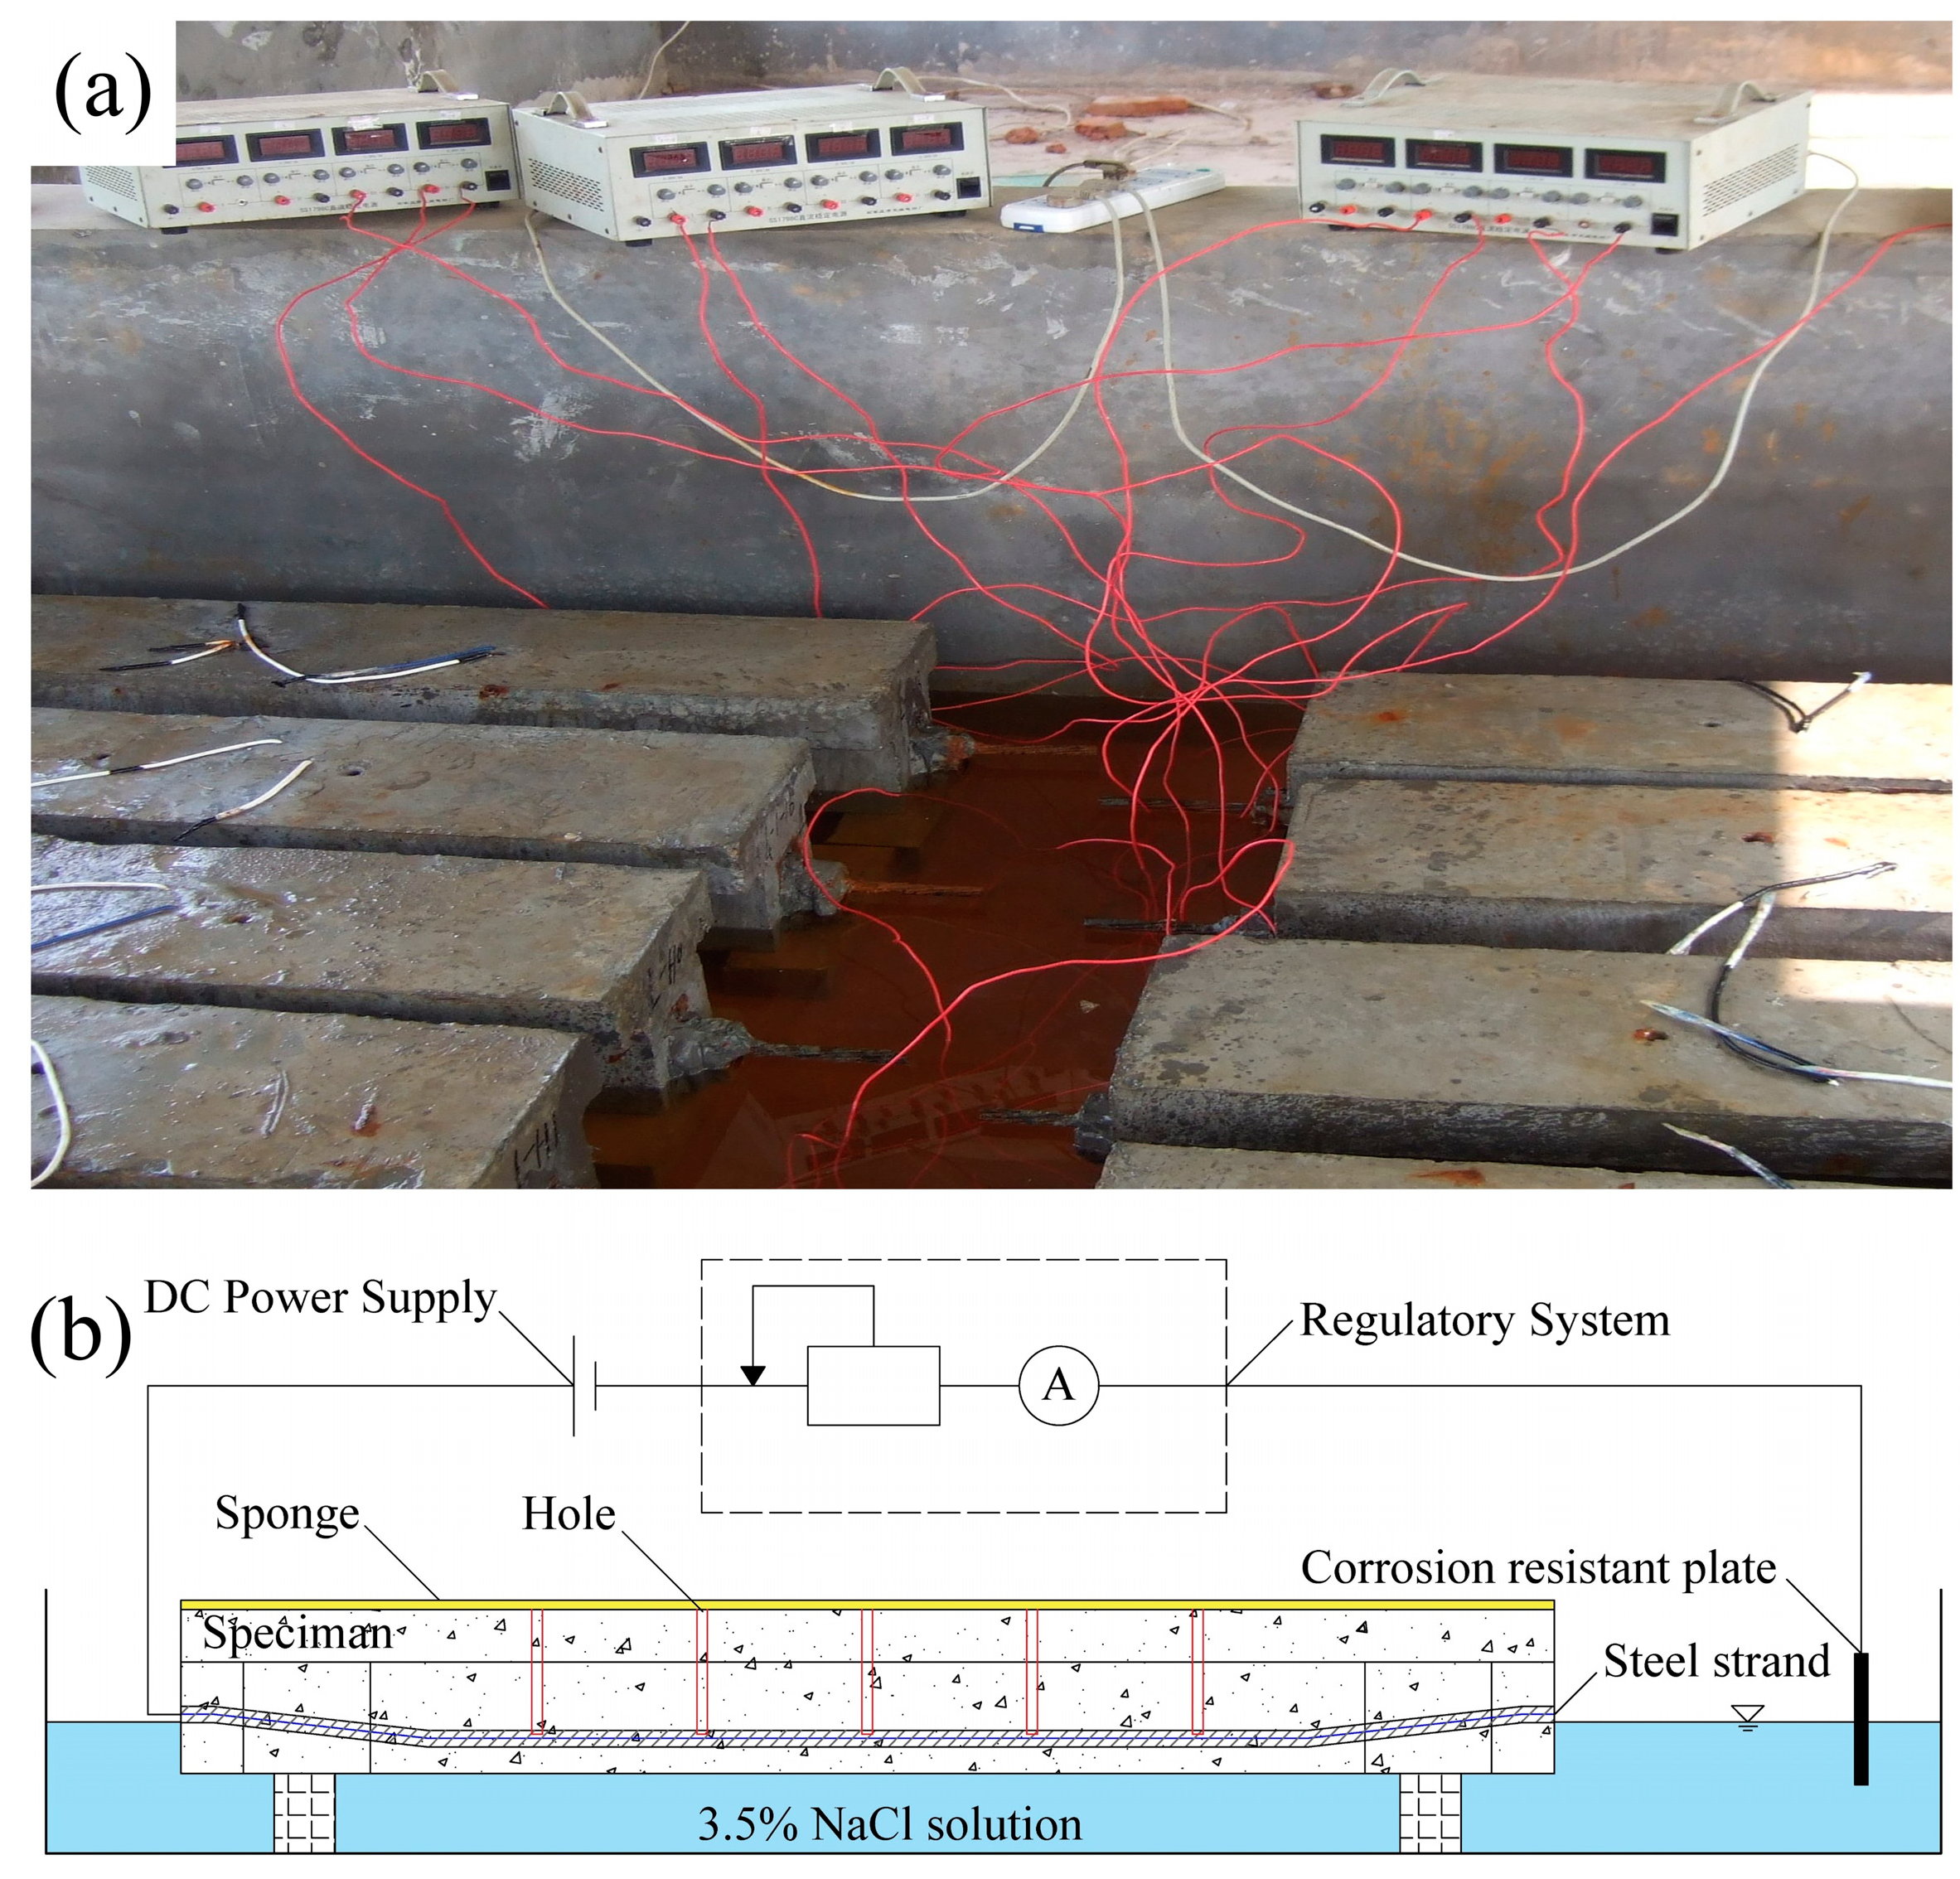
Among six scaled beams, specimen L1 was used as a comparison beam, and the other five specimens were subjected to the constant current accelerated corrosion method [27]. Scaled beams were semi-soaked in a 3.5% NaCl solution, and the horizontal level of the NaCl solution approached but did not exceed the position of the strand. To ensure the chloride-induced corrosion process took place, the scaled beams were drilled with five small holes [28]. A 7 cm thick sponge was placed on the surface of scaled beams. The 3.5% mass concentration NaCl solution was poured on the sponge three times a day to keep the sponge moist. The strand was connected to the positive electrode of the DC power supply. It would lose electrons, thus causing mass loss. A corrosion-resistant plate was soaked in sodium chloride solution and connected to the negative electrode of the DC power supply to form an electrolytic cell. Figure 3 shows a schematic diagram of the constant current accelerated corrosion method.
As shown in Table 4, the corrosion time required to reach each corrosion level was estimated using Faraday’s second law of electrolysis [29,30]. The corrosion current density applied in this test was 980 μA/cm2, which is approximately 100 times higher than the figure observed for steel under natural conditions. After the accelerated corrosion process, the four-point bending test was performed to reveal the flexural behavior. Then, the scaled beams were broken open and corroded strands were carefully taken out. Each strand was cut into five 40 cm long pieces. They were acid washed with 12% hydrochloric acid, dried, and weighed on an electronic balance with an accuracy of 0.01 g. The average mass losses of the five strand sections were taken as the actual mass losses (ρ) of the scaled beam, which were 0%, 2.12%, 4.06%, 6.28%, 7.84%, and 12.30%, respectively. In addition, the standard deviation of the mass loss gradually became larger as the energization time increased.

2.3. Four-Point Bending Test

The static four-point bending tests of scaled beams were carried out using a hydraulic jack with a maximum capacity of 50 tons and a distribution steel beam (as shown in Figure 4). The loading process included preloading and formal loading, which were applied step by step. To check that all parts of the contact and instruments were fine, three preloads to 30 kN were carried out. The formal loading phase was divided into two stages: force control and displacement control. The load first rose approximately 10 kN at each step until the concrete cracked. After the scaled beams cracked, the loading stage was controlled using midspan deflection, with an increment of 0.5 mm per step. After each load step, the test beam was left to rest for 2 min and the data were then recorded. In this test, five dial indicators with an accuracy of 1/1000 mm and a range of 100 mm were used to measure the vertical deflection. Finally, the loading was stopped until the concrete was crushed or the strand ruptured.

3. Analytical Model

3.1. Impact of Strand Corrosion

It was discovered that the effects of strand corrosion on flexural behavior mainly include the following four aspects: strand cross-section reduction, strand property degradation, concrete cracking in the tensile zone, and the deterioration of the bond between surrounding grouting and strands. As post-tensioned prestressed beams transfer force through anchorages, the deterioration of the bond has little effect on the flexural behavior of PC beams [31]. Thus, the analytical model in this paper takes into account the former three aspects.

3.1.1. Strand Cross-Section Reduction

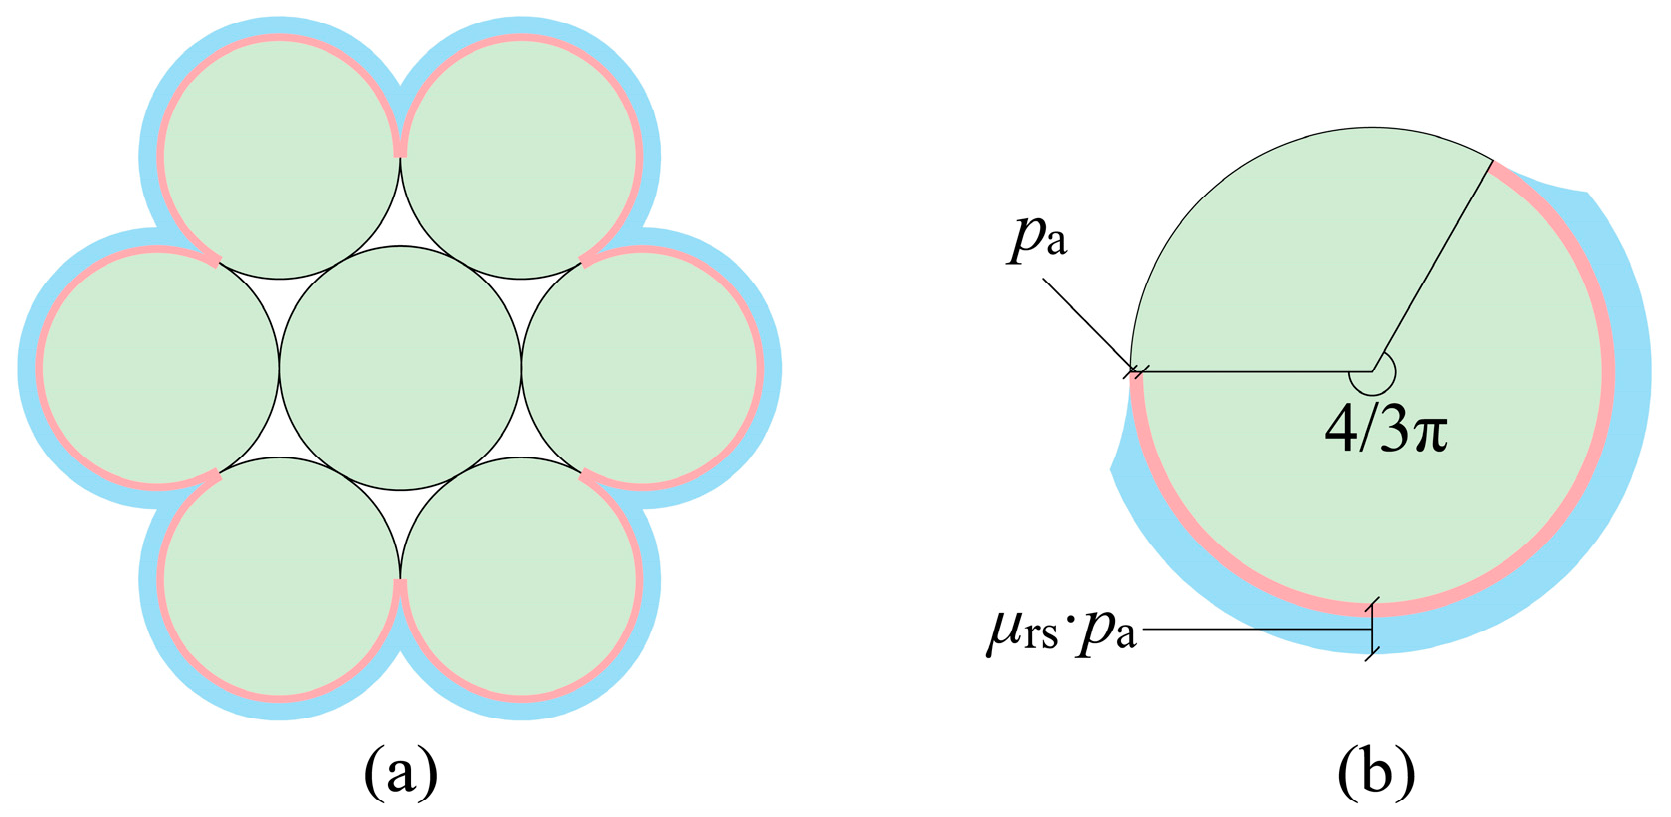
In the present study, the seven-wire strand was adopted. As shown in Figure 5, it is generally assumed that strand corrosion can only occur on the external surface [11,32,33]. For chloride-induced corrosion, there are many suggestions [34,35,36] to use the hemispherical corrosion pit model to calculate the remaining area; the predictions are well in agreement with the tests.
The area reduced by corrosion (Ac) of an external wire is calculated as follows:
A c = A 1 + A 2 ,   p m 2 2 D 0 π D 0 2 4 A 1 + A 2 ,   2 2 D 0 p m D 0 π D 0 2 4 ,   p m > D 0  
where D0 is the initial nominal diameter of the external wire, which is 5.025 mm in this test; pm is the maximum corrosion depth; and A1 and A2 are the areas of the blue and pink parts of Figure 5, respectively.
The other parameters in Equation (1) are given as follows:
A 1 = 1 2 θ 1 D 0 2 2 a D 0 2 p m 2 D 0 ; A 2 = 1 2 θ 2 p m 2 a p m 2 D 0
a = 2 p m 1 p m D 0 2
θ 1 = 2 arcsin a D 0 ; θ 2 = 2 arcsin a 2 p m
According to Vecchi et al. [11], there is a ratio (R) between the maximum corrosion depth and the average corrosion depth of the corroded prestressing strand, ranging from 2.93 to 15.05. Since there is no well-developed model for the stochastic distribution of the corrosion penetration factor of prestressed strands, the parameter in this analytical model is taken similarly to reference [21]; here, it is taken as the mean value R = 9.
R = p m p a = p m D 0 1 1 ρ / 2
where pa is the average corrosion depth.
To simplify the analysis, six external wires share the same corrosion pit depth. The remaining area Ap,ρ is given by Equation (6).
A p , ρ = π 4 D 1 2 + 6 π 4 D 0 2 A c
where D1 is the initial nominal diameter of the middle wire, which is 5.15 mm in this test.

3.1.2. Strand Property Degradation

Corrosion can deteriorate the mechanical properties, i.e., yield strength, ultimate strength, elasticity modulus, and ultimate strain, of the prestressing strand. In the present study, the degradation models proposed by Yu et al. [12] and Li [19] were utilized.
  E p , ρ = 1 0.848 ρ E p
f ptk , ρ = ( 1 2.683 ρ ) f ptk
ε pu , ρ = 0.1 + 0.9 e 26 ρ ε pu
ε py , ρ = 0.85 f ptk , ρ E p , ρ
where Ep,ρ and Ep denote the strand elasticity modulus before and after corrosion, respectively; fptk and fptk,ρ are standard values of the strand ultimate strength before and after corrosion, respectively; εpu and εpu,ρ are the strand ultimate strain before and after corrosion, respectively; and εpy,ρ is the corroded strand yield strain.

3.1.3. Concrete Cracking

Corrosion of prestressing strands results in volume expansion, creating many microcracks in the surrounding concrete. The presence of internal microcracks leads to a deterioration in the concrete compressive strength in the tensile zone. It is noted that corrosion has a minor effect on the concrete strength in the compression zone. Thus, the reduced concrete strength in the tensile zone can be calculated by adopting the formula proposed by Coronelli [37]:
f ck , ρ = f ck 1 + K ε 1 / ε c
where fck and fck,ρ are the standard values of the concrete axial compressive strength before and after strand corrosion, respectively; K is a coefficient related to strand diameter and roughness [38], and here has a value of 0.1; εc is the concrete peak compressive strain (when fcu ≤ 50 MPa, εc = 0.002) [19]; and ε1 is the average concrete tensile strain that is perpendicular to the prestressing force direction, which can be calculated as follows:
ε 1 = n w cr / b
where n is the number of steel wires to be considered for corrosion; b is the section width at the position of the strand; and wcr is the width of the crack at a certain corrosion depth.
Assuming that all corrosion products are incompressible, the crack width wcr equals the increase in circumference (as shown in Figure 6). Therefore, Equation (13) can calculate the width of the crack:
w cr = i u i = 2 3 2 π ( μ rs 1 ) p a
where μrs is the volume ratio of corroded oxide to the strand subject to corrosion, recommended to be 2.78 [39].
After the concrete compressive strength in the tensile zone has been calculated, it is then possible to estimate the concrete tensile strength (ftk,ρ) by taking 1/10th of the compressive strength as suggested [40].

3.2. Calculation of Flexural Behavior

3.2.1. Cracking Moment

Based on the code for the design of prestressed concrete structures [41], the cracking moment can be calculated if the effective prestress and section properties are known. The strand corrosion reduces its effective prestressing force, which is taken into account here with a reduction in the elastic modulus. And the volume expansion in the corrosion products degrades the strength of the concrete, causing the test beam to crack more easily. The calculation formula for the cracking moment of a corroded prestressed beam can be obtained by introducing a mass loss amendment to the code formula.
M cr , ρ = ( σ pc , ρ + γ f tk , ρ ) W 0 , ρ
where W0,ρ is the flexural section resistance factor of the converted section near the midspan; σpc,ρ is the concrete precompression stress generated by the effective prestress at the section’s lower edge; and γ is the plasticity coefficient of the resisting moment, i.e., γ = 1.0.

3.2.2. Flexural Bearing Capacity

The basic assumptions for the flexural bearing capacity of corroded PC beams are as follows: (1) for PC beams having a reliable anchorage system, the deterioration of the bond has little effect on the flexural behavior; (2) the plane section remains satisfied for average concrete strain during bending; (3) the contribution of concrete in the tensile zone can be neglected; (4) the constitutive models of corroded steel strands and concrete are in Yu [12] and the Chinese code [25], respectively; (5) all normal reinforcing bars yield in the ultimate condition.
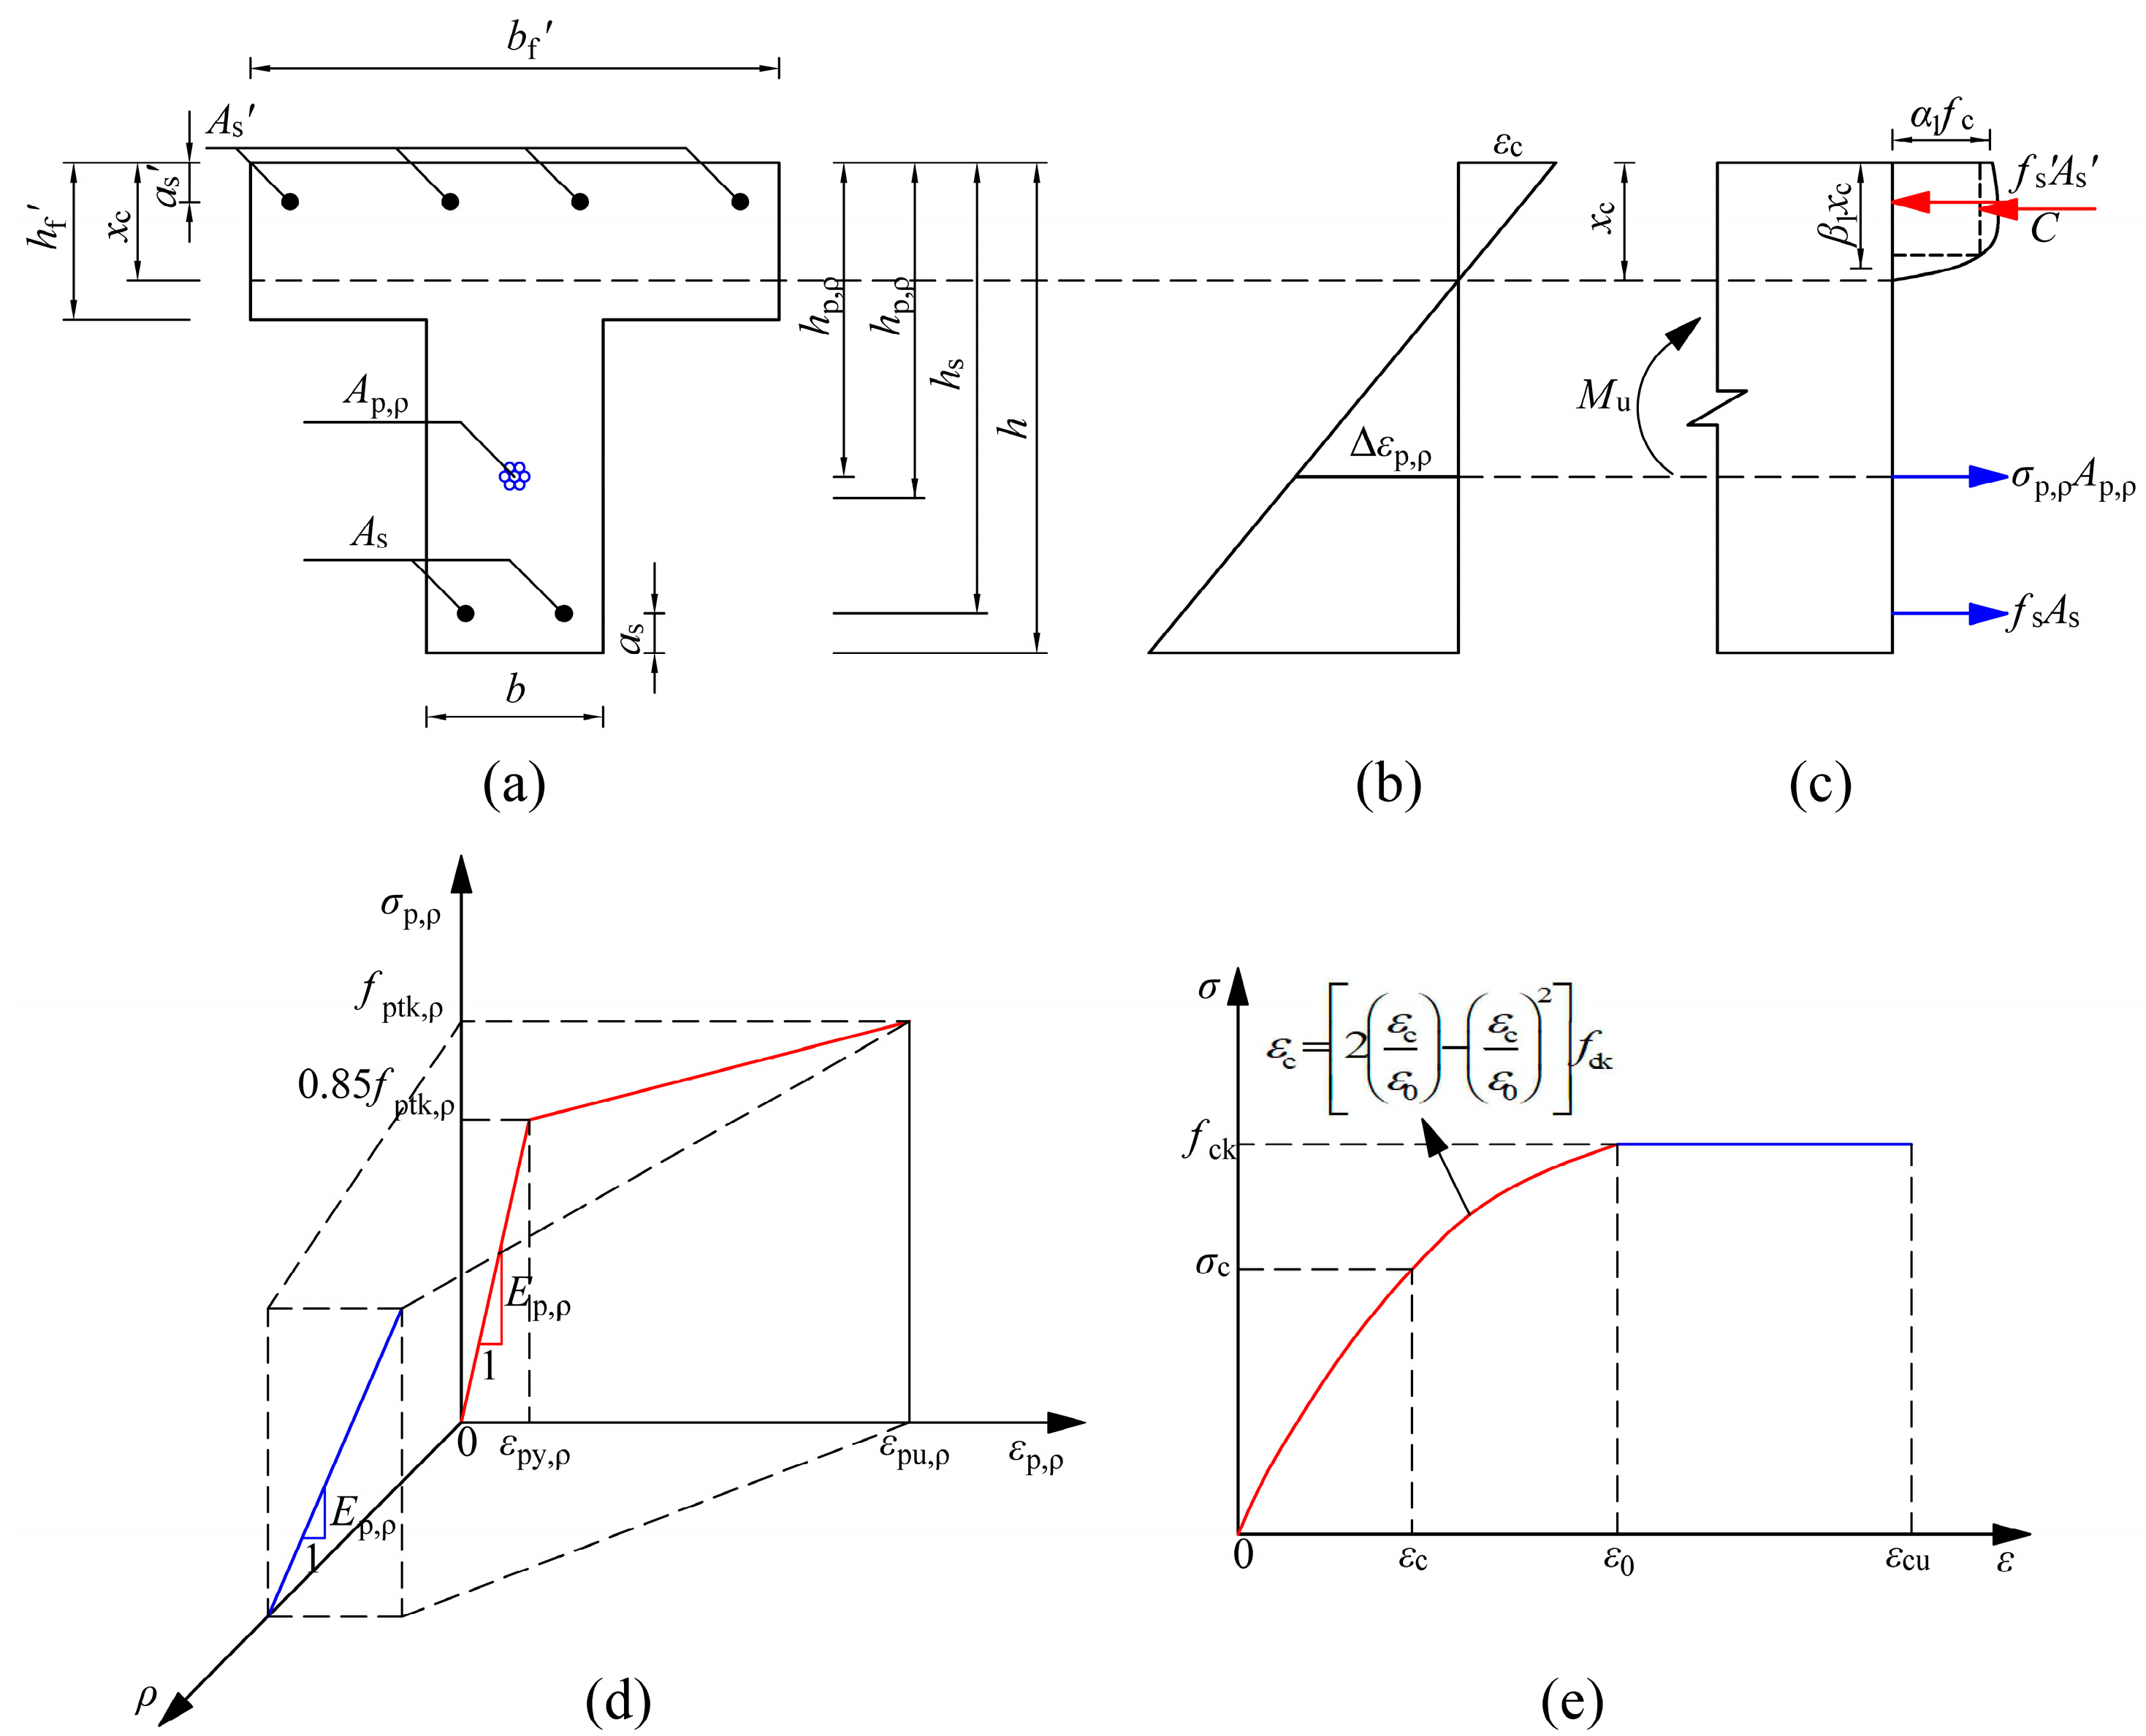
The stress–strain constitutive model of concrete adopts a quadratic parabolic segment followed by a horizontal linear segment. The prestressing strand adopts a bilinear constitutive relationship, with the nominal yield strength set at 0.85 times the ultimate strength. When the strand mass loss is greater than a critical value, the hardened section of the stress–strain curve disappears and the curve becomes a single linear curve. The strain and stress distribution of a normal section of the test beam is shown in Figure 7. The following equation can be obtained:
ε cu ε p , ρ = x c h p x c = x β 1 h p x
where εp,ρ denotes the strain of the corroded prestressing strand; εcu is the ultimate compressive strain (when fcu ≤ 50 MPa, εcu = 0.0033); hp is the distance from the strand to the compressive edge; x and xc are the actual and equivalent compressed zone heights of the concrete, respectively; and β1 denotes the height coefficient of the equivalent rectangular compression zone, which is set to 0.8 when the concrete strength is less than 50 MPa.
Considering the axial force equilibrium, the equivalent compressed zone height of concrete is calculated from Equation (16). For all test beams, it lies in the flange plate, which can be verified in the crack profiles of the test beams.
x = σ p , ρ A p , ρ + f yk A s f yk A s / α 1 f ck b f
where σp,ρ is the stress of the corroded strand calculated by Equation (17); α1 denotes the stress coefficient of the equivalent rectangular compression zone; bf denotes the width of the flange plate; fyk and As are the standard yield strength and area of a normal tensile steel bar, respectively; and fyk and As are the standard yield strength and area of a normal compressive steel bar, respectively.
σ p , ρ = ε p , ρ E p , ρ ( ε p , ρ ε p y , ρ ) 0.85 fptk , ρ + 0.15 f ptk , ρ ε p , ρ ε p y , ρ ε pu , ρ ε p y , ρ ( ε p , ρ > ε p y , ρ )
The ultimate and actual strain of the corroded strand can be calculated according to Equations (9) and (15), respectively. By comparing these two values, the failure mode can be determined. If εp,ρεpu,ρ, the test beams fail with concrete crushing; otherwise, rupture of the corroded strand happens.
By taking the moment of the point of the equivalent compressive force, the normal section flexural bearing capacity can be calculated as follows:
M u , ρ = σ p , ρ A p , ρ ( h p x 2 ) + f yk A s ( h s x 2 ) + f yk A s ( x 2 a s )
where hs and as are the distance from the non-prestressed tensile steel bar and non-prestressed compressive steel bar to the compressive edge, respectively.
If εp,ρ > εpu,ρ, it means that the strand’s actual strain calculated based on the plane section exceeds its ultimate strain. In this case, the equivalent compression height needs to be amended as follows:
x = 1 2 x + β 1 ε cu h s ε cu + ε pu , ρ
Replacing x in Equation (18) with x’ yields a formula for calculating the flexural bearing capacity of a test beam with strand rupture.

4. Results and Discussion

4.1. Experimental Phenomena

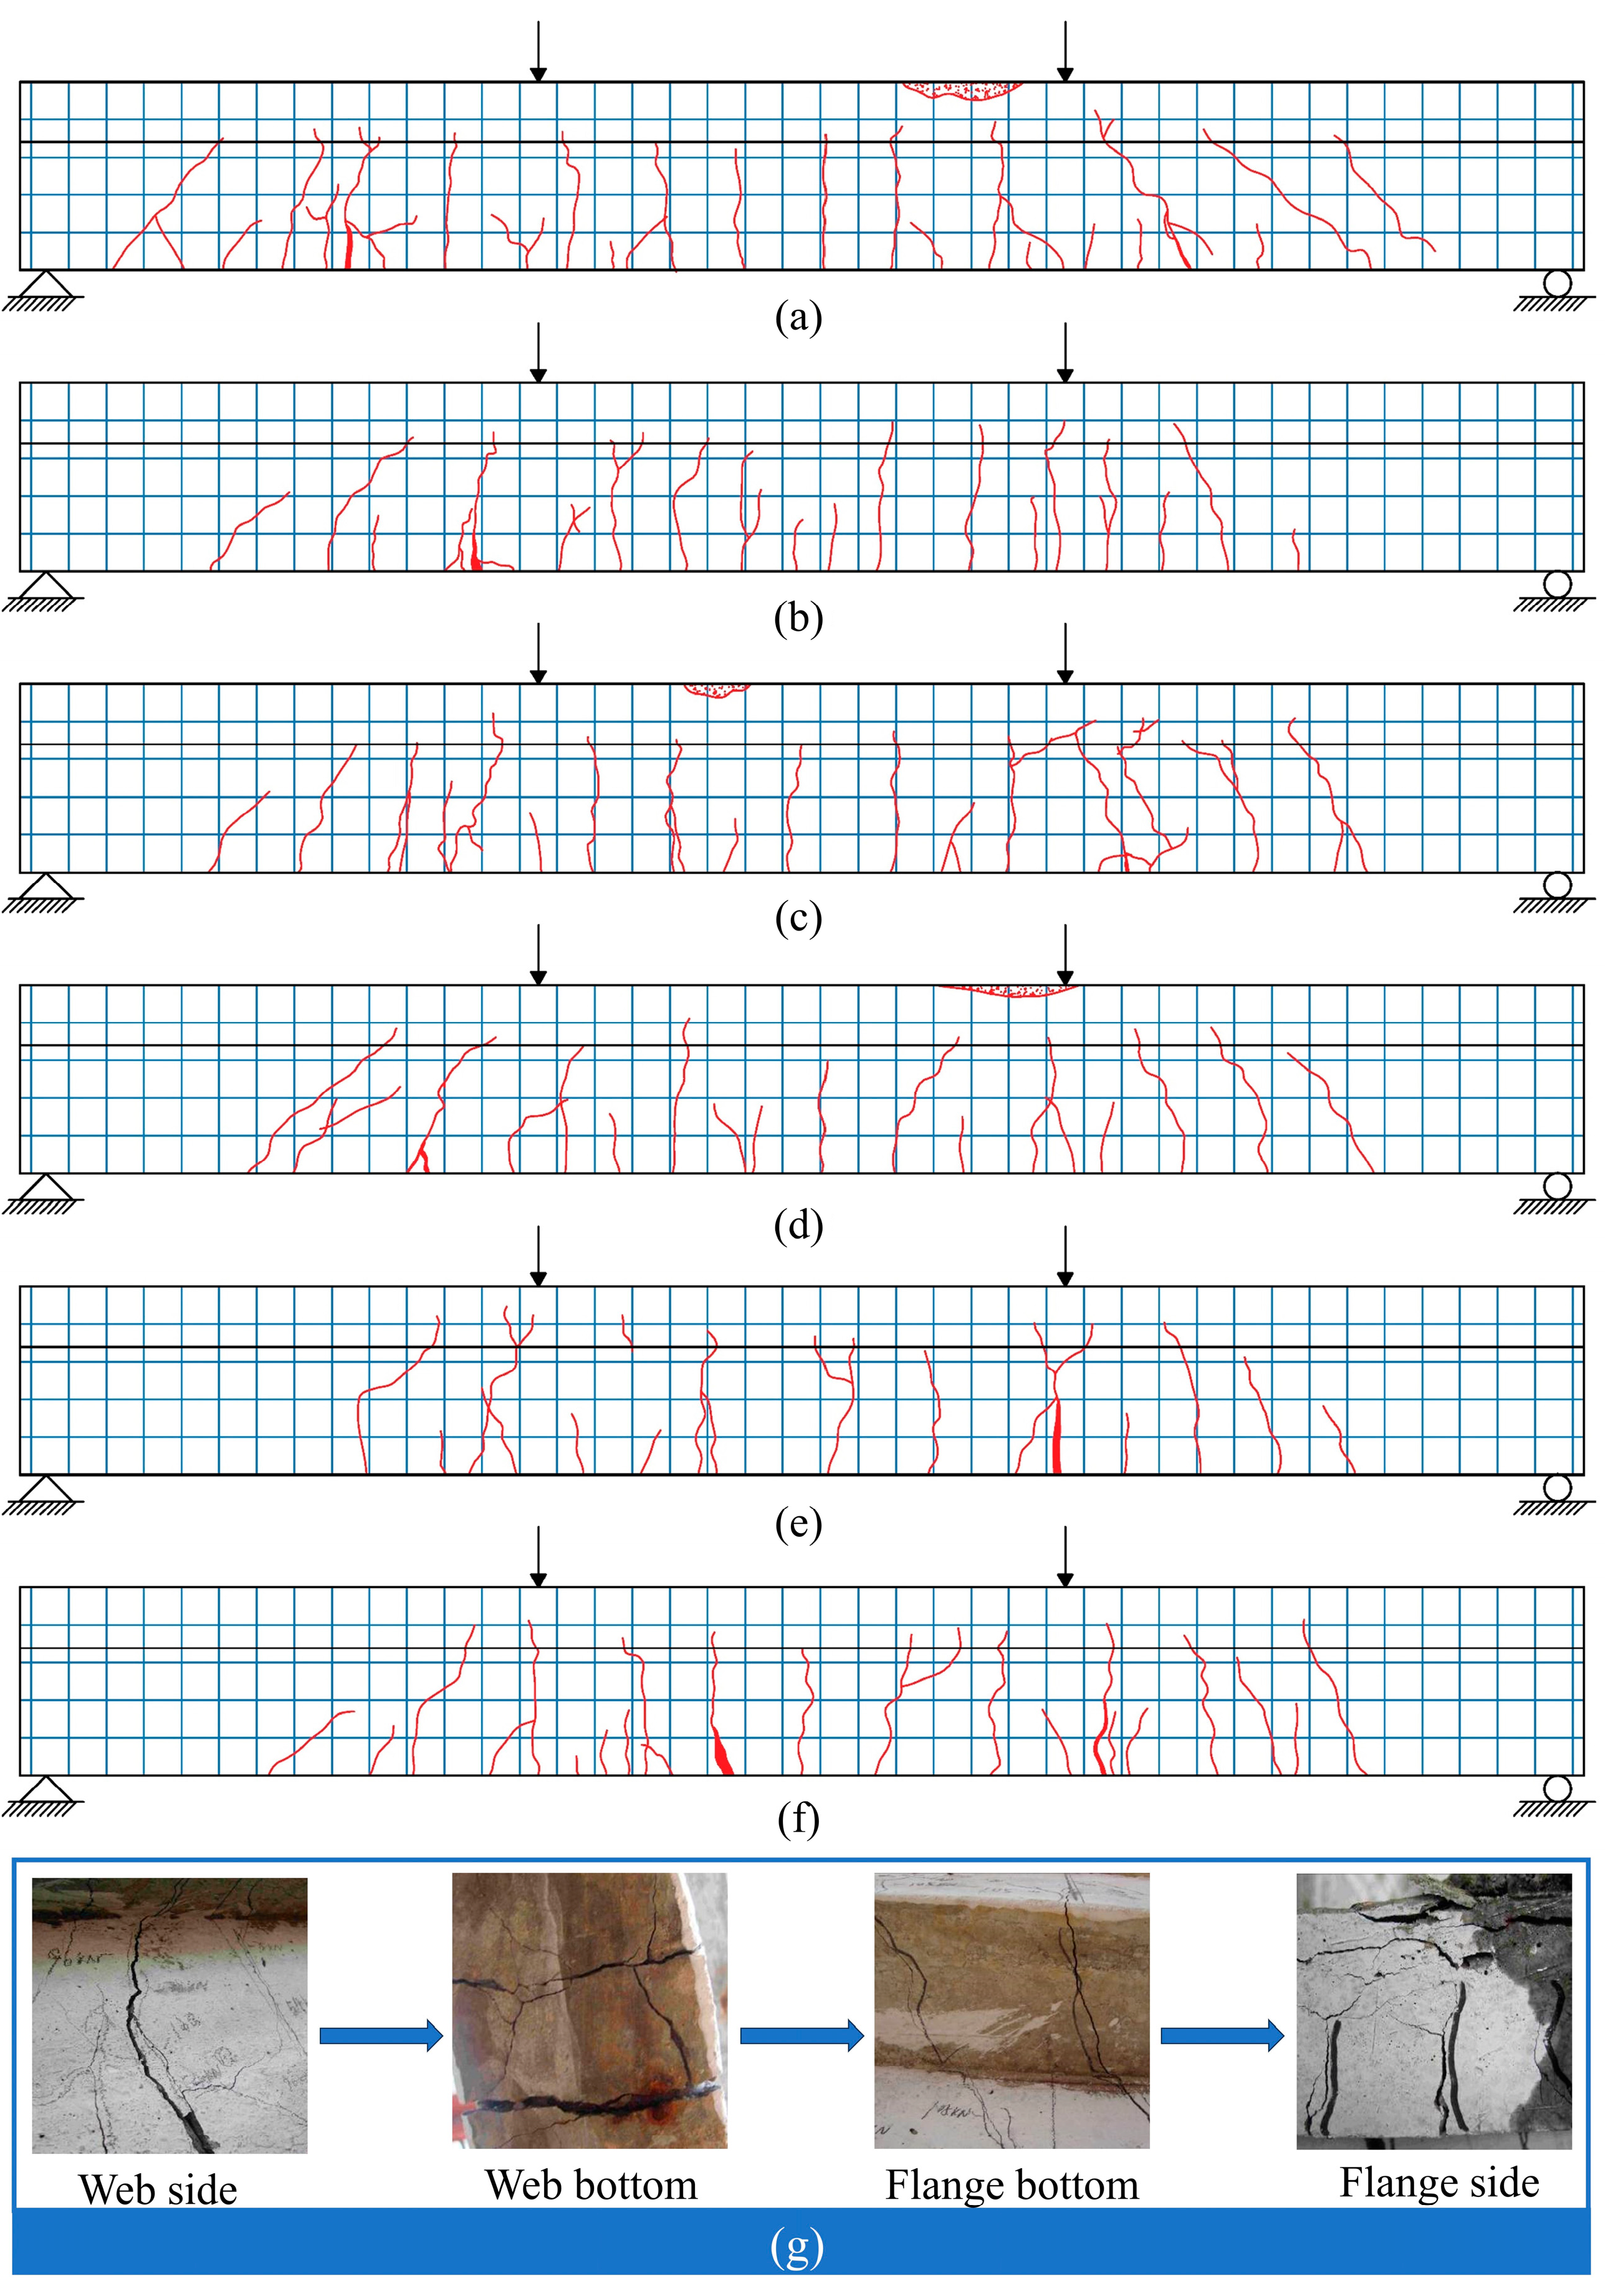
During the loading process, the crack development and failure of the scaled beams were recorded and summarized as follows. Taking specimen L1 as an example, when loaded to 72 kN, small oblique cracks first appeared on the web side in the segment between the loading point and the support. As the load increased, oblique cracks developed, and vertical bending cracks appeared in the middle segment. Then, bending cracks extended from the middle span to both ends. The average crack distance was about 100 mm, which was comparable to the stirrup spacing. As the load kept increasing, oblique cracks and vertical bending cracks continued to develop, and the crack number and width increased. When the load increased to 120 kN, cracks developed on the beam flange plate. Figure 8 shows the crack profile of all the scaled beams.
Beams with different mass losses exhibited different failure characteristics. For specimens L1~L4 with low mass loss, their non-prestressed tensile reinforcement first yielded and then fractured, and then the flange concrete crushed, which exhibited obvious ductile characteristics. When specimens L5 and L6 were damaged, the strand ruptured with a strong and brittle sound. The failure of these two specimens has obvious brittle characteristics, with the bearing capacity decreasing sharply. The failure mode of the scaled beams, which changes from ductile failure to brittle failure as the mass loss increases, can also be supported by reference [17].
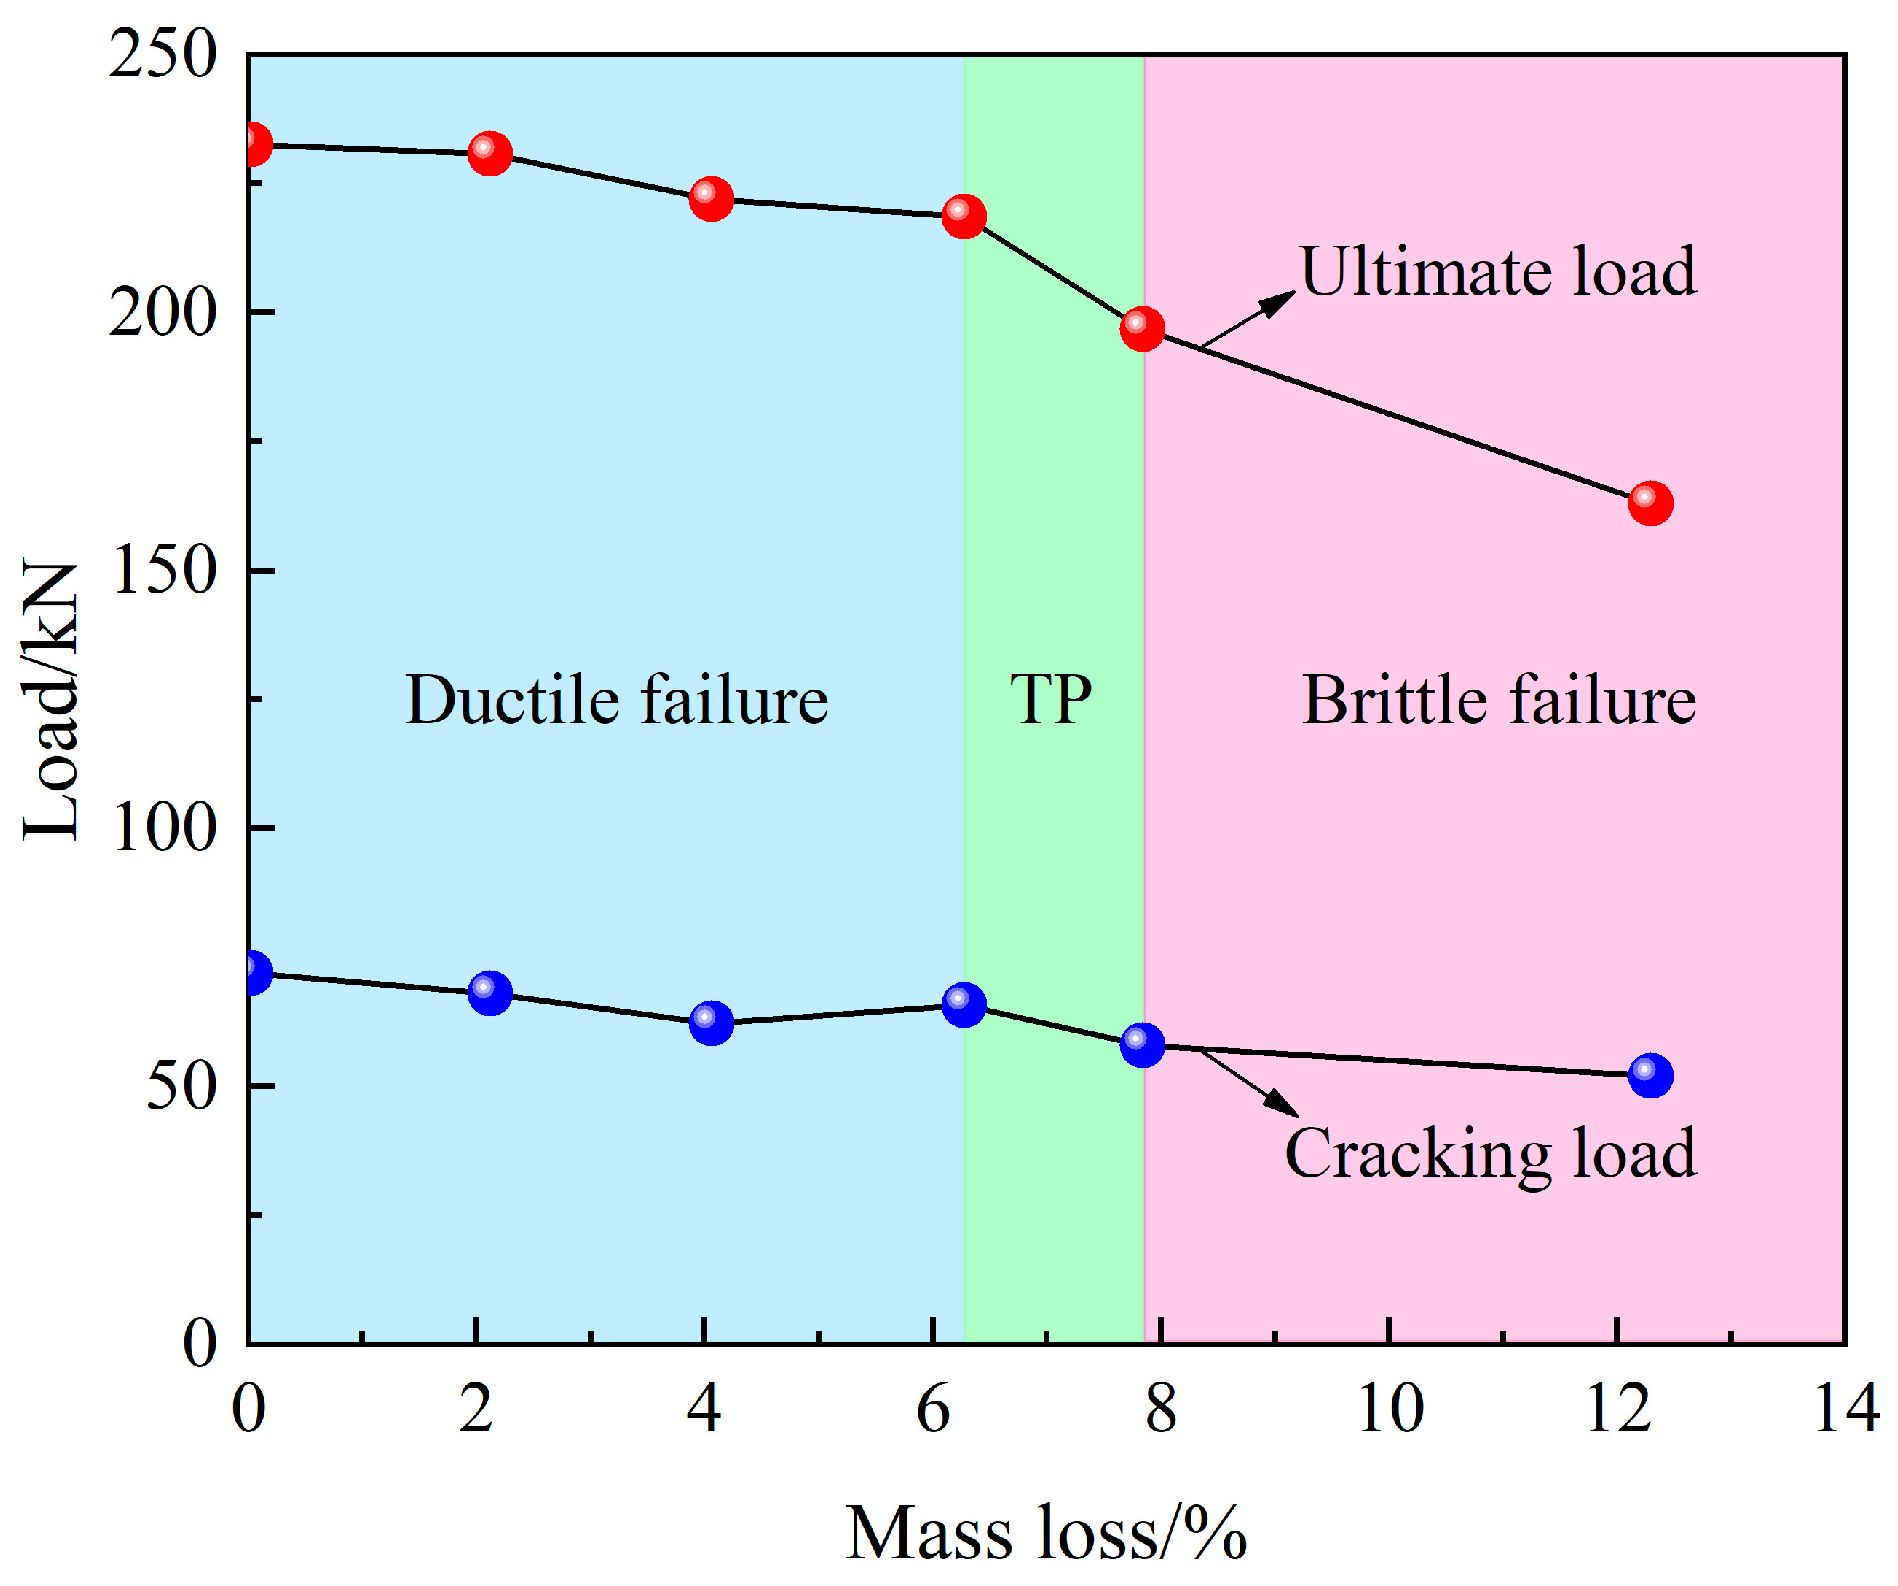
The experiment results are summarized in Table 4 and Figure 9. Strand corrosion could reduce the flexural behavior of PC beams. When the mass loss was 12.30%, the cracking load, ultimate load, and ductility decreased by 27.8%, 29.9%, and 11.5%, respectively. The cracking load of specimen L4 was higher than that of specimen L3, which may be due to the variability in the concrete properties inside each specimen and between different specimens [42,43]. There was an obvious turning point in the ultimate load reduction of the scaled beam. When the mass loss exceeded 7%, the ultimate load would degrade faster.

4.2. Load–Deflection Curve at Midspan

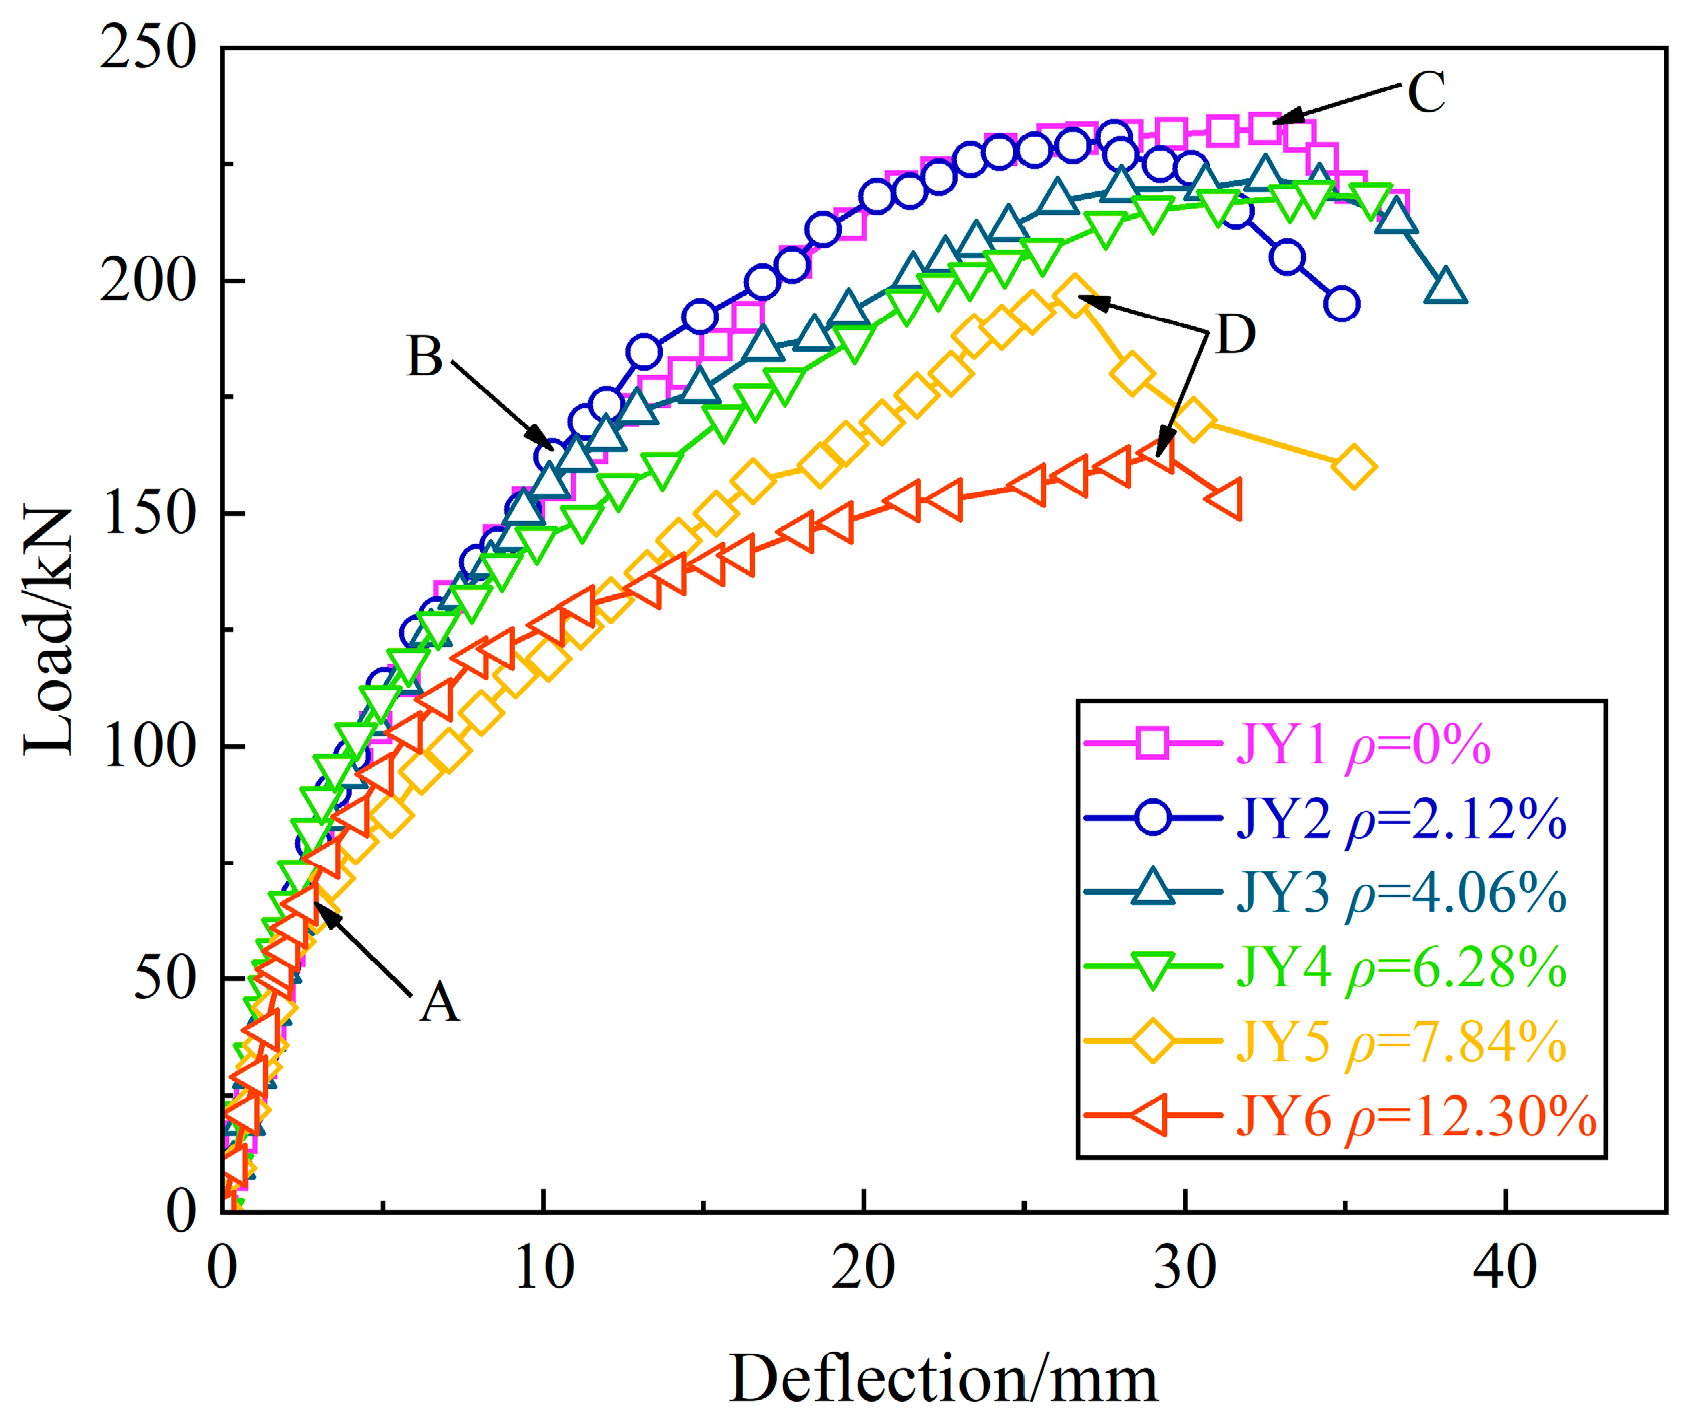
Figure 10 compares the load–deflection curves for all the scaled beams. It can be found that the curves can be divided into three stages. Before the concrete in the tension zone cracked (point A), the load and midspan deflection were approximately linear and the scaled beam was in elastic working condition (stage 1). All the scaled beams exhibited a similar load–deflection behavior at stage 1, demonstrating that the strand corrosion had a negligible effect on the initial stiffness of PC beams. Stage 2 was the cracking elastic phase, where the concrete in the tension zone cracked and stopped working. This stage terminated when the non-prestressed tensile reinforcements yielded. Stage 3 was the plastic stage, where the cracks extended to the upper flange, and the flexural stiffness of the beam section decreased rapidly. This stage ended with the concrete being crushed in the compressed zone when the strand mass loss was low, or with the strand being ruptured when the mass loss was high. The inflection points in the curve were, sequentially, concrete cracking (point A), yielding of non-prestressed tensile reinforcement (point B), concrete crushing (point C), and strand rupture (point D).
Under general conditions, the corroded PC beam is usually working with cracks, i.e., in an approximately elastic stage. The deflection calculations of corroded PC beams are aimed at both elastic and cracking elastic phases. Therefore, a homogeneous elastic material model was identified as the object of study. The stiffness of the purely bending segment was taken for the study based on the “principle of minimum stiffness” [40]. Given the short period of the test loading, the short-term stiffness of the corroded PC beam was studied.
For the four-point bending test, deflection can be obtained using the principle of superposition. The flexural stiffness of scaled beams is obtained as follows:
B = Q δ ( a L 2 8 a 3 6 )
where Q is the external load applied at one loading point; δ is the midspan deflection, which is taken as a positive value when moving downwards; a is the distance from the loading point to the support; and L is the calculated span of the scaled beam.
Figure 11 compares the load–flexural stiffness curves calculated using Equation (20). It can be found that the general trend of relative stiffness variation was decreasing, with two obvious stages: the stiffness remained unchanged during the period from loading to cracking, and decreased sharply after the test beam crack. The load–flexural stiffness curves of the scaled beams still satisfied the bifold variation law. After cracking, the slope of the second stage increased as the mass loss increased; that is, the flexural stiffness decreased more and more sharply. This implies that strand corrosion has a significant effect on flexural stiffness after cracking.

4.3. Cracking Moment

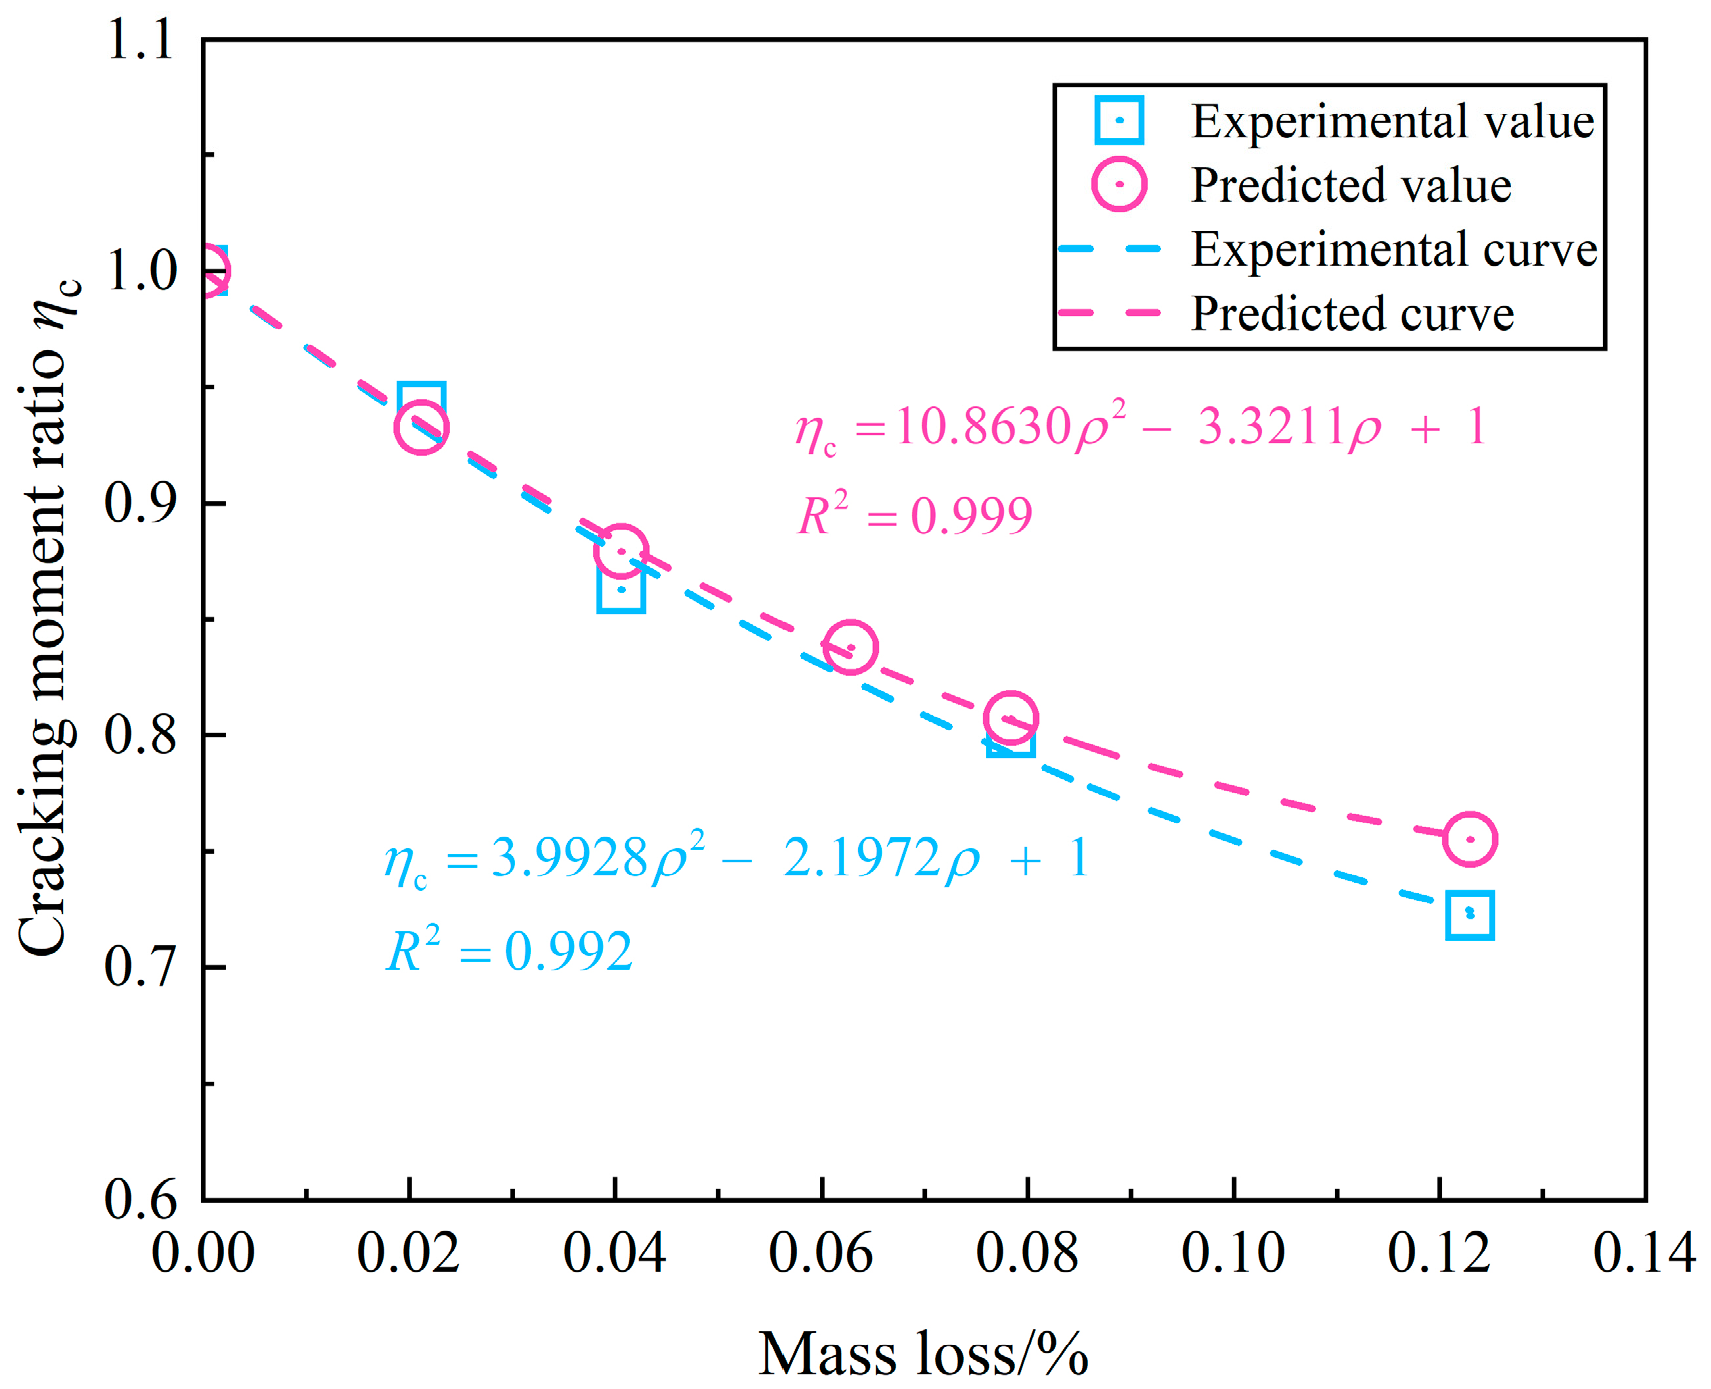
The experimental and theoretical values of the cracking moment for the scaled beams are listed in Table 4. As previously mentioned, the cracking moment of specimen L4 showed a large deviation, and these data were excluded from the analysis of the effect of strand mass loss on the cracking moment to ensure data reliability. It can be found that the analytical cracking model was valid, with a maximum relative error between the experimental and theoretical cracking moment of 3.14%. Strand corrosion reduced the strand prestress and concrete strength, which in turn caused the test beam to crack more easily. Figure 12 compares the variation in cracking moment ratios, from which it can be seen that the deterioration trends of the cracking moment obtained from the experiment and theory are highly close.

4.4. Flexural Bearing Capacity

Table 4 compares the flexural bearing capacity and failure mode obtained from the experimental and analytical methods, and the comparison reveals a good agreement between them. The test results show that high mass losses significantly reduced the flexural bearing capacity and led to strand rupture failure. By contrast, for low mass losses, the flexural bearing capacity was only slightly reduced with concrete being crushed. Similar to those of the cracking moment, the experimental and theoretical values of the flexural bearing capacity decreased as the strand mass loss increased. A critical mass loss (a range of 6~8%) between these two stages seemed to exist. The critical mass loss for failure mode changes was highlighted by Rinaldi et al. [11] who observed extremely brittle behavior in specimens with an average mass loss of 7%. Similar results exist, such as the 5.06% and 5% mass losses proposed, respectively, by Benenato et al. [44] and Menouf [45].
An in-depth analysis of the results of this test and those of other researchers led to the determination of a critical mass loss of 7%. Figure 13 compares the variation in flexural bearing capacity ratios. The flexural bearing capacity of corroded prestressed beams depended on the strand mass loss. A strand mass loss of less than 7% could lead to a linear degradation pattern with a relatively slight reduction. As mass loss increased, the flexural bearing capacity exhibited an exponential and sharp declining trend.

4.5. Displacement Ductility Factor

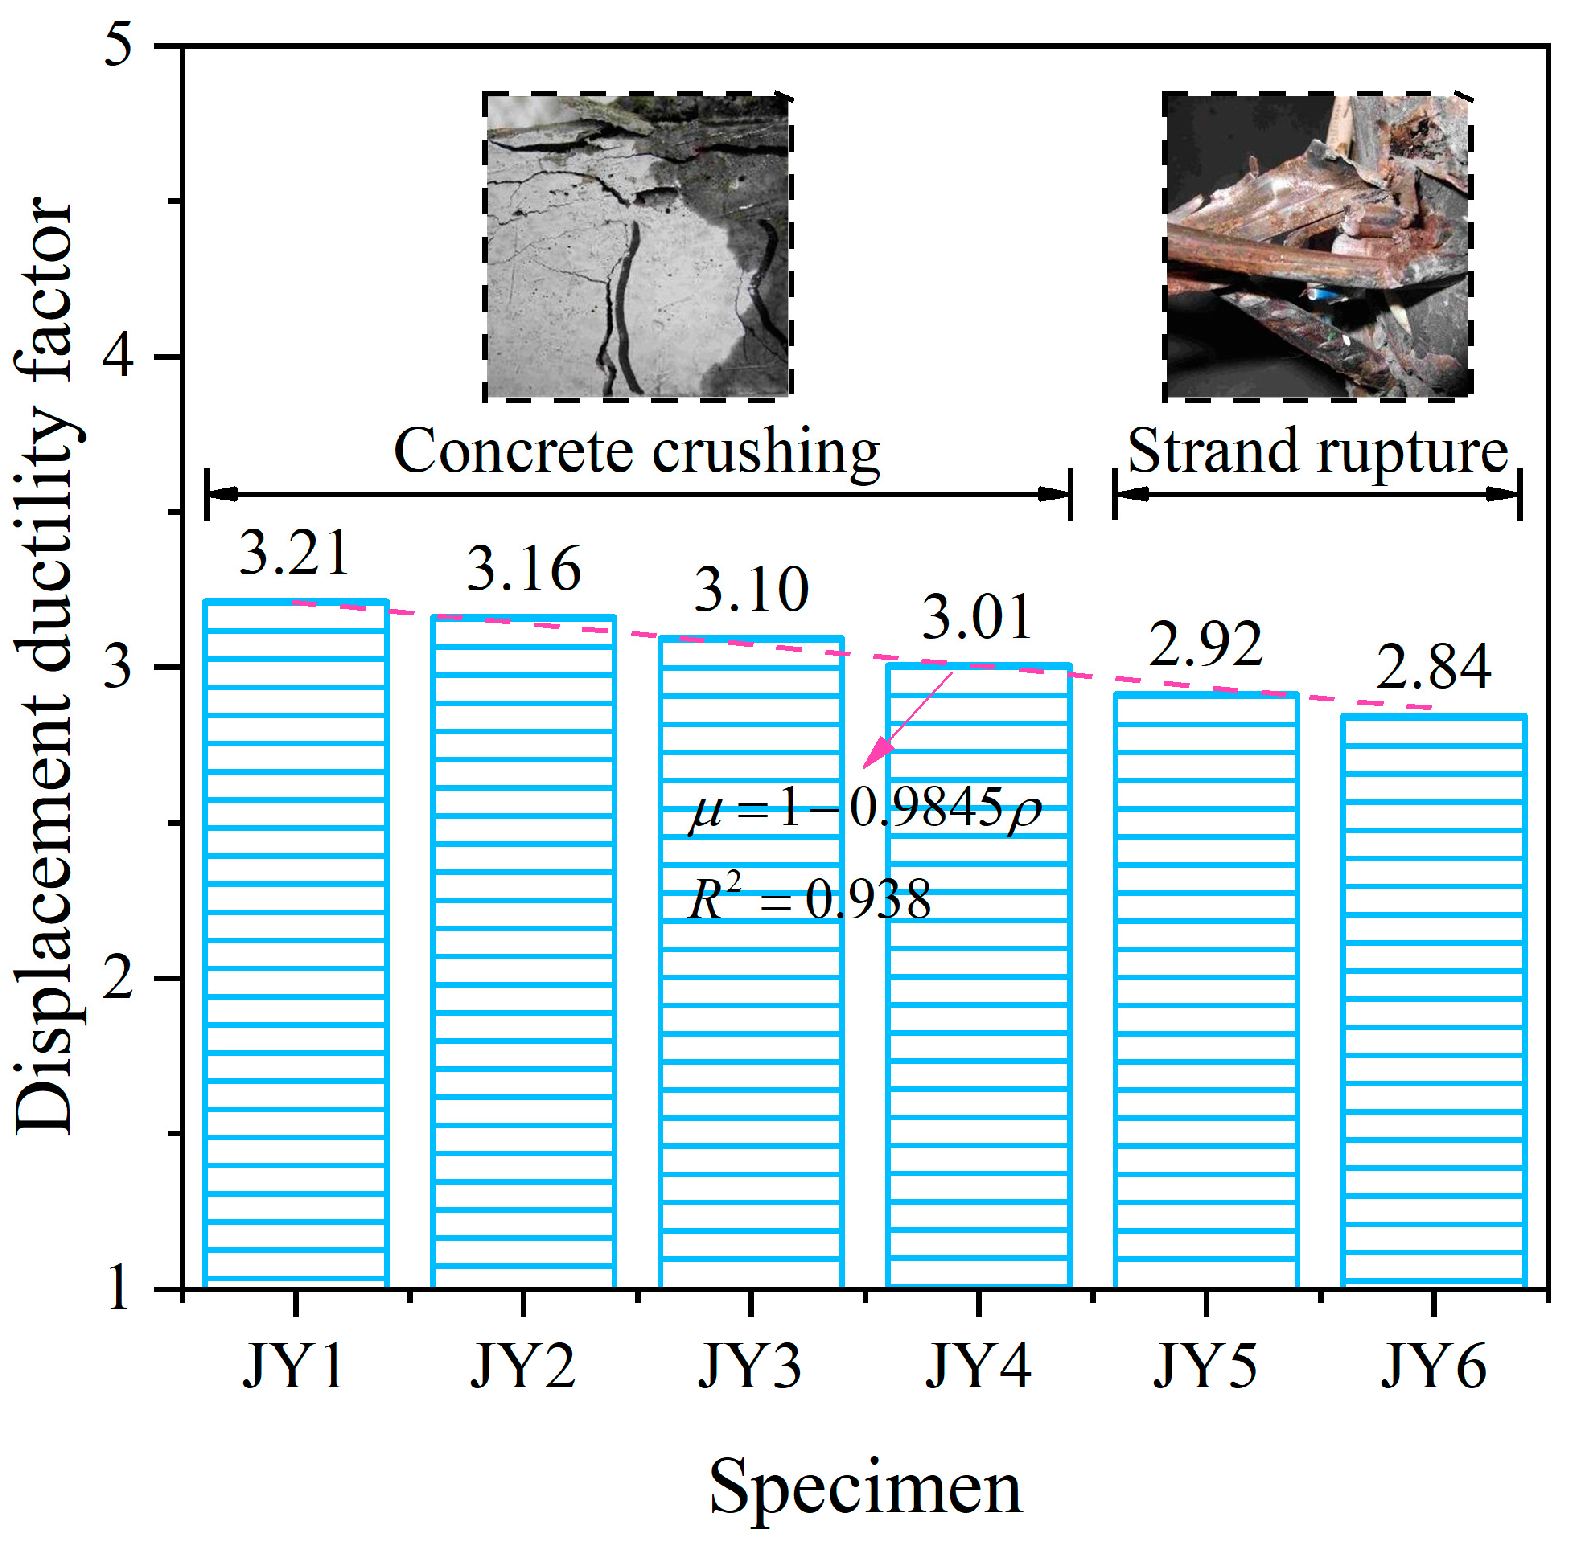
Components with better ductility can absorb a certain amount of energy after reaching the yield or maximum bearing capacity state. The ductility of a member can be characterized by the displacement ductility factor [46,47], which is the ratio of ultimate displacement to yield displacement. Among the points, the yield point can be obtained by graphing the load–deflection curve using the isoenergetic method [48]. And the limit point is taken to be the point corresponding to the maximum value of the load–deflection curve or the point corresponding to 85% of the peak load.
The ductility factors are listed in Table 4 and shown in Figure 14. The displacement ductility factors of the corroded beams were smaller than the figure of the comparison specimen. When strand corrosion was 12.30%, the reduction rate of the displacement ductility factor was 11.5%. There was also a relationship between the failure mode and ductility. The displacement ductility factor of specimens L5 and L6 decreased to below three, which corresponded to brittle failure with strand rupture in the experiments.

5. Conclusions

To address the lack of research on the flexural behavior of corroded high-speed railway simply supported PC box girders, the failure mode, flexural stiffness, cracking moment, flexural bearing capacity, and displacement ductility factor of corroded scaled beams with different mass losses were experimentally and theoretically investigated. The main conclusions are as follows:
(1)
Strand corrosion significantly reduced its mechanical properties, which in turn degraded the flexural behavior of the PC beams. In this test, when the mass loss was 12.30%, the cracking load, ultimate load, and ductility decreased by 27.8%, 29.9%, and 11.5%, respectively.
(2)
There existed a critical strand mass loss (7% in this study) for the reduction in the flexural bearing capacity of a corroded PC beam. A strand mass loss of less than 7% could lead to a linear degradation law with concrete crushing failure. As mass loss increased, the flexural bearing capacity exhibited an exponentially decreasing trend with strand rupture failure.
(3)
Strand corrosion had a negligible effect on initial flexural stiffness before concrete cracking. But after concrete cracking, the higher the mass loss was, the faster the flexural stiffness decreased.
(4)
The analytical model considering the effects of strand cross-section reduction, strand property deterioration, and concrete cracking can predict the cracking moment, flexural bearing capacity, and failure mode well.
The experimental data and theoretical investigations in this study can provide a reference for the durability and secure operation of high-speed railway simply supported prestressed concrete box girders. However, the corrosion pit model was relatively ideal and test beams were designed according to the similarity theory. The investigation results approximately estimate the original structure, but the accuracy is still limited. Thus, we would like to have the opportunity to conduct a static load test of the prototype structure in the future.

Author Contributions

Writing—original draft, Y.K., J.Y. and R.T.; writing—review and editing, Y.K., H.J. and Z.Y.; theoretical analysis, J.Y., R.T. and K.N.; data collection, K.N. All authors have read and agreed to the published version of the manuscript.

Funding

This research was funded by the Natural Science Foundation of Hunan Province, China (Grant No. 2023JJ30674), the National Natural Science Foundation of China (Grant No. 51878663), and Fundamental Research Funds for Central Universities of Central South University (Grant No. 2023ZZTS0331 and 2023ZZTS0408).

Institutional Review Board Statement

Not applicable.

Informed Consent Statement

Not applicable.

Data Availability Statement

The data provided in this study could be released upon reasonable request.

Acknowledgments

The authors gratefully acknowledge the financial support provided by the Natural Science Foundation of Hunan Province, China (Grant No. 2023JJ30674), the National Natural Science Foundation of China (Grant No. 51878663), and Fundamental Research Funds for Central Universities of Central South University (Grant No. 2023ZZTS0331 and 2023ZZTS0408).

Conflicts of Interest

The authors declare that they have no known competing financial interests or personal relationships that could have appeared to influence the work reported in this paper.

Abbreviations

The following symbols are used in this manuscript:
ρStrand mass loss
D0Initial nominal diameter of the external wire
D1Initial nominal diameter of the middle wire
pmMaximum corrosion depth
paAverage corrosion depth
RCorrosion penetration factor
AcStrand loss area
Ap,ρStrand residual area
Ep (Ep,ρ)Strand elasticity modulus before and after corrosion
fptk (fptk,ρ)Standard ultimate strength of strand before and after corrosion
εpu (εpu,ρ)Strand ultimate strain before and after corrosion
εpy (εpy,ρ)Strand yield strain before and after corrosion
fyk (fyk)Standard yield strength of non-prestressed tensile and compressive steel bar
As (As)Area of non-prestressed tensile and compressive steel bar
fck (fck,ρ)Standard axial compressive strength of concrete before and after corrosion
εp,ρCalculated strain of corroded prestressing strand
ftk,ρStandard concrete axial tensile strength of concrete after strand corrosion
εcuConcrete ultimate compressive strain
εcConcrete peak compressive strain
ε1Average concrete tensile strain that is perpendicular to the prestressing force direction
KCoefficient related to strand diameter and roughness
nNumber of steel wires to be considered for corrosion
wcrWidth of crack at a certain corrosion depth
μrsVolume ratio of corroded oxide to strand subject to corrosion
bSection width at the position of strand
bfSection width of flange plate
W0,ρFlexural section resistance factor of converted section near the midspan
σpc,ρConcrete precompression stress generated by the effective prestress at the section’s lower edge
γPlasticity coefficient of the resisting moment
hpDistance from strand to the compressive edge
hsDistance from non-prestressed tensile steel bar to the compressive edge
asDistance from non-prestressed compressive steel bar to the compressive edge
x (xc)Actual and equivalent compressed zone heights of concrete
α1Stress coefficient of equivalent rectangular compression zone
β1Height coefficient of equivalent rectangular compression zone
Mcr,ρCalculated cracking moment
Mu,ρCalculated flexural bearing capacity
QExternal load applied at one loading point
δMidspan deflection
aDistance from the loading point to the support
LCalculated span of the scaled beam

References

  1. Yang, O.; Li, H.; Ou, J.; Li, Q. Failure patterns and ultimate load-carrying capacity evolution of a prestressed concrete cable-stayed bridge: Case study. Adv. Struct. Eng. 2013, 16, 1283–1296. [Google Scholar] [CrossRef]
  2. Jeyashree, T.M.; Kannan Rajkumar, P.R.; Satyanarayanan, K.S. Developments and research on fire response behaviour of prestressed concrete members—A review. J. Build. Eng. 2022, 57, 104797. [Google Scholar] [CrossRef]
  3. Campione, G.; Zizzo, M. Influence of strands corrosion on the flexural behavior of prestressed concrete beams. Structures 2022, 45, 1366–1375. [Google Scholar] [CrossRef]
  4. Su, X.; Ma, Y.; Wang, L.; Guo, Z.; Zhang, J. Fatigue life prediction for prestressed concrete beams under corrosion deterioration process. Structures 2022, 43, 1704–1715. [Google Scholar] [CrossRef]
  5. Li, F.; Yuan, Y.; Li, C. Corrosion propagation of prestressing steel strands in concrete subject to chloride attack. Constr. Build. Mater. 2011, 25, 3878–3885. [Google Scholar] [CrossRef]
  6. Li, H.; Li, L.; Ye, M.; Li, M.; Wu, Y. Blast fragility assessment of aging coastal RC columns exposed to non-uniform CIC attacks using LBE function. J. Build. Eng. 2023, 71, 106510. [Google Scholar] [CrossRef]
  7. Li, H.; Li, L.; Zhou, G.; Xu, L. Time-dependent Seismic Fragility Assessment for Aging Highway Bridges Subject to Non-uniform Chloride-induced Corrosion. J. Earthq. Eng. 2022, 26, 1809561. [Google Scholar] [CrossRef]
  8. Li, H.; Li, L.; Zhou, G.; Xu, L. Effects of various modeling uncertainty parameters on the seismic response and seismic fragility estimates of the aging highway bridges. Bull. Earthq. Eng. 2020, 18, 6337–6373. [Google Scholar] [CrossRef]
  9. Jeon, C.H.; Lee, J.B.; Lon, S.; Shim, C.S. Equivalent material model of corroded prestressing steel strand. J. Mater. Res. Technol. 2019, 8, 2450–2460. [Google Scholar] [CrossRef]
  10. Jeon, C.H.; Nguyen, C.D.; Shim, C.S. Assessment of mechanical properties of corroded prestressing strands. Appl. Sci. 2020, 10, 4055. [Google Scholar] [CrossRef]
  11. Vecchi, F.; Franceschini, L.; Tondolo, F.; Belletti, B.; Sánchez Montero, J.; Minetola, P. Corrosion morphology of prestressing steel strands in naturally corroded PC beams. Constr. Build. Mater. 2021, 296, 123720. [Google Scholar] [CrossRef]
  12. Yu, Q.; Gu, X.; Zeng, Y.; Zhang, W. Flexural behavior of corrosion-damaged prestressed concrete beams. Eng. Struct. 2022, 272, 114985. [Google Scholar] [CrossRef]
  13. Bonopera, M.; Liao, W.; Perceka, W. Experimental–theoretical investigation of the short-term vibration response of uncracked prestressed concrete members under long-age conditions. Structures 2022, 35, 260–273. [Google Scholar] [CrossRef]
  14. Meng, Q.; Zhu, J.; Wang, T. Numerical prediction of long-term deformation for prestressed concrete bridges under random heavy traffic loads. J. Bridge Eng. 2019, 24, 04019107. [Google Scholar] [CrossRef]
  15. Zhang, X.; Wang, L.; Zhang, J.; Ma, Y.; Liu, Y. Flexural behavior of bonded post-tensioned concrete beams under strand corrosion. Nucl. Eng. Des. 2017, 313, 414–424. [Google Scholar] [CrossRef]
  16. Harries, K.A. Structural testing of prestressed concrete girders from the lake view drive bridge. J. Bridge Eng. 2009, 14, 78–92. [Google Scholar] [CrossRef]
  17. Rinaldi, Z.; Imperatore, S.; Valente, C. Experimental evaluation of the flexural behavior of corroded p/c beams. Constr. Build. Mater. 2010, 24, 2267–2278. [Google Scholar] [CrossRef]
  18. Wang, L.; Zhang, X.; Zhang, J.; Liu, Y. Simplified model for corrosion-induced bond degradation between steel strand and concrete. J. Mater. Civ. Eng. 2017, 29, 04016257. [Google Scholar] [CrossRef]
  19. Li, F. Effect of Steel Strands Corrosion on Prestressed Concrete Structures under Chloride Environment; China University of Mining and Technology: Xuzhou, China, 2008. (In Chinese) [Google Scholar]
  20. Qiu, Y. Experimental and Numerical Investigation of Flexural Performance of Corrosion-Affected High-Speed Rail Box Beam; Central South University: Changsha, China, 2014. (In Chinese) [Google Scholar]
  21. Lu, Z.; Zhou, Q.; Li, H.; Zhao, Y. A new empirical model for residual flexural capacity of corroded post-tensioned prestressed concrete beams. Structures 2021, 34, 4308–4321. [Google Scholar] [CrossRef]
  22. Lu, Y.; Vintzileou, E.; Zhang, G.; Tassios, T.P. Reinforced concrete scaled columns under cyclic actions. Soil Dyn. Earthq. Eng. 1999, 18, 151–167. [Google Scholar] [CrossRef]
  23. ŽArnic, R.; Gostič, S.; Crewe, A.J.; Taylor, C.A. Shaking table tests of 1:4 reduced-scale models of masonry infilled reinforced concrete frame buildings. Earthq. Eng. Struct. Dyn. 2001, 30, 819–834. [Google Scholar] [CrossRef]
  24. Kim, N.S.; Lee, J.H.; Chang, S.P. Equivalent multi-phase similitude law for pseudodynamic test on small scale reinforced concrete models. Eng. Struct. 2009, 31, 834–846. [Google Scholar] [CrossRef]
  25. GB 50010-2010; Code for Design of Concrete Structures. China Architecture & Building Press: Beijing, China, 2010. (In Chinese)
  26. GB 50017-2017; Standard for Design of Steel Structures. China Building and Building Press: Beijing, China, 2017. (In Chinese)
  27. Wang, L.; Li, T.; Dai, L.; Chen, W.; Huang, K. Corrosion morphology and mechanical behavior of corroded prestressing strands. J. Adv. Concr. Technol. 2020, 18, 545–557. [Google Scholar] [CrossRef]
  28. Chen, R. Research on Bearing Capacity of Acid Rain Corrosion Prestressed Concrete Beam and Existing Prestress Test; East China Jiaotong University: Nanchang, China, 2021. (In Chinese) [Google Scholar] [CrossRef]
  29. Kashani, M.M.; Crewe, A.J.; Alexander, N.A. Nonlinear stress–strain behaviour of corrosion-damaged reinforcing bars including inelastic buckling. Eng. Struct. 2013, 48, 417–429. [Google Scholar] [CrossRef]
  30. Feng, R.; He, X.; Wang, F.; Zeng, J.; Zhu, J. Experimental analysis of corroded rc continuous beams rehabilitated by ICCP-SS under unsymmetrical loading. Structures 2022, 46, 1171–1188. [Google Scholar] [CrossRef]
  31. Guo, T.; Chen, Z.; Liu, T.; Han, D. Time-dependent reliability of strengthened PSC box-girder bridge using phased and incremental static analyses. Eng. Struct. 2016, 117, 358–371. [Google Scholar] [CrossRef]
  32. Vereecken, E.; Botte, W.; Lombaert, G.; Caspeele, R. Assessment of corroded prestressed and posttensioned concrete structures: A review. Struct. Concr. 2021, 22, 2556–2580. [Google Scholar] [CrossRef]
  33. Tu, B.; Dong, Y.; Fang, Z. Time-dependent reliability and redundancy of corroded prestressed concrete bridges at material, component, and system levels. J. Bridge Eng. 2019, 24, 04019085. [Google Scholar] [CrossRef]
  34. Ma, Y.; Xue, C.; Wang, L.; She, Q.; Zhang, J. Pit geometry size distribution on corroded pre-stressed reinforcement. J. Trans. Sci. Eng. 2016, 3, 49–55. (In Chinese) [Google Scholar] [CrossRef]
  35. González, J.A.; Andrade, C.; Alonso, C.; Feliu, S. Comparison of ratios of general corrosion and maximum pitting penetration on concrete embedded steel reinforcement. Cem. Concr. Res. 1995, 25, 257–264. [Google Scholar] [CrossRef]
  36. Yoo, C.H.; Park, Y.C.; Kim, H.K. Modeling corrosion progress of steel wires in external tendons. J. Bridge Eng. 2018, 23, 04018098. [Google Scholar] [CrossRef]
  37. Coronelli, D. Bar Corrosion in Steel-Concrete Bond: Material and Structural Effects in R/C; Politecnico di Milano: Milano, Italy, 1998. [Google Scholar]
  38. Capé, M. Residual Service-Life Assessment of Existing Rc Structures; Chalmers University of Technology: Goteborg, Sweden, 1999. [Google Scholar]
  39. Wang, L.; Dai, L.; Yi, J.; Zhang, X.; Zhang, J. Expansion of prestressed strand corrosion products and concrete cracking prediction. Eng. Mech. 2018, 35, 54–62. (In Chinese) [Google Scholar]
  40. Yuan, J.; Yu, Z. Basic Principles of Concrete Structural Design, 3rd ed.; China Railway Publishing House: Beijing, China, 2015. (In Chinese) [Google Scholar]
  41. JGJ 369-2016; Code for Design of Prestressed Concrete Structures. China Architecture & Building Press: Beijing, China, 2016. (In Chinese)
  42. Masi, A.; Digrisolo, A.; Santarsiero, G. Analysis of a large database of concrete core tests with emphasis on within-structure variability. Materials 2019, 12, 1985. [Google Scholar] [CrossRef] [PubMed] [Green Version]
  43. Pacheco, J.; De Brito, J.; Chastre, C.; Evangelista, L. Experimental investigation on the variability of the main mechanical properties of concrete produced with coarse recycled concrete aggregates. Constr. Build. Mater. 2019, 201, 110–120. [Google Scholar] [CrossRef]
  44. Benenato, A.; Ferracuti, B.; Imperatore, S.; Kioumarsi, M.; Spagnuolo, S. Behaviour of prestressed concrete beams damaged by corrosion. In Proceedings of the CACRCS DAYS 2020, Online, 1–4 December 2020. [Google Scholar]
  45. Menoufy, A.E.; Soudki, K. Flexural behavior of corroded pretensioned girders repaired with CFRP sheets. PCI J. 2014, 59, 129–143. [Google Scholar] [CrossRef]
  46. Talha Junaid, M.; Shweiki, A.; Barakat, S.; Alhalabi, M.; Mostafa, O. Flexural characterization and ductility assessment of small-scale mortar beams reinforced with 3D-printed polymers. Structures 2022, 45, 1751–1761. [Google Scholar] [CrossRef]
  47. Han, S.; Fan, C.; Zhou, A.; Ou, J. Simplified implementation of equivalent and ductile performance for Steel-FRP composite bars reinforced seawater sea-sand concrete beams: Equal-stiffness design method. Eng. Struct. 2022, 266, 114590. [Google Scholar] [CrossRef]
  48. Li, Z.; Zhu, H.; Zhen, X.; Wen, C.; Chen, G. Effects of steel fiber on the flexural behavior and ductility of concrete beams reinforced with BFRP rebars under repeated loading. Compos. Struct. 2021, 270, 114072. [Google Scholar] [CrossRef]
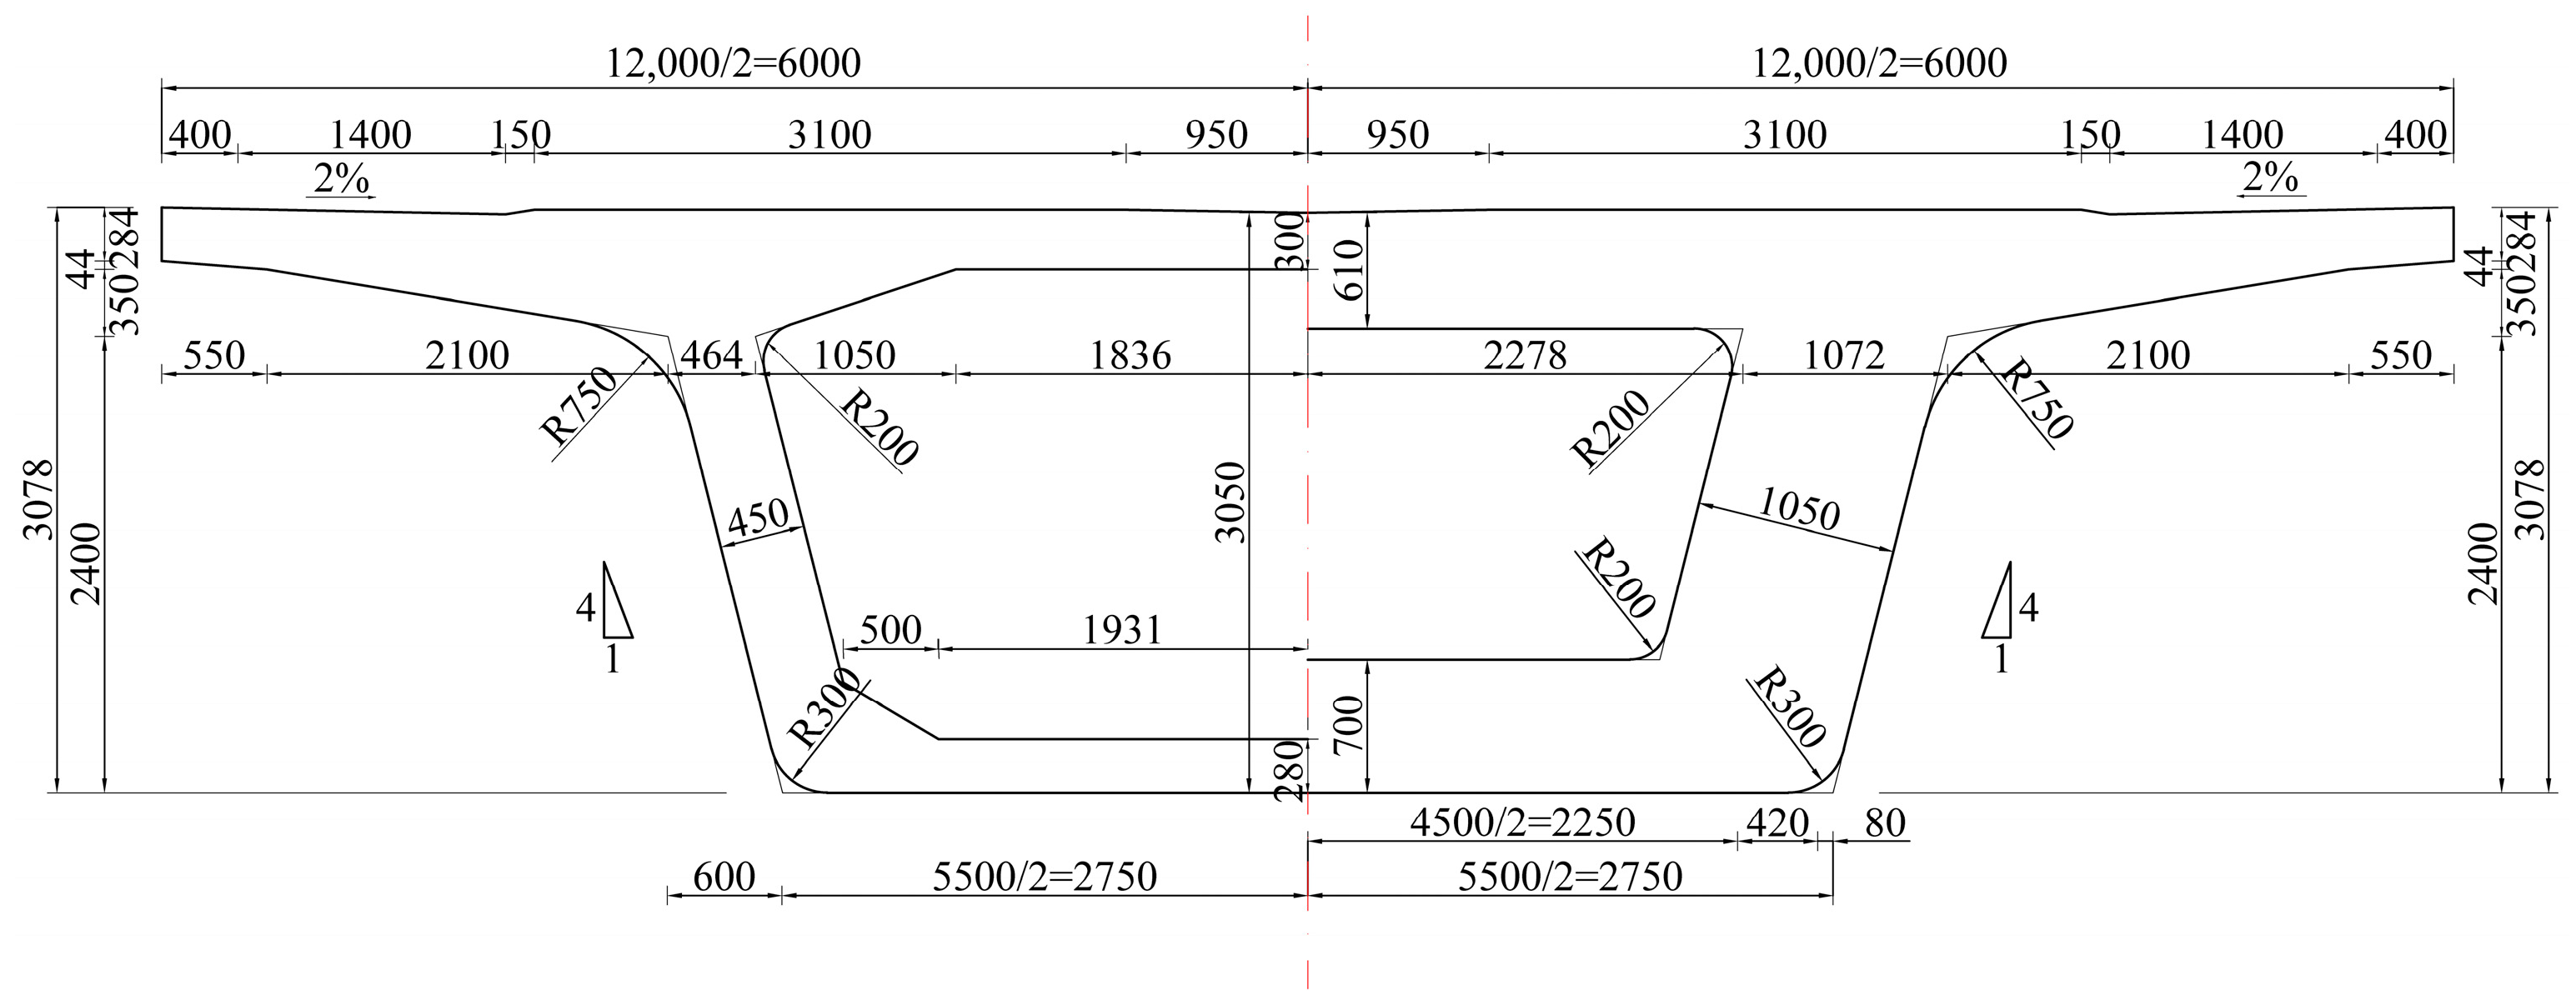
Figure 1. Tong Bridge (2008) 2322A-II standard box girder dimensions (units: mm); the left cross-section is near the midspan, and the right cross-section is near the support.
Applsci 13 08396 g001
Figure 2. Dimensions and section reinforcement diagram of scale beam (units: mm): (a) cross-section near the support; (b) cross-section near the midspan; (c) section reinforcement diagram near the support; (d) section reinforcement diagram near the midspan; (e) side view; (f) top view.
Applsci 13 08396 g002
Figure 3. Schematic diagram of constant current accelerated corrosion method. (a) on-site photo; (b) schematic diagram.
Applsci 13 08396 g003
Figure 4. Four-point bending test: (a) site photo; (b) schematic diagram.
Applsci 13 08396 g004
Figure 5. Calculation of corrosion area: (a) strand exposed to pitting corrosion (indicated with a red solid line); (b) random corrosion pit distribution; (c) pmD0/√2; (d) D0/√2 ≤ pmD0.
Applsci 13 08396 g005
Figure 6. Corrosion crack width wcr calculation diagram: (a) corrosion product accumulation around a seven-wire strand; (b) the increase in one external wire’s circumference.
Applsci 13 08396 g006
Figure 7. Calculated section diagram: (a) cross-section; (b) strain distribution; (c) stress distribution; (d) constitutive model for corroded prestressing strand; (e) constitutive model for concrete.
Applsci 13 08396 g007
Figure 8. Crack profile: (a) specimen L1; (b) specimen L2; (c) specimen L3; (d) specimen L4; (e) specimen L5; (f) specimen L6; (g) crack development sequence.
Applsci 13 08396 g008
Figure 9. Cracking and ultimate loads vs. mass loss.
Applsci 13 08396 g009
Figure 10. Comparison of the load–deflection curve.
Applsci 13 08396 g010
Figure 11. Comparison of the load–stiffness curve.
Applsci 13 08396 g011
Figure 12. Cracking moment ratios.
Applsci 13 08396 g012
Figure 13. Bearing capacity ratios.
Applsci 13 08396 g013
Figure 14. Displacement ductility factor.
Applsci 13 08396 g014
Table 1. Comparison of geometric parameters between prototype structure and scaled beam.
ItemsTotal Length/mCross-Section Near the MidspanCross-Section Near the Support
Area/mm2Inertia Moment/mm4Area/mm2Inertia Moment/mm4
Prototype structure32.609.19 × 1061.14 × 10131.44 × 1071.61 × 1013
Scaled beam2.083.69 × 1041.88 × 1084.88 × 1042.65 × 108
Theoretical ratio1/15.681/15.6821/15.6841/15.6821/15.684
Actual ratio1/15.671/15.7821/15.6941/15.7821/15.704
Table 2. Concrete mix ratio (units: kg/m3).
MaterialsCement (425#)SandGravel (8–12 mm)WaterFly AshMineral PowderWater Reducer
Dosage343686107214788.258.24.9
Table 3. Tensile test results.
ItemDiameter/mmYield Strength/MPaUltimate Strength/MPaElastic Modulus/MPa
Steel strain15.21834.01872.01.95 × 105
HRB3358322.4430.42.00 × 105
HPB2356330.0480.02.10 × 105
Table 4. Experimental results.
SpecimenL1L2L3L4L5L6
Design corrosion time/h035.2570.50105.75141.00211.50
Actual mass loss/%02.124.066.287.8412.30
Design mass loss/%0246812
Standard deviation of mass loss/%00.631.250.831.072.54
Test cracking load/kN72.068.062.265.858.052.0
Test cracking moment/kN·m23.5822.2020.3521.5618.8817.03
Predicted cracking moment/kN·m23.0621.5020.2719.3218.6217.41
Test ultimate load/kN232.5230.7222.0218.6196.7163.0
Test flexural bearing capacity/kN·m76.1475.5572.7171.5964.4353.38
Predicted flexural bearing capacity/kN·m49.4348.4848.1147.1842.9035.32
Yield displacement/mm11.35711.03512.31611.90312.10011.024
Ultimate displacement/mm36.50034.90038.14035.80035.28031.356
Displacement ductility factor3.213.163.103.012.922.84
Test failure modeCCCCCCCCSRSR
Predicted failure modeCCCCCCCCSRSR
Note: CC = concrete crushing; SR = strand rupture.
Disclaimer/Publisher’s Note: The statements, opinions and data contained in all publications are solely those of the individual author(s) and contributor(s) and not of MDPI and/or the editor(s). MDPI and/or the editor(s) disclaim responsibility for any injury to people or property resulting from any ideas, methods, instructions or products referred to in the content.