Article

Liquid to Fused Deposition Modeling (L-FDM)—A Revolution in Application Chemicals to 3D Printing Technology—Mechanical and Functional Properties

1
Centre for Advanced Technologies, Adam Mickiewicz University in Poznań, 10 Uniwersytetu Poznańskiego, 61-614 Poznań, Poland
2
Faculty of Chemistry, Adam Mickiewicz University in Poznań, 8 Uniwersytetu Poznańskiego, 61-614 Poznań, Poland
*
Authors to whom correspondence should be addressed.
Appl. Sci. 2023, 13(14), 8462; https://doi.org/10.3390/app13148462
Submission received: 19 June 2023 / Revised: 14 July 2023 / Accepted: 18 July 2023 / Published: 21 July 2023
(This article belongs to the Special Issue Multidimensional Additive Manufacturing)

Abstract

:

Featured Application

The L-FDM technique enables the direct introduction of chemicals, dyes, radioactive substances, pesticides, antibiotics, nanoparticles, trace elements, fertilizers, phosphors, monomers for polymerization, proteins, peptides, and active ingredients in the direct printing process from a polymer material with a typical FDM printer. With the proposed technology, it is now possible to introduce chemical substances into polymer filaments that were previously impossible to apply due to undergoing physical or chemical transformations during previous processing processes. This article discusses methods that eliminate the need for costly and energy-consuming processing equipment. These methods can be utilized in any laboratory by users without access to specialized devices.

Abstract

A novel L-FDM technique that builds upon the fundamentals of the FDM additive manufacturing process has been developed. It includes a mechanism that directly incorporates a chemical substance and alters polymer fibers throughout the fine process. This method eliminates the need for additional extrusion operations and compounding equipment to introduce chemical additives and solvents. This advancement opens up new opportunities for printers to be used in chemical labs to test new or known chemical substances. The paper outlines the technological assumptions, potential applications, and practical examples of direct filament modification using the L-FDM technique. The modifications made to the mechanical properties of the printed objects were confirmed through thermal analysis techniques (DSC), water contact angle measurements, electron microscopy (SEM-EDS), and mechanical analysis.

1. Introduction

Fused Deposition Modeling (FDM) has revolutionized the field of additive manufacturing by enabling the creation of complex three-dimensional objects with precision and efficiency [1]. This technique involves the extrusion of molten thermoplastic materials through a heated nozzle, layer by layer, to build up the desired object. However, the quality, strength, and functionality of the printed parts heavily rely on the properties of the materials used [2]. The most popular materials used in FDM printing are thermoplastics such as acrylonitrile butadiene styrene (ABS) and polylactic acid (PLA). These materials offer a good balance of affordability, ease of use, and availability, making them widely adopted in FDM 3D printing. ABS is a versatile thermoplastic known for its excellent impact resistance, strength, and durability. It can withstand higher temperatures compared to PLA, making it suitable for functional parts, prototypes, and mechanical components. PLA is a biopolymer and environmentally friendly thermoplastic derived from renewable resources such as cornstarch or sugarcane. It offers ease of printing, low odor, and comes in a wide range of colors. PLA is commonly used for prototypes, hobbyist projects, and decorative objects. While PLA is not as heat resistant as ABS, it is more rigid and generally exhibits better print quality [3]. Apart from ABS and PLA, there is a growing variety of specialized materials catering to specific applications and requirements. PET-G is a popular choice for its durability, transparency, and ease of printing. It offers improved impact resistance compared to PLA and is less prone to warping than ABS. PET-G is commonly used for functional parts, mechanical components, and packaging applications [4]. Filaments combine a thermoplastic matrix with finely ground wood or metal particles, the so-called PLA WOOD/Woodfill or Metal Composite Filaments. This specialty results in printed objects with a wood-like or metallic appearance. They are popular for artistic and aesthetic purposes, architectural models, and decorative objects [5]. Flexible filaments, such as Thermoplastic Polyurethane (TPU), offer elasticity and stretchability, enabling the creation of flexible parts and gaskets [6]. In recent years, significant progress has been made in developing a wide range of materials specifically tailored for FDM 3D printing. These materials exhibit enhanced characteristics, including mechanical strength, heat resistance, flexibility, and even electrical conductivity, opening up new possibilities for various applications. The availability of diverse materials has expanded the capabilities of FDM printers, making them suitable for prototyping, tooling, customized manufacturing, and even functional end-use parts [7,8]. It is well known that common 3D printing polymers such as nylon and polylactic acid (PLA) can significantly degrade their material properties when exposed to high temperatures and humidity for a long time. The ability of a material to absorb moisture is influenced by various factors, including the matrix and reinforcement materials, as well as the surrounding temperature, humidity, and duration of exposure to the challenging environment. In polymers, the ingress of moisture occurs through the diffusion of water molecules within the material. These water molecules are transported into the interior of the polymers through random molecular movements, and the absorption and diffusion rates are highly dependent on temperature and the inherent moisture content. At a microscopic level, the diffusion of moisture is significantly affected by the polarity and degree of crosslinking of the polymer, as well as the presence of residual monomers, hardeners, or other hydrophilic substances. The effect of water on a thermoplastic material is more pronounced when it is immersed in a liquid form compared to being in a vapor environment. The achievement of equilibrium is primarily influenced by sorption, which is directly related to the contact or wetting of water on the surface of the material. However, complete wetting of the thermoplastic with water does not occur because the surface tension of the water (72.5 dynes/cm) is too high. For wetting to occur, the surface energy of the polymer must exceed 72.5 dynes/cm, which can only be achieved by physical surface treatment or chemical modification [9]. The swelling of polymers is a phenomenon in which polymer molecules absorb external factors, such as moisture, increasing the material’s volume. It is an important phenomenon in various fields, such as chemistry, pharmacy, and materials engineering. The swelling of polymers is closely related to their structure and chemical properties. The main factors influencing swelling include interactions between polymer molecules, van der Waals forces, electrostatic interactions, and the polymer’s ability to absorb substances. The swelling of polymers can have both beneficial and detrimental effects. It can be used to create absorbing materials, such as hydrogels, which find applications in the medical industry. However, in some cases, swelling can lead to dimensional changes and decreased strength and durability of polymer materials [10,11].
Plastics produced through condensation polymerization, where water is liberated as a byproduct, have the potential to undergo degradation when subjected to elevated temperatures in the presence of water. Polyesters like polyethylene terephthalate (PET) or polylactide (PLA) are susceptible to a degradation mechanism known as hydrolysis, wherein the polymer chains are cleaved when exposed to acidic, alkaline, or certain neutral environments. Figure 1 shows the mechanism of the alcoholysis reaction of lactic acid polymer under the influence of alcohol [12,13].
All of the abovementioned properties of polymers can have significant importance and impact on the properties of objects printed using the L-FDM technique (Figure 2). The method was first described in the publication titled “Liquid for Fused Deposition Modeling Technique (L-FDM)—a revolution in application chemicals to 3D printing technology. Colour and elements”. Previously published by the authors of this publication, it involves passing a filament (thermoplastic polymer in the form of a 1.75 mm diameter filament) through a liquid modifier or a modifier solution in an organic solvent.
In this study, which is the second publication on the innovative L-FDM printing technique, the authors will focus on the new properties of L-FDM printed parts, in the example of commonly used PLA and PET-G filaments. Alcohol solutions of organosilicon compounds were used, which are commercially available. The influence of organic solvents on the properties of L-FDM prints was also examined.

2. Materials and Methods

2.1. Materials

2.1.1. Polymers

Polylactide (PLA) pellets (type Ingeo 2003D) were purchased from NatureWorks (Minnetonka, MN, USA) and extruded into filament, and polyethylene terephthalate glycol (PET-G) pellets (type Select BD 110) were purchased from Selenis (Portalegre, Portugal) and extruded into filament.

2.1.2. Solvents and Liquid Chemicals

The chemicals were purchased from the following sources: 3-Methacryloxypropyltrimethoxysilane(BRB Silanil 250, density 1.045 g/mL at 25 °C, viscosity 3.2 mm2/s), 3-Glycidoxypropyltrimethoxysilane (BRB Silanil 258, density 1.07 g/mL at 25 °C, viscosity 3.43 mm2/s at 25 °C), N-(2-Aminoethyl)-3-aminopropyltrimethoxysilane (BRB Silanil 176, density 1.019 g/mL at 25 °C, viscosity 6.5 cSt at 25 °C), n-Octyltriethoxysilane(BRB Silanil 294, density 0.875 g/mL at 25 °C, viscosity 1.9 cSt at 25 °C), Vinyltrimethoxysilane(BRB Silanil 276, density 0.968 g/mL at 25 °C, viscosity 0.7 mm2/s at 25 °C), 3-Mercaptopropyltrimethoxysilane (99%) (BRB Silanil 442 density 1.057 g/mL at 25 °C, viscosity 2 cSt at 25 °C) from BRB International, (2–4% aminoethylaminopropylmethylsiloxane)—dimethylsiloxane copolymer, 900–1200 cSt (AMS 233, density 0.98 g/mL at 25 °C), silanol terminated polydimethylsiloxane 35–45 cSt (DMS-S14, density 0.98 g/mL at 25 °C) from Gelest (Morrisville, PA, USA), and methanol (MeOH), ethanol (EtOH), isopropanol (i-PrOH), cyclohexanol (CyOH), benzyl alcohol (Bn OH), and n-butanol (n-BuOH) p.a. from P.P.H Stanlab (Lublin, Poland).

2.2. Devices and Methods

The L-FDM printing technology uses 3D FDM traditional printers commonly available in the Polish and global markets. This research used Creality Ender 5 (by Creality 3D) with a Bowden-type extruder. Two types of 3D models were printed, with beams and paddles for strength tests with dimensions corresponding to the type of tests. Detailed printing parameters are in Table 1.

2.3. Analyses—Instrumental Methods and Measurements

Water contact angle analysis (WCA) was performed by the sessile drop technique (5 μL) at room temperature and atmospheric pressure with a Krüss DSA100 goniometer. Three independent measurements were performed for each sample, each with a 5 μL water drop, and the obtained results were averaged.
Differential scanning calorimetry (DSC) was performed using a NETZSCH204 F1 Phoenix calorimeter. Samples of 6 ± 0.2 mg were placed in an aluminum crucible with a punctured lid. The measurements were performed under nitrogen in the temperature range of 20–220 °C and at a 10 °C/min heating rate.
For tensile strength tests using the L-FDM technique, paddle-type 1BA specimens were printed according to the PN-EN ISO 527-1:2020-0133 standards.
The tensile tests of the printed samples were carried out using the INSTRON 5969 universal testing machine with a maximum load force of 50 kN. The testing machine was set to a travel speed of 2 mm/min for the tensile strength measurements.
Charpy impact test (with no notch) was performed on an Instron Ceast 9050 impact machine according to ISO 179-135.
The morphology and microstructure of the prepared composites were observed by scanning electron microscopy (SEM). The imaging was performed in three SE modes. The surface observations were analyzed using a Hitachi SU70 scanning electron microscope equipped with an energy dispersive spectrometer (EDS) for chemical analysis.
Light microscopy Images of the surface and fractures of the composites were taken using KEYENCE VHX-7000 digital microscope (Keyence International, Mechelen, Belgium, NV/SA) with VH-Z100R wide-angle zoom lens at ×100 magnification. Images were taken with depth composition and the aid of 3D imaging-built software.

3. Results and Discussion

Using the new L-FDM technique, mechanical strength test samples with different liquid modifications introduced into the polymer matrix were printed. Figure 3 shows printed samples of unmodified PLA (A,D) and PET-G (B,E) and the arrangement of fittings in the working space of the 3D printer (C,F). The dimensions of the samples for mechanical strength tests are in accordance with the standards and are for 1BA paddles of length 75 mm, radius 30 mm, width at the ends 10 mm, width of the narrow part 5 mm, thickness 2 mm/4 mm (horizontal/vertical), for bars of length 80 mm, width 10 mm, and thickness 4 mm.

3.1. SEM/EDS

Surface and fracture observations, as well as miscibility of the additives with the PLA matrix, were analyzed using a scanning electron microscope equipped with an energy dispersive spectrometer (EDS) to assess the dispersion of the introduced organosilicon compound by the L-FDM technique into the PLA matrix (Figure 4 and Figure 5). EDS mapping was performed for carbon (marked as CK), oxygen (marked as OK), silicon (marked as SiK), and sulfur (marked as SK). The microscopic photographs of the PLA/BRB442/MeOH sample (Figure 4B) reveal a uniform distribution of silicon and sulfur within the polymer matrix, with no observable particle agglomeration. EDS maps of the fractures show that individual layers have a higher element content on their outer edges. The surface of the PLA/BRB295 sample also displays good silicon dispersion and no agglomerates. SEM images of the PLA/BRB 442 (Figure 4A) and PLA/BRB 294 (Figure 5A) samples show the presence of spherulites with a size of around 40 μm. Based on these analyses, it can be concluded that the modifier is effectively integrated into the filament during its immersion in the reservoir, and the silane is evenly distributed in the PLA matrix during the extrusion process on the 3D printer. EDS analysis confirms the presence of elements in the polymer matrix of L-FDM prints, indicating the potential use of this technique as a tool for introducing various chemicals into the polymer matrix.

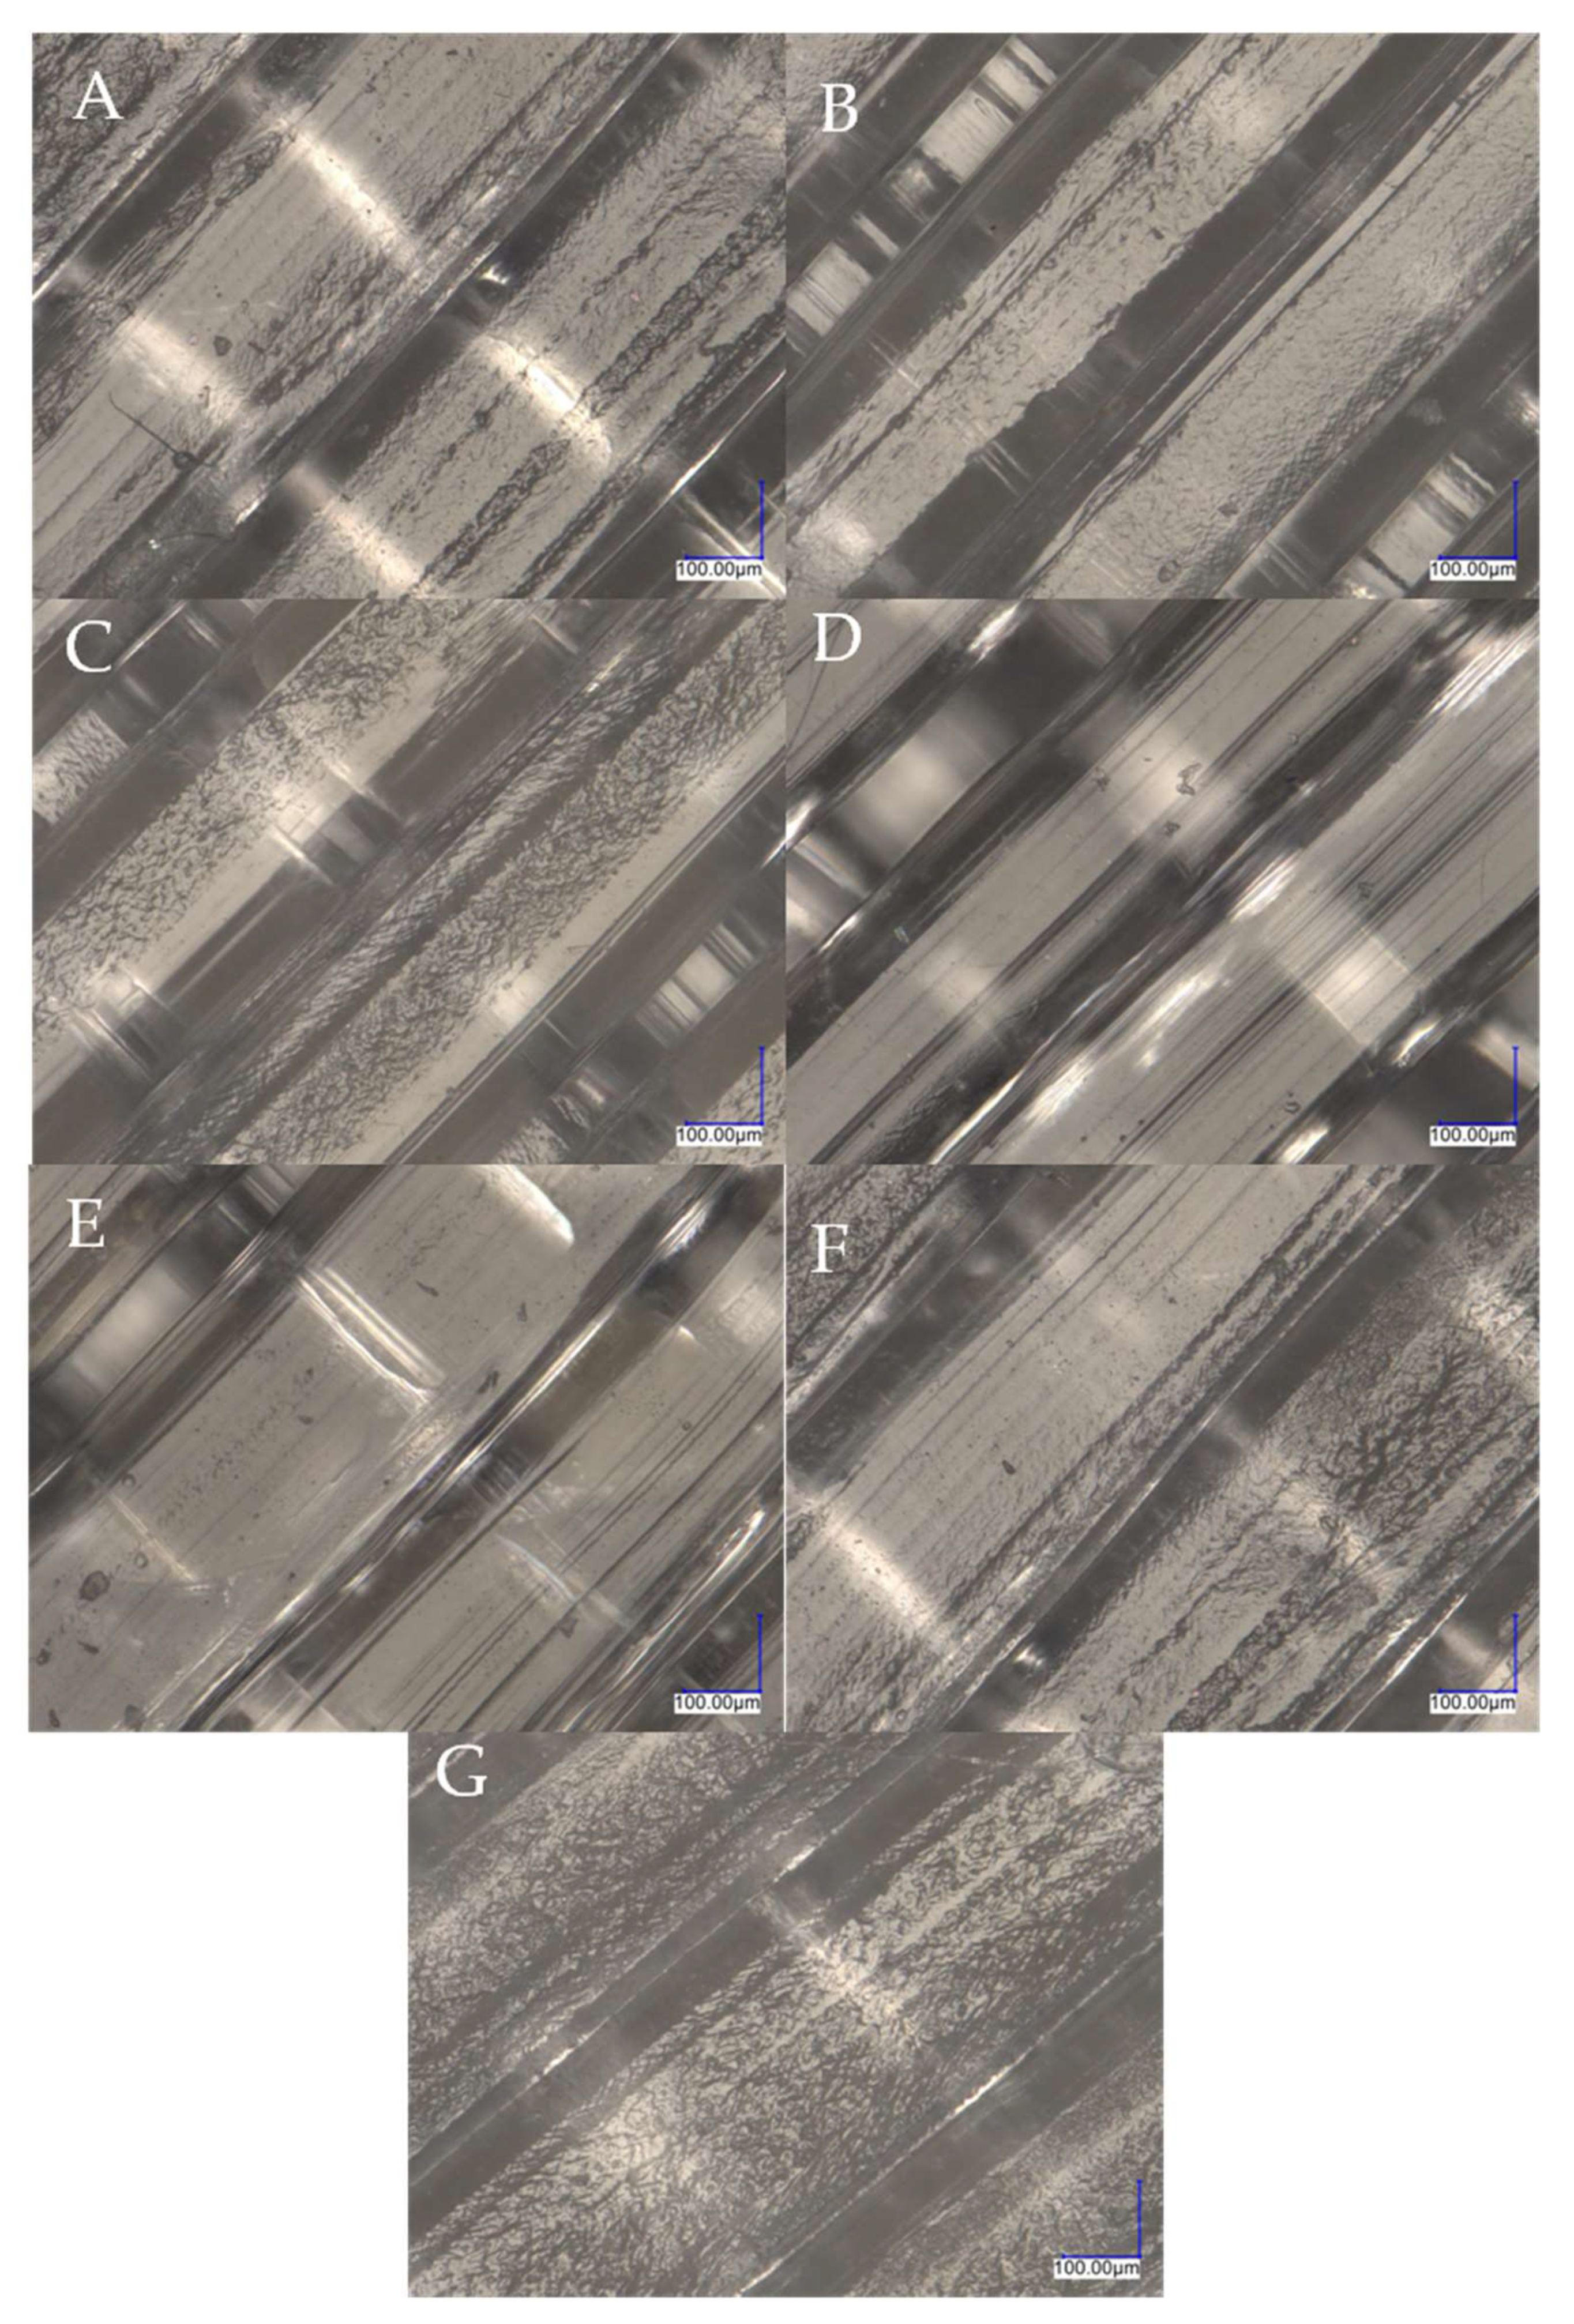
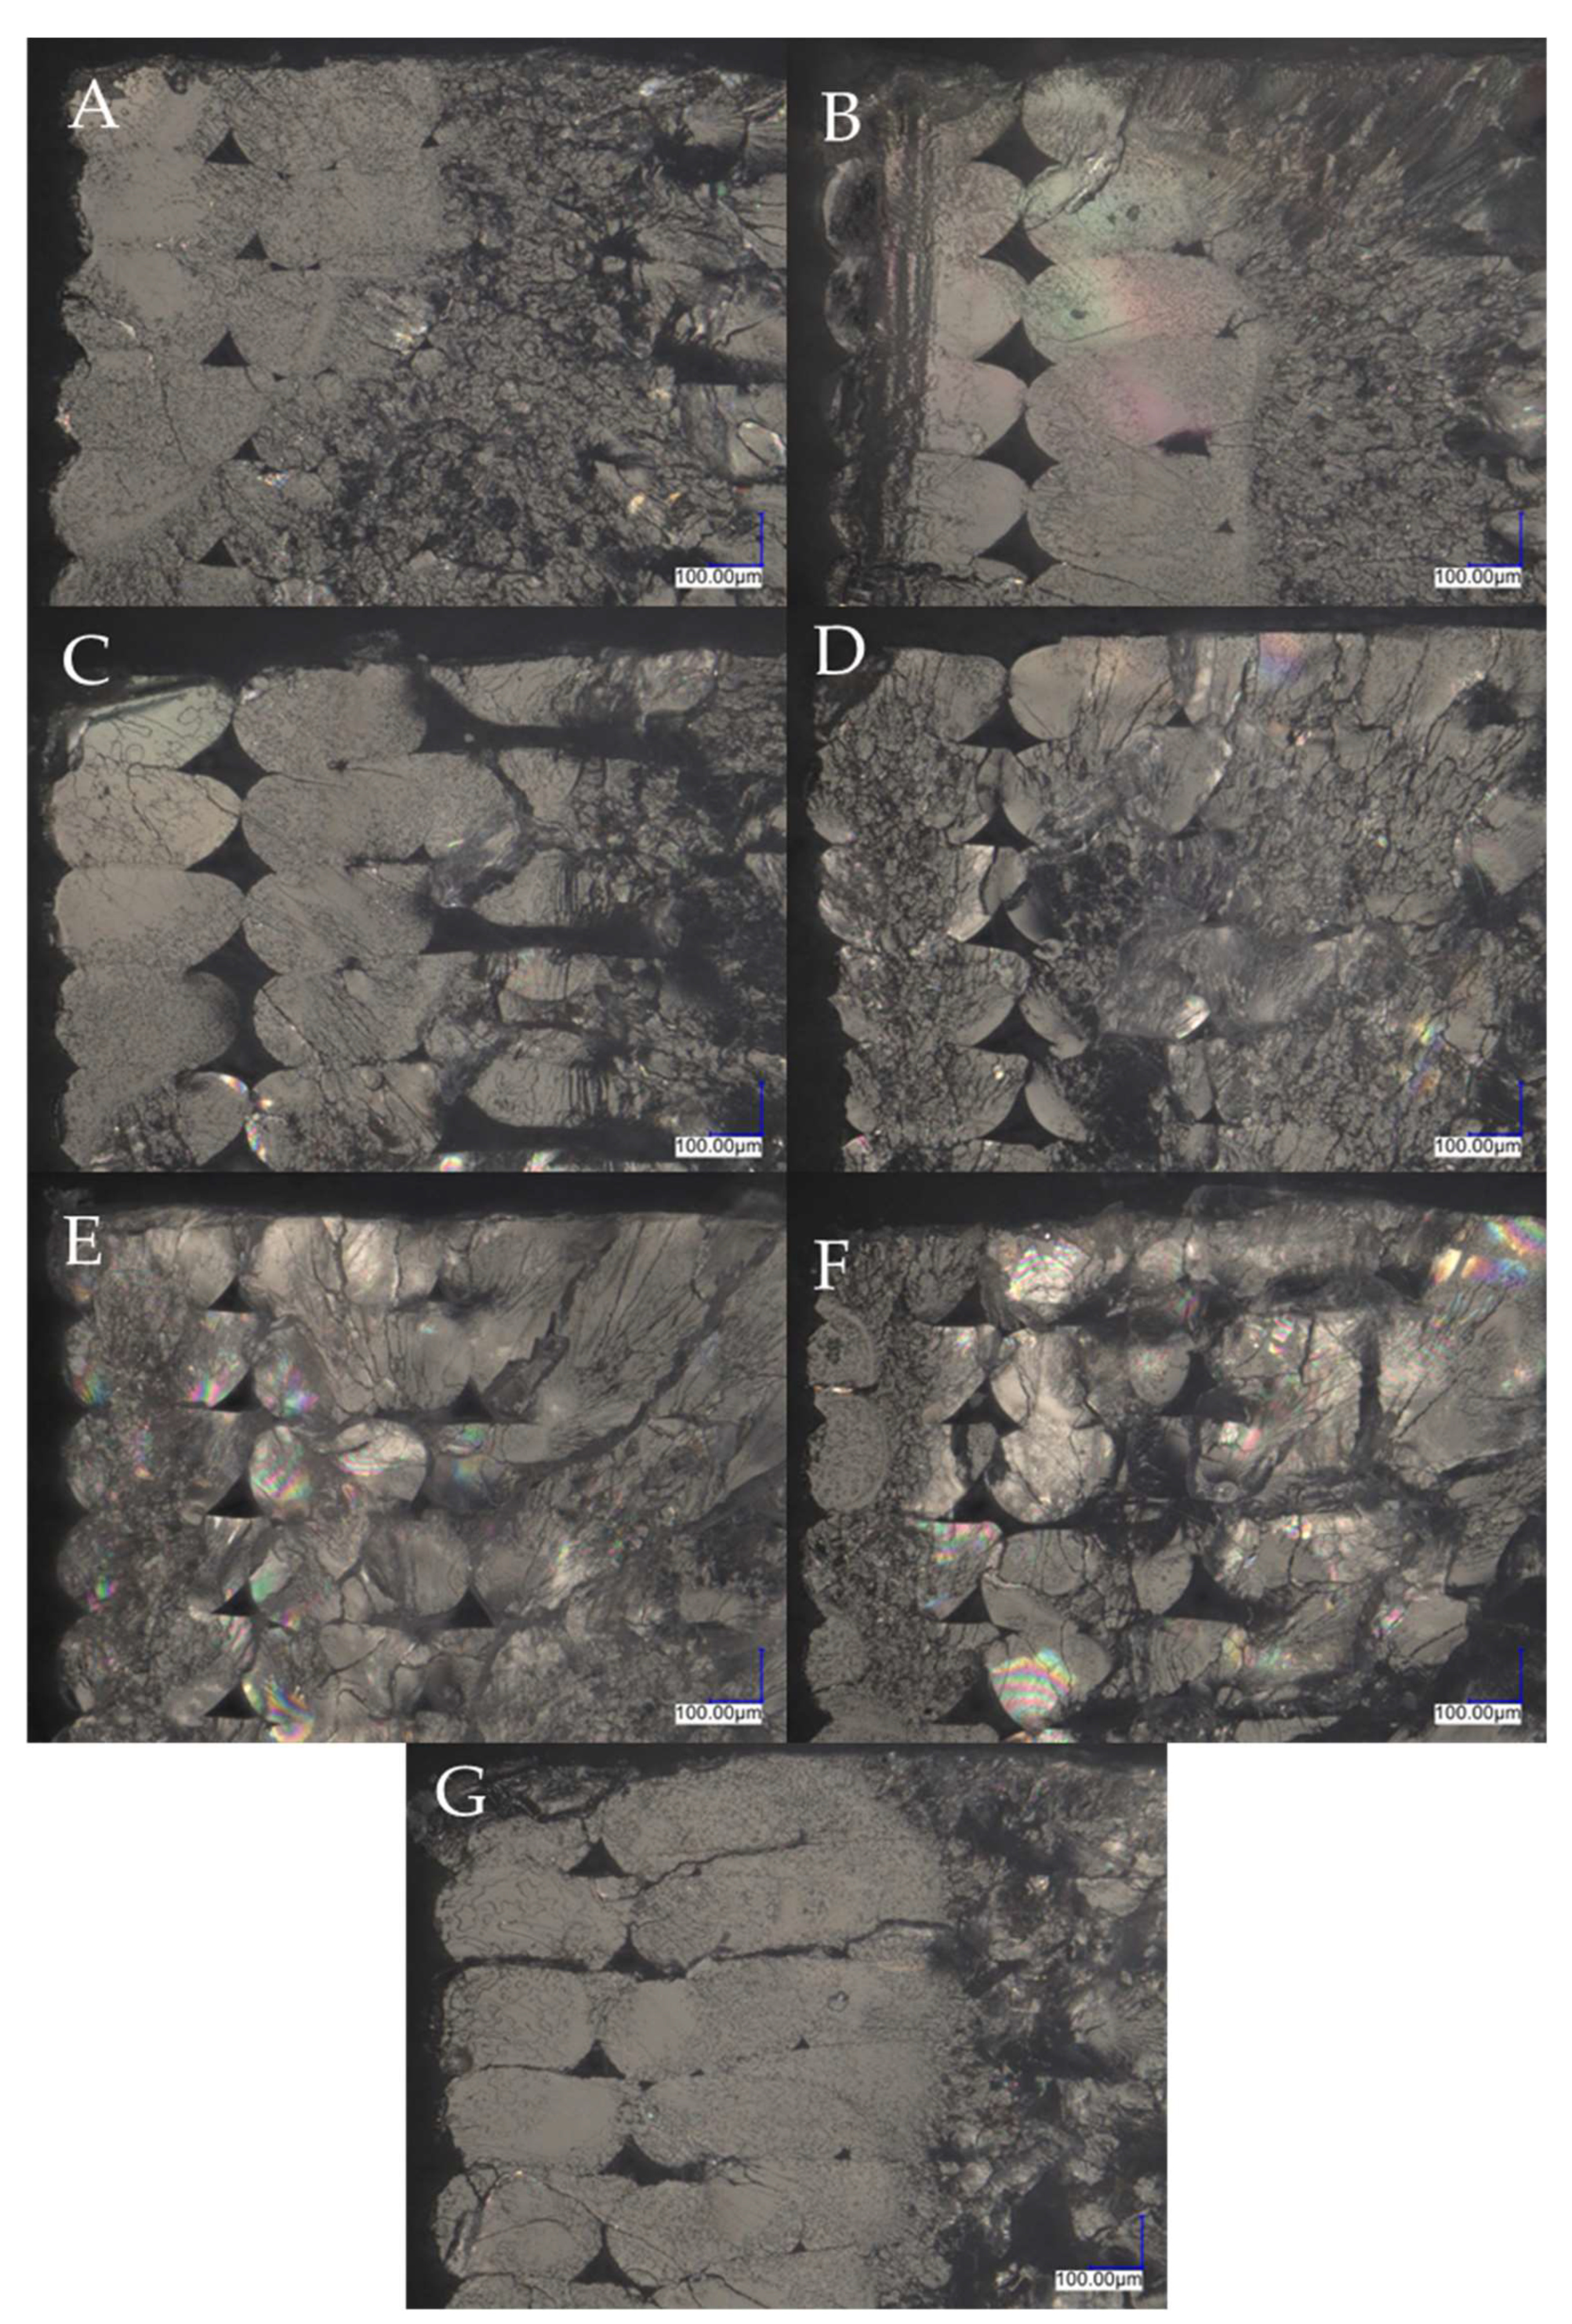
3.2. Digital Optical Microscope

The surface of PLA/alcohol bars printed in a horizontal orientation and a fragment of the fractures (after the impact test) were subjected to observation with an optical microscope. Figure 6 shows the image of the surface of the bars, enlarged 300 times; the filling layers are arranged at an angle of 45° to the outline line. The samples were printed on a 3D printer with a nozzle with a diameter of 0.4 mm; therefore, the width of the fill line of the printed samples is close to this value. The images in Figure 7 depict fractures in samples following Charpy impact testing, viewed at 100 times magnification. The photos display contour lines and filling due to the fragment of the fractures being observed. These structures are typical of polylactide, resulting in brittle fractures. Figure 7A–F exhibits samples modified with alcohols, while Figure 7G illustrates neat PLA, revealing air gaps between the layers arranged uniformly, which is usual for printed samples. Saturation of the filament with methyl alcohol was observed to decrease air gaps and make printing paths less visible. This is caused by the easy diffusion of small MeOH molecules into the polymer, increasing sample crystallinity (see Section 3.4 and Section 3.5). MeOH addition also causes layers to meld better, leading to no visible printing paths, indicating the plasticizing effect of the additive. As the linear alcohol chain length increases, larger air gaps are formed. Aromatic alcohols result in smaller defects for PLA/CyOH samples. The largest structural defects were observed for the BnOH sample, which also presented problems during the material feeding process.

3.3. Mechanical Properties

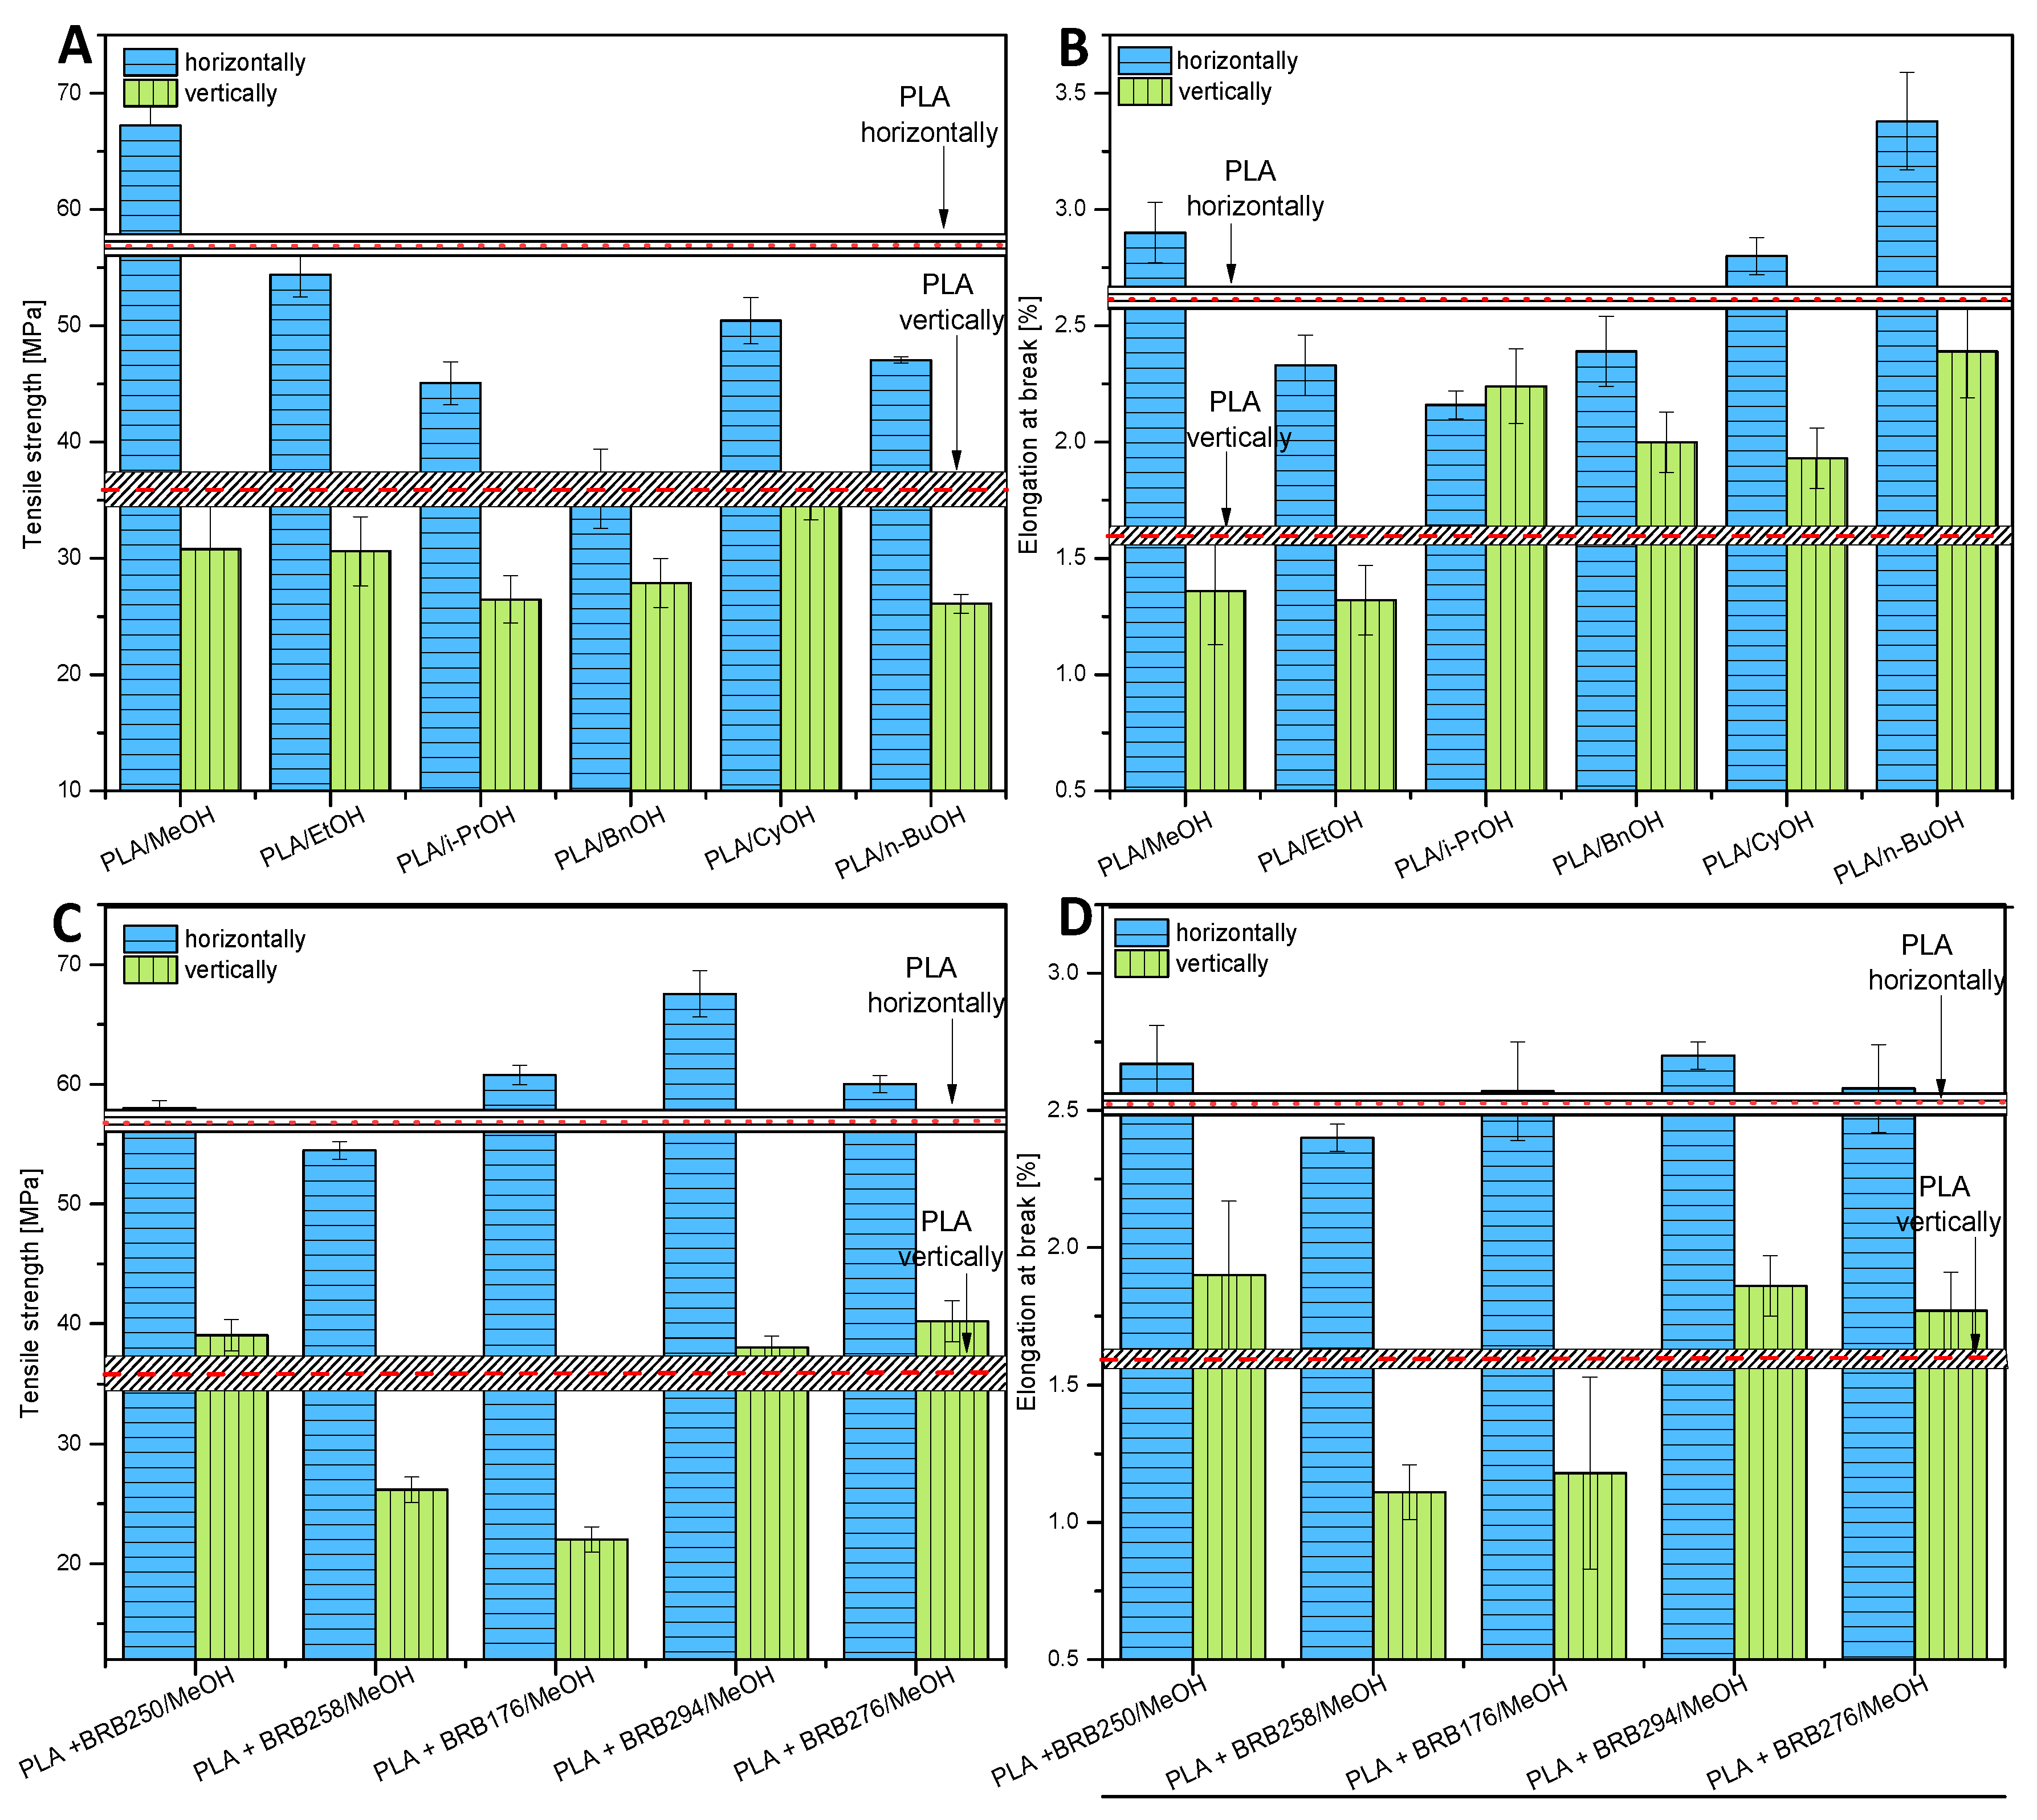
3.3.1. Tensile Strength

Tensile strength tests of composites in the PLA matrix were carried out for both a horizontal (blue on the graphs) and vertical (green) orientation, as shown in Figure 8 These fittings were obtained using the L-FDM method in 3D printing. The red lines marked on the graphs indicate the values of the reference samples, unmodified PLA printed both horizontally and vertically. Figure 8A,B display the parameters gathered from samples passed through an alcohol-filled reservoir, while Figure 8C,D show data obtained from bars produced by passing the filament through a reservoir containing silanes and silicone oils dissolved in methanol.
The tensile strength values for horizontally printed samples (Figure 8A) decreased as the alcohol chain length increased. The PLA/MeOH sample printed horizontally had the highest values, with an increase of 18.3% compared to the reference sample. MeOH simple structure enables it to penetrate effectively between the polymer chains, thereby modifying the polymer matrix more effectively. This effect is not observed with cyclic alcohols, resulting in the lowest strength value among the tested samples, which is shown by the Pla/BnOH alcohol-modified sample at 35.99 [MPa]. Benzyl alcohol dissolves esters and has a high boiling point (205 °C), allowing it to enter the extruder with the polymer and enhance the effect of polymer alcoholysis. Microscopic images also show that with the increase in the length of the alcohol chain, the number of defects (air gaps) increases, which results in a decrease in tensile strength.
Graphs 8C and 8D show test results for samples modified with solutions of silanes in methyl alcohol. Literature data indicate an improvement in the mechanical properties of PLA with the use of silane crosslinking (Figure 9) [14]. The highest increase in tensile strength was observed for the PLA/BRB294/MeOH sample, and compared to the reference, it is 18.94%. The strain at break also increased, which indicates the plasticizing nature of the additive. BRB 176 contains an amine functional group in its structure, capable of producing weak interactions with the polylactide matrix. An increase in the tensile strength of shapes printed in a horizontal orientation was observed. However, a completely opposite relationship was observed for fittings printed in a vertical orientation. The adhesion between the layers of the PLA/BRB 176/MeOH sample deteriorated significantly. Probably, this phenomenon could be caused by a change in the rheological properties of PLA and a reduced amount of dispensed material during the printing process, which could have caused a reduction in the surface of the connecting layer [15]. The observed changes in mechanical parameters are also a clear confirmation of the effectiveness of introducing the modifier with the L-FDM technique. The increase in the strength of samples with the addition of organosilicon compounds occurs due to their crosslinking with polyesters, as shown in Figure 9.
Similar tests were carried out for samples on the PET-G matrix (Figure 10). The red lines marked on the graphs indicate the values of the reference sample, unmodified PET-G. Most of the samples show an increase in tensile strength and an increase in elongation at break, which may indicate the plasticizing effect of methanol on PETG. Similar to samples printed with PLA, BRB 294 has the greatest impact on tensile strength, resulting in an increase of 53.73% over the reference sample. BRB 294 is the most optimal modifier for use in L-FDM printing to improve the strength properties of PETG prints. In the case of PETG, the smallest effect on tensile strength was shown by BRB 176. PLA/alcohols oraz PLA/alcohols/silanes were also printed in a vertical orientation in order to check the effect of polymer modification on adhesion in the direction of the Z-axis. The graph of Figure 10B shows the elongation of the samples at break [%]. The largest increase in this parameter was observed for the PLA/n-BuOH sample, both for horizontal and vertical printing, which indicates an increase in sample flexibility.

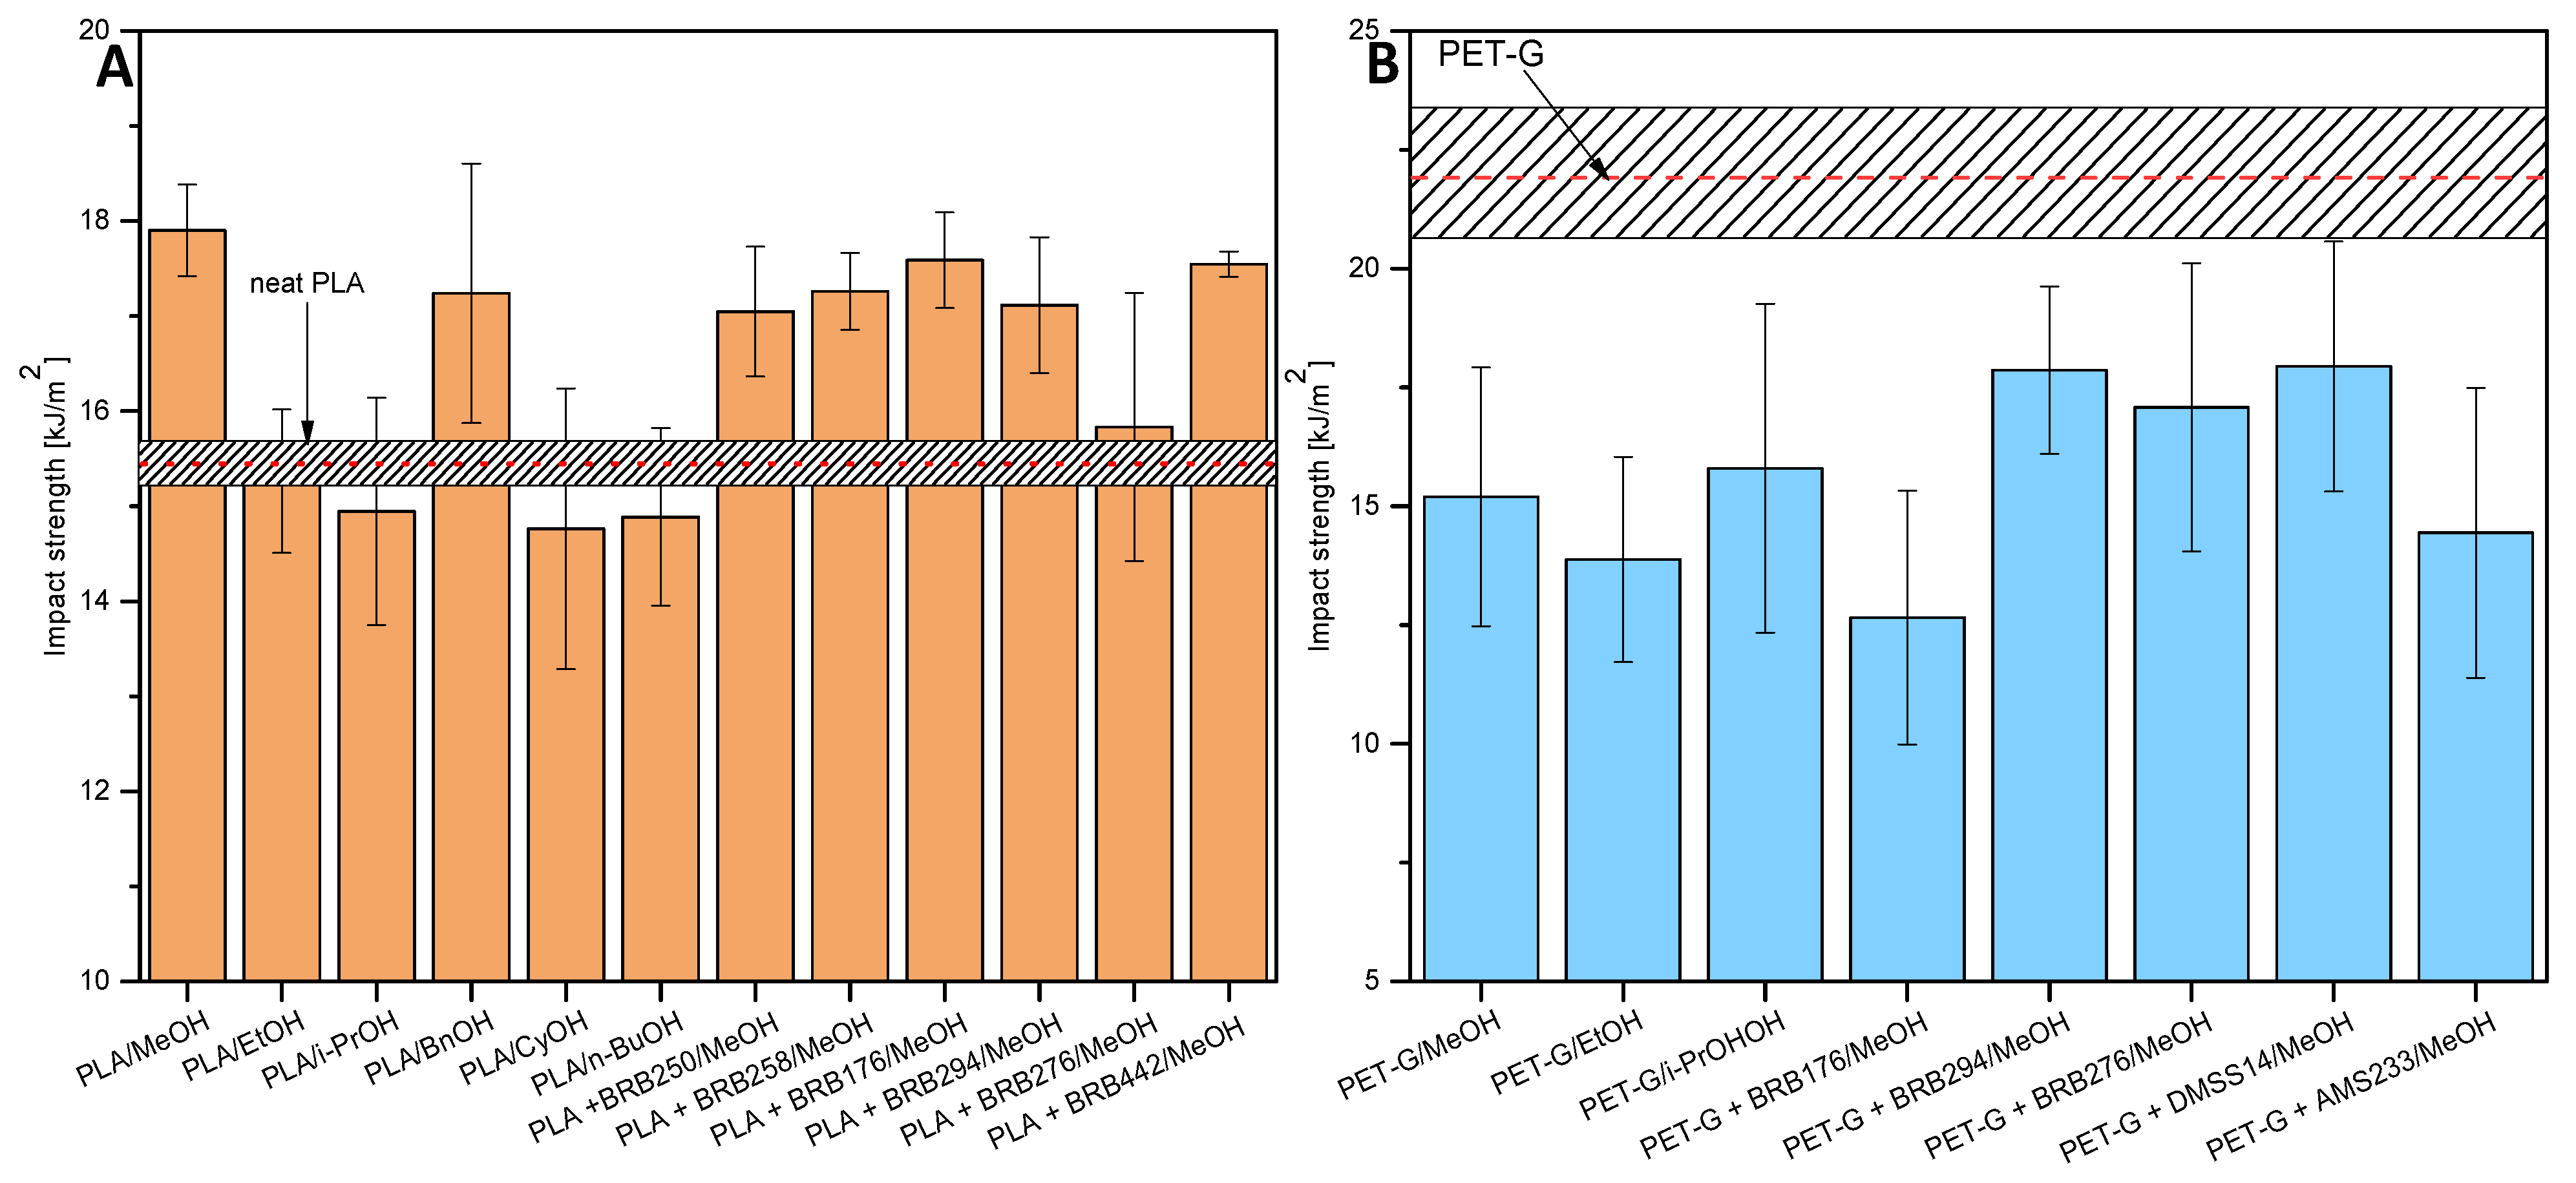
3.3.2. Impact Strength
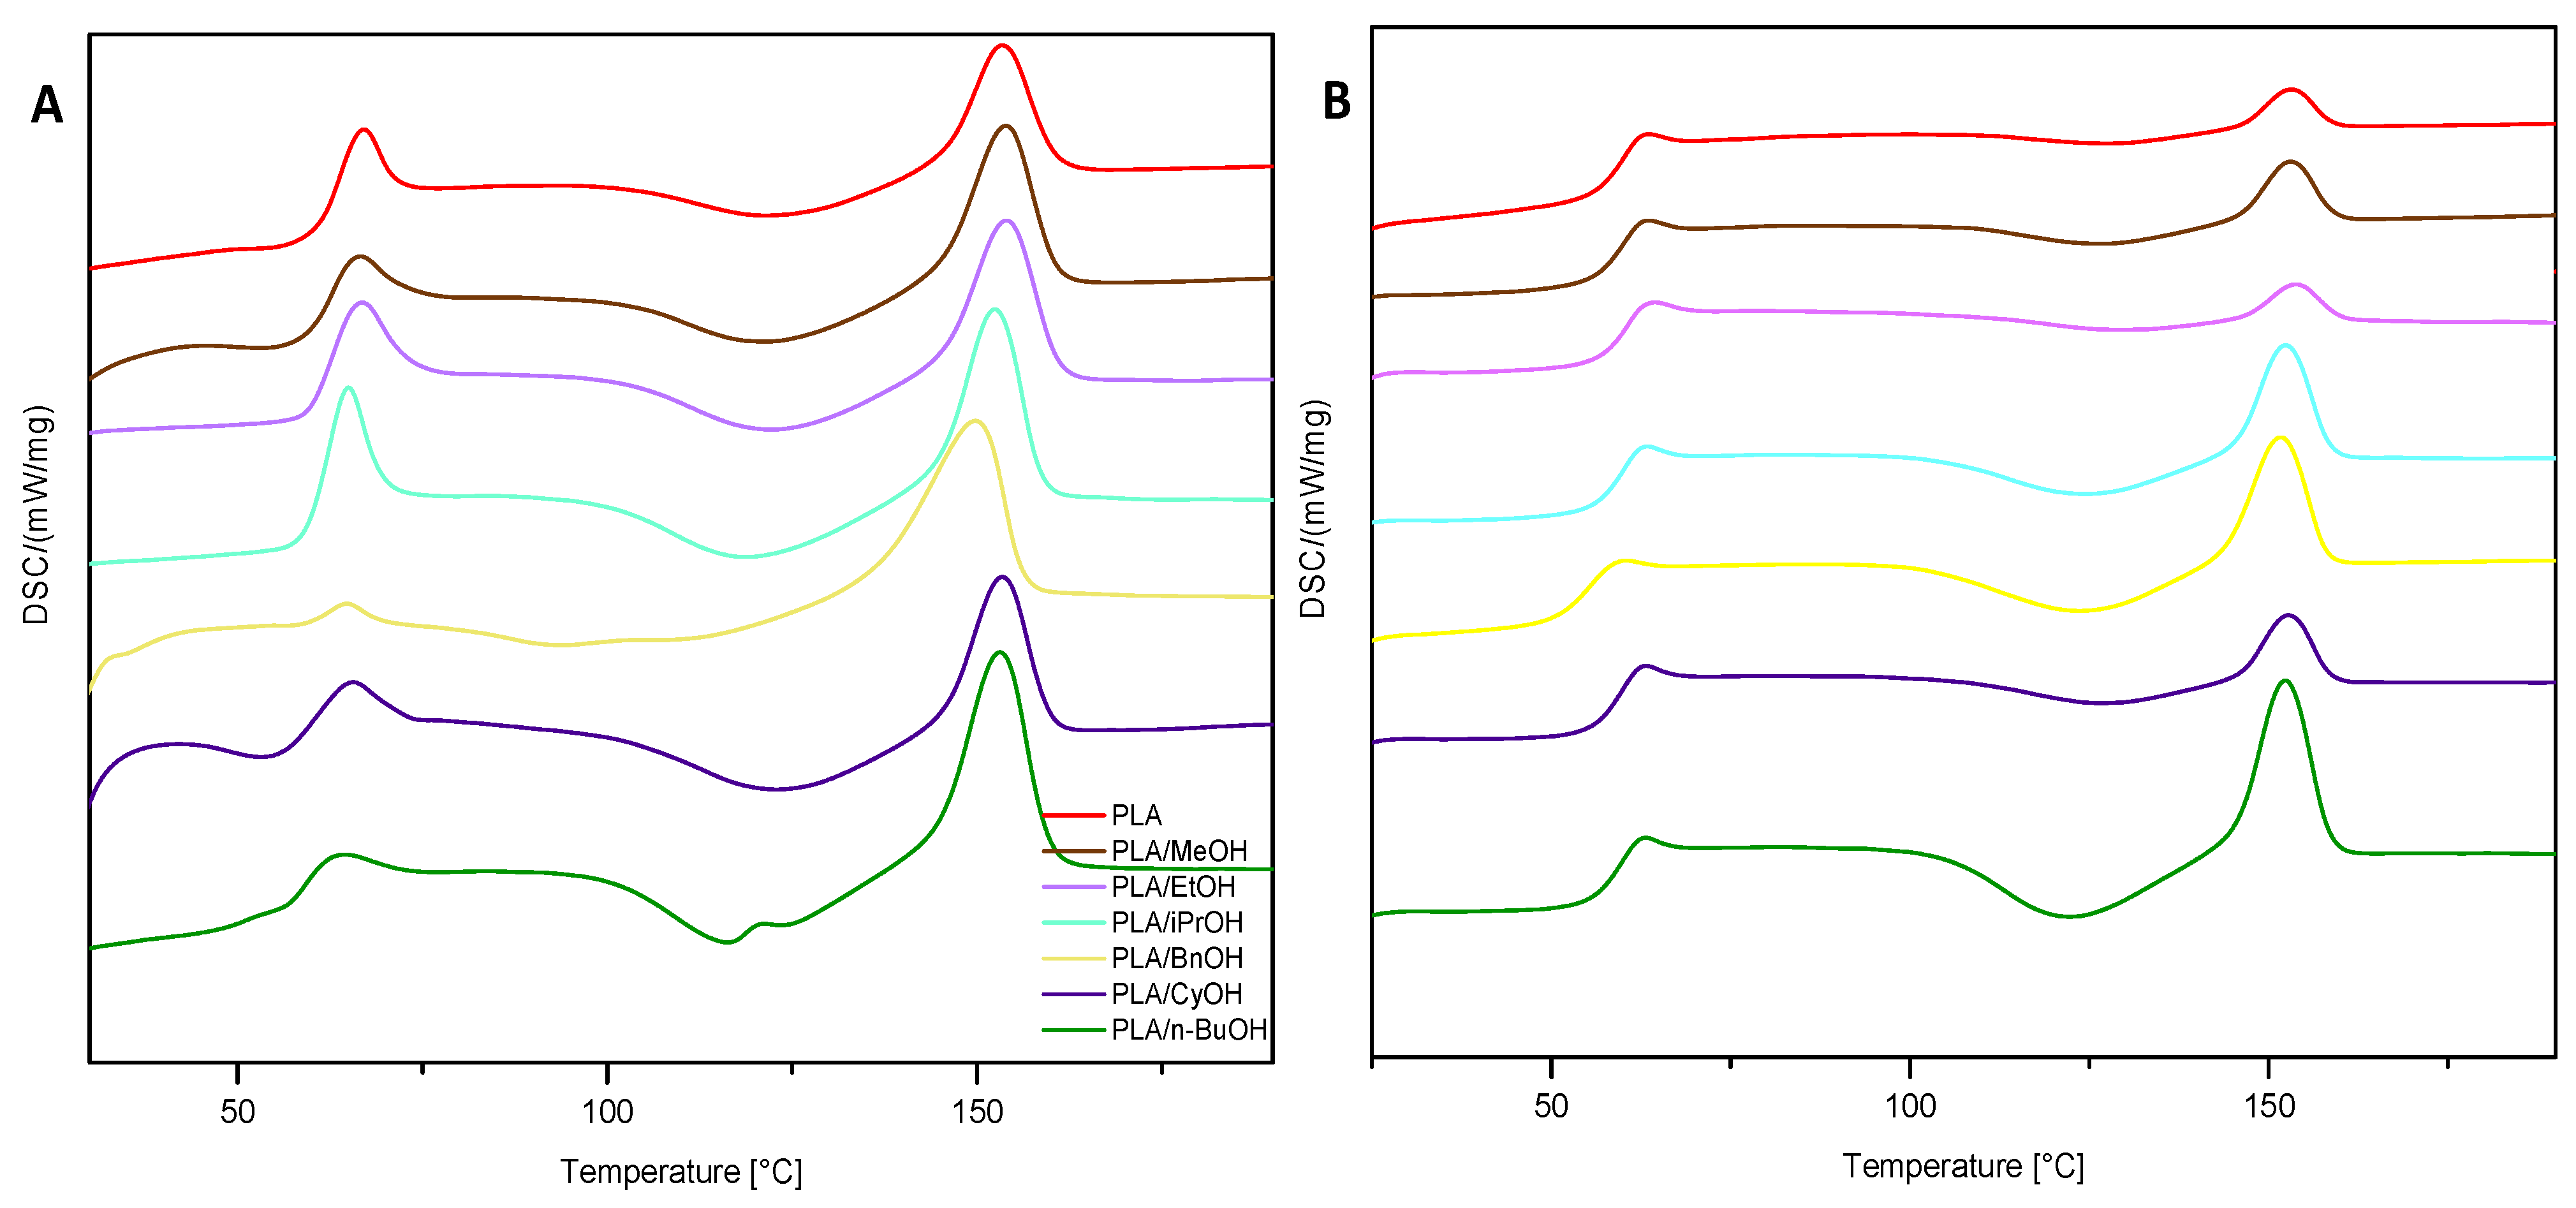
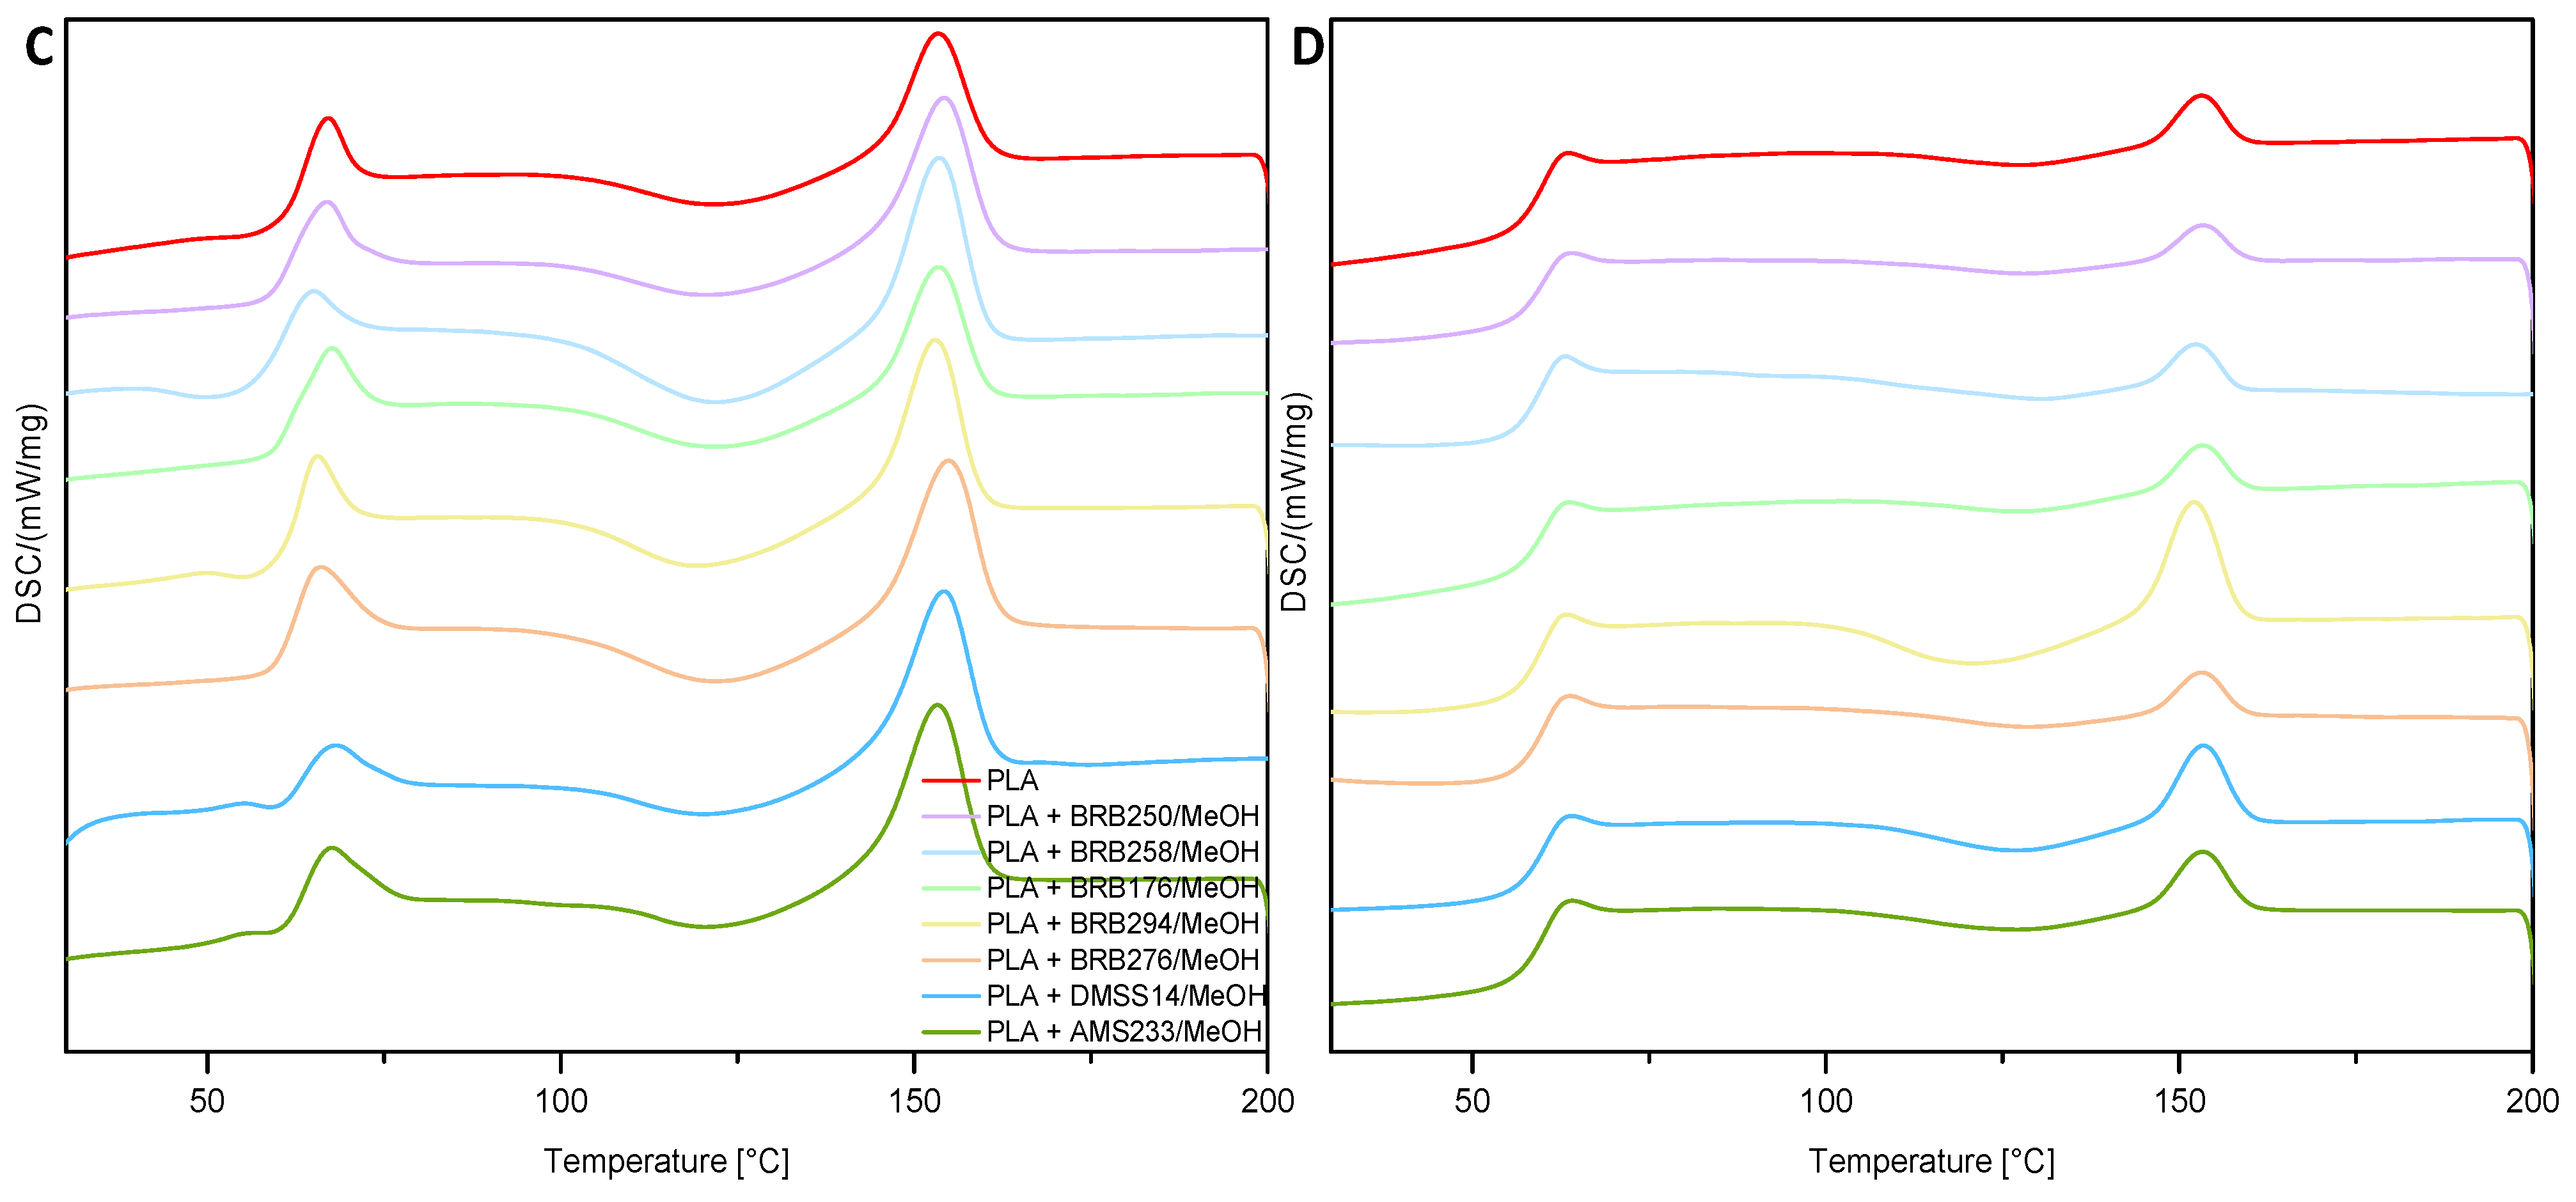
Impact tests were conducted on samples printed horizontally, with results presented in Figure 11A,B for PLA and PET-G composites, respectively. The tests revealed that passing the filament through a MeOH reservoir, resulting in PLA/MeOH and PLA/silanes/siloxanes composites, led to higher impact strength values compared to neat PLA. Specifically, PLA/MeOH had an impact strength of 17.90 kJ/m2, which is approximately 16% higher than the reference. Short alkyl chain alcohols were more effective at plasticizing the polymer matrix, increasing chain mobility, and resulting in greater impact resistance. For tested alcohols, i.e., i-PrOH, CyOH, and n-BuOH, polylactide was less soluble, thus the plasticizing effect was lower compared to MeOH [16].
Silane-modified PLA samples showed that the PLA + BRB176/MeOH composite had the highest value. The amino groups present in the modifier could interact with the polylactide matrix (esterification, self-condensation), and hydrogen bonding between PLA and the amino group was also possible, which increased the durability and effectiveness of the modifier compared to other systems [17]. Tensile strength tests (Section 3.3.1) showed a similar effect. In the publication titled “Enhanced Performance of Polylactide Film via Simultaneous Biaxial Stretching and Silane Coupling Agent as a Thermal Shrinkable Film” by Suttinun Phongtamrug, Rommaneeya Makhon, and Thanapa Wiriyosuttikul, a crosslinking reaction of amino silane was proposed (Figure 12) [17].
In contrast, PET-G composites showed decreased impact strength in each case compared to the reference sample, with alcohol or alcohol/silanes/siloxanes modification leading to increased brittleness. Poor solubility of the polymer in methanol hindered the diffusion of the solvent, resulting in a lack of observed plasticizing effects on the matrix.
Table 2 summarizes the physical and chemical properties of the alcohols used in the study, as well as the thermal and strength test results of L-FDM prints. L-FDM prints of PLA with alcohols having the lowest pKa values (MeOH and BnOH) exhibit the highest impact resistance, with values of 17.9 and 17.2 kJ/m2, respectively.

3.4. DSC

Differential scanning calorimetry (DSC) tests were carried out in two cycles of heating and cooling in the temperature range of 20–220 °C and at a 10 °C/min heating rate in the flow of inert gas. The heat of fusion was determined from the DSC thermograms for each sample in both cycles. The heat of fusion (∆Hm) is determined from the area between the peak contour and the baseline. Knowing ∆Hm, the degree of crystallinity (wc) can be determined from the formula [18]:
w c = Δ H m Δ H m 0 × 100 %
where wc—degree of crystallinity [%]; ∆Hm—heat of fusion [J/g]; ∆ H m 0 —heat of fusion of 100% crystalline polymer (wc = 100%) [J/g]
Based on literature data, ∆ H m 0 for neat PLA is 93.6 J/g [19].
The crystallinity of neat PLA and PLA modified with different alcohols (Figure 13A) and silanes/siloxanes (Figure 13B) was analyzed using the DSC method. The results showed higher crystallinity in the first heating cycle, which can be attributed to the thermal history and reorganization of polymer structures [20,21,22]. During the printing process, residual internal stresses on the unit structure may be present in the polymer, which are often released during the first heating cycle and affect the reorganization of the polymer structure. Additionally, the heating process can affect the spatial arrangement of polymer molecules and establish the rules and principles of the structure, affecting the degree of crystallinity—taking into account the fact that the degree of crystallinity depends on the type of material in the matrix. In the L-FDM technology, the addition of alcohol or solutions of silanes and siloxanes changed the degree of crystallinity. Literature data indicate that in PLA/alcohol systems, crystallization in an induced substance (SIC) is possible, caused by sorption and diffusion of alcohol through the polymer [23].
Hydrolysis in an aqueous environment causes some changes in the crystallinity of PLA, which is mainly dependent on the length of the polymer chains. Other parameters affecting the crystallization process include processing conditions, cooling rate, and nucleating factors [24].
Figure 14 shows the DSC curves for the first and second heating cycles. The graphs show three characteristic ranges for semi-crystalline polymers, which correspond to glass transition, crystallization, and melting. The glass transition temperature (Tg) ranges from 45 °C to 70 °C, the cold crystallization temperature (Tcc) from 100 °C to 135 °C, and the melting point is 145–165 °C.
Results showed that in the first cycle for all modified results of the cold crystallization test, there was a broad peak. In the second heating cycle, the transition is most effective for PLA/n-BuOH, PLA/Bn OH, PLA/iPR, and PLA/CyOH, i.e., for alcohol with a more complex structure in the duct compared to simple methanol and ethanol. The introduction of the modifier into the polymer matrix causes changes in the melting point. From the graph (Figure 14B), it can be seen that the peak in the range of 145–165 °C (Tm) is smaller than for the pure polymer. PLA/n-BuOH, PLA/Bn OH, PLA/iPR, and PLA/CyOH samples result in a greater investment of this peak, which results from an increase in crystallinity. In the crystalline phase, intermolecular behaviors are developed and stronger, leading to greater absorption of melting energy.

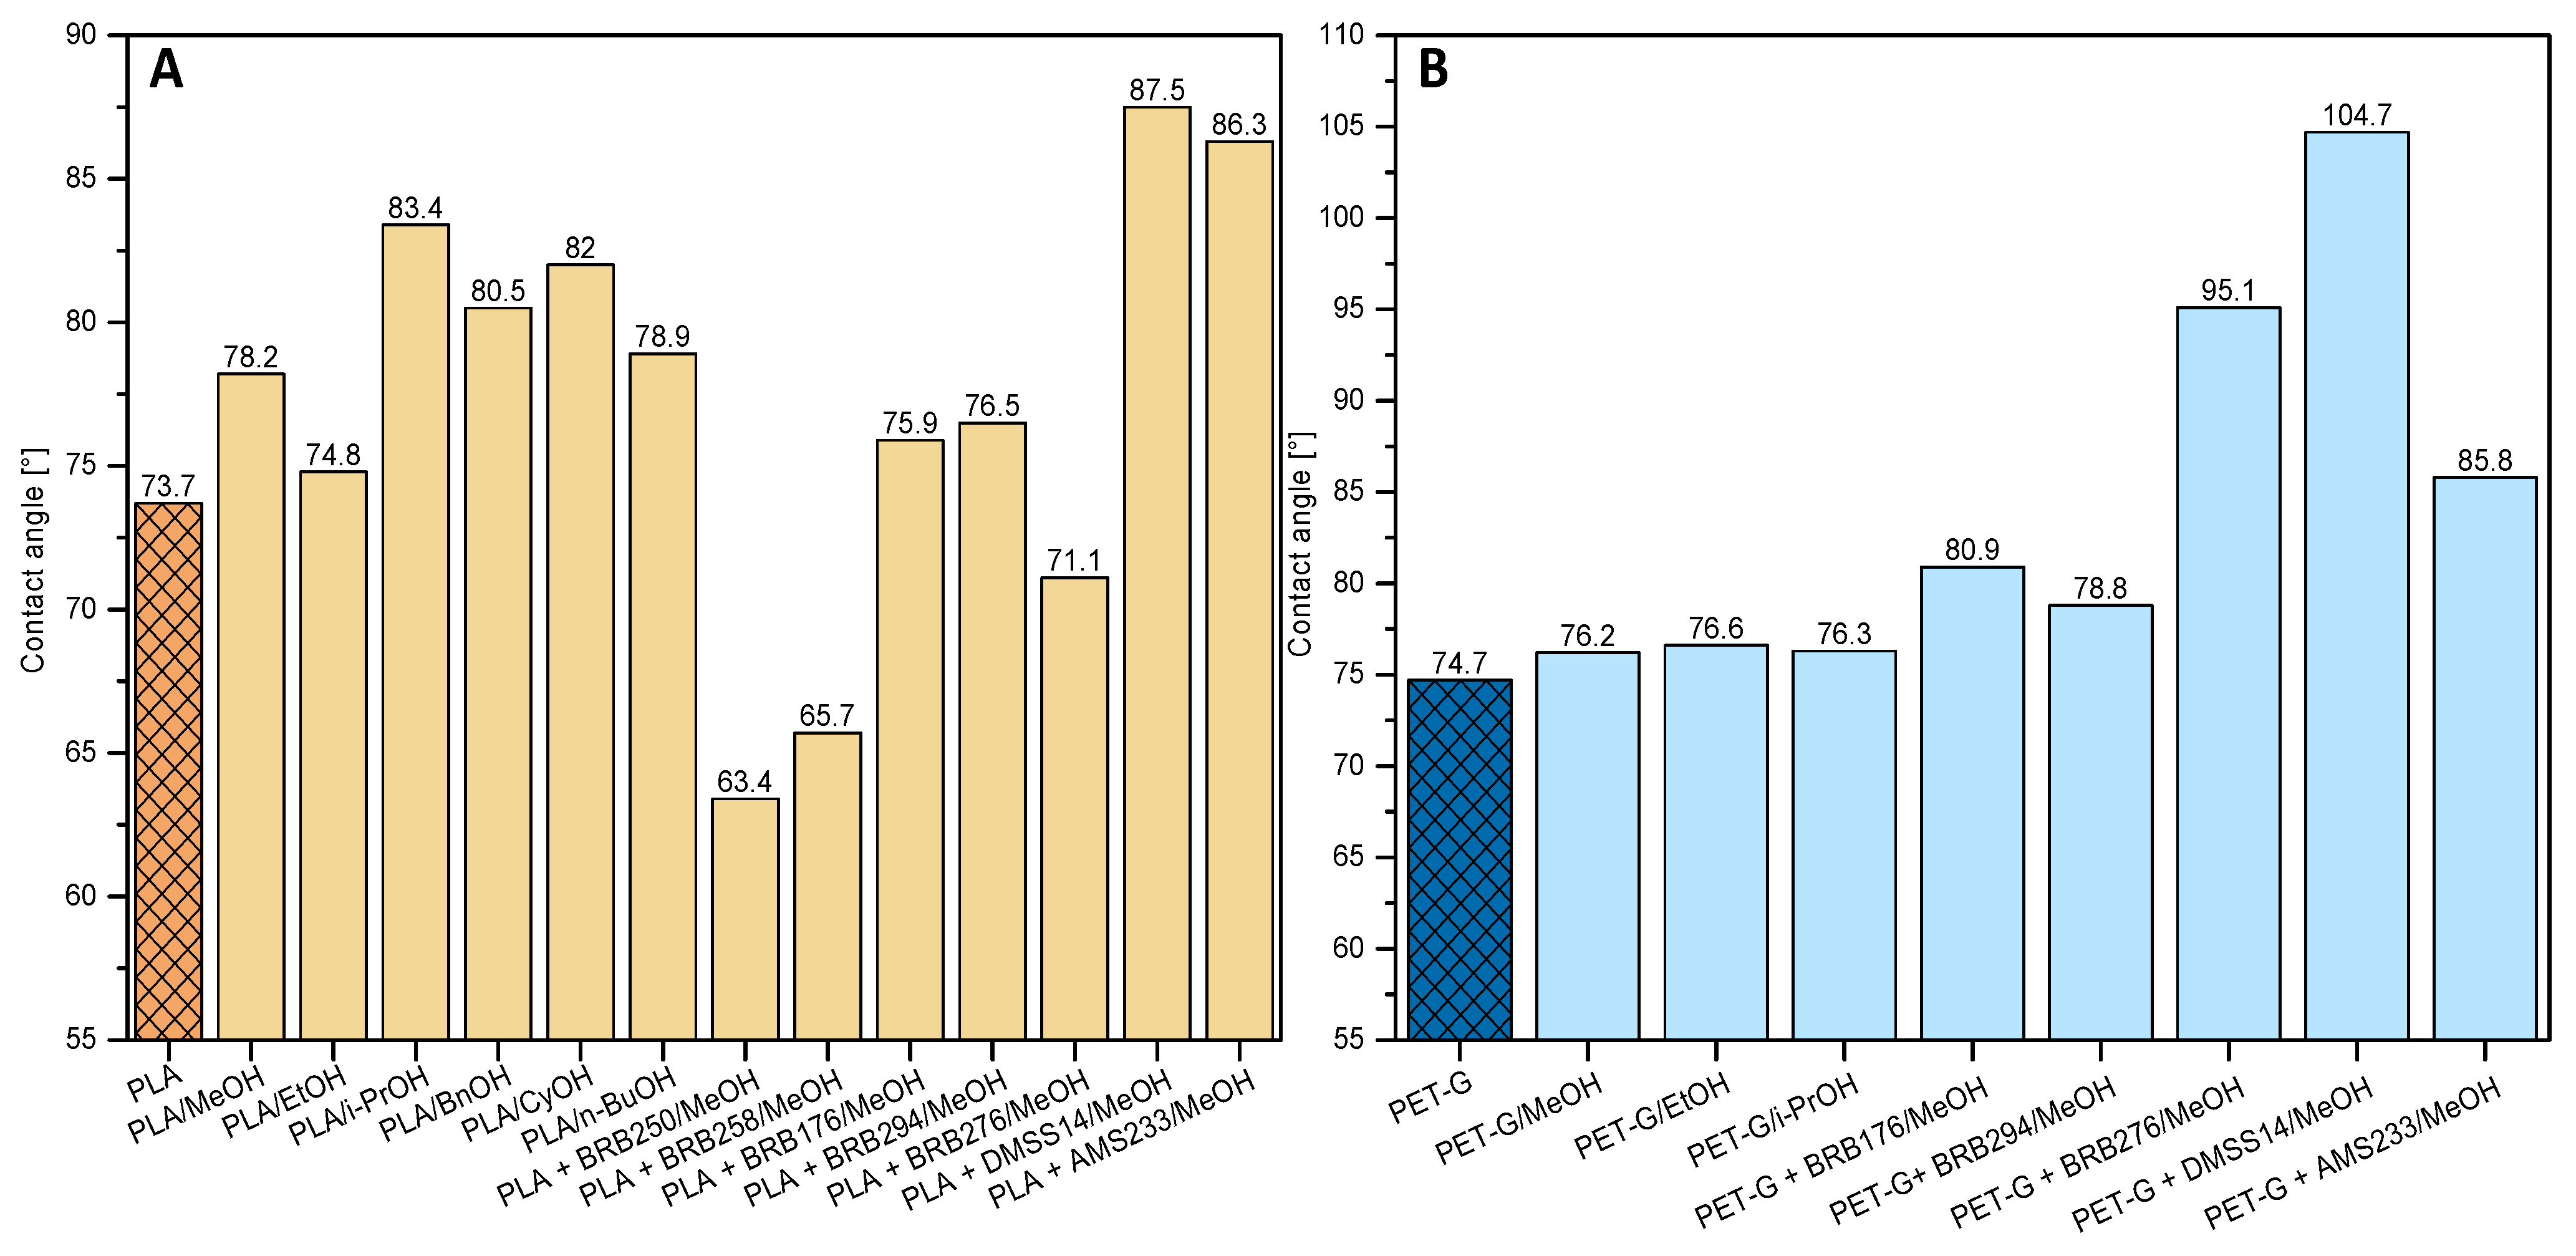
3.5. Water Contact Angle (WCA)

The contact angle analysis is crucial in determining the surface properties of modified materials, providing insight into the influence of modifiers on hydrophilic–hydrophobic properties. For hydrophilic and hygroscopic materials like polylactide and PET-G, it is recommended to dry them before processing to eliminate the excess moisture, which could cause complications during extrusion or printing. The contact angle value of PLA is 73.7°, while that of PET-G is 74.7°. Figure 15A shows the contact angle values for PLA/alcohols/silanes/siloxanes samples, while Figure 15B shows the contact angle values for PET-G/alcohols/silanes/siloxanes. Short alkyl-chain alcohols like methanol (MeOH) and ethanol (EtOH) have little effect on the hydrophilic–hydrophobic properties of polylactide. On the other hand, composite materials modified with alcohols with branched, cyclic, or aromatic structures have higher contact angle values compared to pure PLA. Factors that influence the contact angle include changes in surface energy or chemical interactions between R-OH and the polymer, affecting wettability. Microscopic results reveal that contact angle values are dependent on defects that occur in the structure after the printing process, with samples having air gaps and poor fusion of layers having higher wetting angles due to increased surface roughness.
Composites modified with organosilicon compounds, like siloxane with amino groups, generate weak interactions with the polymer matrix, resulting in the highest contact angle values. AMS233 (2–4% aminoethylaminopropylmethylsiloxane)—a dimethylsiloxane copolymer—creates a hydrophobic layer on the material surface, acting as a barrier that prevents water and other polar substances from penetrating. Using modifiers based on organosilicon compounds increases the contact angle value, reducing the surface tension of hydrophilic polylactide [25]. DMS-S14 has silanol units (Si-OH) in its structure, which can interact with the PLA matrix [26]. The L-FDM method modifies not only the polymer surface but also the entire composite structure. In contrast, PET-G modification does not alter contact angle values due to the matrix’s physicochemical properties, which are insoluble in most alcohols like methanol, ethanol, or isopropanol. PET-G + BRB276/MeOH and PET-G + DMS-S14/MeOH have angle values characteristic of hydrophobic materials (>90°). The vinyltrimethoxysilane acts as a crosslinking agent, with hydrolysis leading to the formation of Si-OH groups that condense under appropriate conditions, affecting the composite’s hydrophobic properties [27]. DMS-S14 and AMS233 also have a similar effect on polylactide modifications, increasing the contact angle values. Research by E. S. Trofimchuk et al. indicates that different solvents and their ability to wet the polymer have the effect of reducing surface energy [28].

4. Conclusions

The work confirmed that the new L-FDM technique can change the properties of printed objects by directly introducing chemical compounds such as chemicals, dyes, radioactive substances, pesticides, antibiotics, nanoparticles, trace elements, fertilizers, phosphors, monomers for polymerization, proteins, peptides and active ingredients. In the process, there is no need to use traditional equipment for processing, mixing and machining composites. The revolutionary approach of the method developed by our team allows you to obtain completely new materials for 3D printing not only in industrial conditions, but also in laboratories or by private users without access to specialized equipment. Using this technique, simple, commercially available alcohols and organosilicon compounds were introduced into the polymer matrix. The tensile strength increased by 18.33% for PLA prints and 53% for PET-G prints. The prints were characterized by higher impact resistance and a more hydrophobic surface. Based on the presented EDS images, it was shown that the dispersion of the incorporated chemical in the polymer matrix varies depending on the specific chemical used.

5. Patents

The results of the publication have been patented in Polish patent application no P.441923.

Author Contributions

Conceptualization, R.E.P.; methodology, R.E.P.; software, E.G., D.P. and B.S.; validation, R.E.P. and B.S.; formal analysis, D.P. and B.S.; investigation, E.G. and D.P.; resources, R.E.P. and B.S.; data curation, R.E.P., B.S. and E.G.; writing—original draft preparation, B.S., D.P. and E.G.; writing—review and editing, R.E.P.; visualization, E.G. and D.P.; supervision, R.E.P. and B.S.; project administration, R.E.P. and B.S.; funding acquisition, R.E.P. and B.S. All authors have read and agreed to the published version of the manuscript.

Funding

This research was funded partially by the National Centre for Research and Development under the LIDER X project (LIDER/01/0001/L-10/18/NCBR/2019).

Institutional Review Board Statement

Not applicable.

Informed Consent Statement

Not applicable.

Conflicts of Interest

The authors declare no conflict of interest.

References

  1. Dhinakaran, V.; Kumar, K.M.; Ram, P.B.; Ravichandran, M.; Vinayagamoorthy, M. A review on recent advancements in fused deposition modeling. Mater. Today Proc. 2020, 27, 752–756. [Google Scholar] [CrossRef]
  2. Dizon, J.R.C.; Espera, A.H.; Chen, Q.; Advincula, R.C. Mechanical characterization of 3D-printed polymers. Addit. Manuf. 2018, 20, 44–67. [Google Scholar] [CrossRef]
  3. Kristiawan, R.; Imaduddin, F.; Ariawan, D.; Ubaidillah Arifin, Z. A review on the fused deposition modeling (FDM) 3D printing: Filament processing, materials, and printing parameters. Open Eng. 2021, 11, 639–649. [Google Scholar] [CrossRef]
  4. Özen, A.; Auhl, D.; Völlmecke, C.; Kiendl, J.; Abali, B.E. Optimization of Manufacturing Parameters and Tensile Specimen Geometry for Fused Deposition Modeling (FDM) 3D-Printed PETG. Materials 2021, 14, 2556. [Google Scholar] [CrossRef]
  5. Arockiam, A.J.; Subramanian, K.; Padmanabhan, R.G.; Selvaraj, R.; Bagal, D.K.; Rajesh, S. A review on PLA with different fillers used as a filament in 3D printing. Mater. Today Proc. 2022, 50, 2057–2064. [Google Scholar] [CrossRef]
  6. Wang, J.; Yang, B.; Lin, X.; Gao, L.; Liu, T.; Lu, Y.; Wang, R. Research of TPU Materials for 3D Printing Aiming at Non-Pneumatic Tires by FDM Method. Polymers 2020, 12, 2492. [Google Scholar] [CrossRef]
  7. Wickramasinghe, S.; Do, T.; Tran, P. FDM-Based 3D Printing of Polymer and Associated Composite: A Review on Mechanical Properties, Defects and Treatments. Polymers 2020, 12, 1529. [Google Scholar] [CrossRef]
  8. Roberson, D.; Shemelya, C.M.; MacDonald, E.; Wicker, R. Expanding the applicability of FDM-type technologies through materials development. Rapid Prototyp. J. 2015, 21, 137–143. [Google Scholar] [CrossRef]
  9. Banjo, A.D.; Agrawal, V.; Auad, M.L.; Celestine, A.D.N. Moisture-induced changes in the mechanical behavior of 3D printed polymers. Compos. Part C Open Access 2022, 7, 100243. [Google Scholar] [CrossRef]
  10. Proikakis, C.S.; Mamouzelos, N.J.; Tarantili, P.A.; Andreopoulos, A.G. Swelling and hydrolytic degradation of poly(d,l-lactic acid) in aqueous solutions. Polym. Degrad. Stab. 2006, 91, 614–619. [Google Scholar] [CrossRef]
  11. Schott, H. Swelling kinetics of polymers. J. Macromol. Sci. 1992, 31, 1–9. [Google Scholar] [CrossRef]
  12. Nim, B.; Opaprakasit, P. Quantitative analyses of products from chemical recycling of polylactide (PLA) by alcoholysis with various alcohols and their applications as healable lactide-based polyurethanes. Spectrochim. Acta Part A Mol. Biomol. Spectrosc. 2021, 255, 119684. [Google Scholar] [CrossRef] [PubMed]
  13. Petrus, R.; Bykowski, D.; Sobota, P. Solvothermal Alcoholysis Routes for Recycling Polylactide Waste as Lactic Acid Esters. ACS Catal. 2016, 6, 5222–5235. [Google Scholar] [CrossRef]
  14. Rahmat, M.; Ghasemi, I.; Karrabi, M.; Azizi, H.; Zandi, M.; Riahinezhad, M. Silane crosslinking of poly(lactic acid): The effect of simultaneous hydrolytic degradation. Express Polym. Lett. 2015, 9, 1133–1141. [Google Scholar] [CrossRef]
  15. Sirisinha, K.; Kamphunthong, W. Rheological analysis as a means for determining the silane crosslink network structure and content in crosslinked polymer composites. Polym. Test. 2009, 28, 636–641. [Google Scholar] [CrossRef]
  16. Xu, D.; Auras, R.A.; Sonchaeng, U.; Rubino, M.; Lim, L.T. The effect of alcoholic solutions on the thermomechanical properties of immersed poly(lactic acid) films. J. Appl. Polym. Sci. 2023, 140, e53489. [Google Scholar] [CrossRef]
  17. Phongtamrug, S.; Makhon, R.; Wiriyosuttikul, T. Enhanced Performance of Polylactide Film via Simultaneous Biaxial Stretching and Silane Coupling Agent as a Thermal Shrinkable Film. Appl. Sci. Eng. Prog. 2023, 16, 5699. [Google Scholar] [CrossRef]
  18. Kong, Y.; Hay, J.N. The measurement of the crystallinity of polymers by DSC. Polymer 2002, 43, 3873–3878. [Google Scholar] [CrossRef]
  19. Khoo, R.Z.; Ismail, H.; Chow, W.S. Thermal and Morphological Properties of Poly (Lactic Acid)/Nanocellulose Nanocomposites. Procedia Chem. 2016, 19, 788–794. [Google Scholar] [CrossRef] [Green Version]
  20. Aliotta, L.; Sciara, L.M.; Cinelli, P.; Canesi, I.; Lazzeri, A. Improvement of the PLA Crystallinity and Heat Distortion Temperature Optimizing the Content of Nucleating Agents and the Injection Molding Cycle Time. Polymers 2022, 14, 977. [Google Scholar] [CrossRef]
  21. Schawe, J.E.K. Analysis of non-isothermal crystallization during cooling and reorganization during heating of isotactic polypropylene by fast scanning DSC. Thermochim. Acta 2015, 603, 85–93. [Google Scholar] [CrossRef]
  22. Lee, A.; Wynn, M.; Quigley, L.; Salviato, M.; Zobeiry, N. Effect of temperature history during additive manufacturing on crystalline morphology of PEEK. Adv. Ind. Manuf. Eng. 2022, 4, 100085. [Google Scholar] [CrossRef]
  23. Iñiguez-Franco, F.; Auras, R.; Burgess, G.; Holmes, D.; Fang, X.; Rubino, M.; Soto-Valdez, H. Concurrent solvent induced crystallization and hydrolytic degradation of PLA by water-ethanol solutions. Polymer 2016, 99, 315–323. [Google Scholar] [CrossRef] [Green Version]
  24. Zhou, D.; Xu, M.; Tan, R.; Sun, Y.; Ma, Z.; Li, J.; Dong, X.H. Quantitatively unravel the effect of chain length heterogeneity on polymer crystallization using discrete oligo l-lactide. Polymer 2021, 225, 123746. [Google Scholar] [CrossRef]
  25. Eduok, U.; Faye, O.; Szpunar, J. Recent developments and applications of protective silicone coatings: A review of PDMS functional materials. Prog. Org. Coat. 2017, 111, 124–163. [Google Scholar] [CrossRef]
  26. Karapanagiotis, I.; Manoudis, P.N.; Zurba, A.; Lampakis, D. From Hydrophobic to Superhydrophobic and Superhydrophilic Siloxanes by Thermal Treatment. Langmuir 2014, 30, 13235–13243. [Google Scholar] [CrossRef]
  27. Zhang, R.; Zhou, Z.; Ge, W.; Wang, Y.; Yin, X.; Zhang, L.; Yang, W.; Dai, J. Superhydrophobic sponge with the rod-spherical microstructure via palygorskite-catalyzed hydrolysis and condensation of vinyltriethoxysilane for oil-water separation. Appl. Clay Sci. 2020, 199, 105872. [Google Scholar] [CrossRef]
  28. Trofimchuk, E.S.; Nikonorova, N.I.; Moskvina, M.A.; Efimov, A.V.; Khavpachev, M.A.; Volynskii, A.L. Influence of liquid media on the craze initiation in amorphous polylactide. Polymer 2018, 142, 43–47. [Google Scholar] [CrossRef]
Figure 1. Mechanism of the alcoholysis reaction of lactic acid polymer under the influence of alcohol. Alcohols used in the experimental part by the researchers are presented as examples of substrates that may take part in the alcoholysis reaction.
Applsci 13 08462 g001
Figure 2. A short concept of a new printing technique—Liquid to Fused Deposition Modeling (L-FDM)—(a) polymer material spool, (b) a filament, (c) modifying substance solution or liquid modifying substance, (d) drying of the modified filament, (g) traditional FDM printing (e) extruder, (f) heating block with nozzle, (h) 3D printed part.
Applsci 13 08462 g002
Figure 3. Photos of L-FDM printed samples. (A)—photo of bars printed in vertical orientation, (B)—photo of paddles printed in vertical orientation, (D)—photo of bars printed in horizontal orientation, (E)—photo of paddles printed in horizontal orientation, (C,F)—diagrams showing the arrangement of the fitting in the working space of the printer ((C)—vertical, (B)—horizontal).
Applsci 13 08462 g003
Figure 4. SEM and EDS images of surface (A,B) and fractures (C,D) of the printed bars of sample PLA/BRB 442. (A,C)—SEM images, (B,D)—C/O/Si/S EDS mapping.
Applsci 13 08462 g004
Figure 5. SEM and EDS images of surface (A,B) and fractures (C,D) of the printed bars of sample PLA/BRB 294. (A,C)—SEM images, (B,D)—C/O/Si/S EDS mapping.
Applsci 13 08462 g005
Figure 6. Optical microscope images of surface of the printed bars; (A)—PLA/MeOH; (B)—PLA/EtOH; (C)—PLA/i-PrOH; (D)—PLA/Bn OH; (E)—PLA/CyOH; (F)—PLA/n-BuOH; (G)—PLA ref.
Applsci 13 08462 g006
Figure 7. Optical microscope images of cross-sections of the printed bars; (A)—PLA/MeOH; (B)—PLA/EtOH; (C)—PLA/i-PrOH; (D)—PLA/Bn OH; (E)—PLA/CyOH; (F)—PLA/n-BuOH; (G)—PLA ref.
Applsci 13 08462 g007
Figure 8. Mechanical properties: (A) tensile strength for PLA/alcohols; (B) elongation at break for PLA/alcohols; (C) tensile strength for PLA/alcohol/silanes; (D) elongation at break for PLA/alcohol/silanes.
Applsci 13 08462 g008
Figure 9. Scheme showing a silane as a crosslinking agent in polymers.
Applsci 13 08462 g009
Figure 10. Mechanical properties: (A) tensile strength for PET-G/alcohols/silanes/siloxanes; (B) elongation at break for PET-G/alcohols/silanes/siloxanes.
Applsci 13 08462 g010
Figure 11. Impact strength of (A) PLA/alcohols/silanes/siloxanes; (B) PET-G/alcohols/silanes/siloxanes.
Applsci 13 08462 g011
Figure 12. Feasible reaction of aminopropyltriethoxysilane and PLA [17].
Applsci 13 08462 g012
Figure 13. Degree of crystallinity of (A) PLA/alcohols and (B) PLA/alcohol/silanes or siloxanes.
Applsci 13 08462 g013
Figure 14. DSC curves of (A) PLA/alcohols first heating cycle; (B) PLA/alcohols second heating cycle; (C) PLA/alcohol/silanes or siloxanes first heating cycle; (D) PLA/alcohol/silanes or siloxanes second heating cycle.
Applsci 13 08462 g014aApplsci 13 08462 g014b
Figure 15. Water contact angle (WCA): (A) PLA/alcohols/silanes/siloxanes; (B) PET-G/alcohol/silanes/siloxanes.
Applsci 13 08462 g015
Table 1. Printing parameters.
SlicerCreality 1.2.3.
layer height [mm]0.2
first layer speed/printing speed [mm/s]20/50—horizontal, 20/30—vertical
print/bed temp. [°C]220/60 for PLA and 230/70 for PETG
number of shells2
infill [%]100
infill angle [°]45
fan speed [%]100
Table 2. Comparison of the physical and chemical properties of the alcohols used in the study, as well as the results of thermal and strength testing of L-FDM prints.
PLA/Alcohol Boiling Point [°C]pKa Alcohol (from PuB Chem)Tensile Strength [MPa]Impact Strength [kJ/m2]Crystallinity [%] 1 CycleCrystallinity [%] 2 Cycle
neat--56.815.413.643.40
MeOH65.015.3 (at 25 °C)67.2217.920.616.39
EtOH78.215.9 (at 25 °C)54.3915.319.424.15
i-PrOH83.017.145.0714.921.554.44
BnOH205.315.435.9917.223.7118.72
CyOH161.016.050.4314.819.066.49
n-BuOH117.016.147.0514.924.0718.63
Disclaimer/Publisher’s Note: The statements, opinions and data contained in all publications are solely those of the individual author(s) and contributor(s) and not of MDPI and/or the editor(s). MDPI and/or the editor(s) disclaim responsibility for any injury to people or property resulting from any ideas, methods, instructions or products referred to in the content.

