Simulation of plasma parameters in DEMO-FNS was carried out using different confinement parameters: e.g., in [
6,
13] and earlier works,
τp/
τE was taken to be equal to 3–4, while later, its range was extended to 2–4 [
17] since it was shown [
7] that, for higher values of
τp/
τE, the required value of density can be provided only by ion beam and particle flows from the divertor region. Such regimes without pellet injection are uncontrollable. Later, based on experimental data [
18,
19], it was proposed to consider the range
τp/
τE~1.5–3.0, which corresponds to the ratio of coefficients of diffusion and thermal conductivity
D/χ
e = 0.3–0.5. In this work, calculations were carried out in the range
τp/
τE = 0.75–2.5 since this range covers the experimental values of
D/χ
e [
18,
20].
It is shown in
Figure 1 that, to provide higher values of
τp/
τE, it is necessary to decrease the particle diffusion coefficient. The range
D/χ
e = 0.2–0.75 presented in [
18] in the case of DEMO-FNS facility provides the variation of confinement parameters
τp/
τE = 0.5–2.25. At the same time, in calculations with higher density, the diffusion coefficients are lower (see
Figure 1).
3.1. Particle Flows
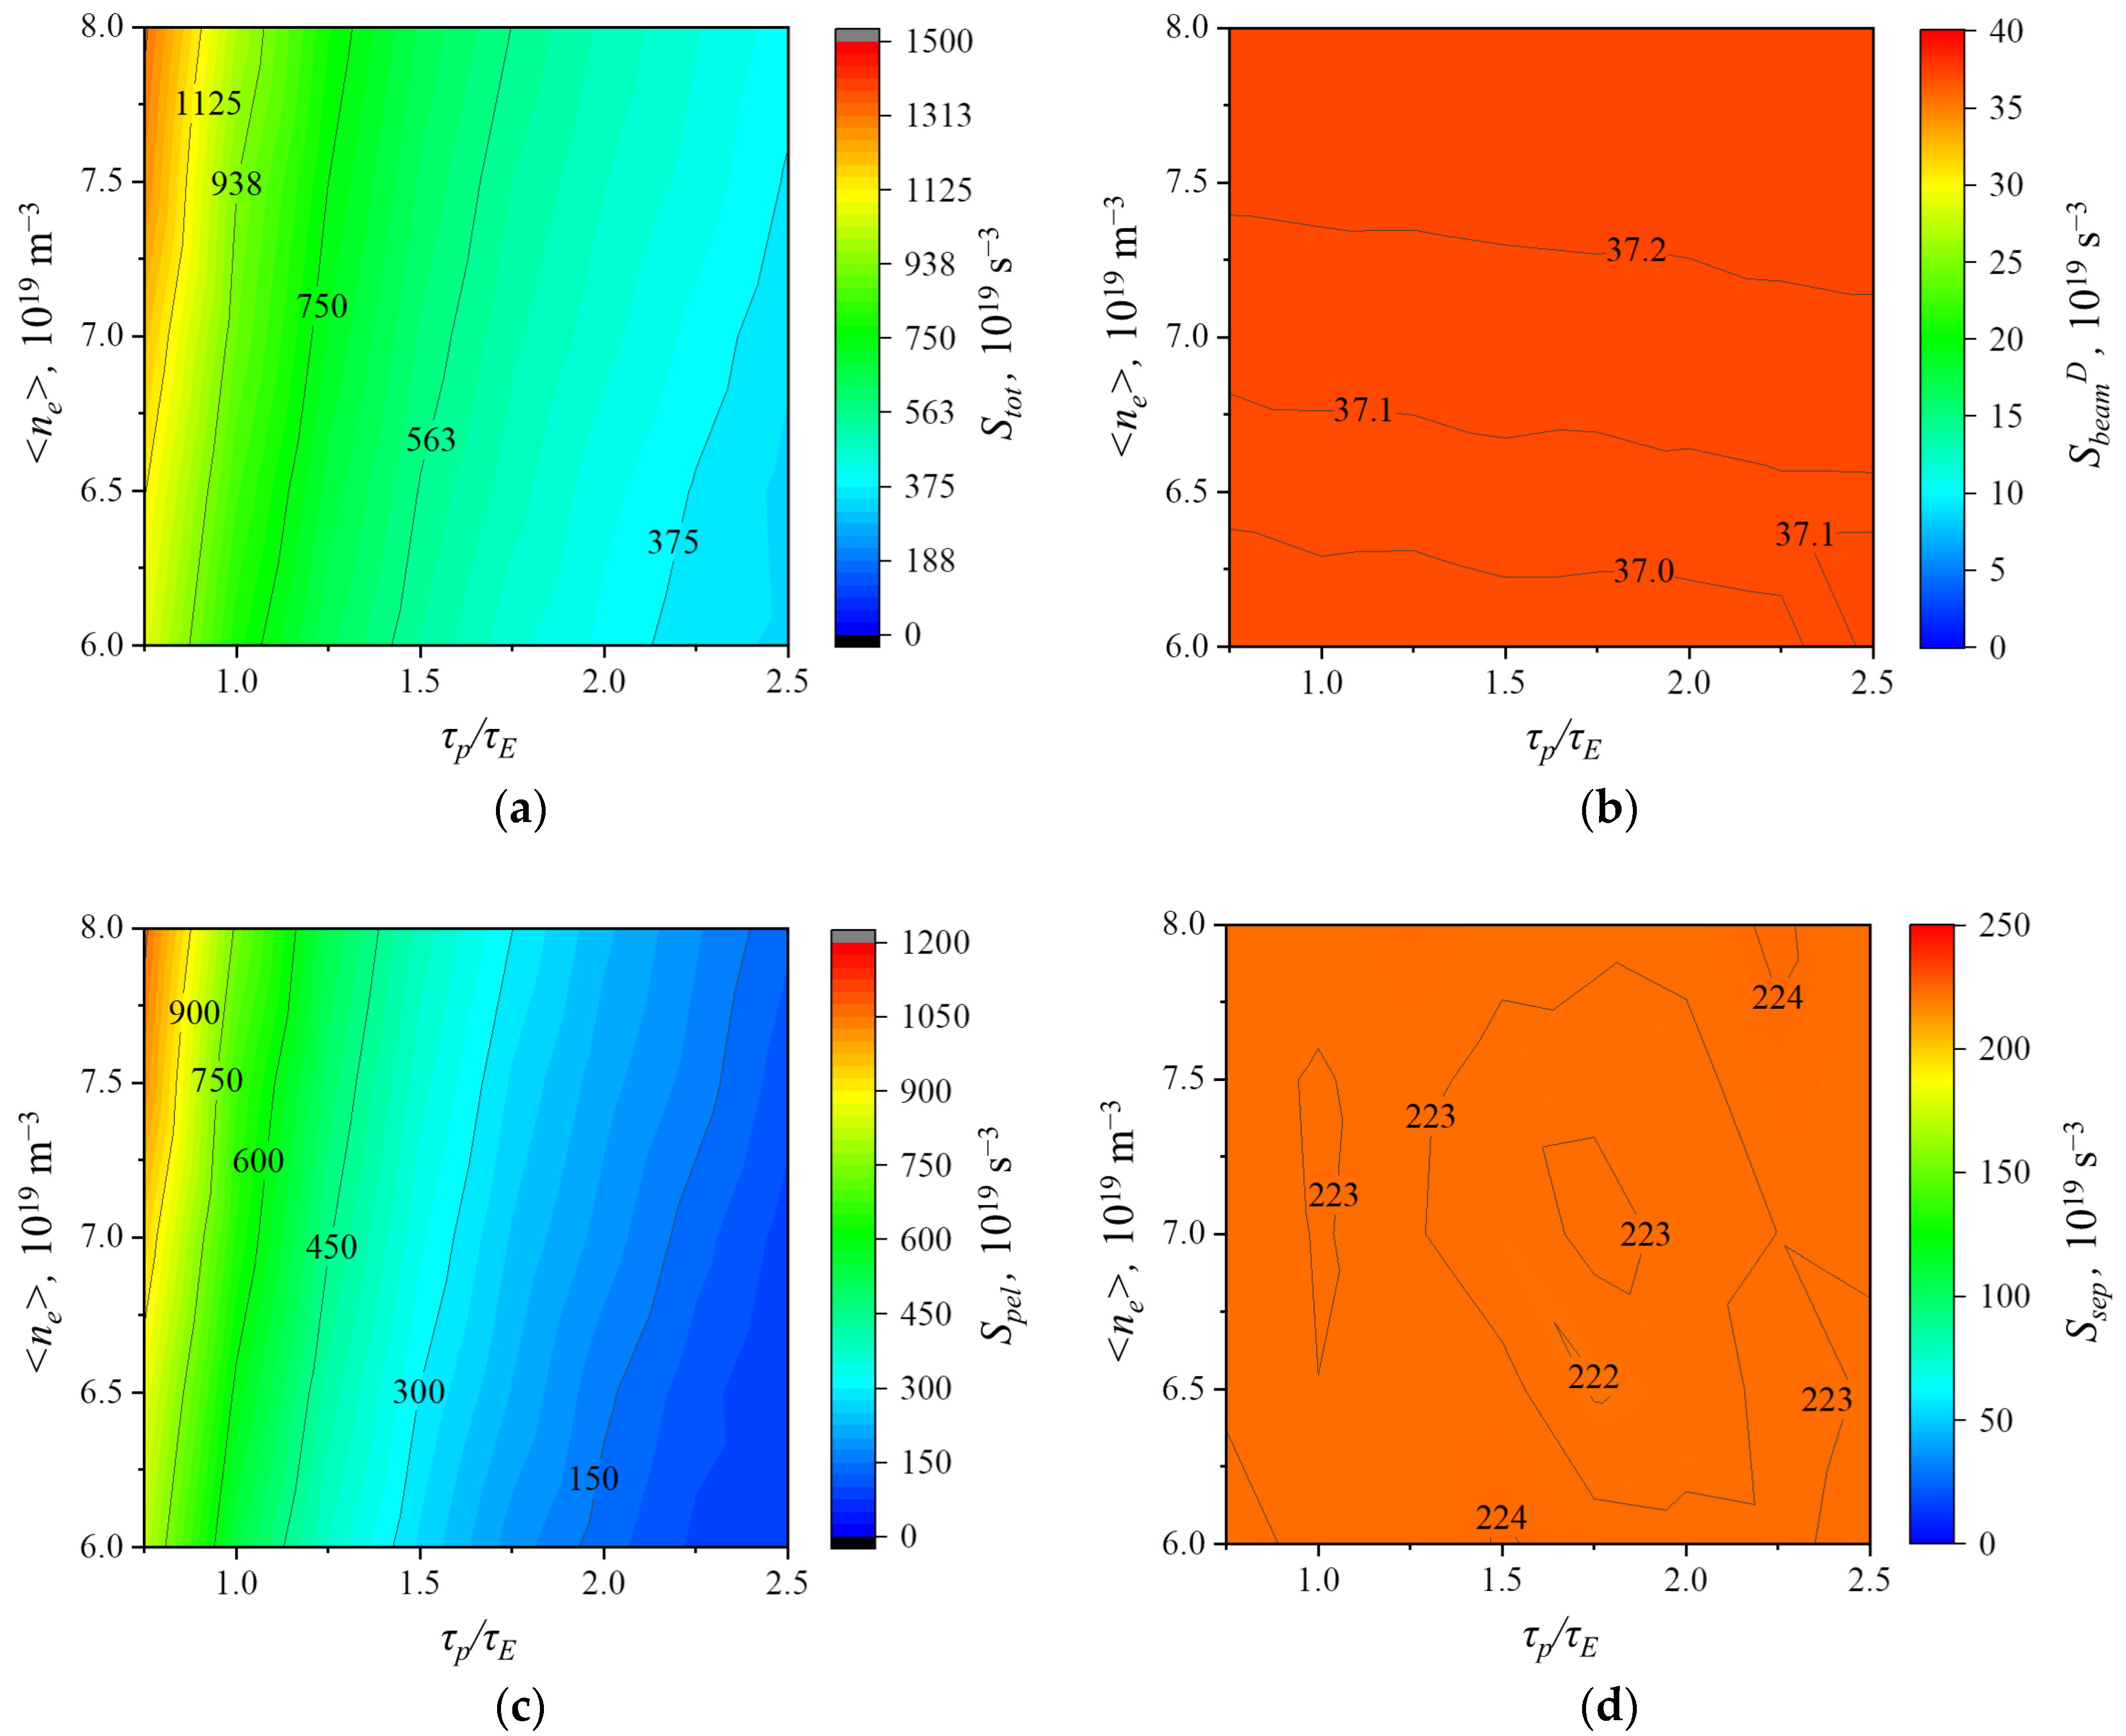
The particle balance in the plasma is shown in
Figure 2. To provide the given density, plasma fueling is necessary at the level 1.5 × 10
21–1.3 × 10
22 particles/s depending on confinement and target density. In all regimes, the 30 MW-power deuterium neutral beam injection (NBI) provides flows at the level of (36–37) × 10
19 particles/s (absorption in the plasma taking into account the “shine-through” particles). The particle flow from the divertor is (2.2–2.3) × 10
21 particles/s. The beam and neutrals from the divertor (that are provided by gas puffing) can provide the required density only in the case of high particle confinement. In the range
τp/
τE = 1–2, plasma fueling with pellets is needed. These values are lower than the ones calculated earlier via the parameterization of calculations by the ASTRA code [
8] in the range
τp/
τE = 1.5–3.
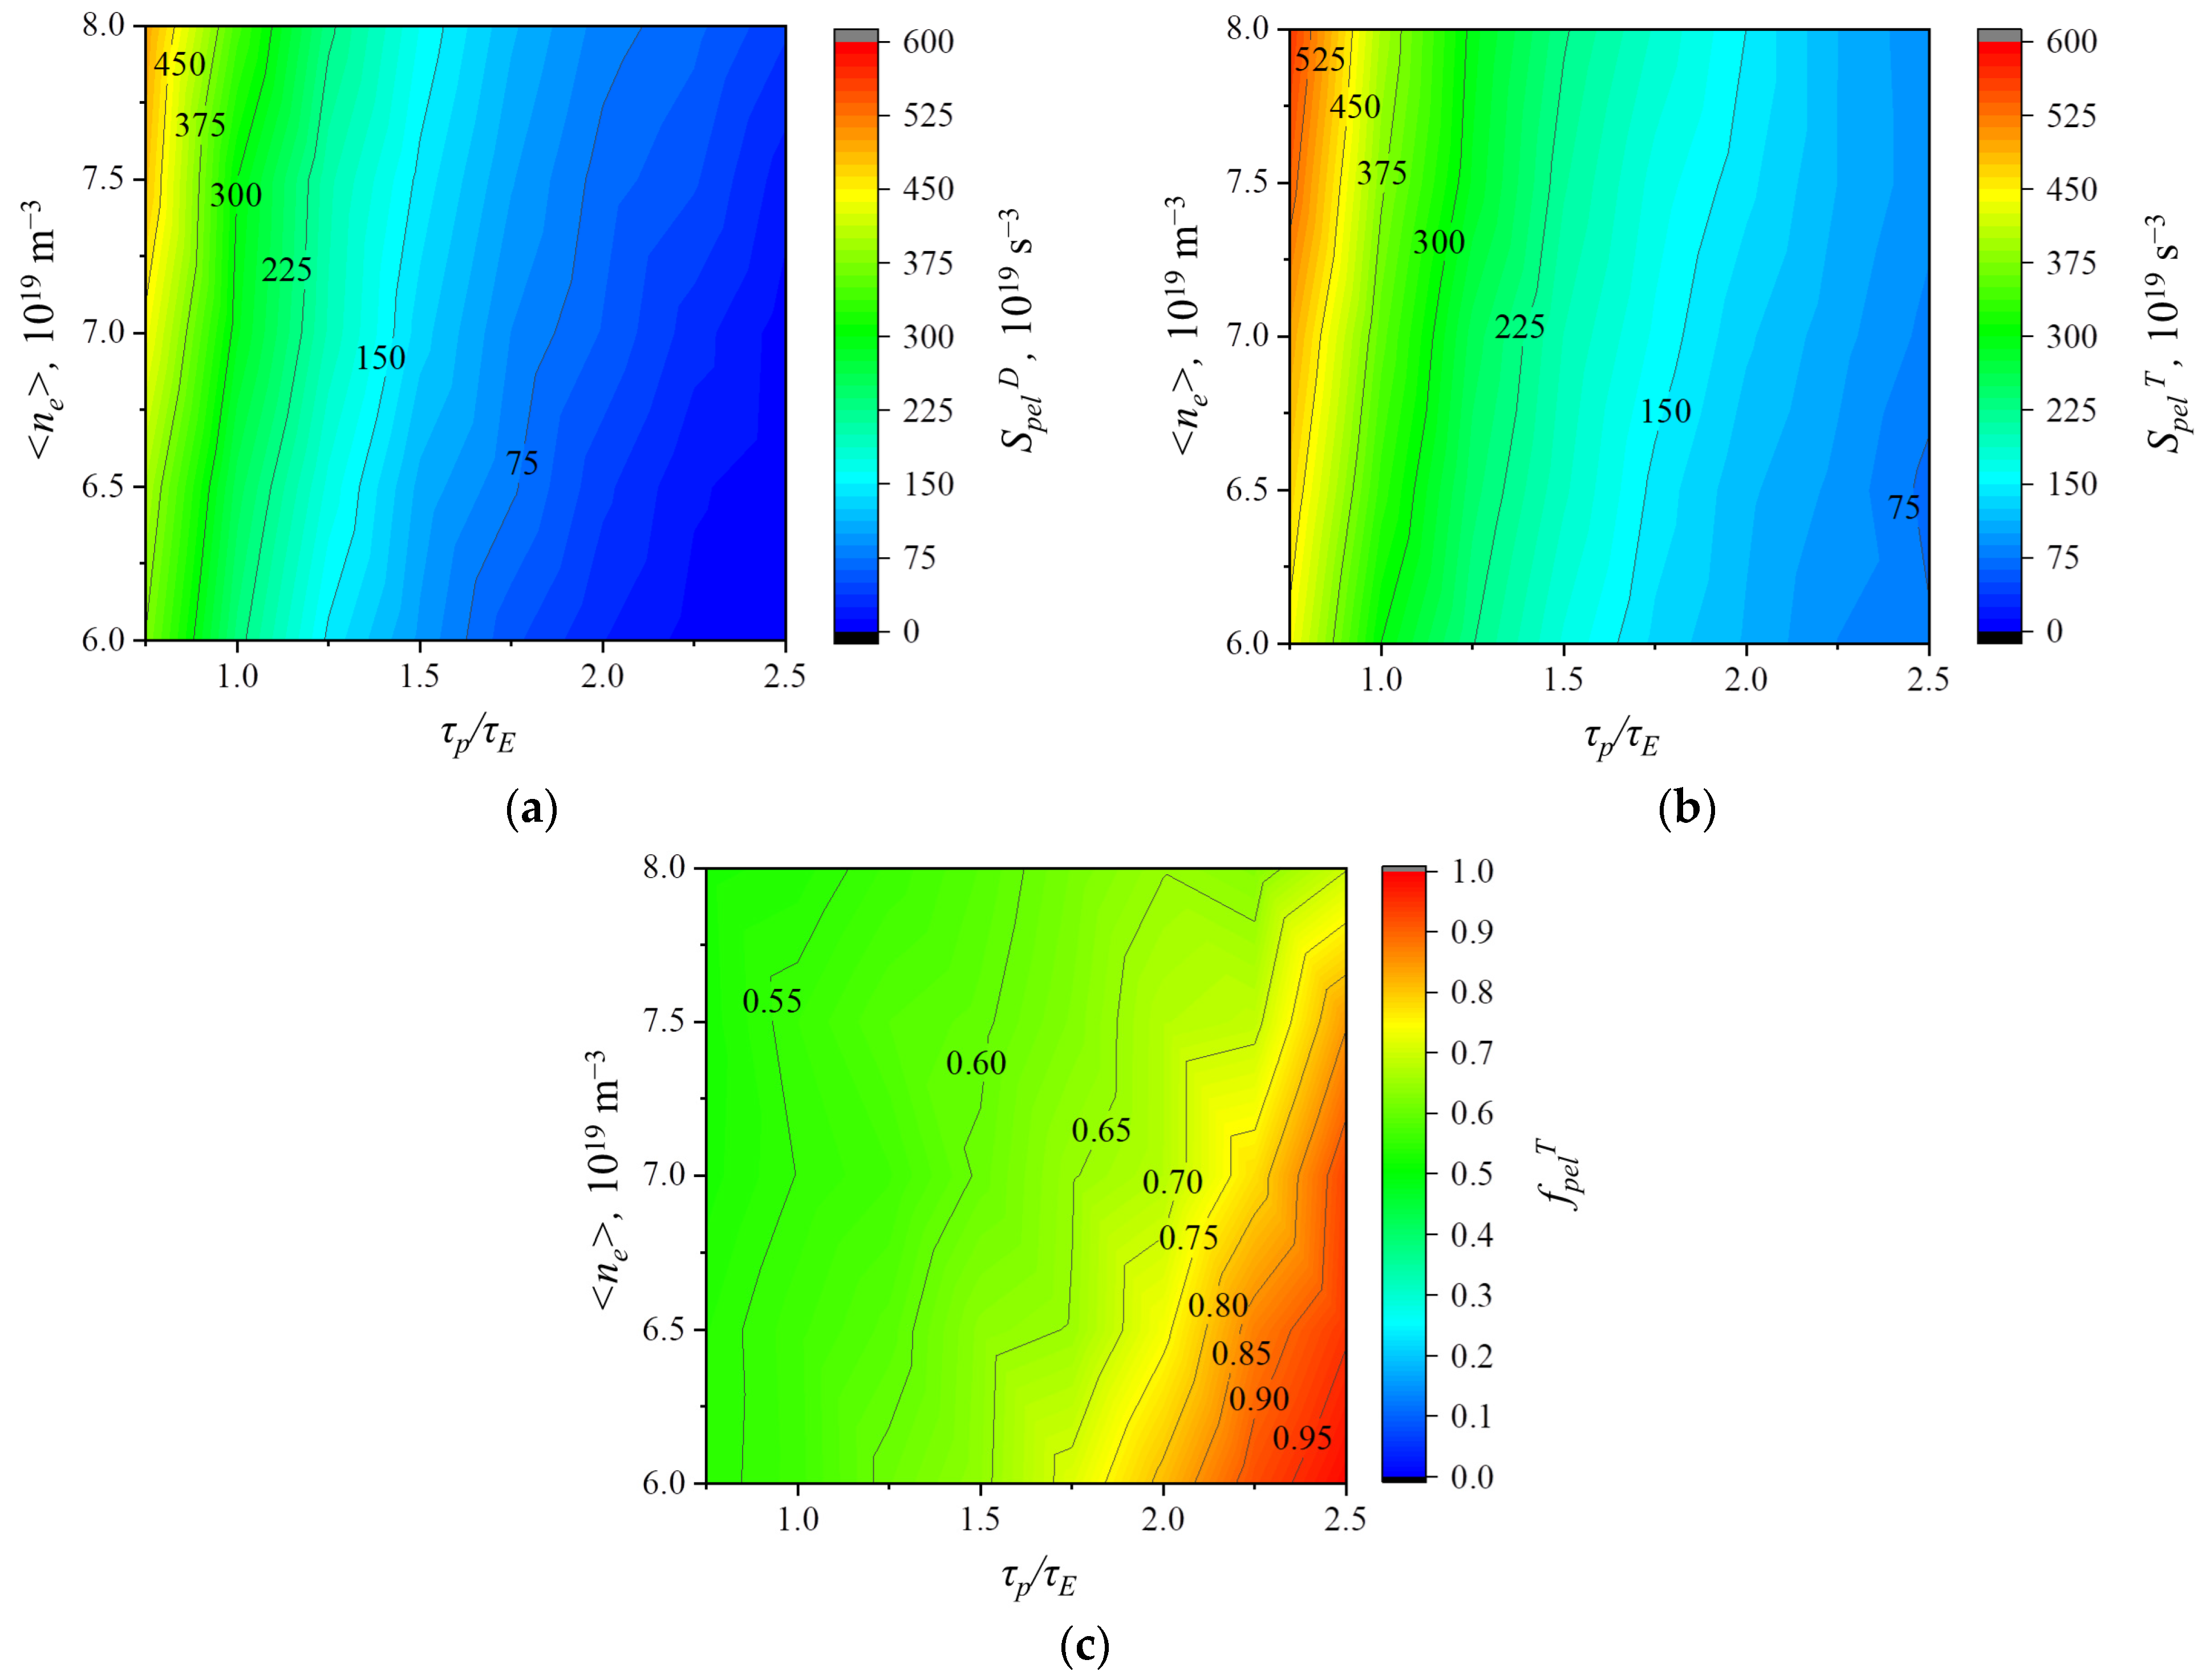
Injection parameters and source profiles are discussed in detail in
Section 3.3. For the fueling of DEMO-FNS, deuterium and tritium pellets are considered, which can be introduced separately or by using the same injection system [
21,
22]. In the absence of forced isotope content control in the divertor plasma by controlled gas puffing (
fdivT =
fcoreT), the fraction of tritium in the plasma is determined mainly by the ratio of the flows
SpelT and
SpelD. In the described calculations, the parameters of injection of tritium pellets were chosen to provide the given ratio
nD+:
nT+ = 1:1, i.e., the fraction of tritium in the core plasma is
fcoreT = 0.5,
The obtained data on pellet flows is shown in
Figure 3. It is seen that, in the case of low density and high particle confinement, tritium-only pellets are sufficient to maintain the plasma parameters (together with the injection of deuterium form NBI). In all other cases, injection of both deuterium and tritium pellets is necessary, and their ratio should be
fpelT = 0.5–0.8.
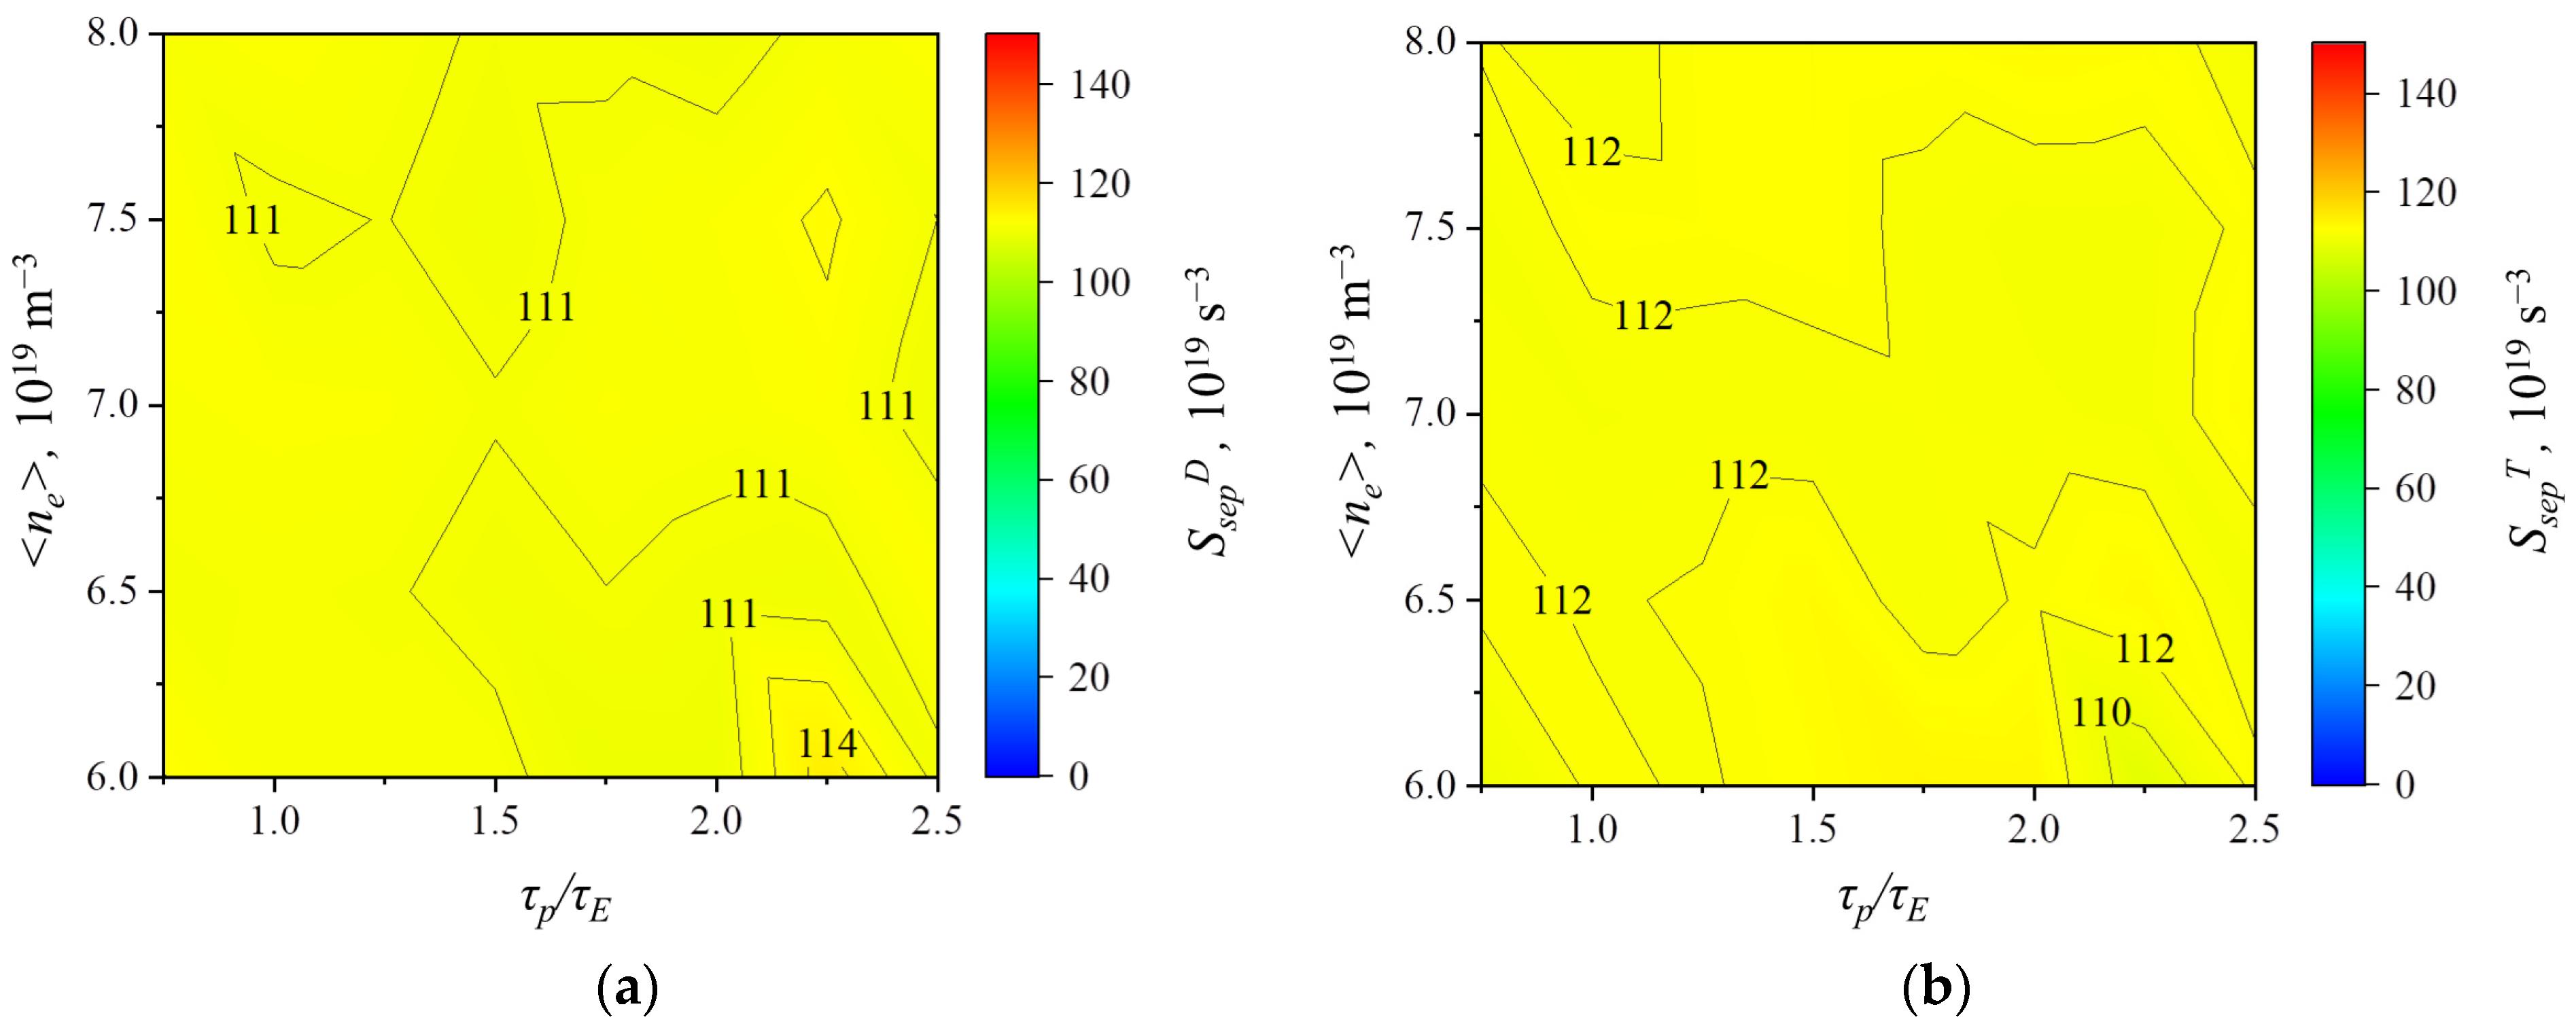
The performed calculations show that, in regimes with high confinement and low density, it is impossible to provide the required isotope composition of the core plasma because, in this case, all the density is provided by the beam and flow of neutrals through the separatrix (gas puffing), and the tritium flow through the separatrix is zero. This, once again, indicates that the parameter range of
τp/
τE was chosen correctly. Additional calculations can be carried out when ions are separated in SOLPS-ITER calculations (in this approach, the separation of the total flow through the separatrix
Ssep was carried out proportionally to
fdivT, similar to [
7,
8]), yet currently this appears unnecessary. In all other cases, the flows
SsepD and
SsepS turn out to be approximately equal, as is shown in
Figure 4.
Thus, by increasing the calculation precision due to the use of ion equations, it was shown that regimes with high confinement and low density can be non-optimum from the viewpoint of plasma fueling and control of the tritium fraction.
3.2. Confinement Times
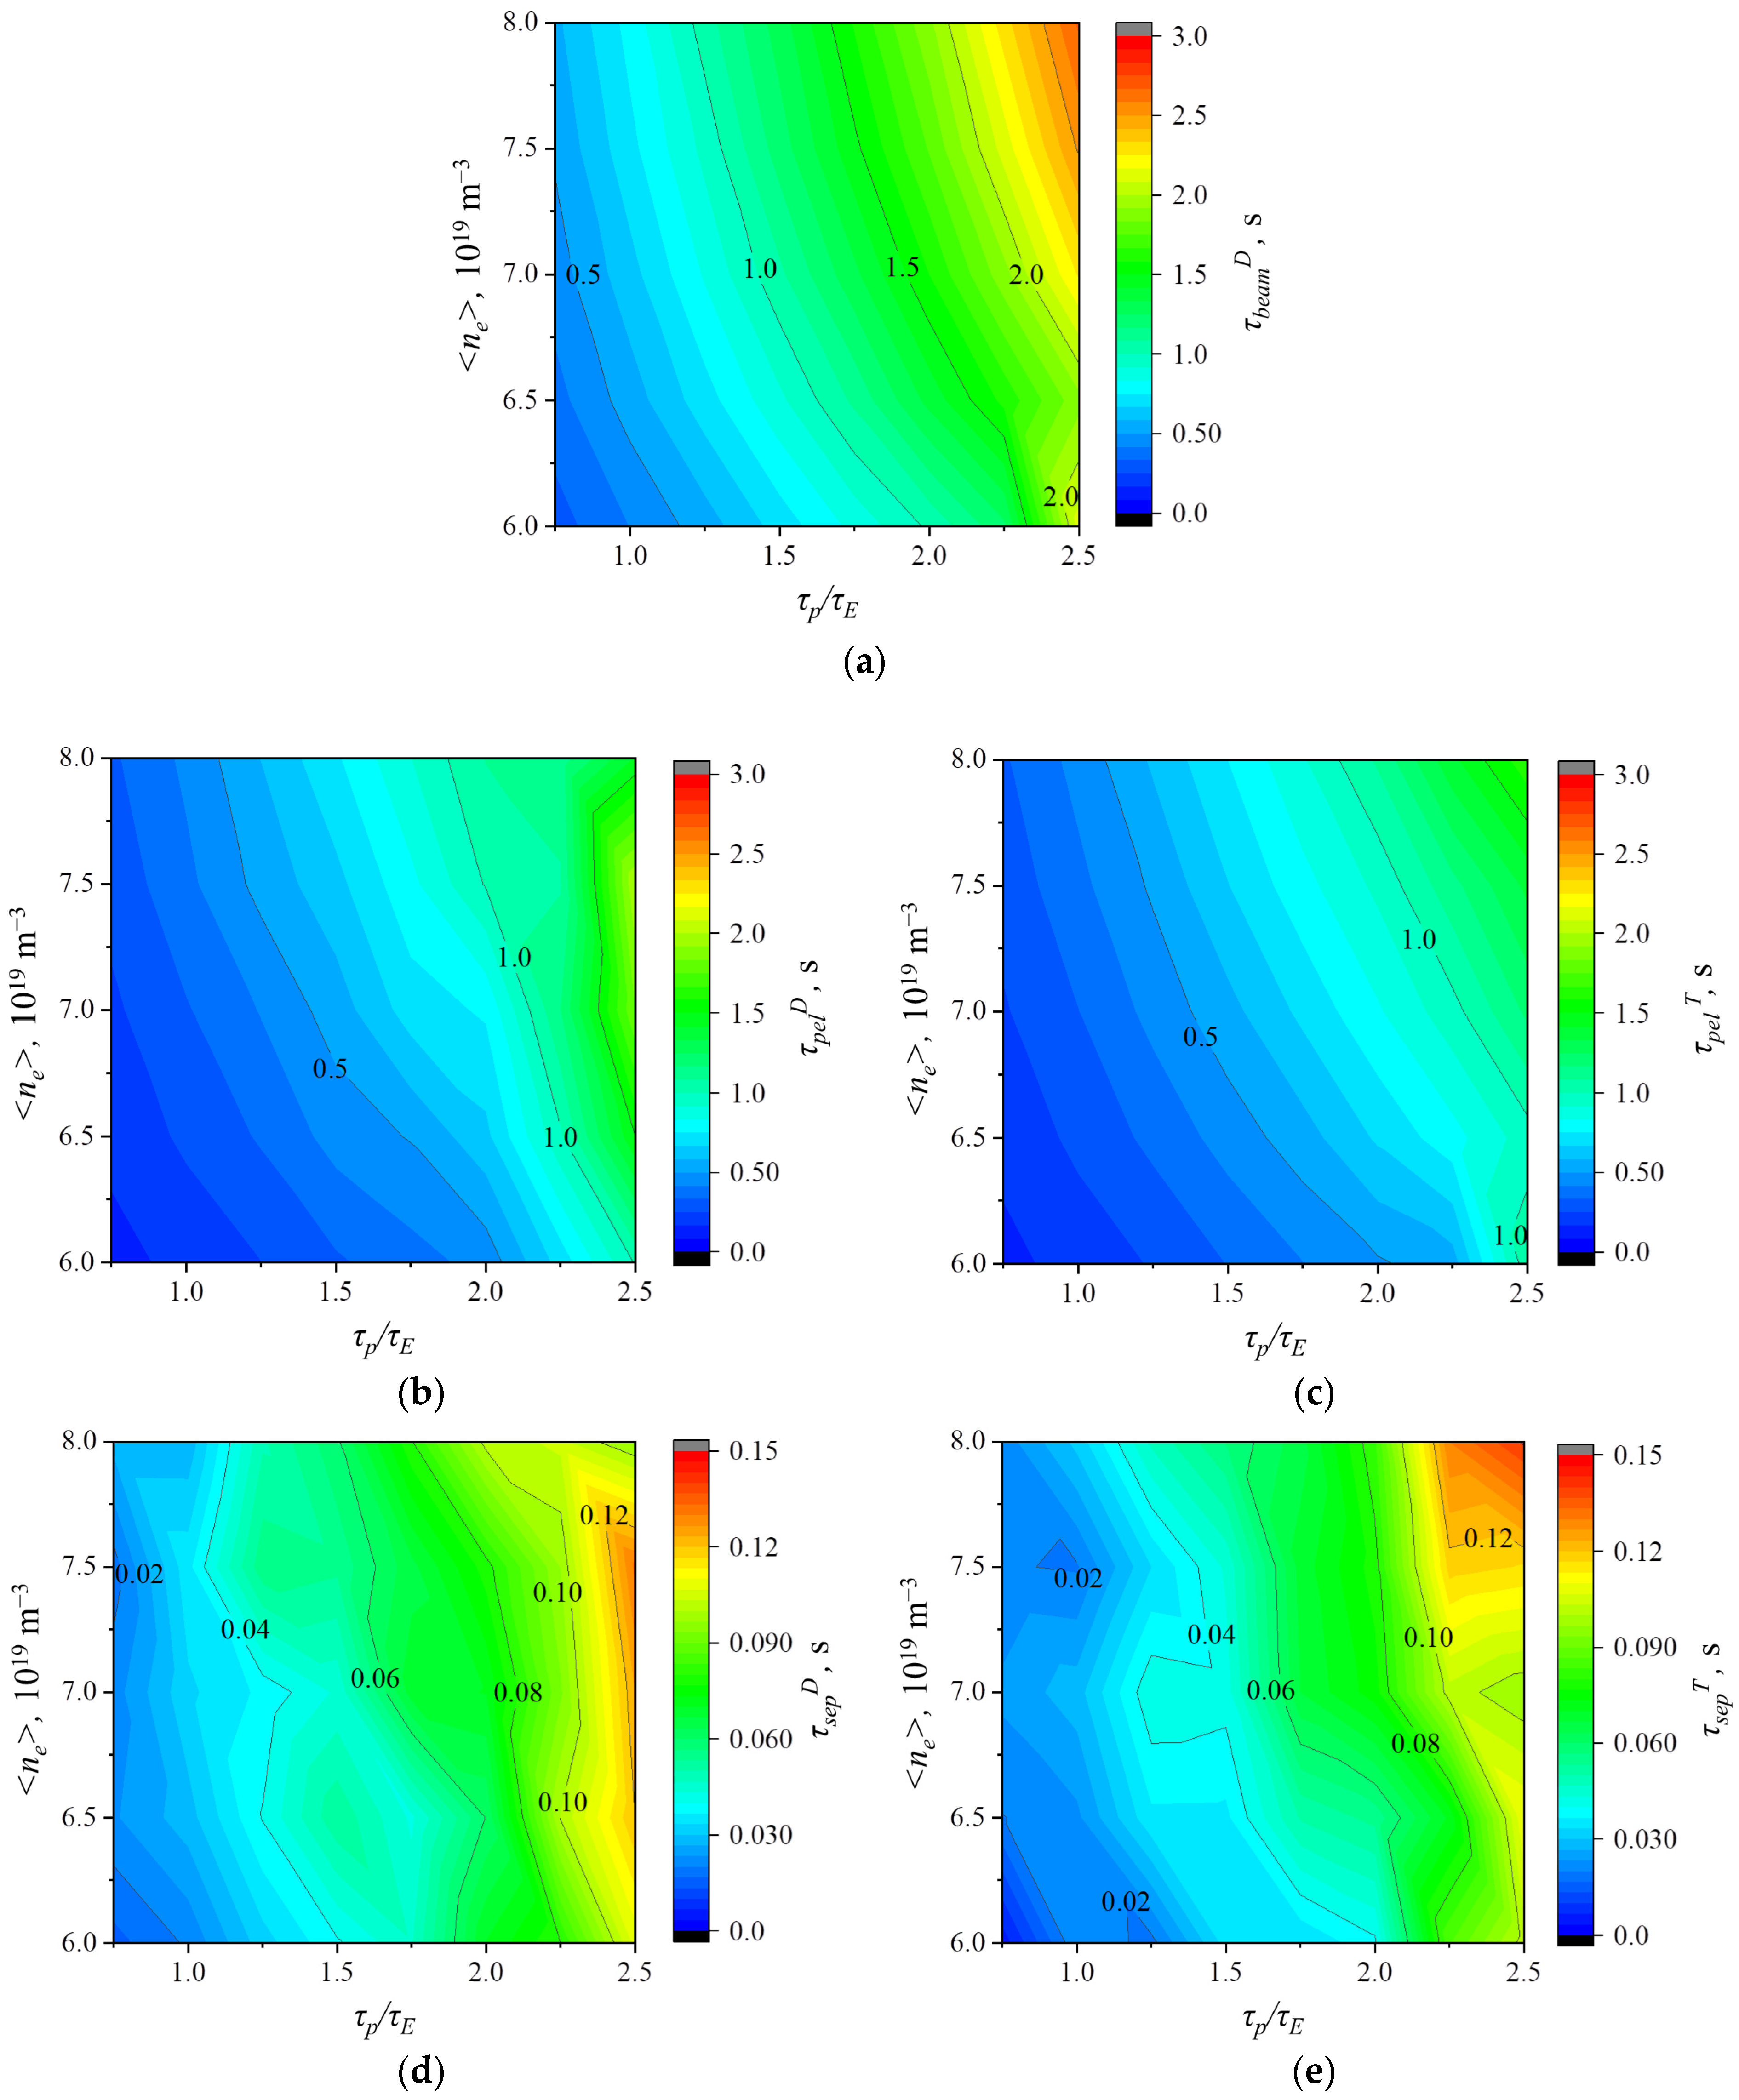
Using the ion equations for calculations and the resulting more accurate determination of “partial confinement times” for particles in the plasma led to the increase of partial confinement times of beam particles and pellets by up to 2.5 times (in the corresponding working points). However, for the source of particles in the form of neutrals entering the plasma through the separatrix, the particle confinement times decreased up to 3 times. Due to this, the deposition of particles from different sources to the density of the core plasma changed compared to the previous estimates [
8]. The increase of “partial particle confinement times” (
Figure 5) led to the decrease of required particle flows (the strength of particle sources). Thus,
Figure 2 shows the flows into the plasma from pellets, which are 2.7 times lower than those determined earlier (in the corresponding working points). The diffusion particle losses from the plasma are also lower than those calculated earlier, which leads to a proportional increase of gas puffing (see Equations (2) and (3) in [
8]).
Figure 5b–e shows the differences of corresponding times for different ions. The confinement times of ions from pellets shown in
Figure 5b,c are longer than the injection times 1/
fpel < 0.1 s (see
Section 3.3). This indicates that the estimates are reasonable, since pellet injection will occur more quickly than the characteristic density decay times.
The nonlinearity of the inverse problem that is being solved, as well as the effect of density on sources and sinks of particles and heat, leads to the change in particle flows not being obvious during the transition from one regime to another. The nonlinearity also makes the operation of feedback links more difficult, due to which the regime (defined by <
ne> and
τp/τE) can differ within 10% from the required one. As a result, in addition to the difference of “partial times” when using the ion equations in the calculations, the global energy and ion confinement times are also different (compared to the previous estimates). At the same time, for the average values of plasma density, the values of
τP and
τE almost do not differ from those obtained in [
8], and for higher and lower densities the confinement times decrease and increase by 15%, respectively.
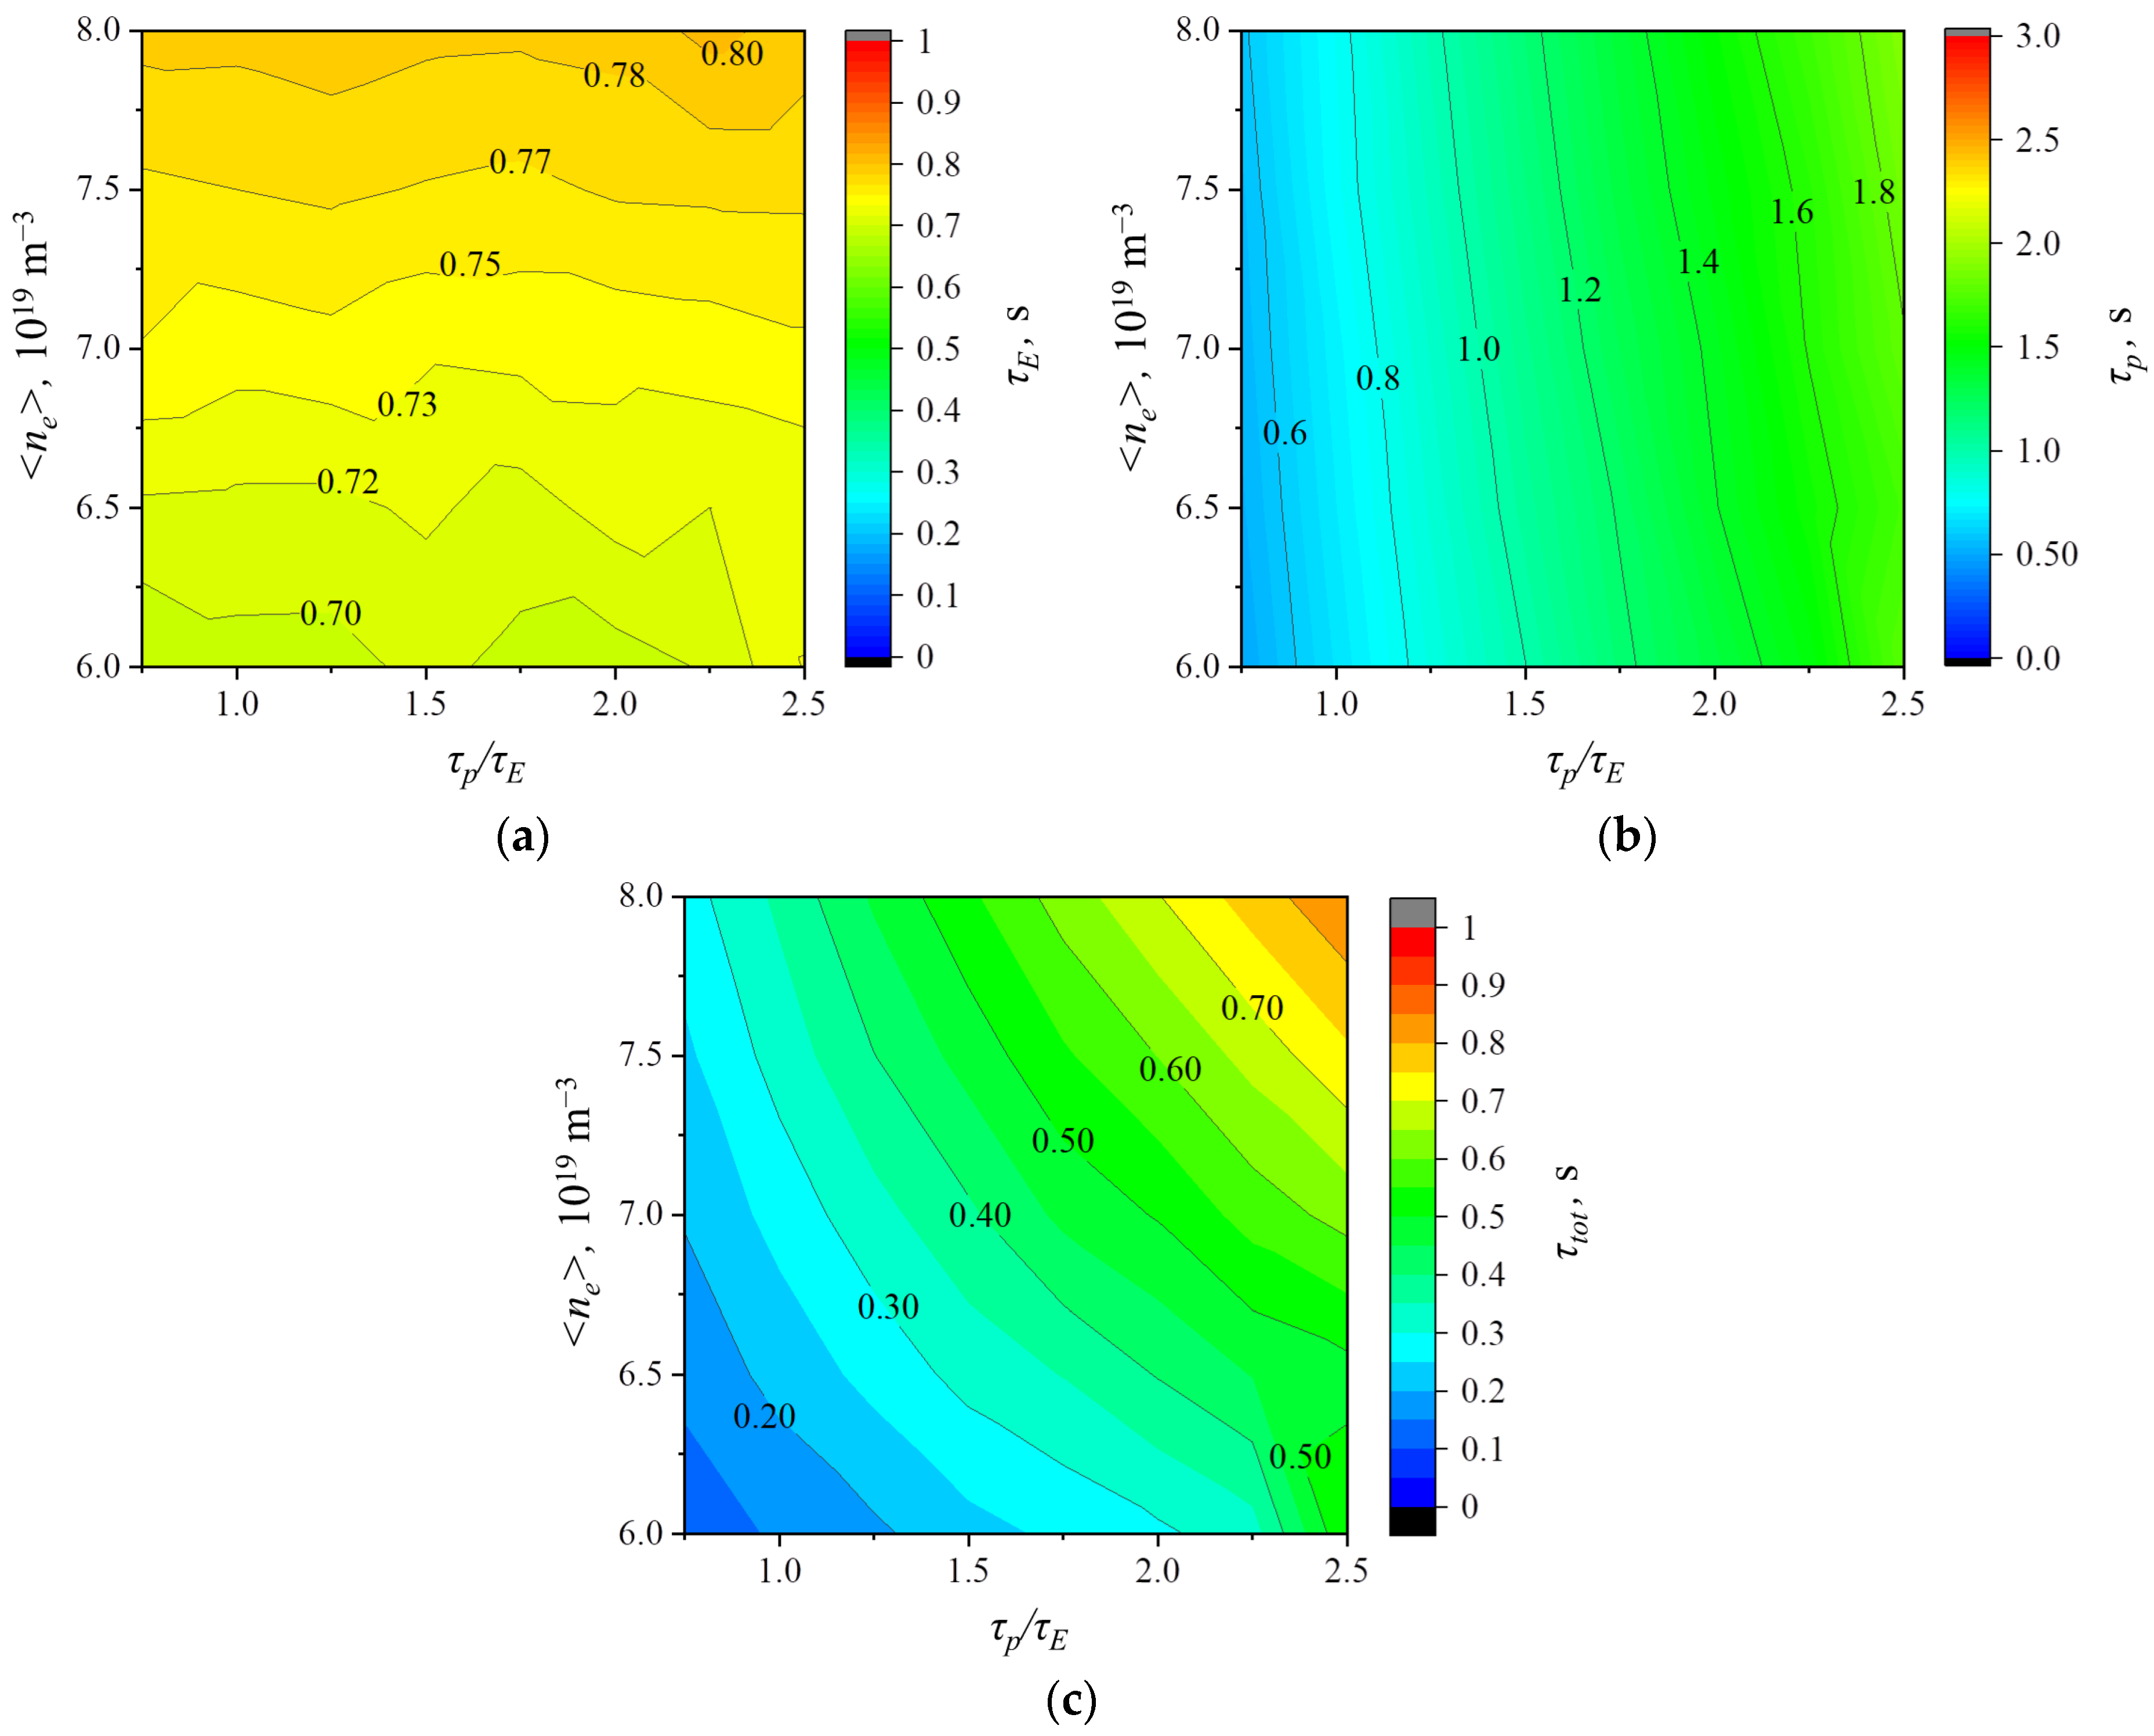
Such implicit effects can be traced by analyzing the variation of the global parameters over the calculation mesh. It is seen in
Figure 6 that the energy confinement time depends monotonously on the plasma density, while the ion confinement time is almost independent of <
ne>, yet it changes with the confinement parameter
τp/τE. The time
τtot that characterizes the ion confinement time without taking into account recycling depends uniformly on both <
ne> and
τp/τE in the working window. The increase of the confinement time with increasing density is connected to the decrease of the diffusion coefficient.
3.3. ELM Control by Pellet Injection
It is predicted that the natural (or “uncontrolled”) pulsed releases of particles from the column edge through the separatrix (edge localized modes, ELMs) in facilities under construction (including ITER) will lead to high pulsed heat loads on the plasma-facing components, which can substantially decrease their lifetime. It was shown [
23] that the critical ELM parameters can be determined either by the loads on the divertor components or the first wall components, depending on the plasma configuration. Estimates made for ITER under the assumption that ELMs will affect the plasma
Zeff due to transport of impurities (including the first wall and divertor materials) show that the requirements to ELM control needed to maintain the necessary impurity concentration in the plasma are stricter than the requirements to prevent excessive erosion of the divertor and first wall components [
23].
For conditions under which uncontrolled ELMs exceed the limits for the erosion of divertor components and the first wall, ELM control is needed. This can be carried out by suppressing type I ELMs by controlled ELM stimulation using the inverse dependence of the energy loss in ELMs (δ
WELM) and their frequency (
fELM) [
24],
where
PSOL is the power flow from the core plasma into SOL and α
ELM is the fraction of the power that is deposited in ELMs. The expected minimum frequency of controlled ELMs will substantially depend on the requirements to the energy deposited in ELMs and the value of α
ELM, which, according to experimental measurements, is usually taken to be equal to 0.2–0.4 [
25].
The change of the pellet ion source
Spel (i.e., the flow of D + T particles required to fuel the core plasma in the form of pellets injected from the high magnetic field side (HFS)), taking into account convective ELMs (in addition to “natural” ELMs) calculated in a manner similar to [
8], is shown in
Figure 7. It is seen that the increase in fuel flow to compensate for the particle losses in ELMs is 2–3 times, depending on α
ELM, which has to be accounted for in requirements for the system of pellet injection. The flows of particles from pellets into the plasma are up to 1.6 times lower than those calculated earlier (in the corresponding working points). The considered range of flows through the pellet injection system corresponds to the chosen requirements to the pellet injection system (PIS) of ITER and it is twice as small even for the maximum values of
Spel and α
ELM. From this, one can conclude that, even taking into account the additional flow of particles needed to stimulate ELMs from the low magnetic field side (LFS), the considered requirements for the PIS system are achievable from the engineering standpoint.
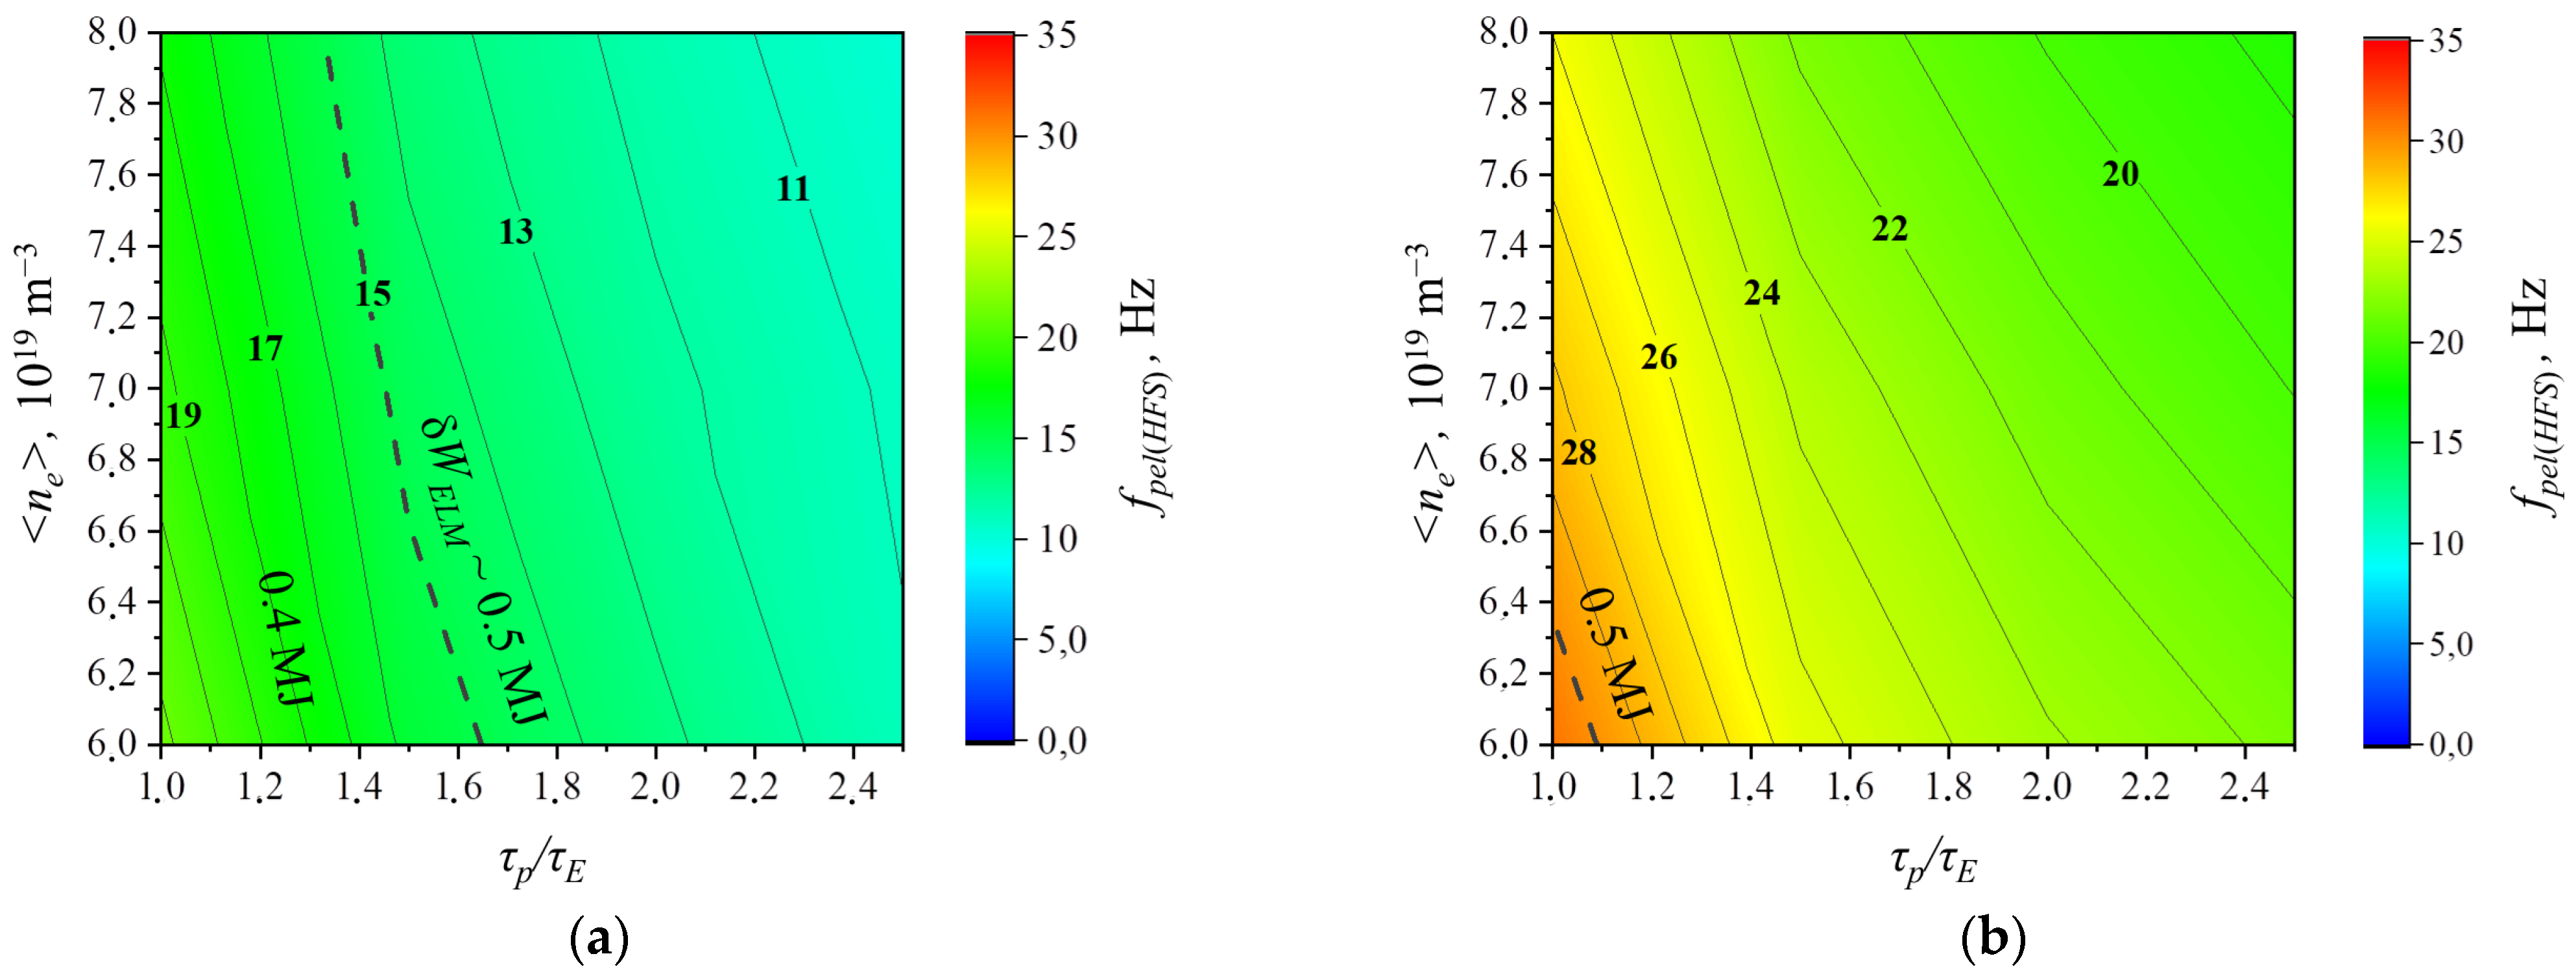
The frequency of fuel pellet injection (with maximum size for each separate plasma density)
fpel(HFS) is shown in
Figure 8 depending on α
ELM for the working window of plasma parameters. The dashed line shows the levels of
fELM necessary for stimulation of ELMs with δ
WELM~0.5 MJ (comparable to the value accepted for ITER) due to pellet injection. In
Figure 8, frequencies
fELM are also marked, necessary to stimulate ELMs with lower values of δ
WELM. The obtained result differs quantitatively from earlier obtained results [
8] but it is the same in principle. It is seen that, in the significant fraction of the working window with
τp/τE > 1.7 for α
ELM = 0.2 and with
τp/τE > 1.2–1.4 for α
ELM = 0.4, additional stimulation of ELMs is necessary. This can be performed by injecting pellets from the LFS and/or decreasing the size of fuel pellets [
8]. The specific solution should be chosen based on detailed simulations and determination of the size of the pellets injected from different directions.
Estimates of the size of LFS pellets required for reliable initiation of ELMs (for example, [
26]) by the method described in [
23] give the value of ~1.0 mm
3. This agrees with modern experimental data from JET, DIII-D, and ASDEX Upgrade [
23]. Since the fuel injection flows weakly depend on the LFS injection parameters (see [
8]), we left the analysis of the minimum pellet size for ELM stimulation to the future.
Control of ELM frequency
fELM and energy losses in ELMs δ
WELM by pellet injection is considered as the main scheme of ELM control for ITER and other facilities under construction. Experiments carried out at DIII-D showed the high efficiency of this method in decreasing the ELM energy released in the divertor [
27]. It was shown experimentally that the energy of ELMs released in the divertor decreased 10 times for ELMs controlled by pellet injection compared with uncontrolled ELMs under the same discharge conditions [
27]. To apply this method in constructed facilities including ITER and determine the requirements to the PIS, one needs to additionally study:
- (a)
the size of the pellets required for reliable stimulation of ELMs and changes in the flows of fuel components in the FC caused by it;
- (b)
the geometry of pellet injection for fueling the plasma and stimulating ELMs;
- (c)
the effect of this control method on the parameters of density pedestal of the core plasma and, consequently, its confinement and the characteristics of the neutron source.
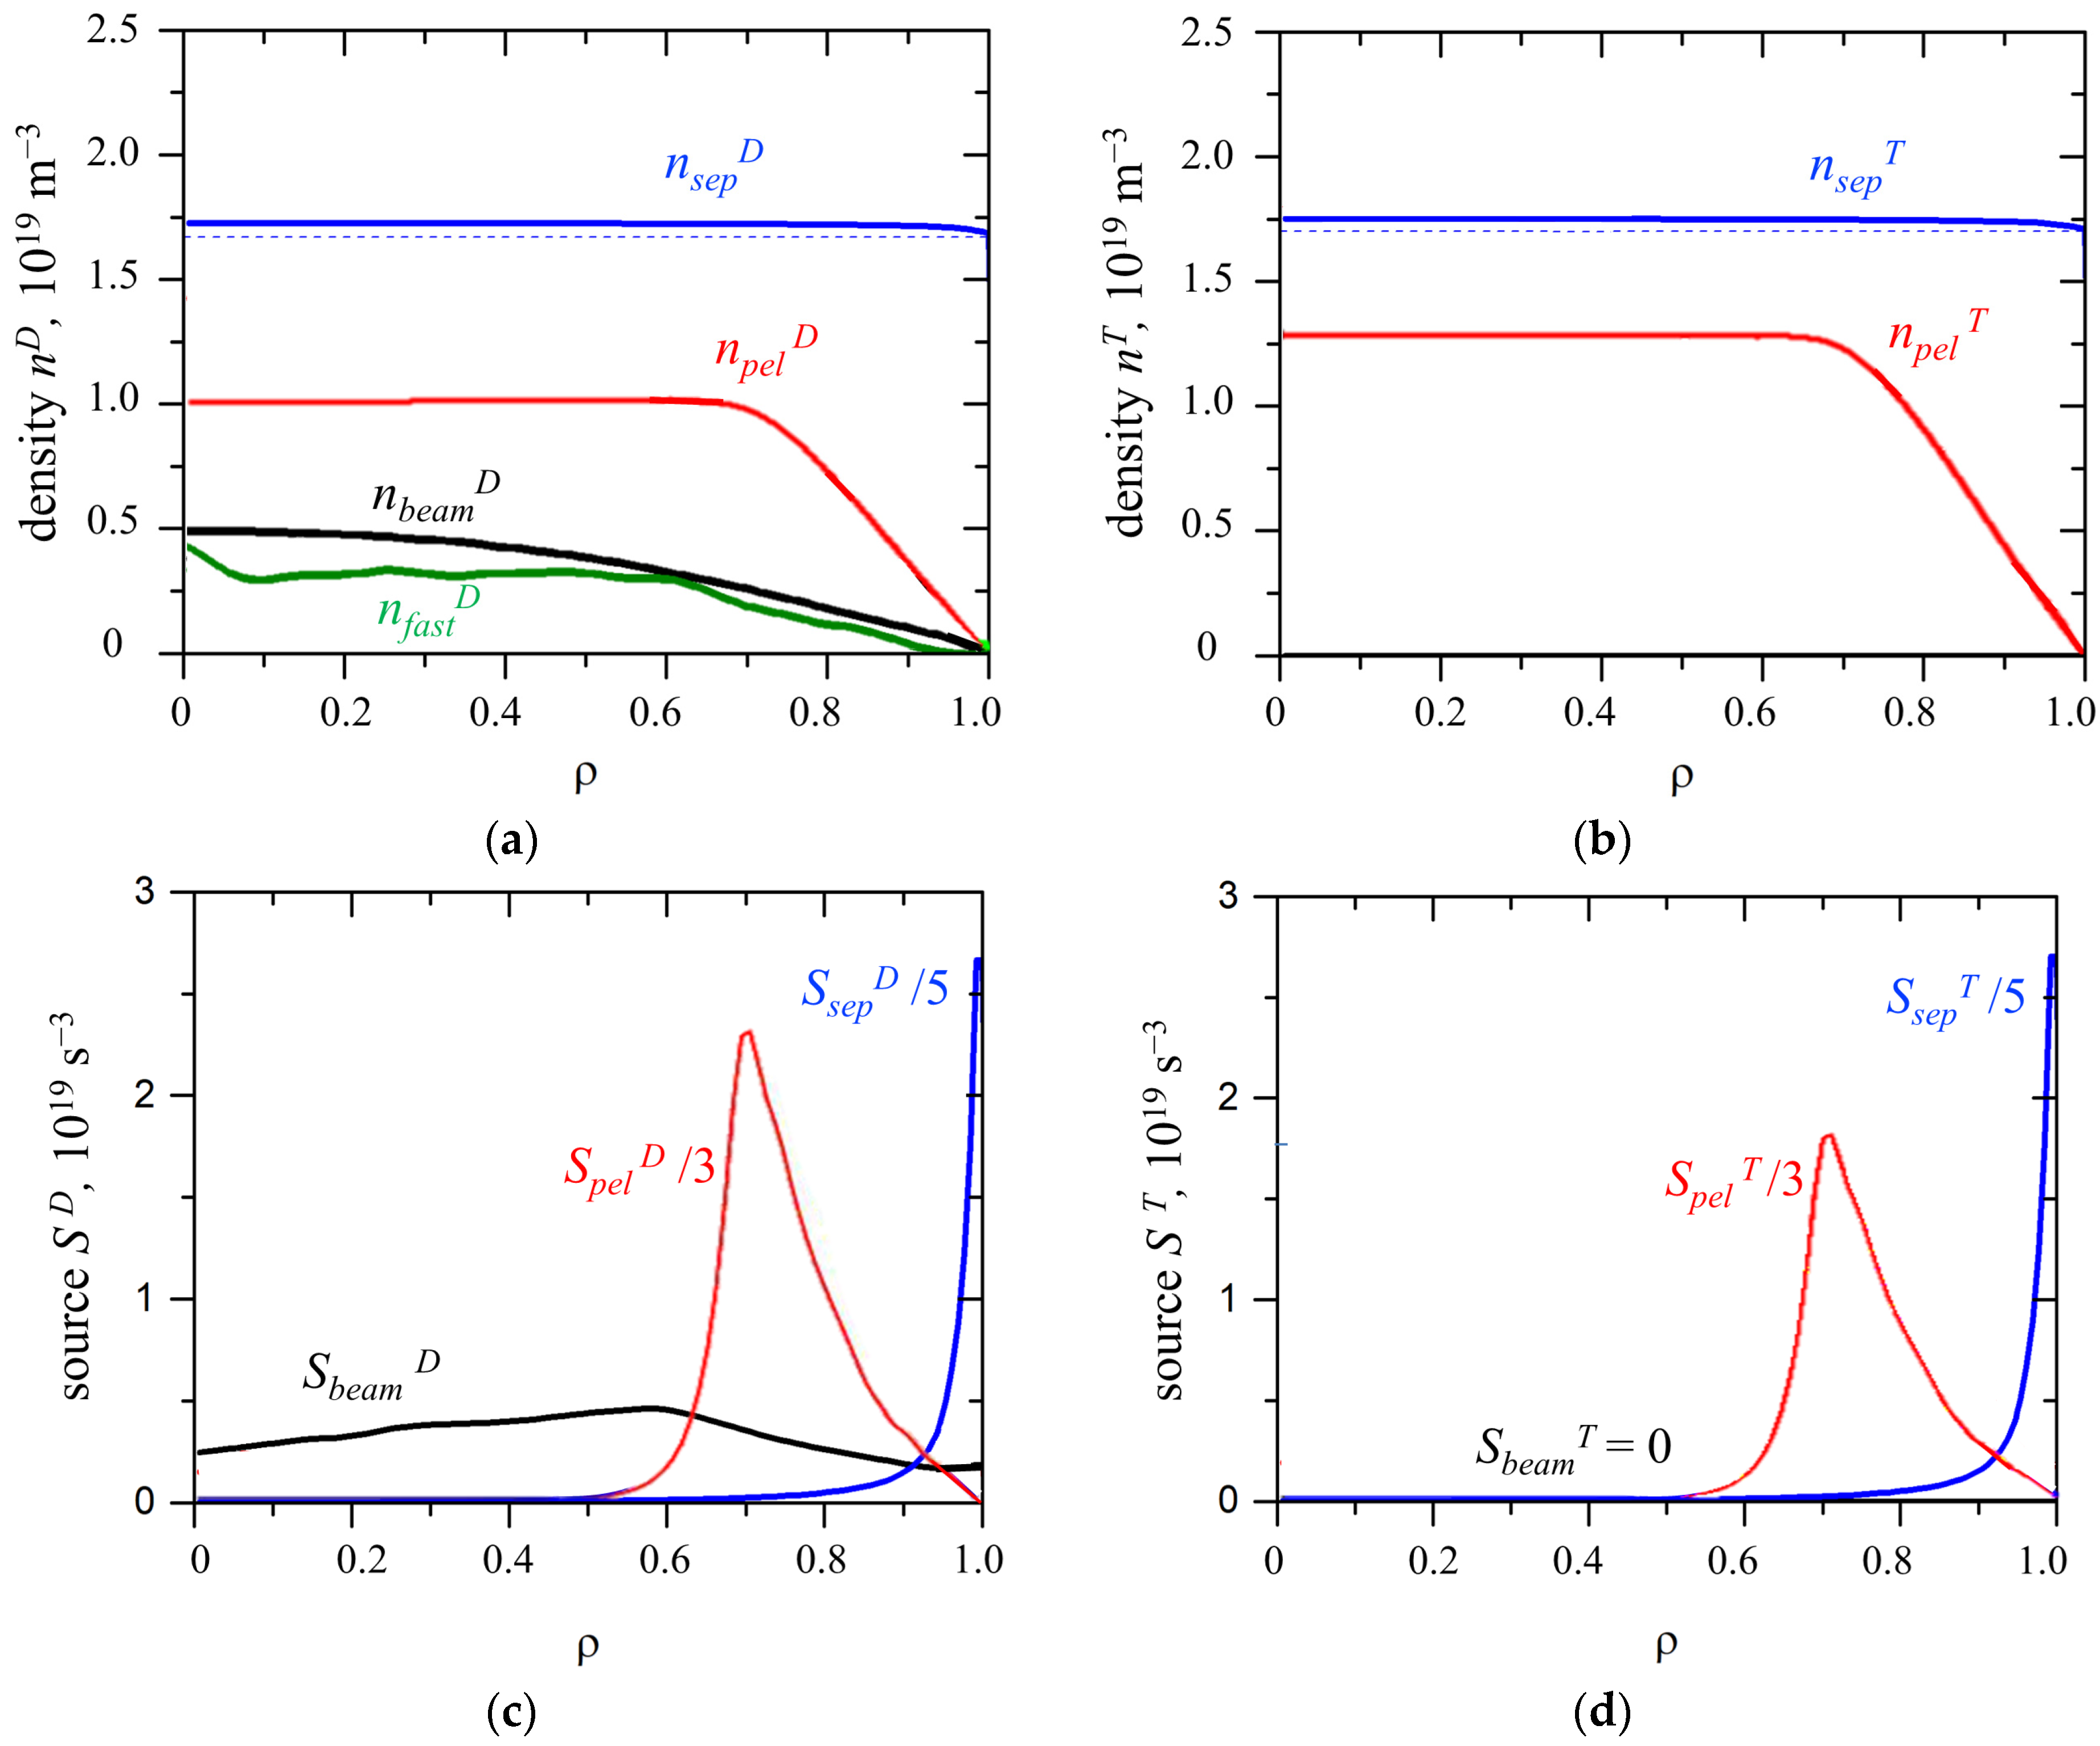
Figure 9 shows the density profiles of the main components of the plasma core provided by different ion sources: NBI, pellets, and neutrals through the separatrix. It is seen that the latter forms a relatively uniform profile despite the source having a peak at the plasma periphery (see
Figure 9c,d). At the same time, the sources of pellets and the beam have maximums close to the system axis, which provide the characteristic density profiles. It was noted in [
28] that the radial profile of the source of neutrals from the beam is calculated by the NUBEAM code [
29] that is incorporated into the ASTRA transport code. The high boundary density of ions that are supplied in the form of atoms from the divertor zone is generated as a result of the decrease of the scrape-off layer (SOL) thickness λ
q due to the high magnetic field (see, e.g., [
30]). Of the experimental data accessible in open literature, only the results from Alcator C-Mod [
31,
32] can be compared with the DEMO-FNS and ITER facilities.
In an accurate approach, it is necessary to simulate the profiles created in plasma (with given properties) during ablation of pellets with the given composition, size, velocity, frequency, and injection direction. Approach [
33] allows one to calculate the evaporation rate of the pellet material, yet to obtain the source profile it is necessary to take into consideration the drift of the evaporated material after ablation. For this, specialized calculation codes can be used (e.g., HPI2 [
34]) as well as simpler models [
35,
36]. In this work, the deposition profile of the pellet particles was simulated consistently by code [
35] that is incorporated into the ASTRA. The DEMO-FNS geometry allows injection from HFS at angles α
pel = 0–80° relative to the equatorial plane. The speed varied in the range of 0.3–3.0 km/s. It was shown that the largest deposit was achieved at α
pel = 0° and the highest velocities, which was used in further simulations. The ablation depth does not change much with size, while the deposit depth doubled as the pellet size
Vpel increased from 2.5 to 17.5 mm
3. As a result, we simulated pellet injection with the maximum possible size
Vpel =
kdens <
ne>
Vplasma/(2
p/
mmol)) equal to 10% of particles in the plasma, which corresponded to
Vpel = 12–18 mm
3 for scenarios <
ne> = 6–8 × 10
19 m
–3, respectively.
3.4. Gas Puffing into the Vacuum Vessel
Under stationary operation conditions of a facility with a gas-saturated vacuum vessel wall, particle exchange between the plasma and the wall leads to a dynamic equilibrium between the flows of particles from the plasma and flows of particles reflected or desorbed from the wall. Since these flows depend in different ways on the parameters of the plasma and the wall, every change in the state of the plasma or the wall can be expected to disrupt the balance to one side or to another and, consequently, lead to effective pumping or supply of the wall with the main gas.
While it is relatively simple to compensate for the effective pumping of the wall by increased gas puffing, it is much more difficult to compensate for the opposite effect. Since increasing the pumping rate two or more times is impossible, instead, it is necessary to constantly operate at a gas puffing rate close to maximum in order to have the necessary freedom for decreasing it in case of excess degassing from the wall [
37].
The supposed effect can be estimated from the expected total flow of particles onto the wall. In the DEMO-FNS project, the ion and neutral flows onto the (internal and external) wall are 2 × 10
23 s
−1 in total and 3 × 10
24 s
−1 onto the divertor plates in total. In this case, the total flows of hydrogen (D, T) particles onto the surface of structural elements in DEMO-FNS are expected to be
Γ ~ 3.2 × 10
24 s
−1 (ions and neutrals), which is about 15% of the same value for ITER [
37]. Similarly to the calculations described in [
37], one can estimate the equilibrium flows of particles absorbed and desorbed by the wall. The disruption of the balance of flows by, e.g., 1% [
37] leads to the appearance of an effective source or sink of particles of the size 1.6 × 10
22 s
−1. Consequently, to have the ability to decrease the intensity of gas puffing in case of excessive particle desorption from the wall, one has to provide additional gas injection (
SGIS to the difference from
Spuff—see (2)) of no less than 33 Pa m
3/s or 1600 × 10
19 s
−1 (in the units given in the figures).
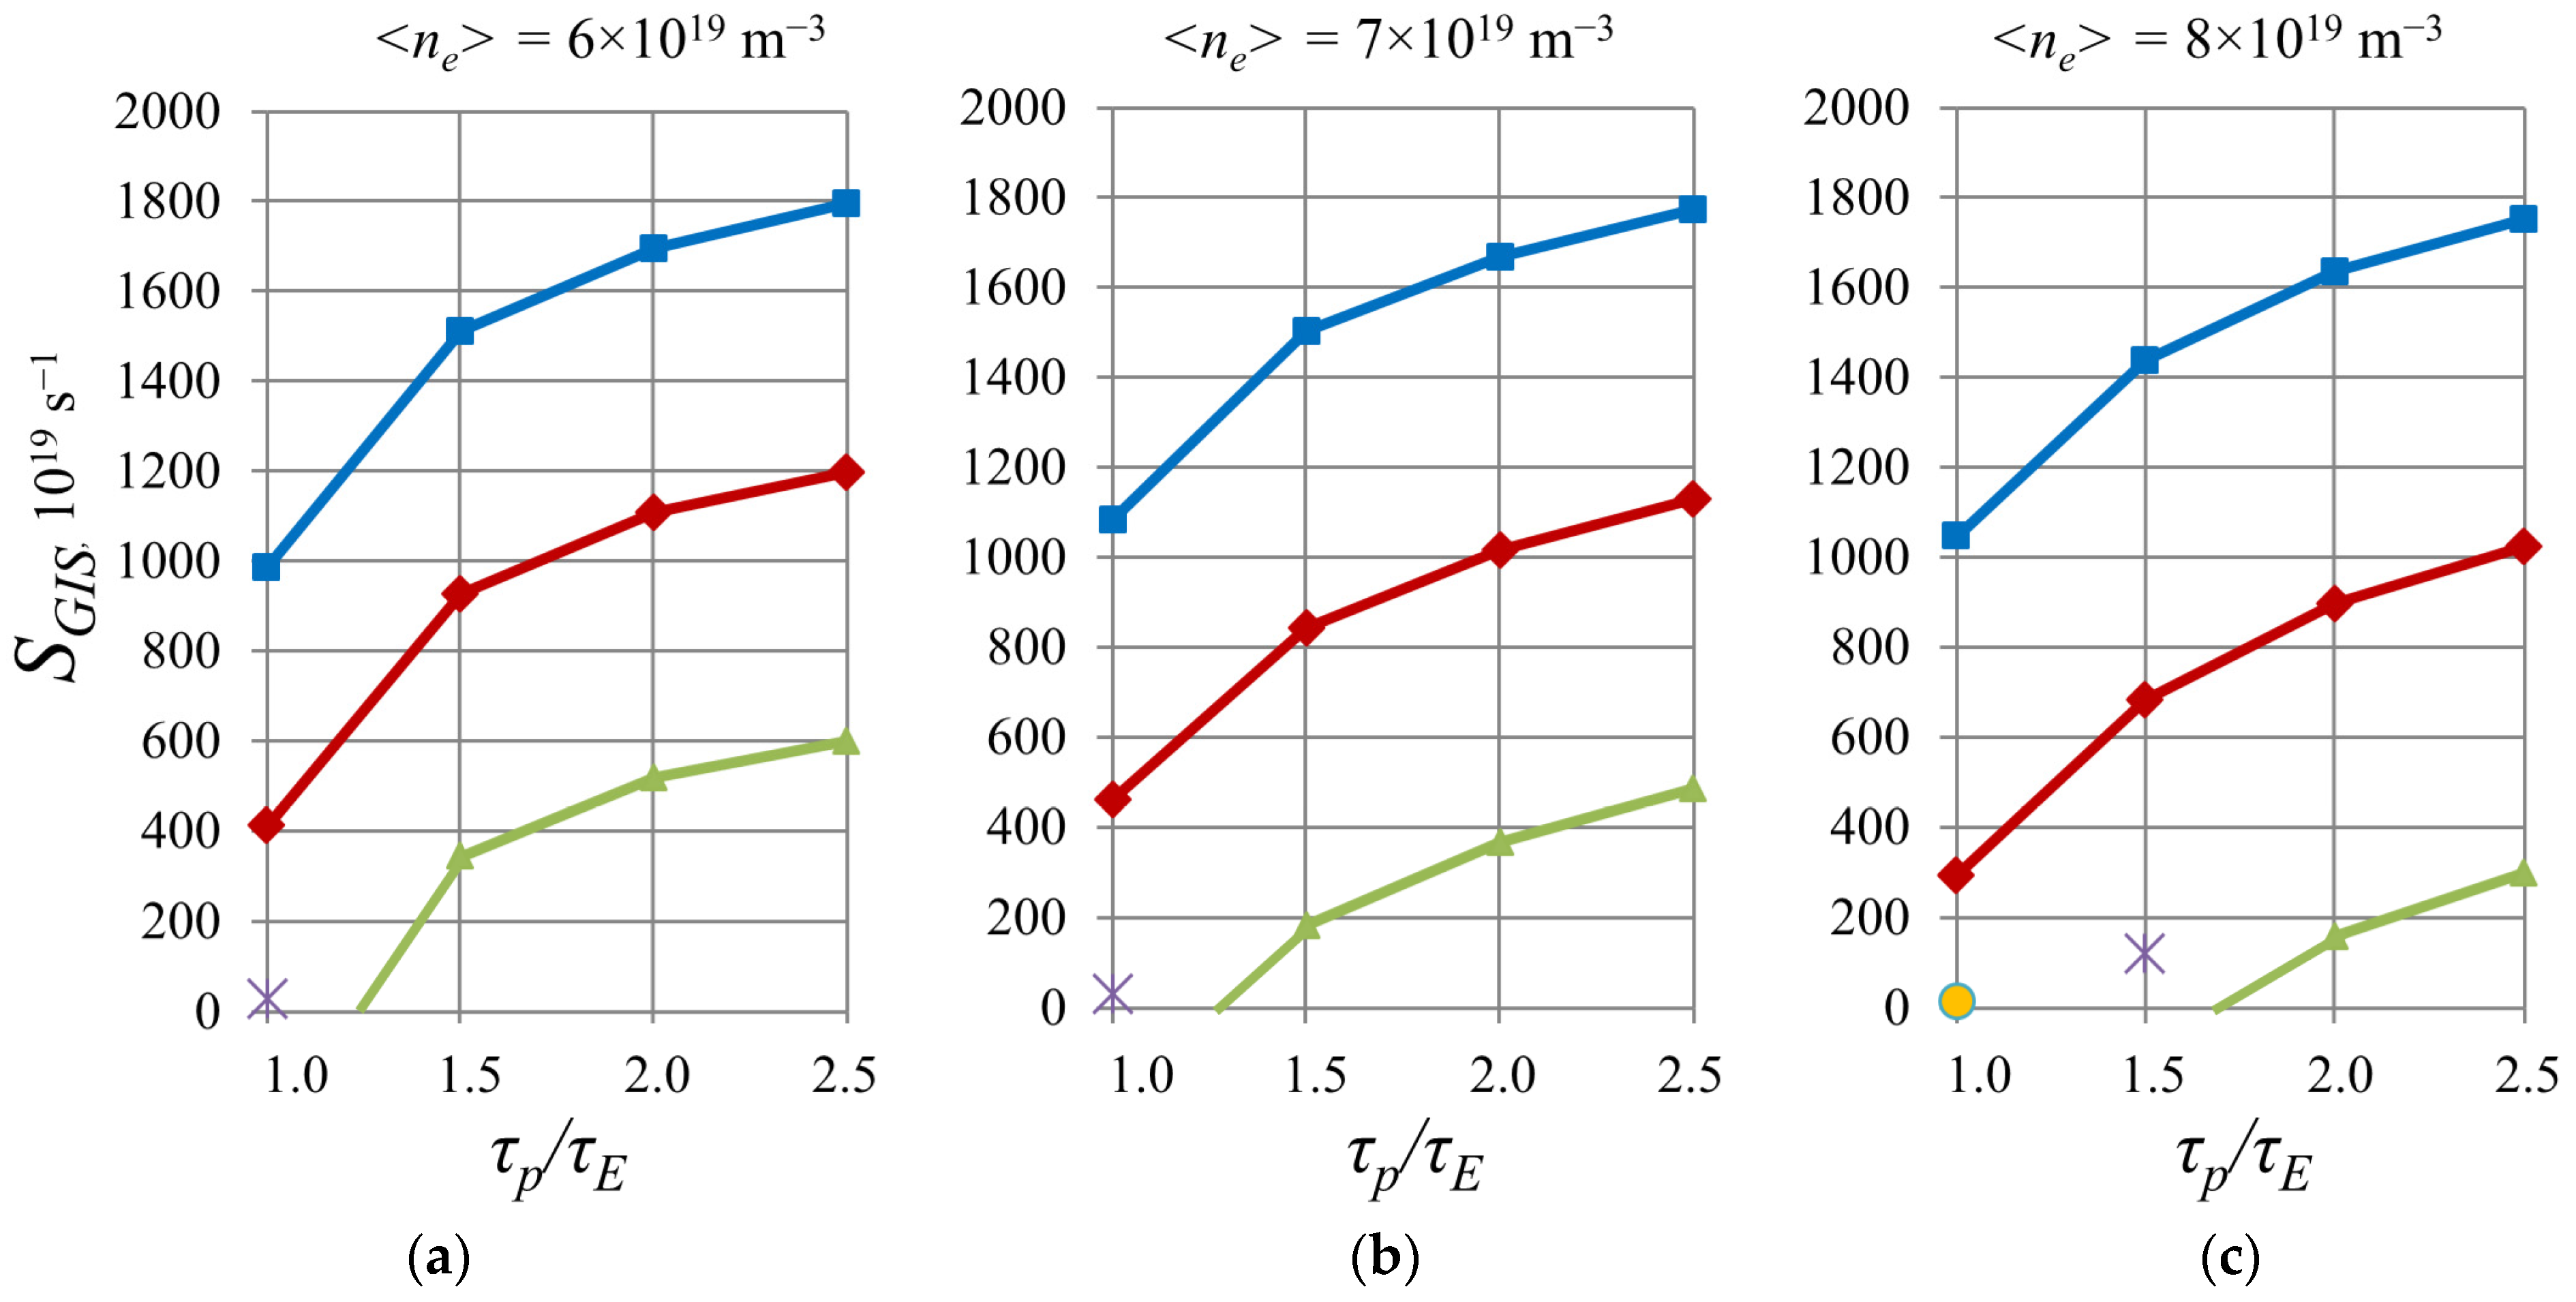
In scenarios with stimulated convective ELMs, an increase in particle losses from the plasma
is observed (see
Figure 10). As a result of the increase of flows from the plasma and from pellets that miss the plasma, at a constant
Ssep and constant pressure
pn, additional gas injection
SGIS has to be decreased. In the absence of a base value for
SGIS, in some working points (e.g.,
τp/
τE ~ 1 for α
ELM = 0.4), the pumping rate 20 m
3/s is insufficient to provide the required pressure of
pn = 2 Pa. It has to be increased to 22–25 m
3/s (see the separate markers: the crosses and the yellow dot in
Figure 11) when the value of
SGIS becomes almost zero. Since the additional flow of particles from the pellet “shards” that have missed the plasma core
SHFS (1/
keff_HFS − 1) cannot be turned to zero in the case of unpredictable gas desorption from the wall, the only controlling parameter remains the value of
SGIS.
At a fixed value of gas injection SGIS = 1600 × 1019 s−1, the flow into the pumping system of the vacuum vessel will increase to 50 m3 Pa/s for the scenario with natural ELMs and to 65–80 m3 Pa/s for the scenario with particle losses in convective ELMs. In this case, the geometry of the pumping nozzles and the chosen pumping equipment need to provide the required conductivity and pumping rate. In the DEMO-FNS project, pumping will be carried out from the upper and lower divertors through 36 pumping nozzles, of which
- -
the upper pipeline contains 18 branches, each of which consists of a 264-mm-diameter opening, a 264-mm-diameter 6900-mm-long pipeline, a 90° bend, and a further length of 304-mm-diameter 2200-mm-long pipeline;
- -
the lower pipeline also contains 18 branches, each of which contains a 264-mm-diameter opening, a 264-mm-diameter 5330-mm-long pipeline, a 90° bend, and a further length of 304-mm-diameter 2284-mm-long pipeline.
The total hydrogen conductivity of these pipelines is 34 m3/s (at T = 20 °C) and 44 m3/s (at T = 200 °C). When pumps with a total nominal hydrogen conductivity of 111.6 m3/s are used (18 + 18 turbomolecular pumps with a capacity of 3.1 m3/s), the total pumping efficiency is ~30 m3/s. When the total nominal pumping efficiency is increased two times (by using cryopumps), the total effective pumping rate increases only by ~15%. In order to be able to pump out substantially larger flows, it is necessary to increase the conductivity of the pumping channels, i.e., increase their cross section and decrease their length.
The analysis of the gas flow rate
SGIS acceptable for the DEMO-FNS project showed that the current limitation of
cp~30 m
3/s can provide gas injection up to
SGIS = 20 Pa m
3/s, or 1000 × 10
19 s
−1 for the considered working window (
Figure 12). Consequently, at the calculated flows from the plasma onto the DEMO-FNS wall (that are lower than flows calculated for ITER), the requirements for gas injection exceeds the engineering limitations of the pumping system for some of the considered scenarios. Specification of gas conditions at the first wall is extremely important to optimize the gas injection and engineering solutions in the pumping system.
In calculations, one should also account for the fact that the violation of the top–bottom symmetry [
38] in the double-zero configuration caused by the radiation–condensation instability (RCI) can lead to up to 5 times less efficient pumping. This means that nearly all pumping will be carried out from only one (colder) divertor, while the pumps connected to the other (warmer) divertor will be blocked. In this case, the total conductivity of the pumping system will decrease to 35 Pa m
3/s, which will allow us to conduct gas injection within 10 Pa m
3/s in the regimes with convective ELMs and within 20–30 Pa m
3/s in the regimes with natural ELMs. To provide pumping in the range of 50–85 Pa m
3/s, which corresponds to fixed gas injection of 33 Pa m
3/s, in case of disruption of divertor symmetry, the required pumping rate is
cp = 40–70 m
3/s (depending on the operation scenario).
Taking into account the fixed value of
SGIS and the connected increase in flows in the gas injection system (relative to the estimates that were made to date) will not affect the flows in the fuel injection systems and the hydrogen separation system that contain the maximum gas reserves. However, this will lead to an increase in the amount of tritium accumulated in the pumping, processing, and gas injection systems (in detail, this phenomenon is discussed in
Section 3.6).
3.5. Parameters of the Neutron Source
Estimates of the maximum neutron yield for the volumetric fusion neutron source in the DEMO-FNS project with 40 MW of fusion power [
39,
40] give 1.42 × 10
19 s
−1. At the same time, calculations by the ASTRA code did not provide [
8,
13] such values for neutron power and yield. Calculations showed that, in the working window of densities and confinement parameters, the achievable fusion power is >35 MW, which is higher than calculated earlier (see
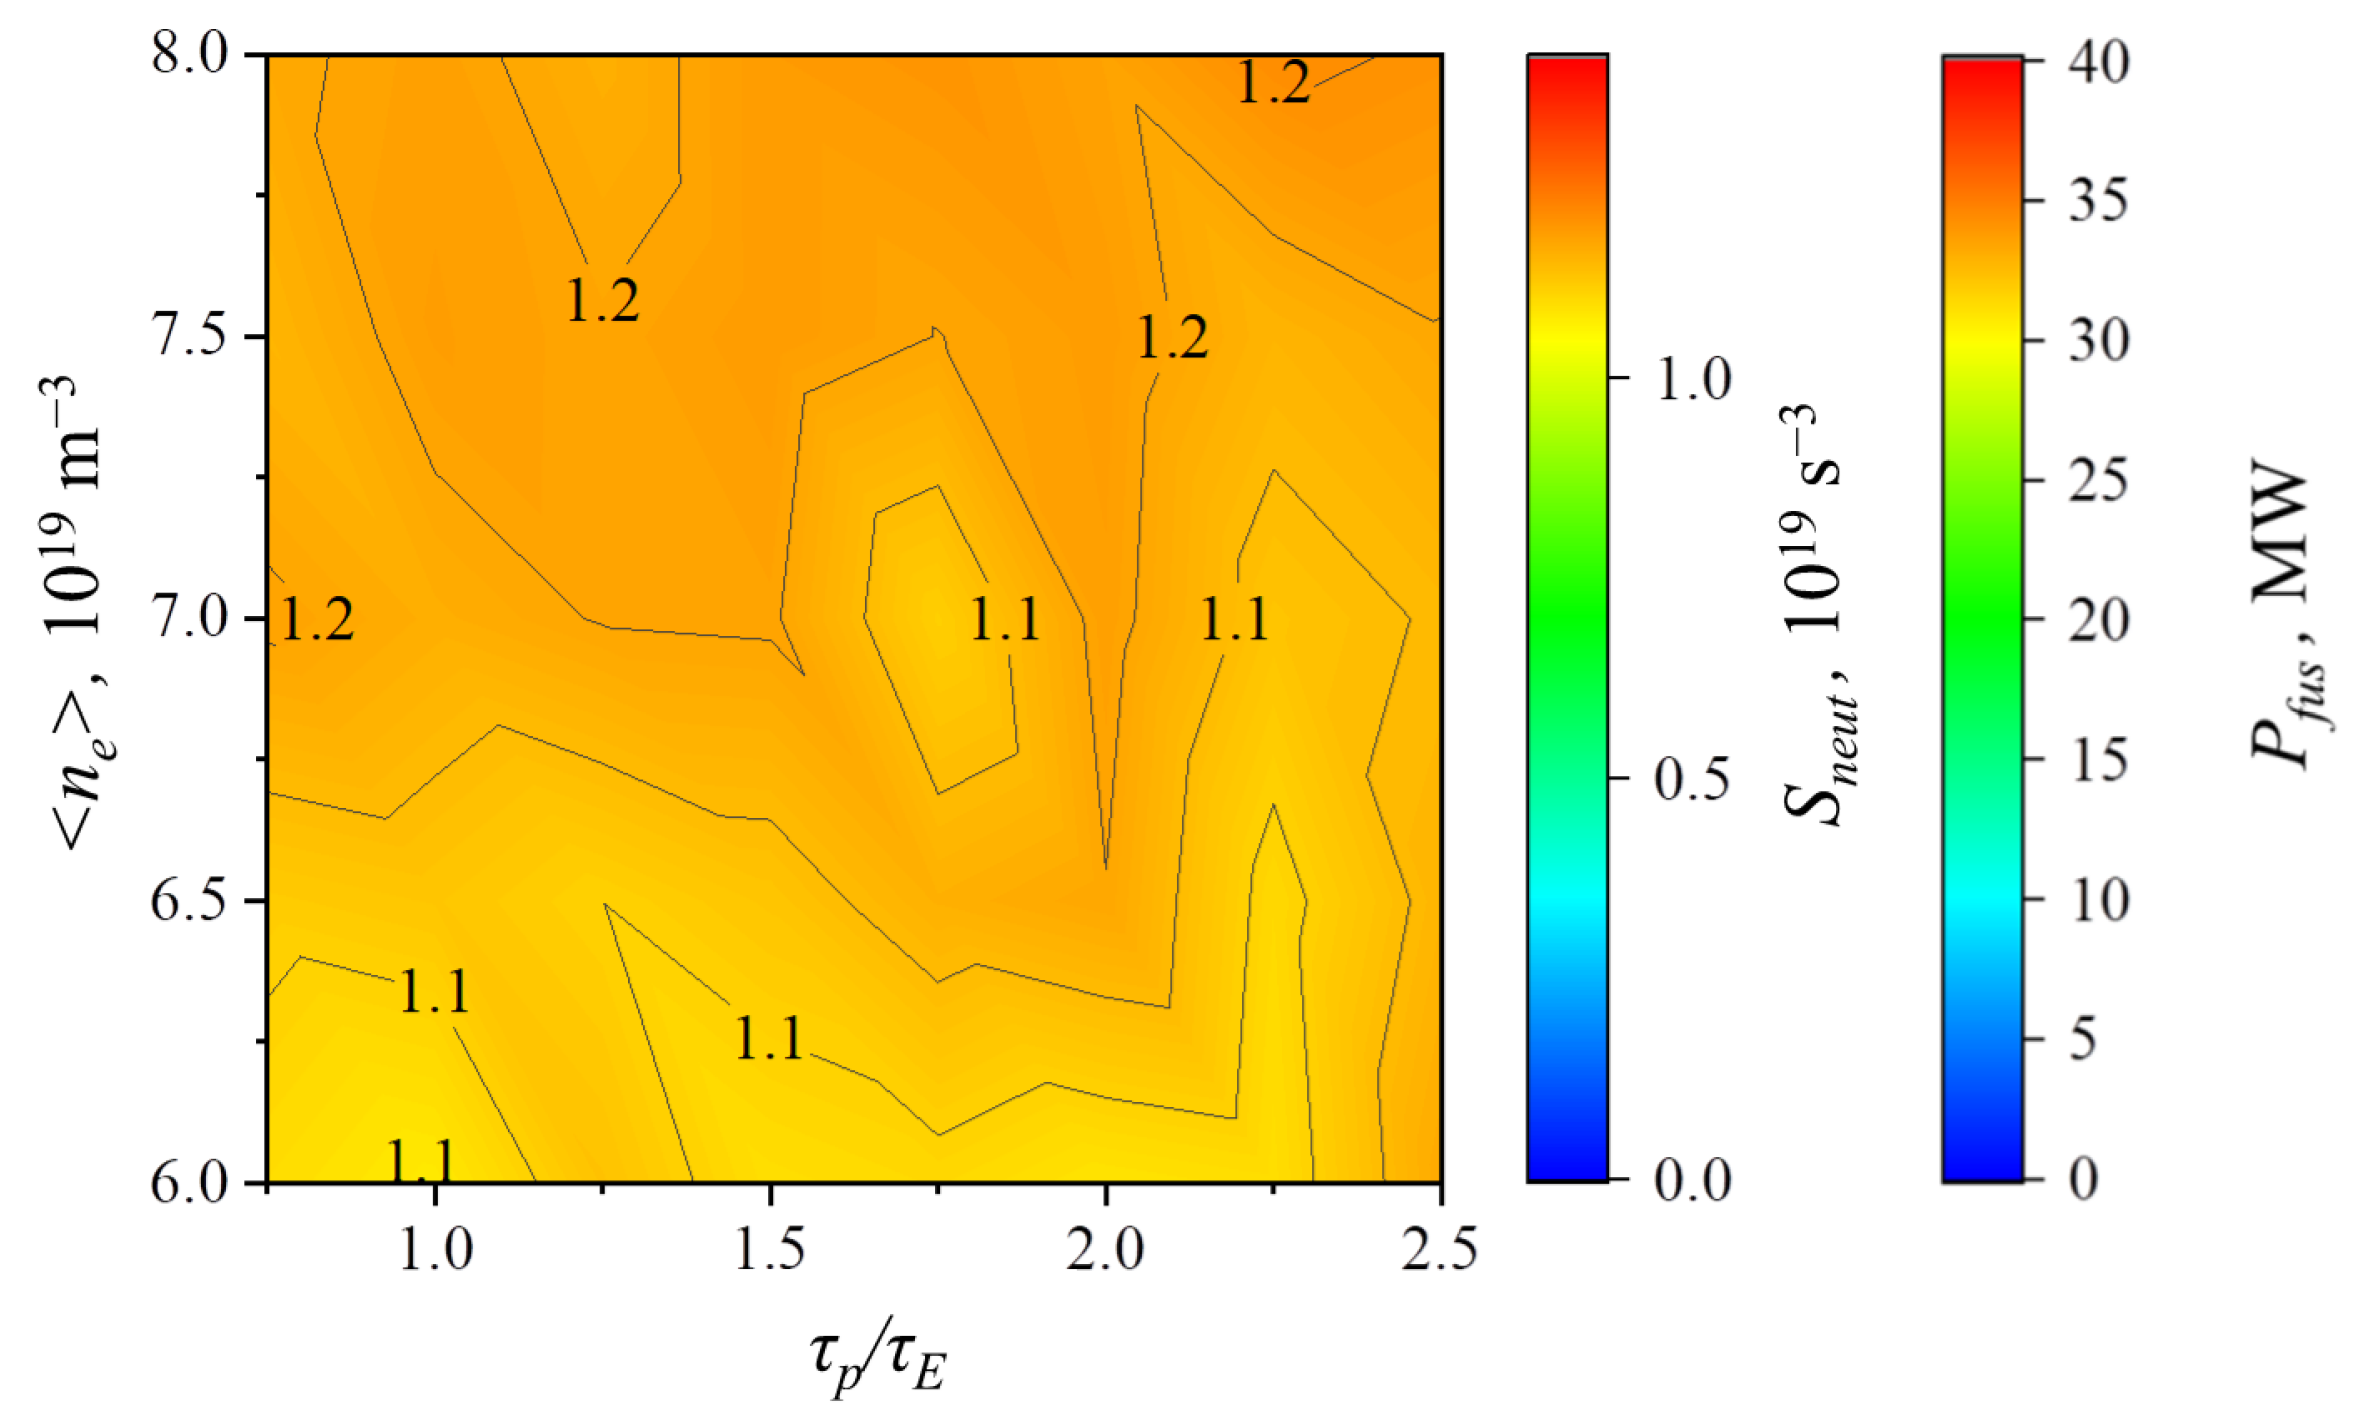
Figure 13). The achievable power increases with increasing plasma density.
It was already noted [
13,
41] that the total fusion power
Pfus is formed by the plasma–plasma and beam–target components and the ratio of these values depends substantially on the plasma and beam compositions. Since, to date, the most promising variant is that using the deuterium NBI, calculations were carried out for this. The obtained dependences of neutron yield
Sneut on
fcoreT (see
Figure 14) are in relatively good agreement with the earlier obtained results [
13]. The maximum values of neutron flow can be obtained at
fcoreT = 0.7 for the D
0 beam. In the considered case with
fcoreT = 0.5, the neutron yield turns out to be approximately 10% lower than expected, similar to the total fusion power. The dependence of neutron yield
Sneut on plasma parameters: density <
ne> and confinement parameter
τp/
τE is shown in
Figure 13. It is seen that, in the considered working window, the values are quite uniform.
3.6. Tritium Inventories
The total store of tritium, as the most critical fuel component, is calculated by the FC-FNS code using estimates of the FC systems described in [
6]. In [
22], dependences were given for the tritium store in the FC of the DEMO-FNS facility on particle confinement time
τp/
τE for different plasma densities <
ne> for two types of beams (D + T and D). In addition to the case of natural ELMs, whose particle losses were included in the total diffuse losses, convective ELMs that are more frequent with lower stored energy were also considered. In this case, the ion losses from the plasma are expected to be much higher, which requires that its fueling be intensified and that the flows in the FC increase [
8]. Note that, in a number of systems, the amount of accumulated isotopes will not change at different plasma parameters. However, in the majority of the FC components, there will be a correlation between flows in the FC and the hydrogen isotopes inventory in them. For this reason, during simulations by the FC-FNS code, for each separate set of plasma parameters, flows in FC and fuel component inventories are calculated [
22].
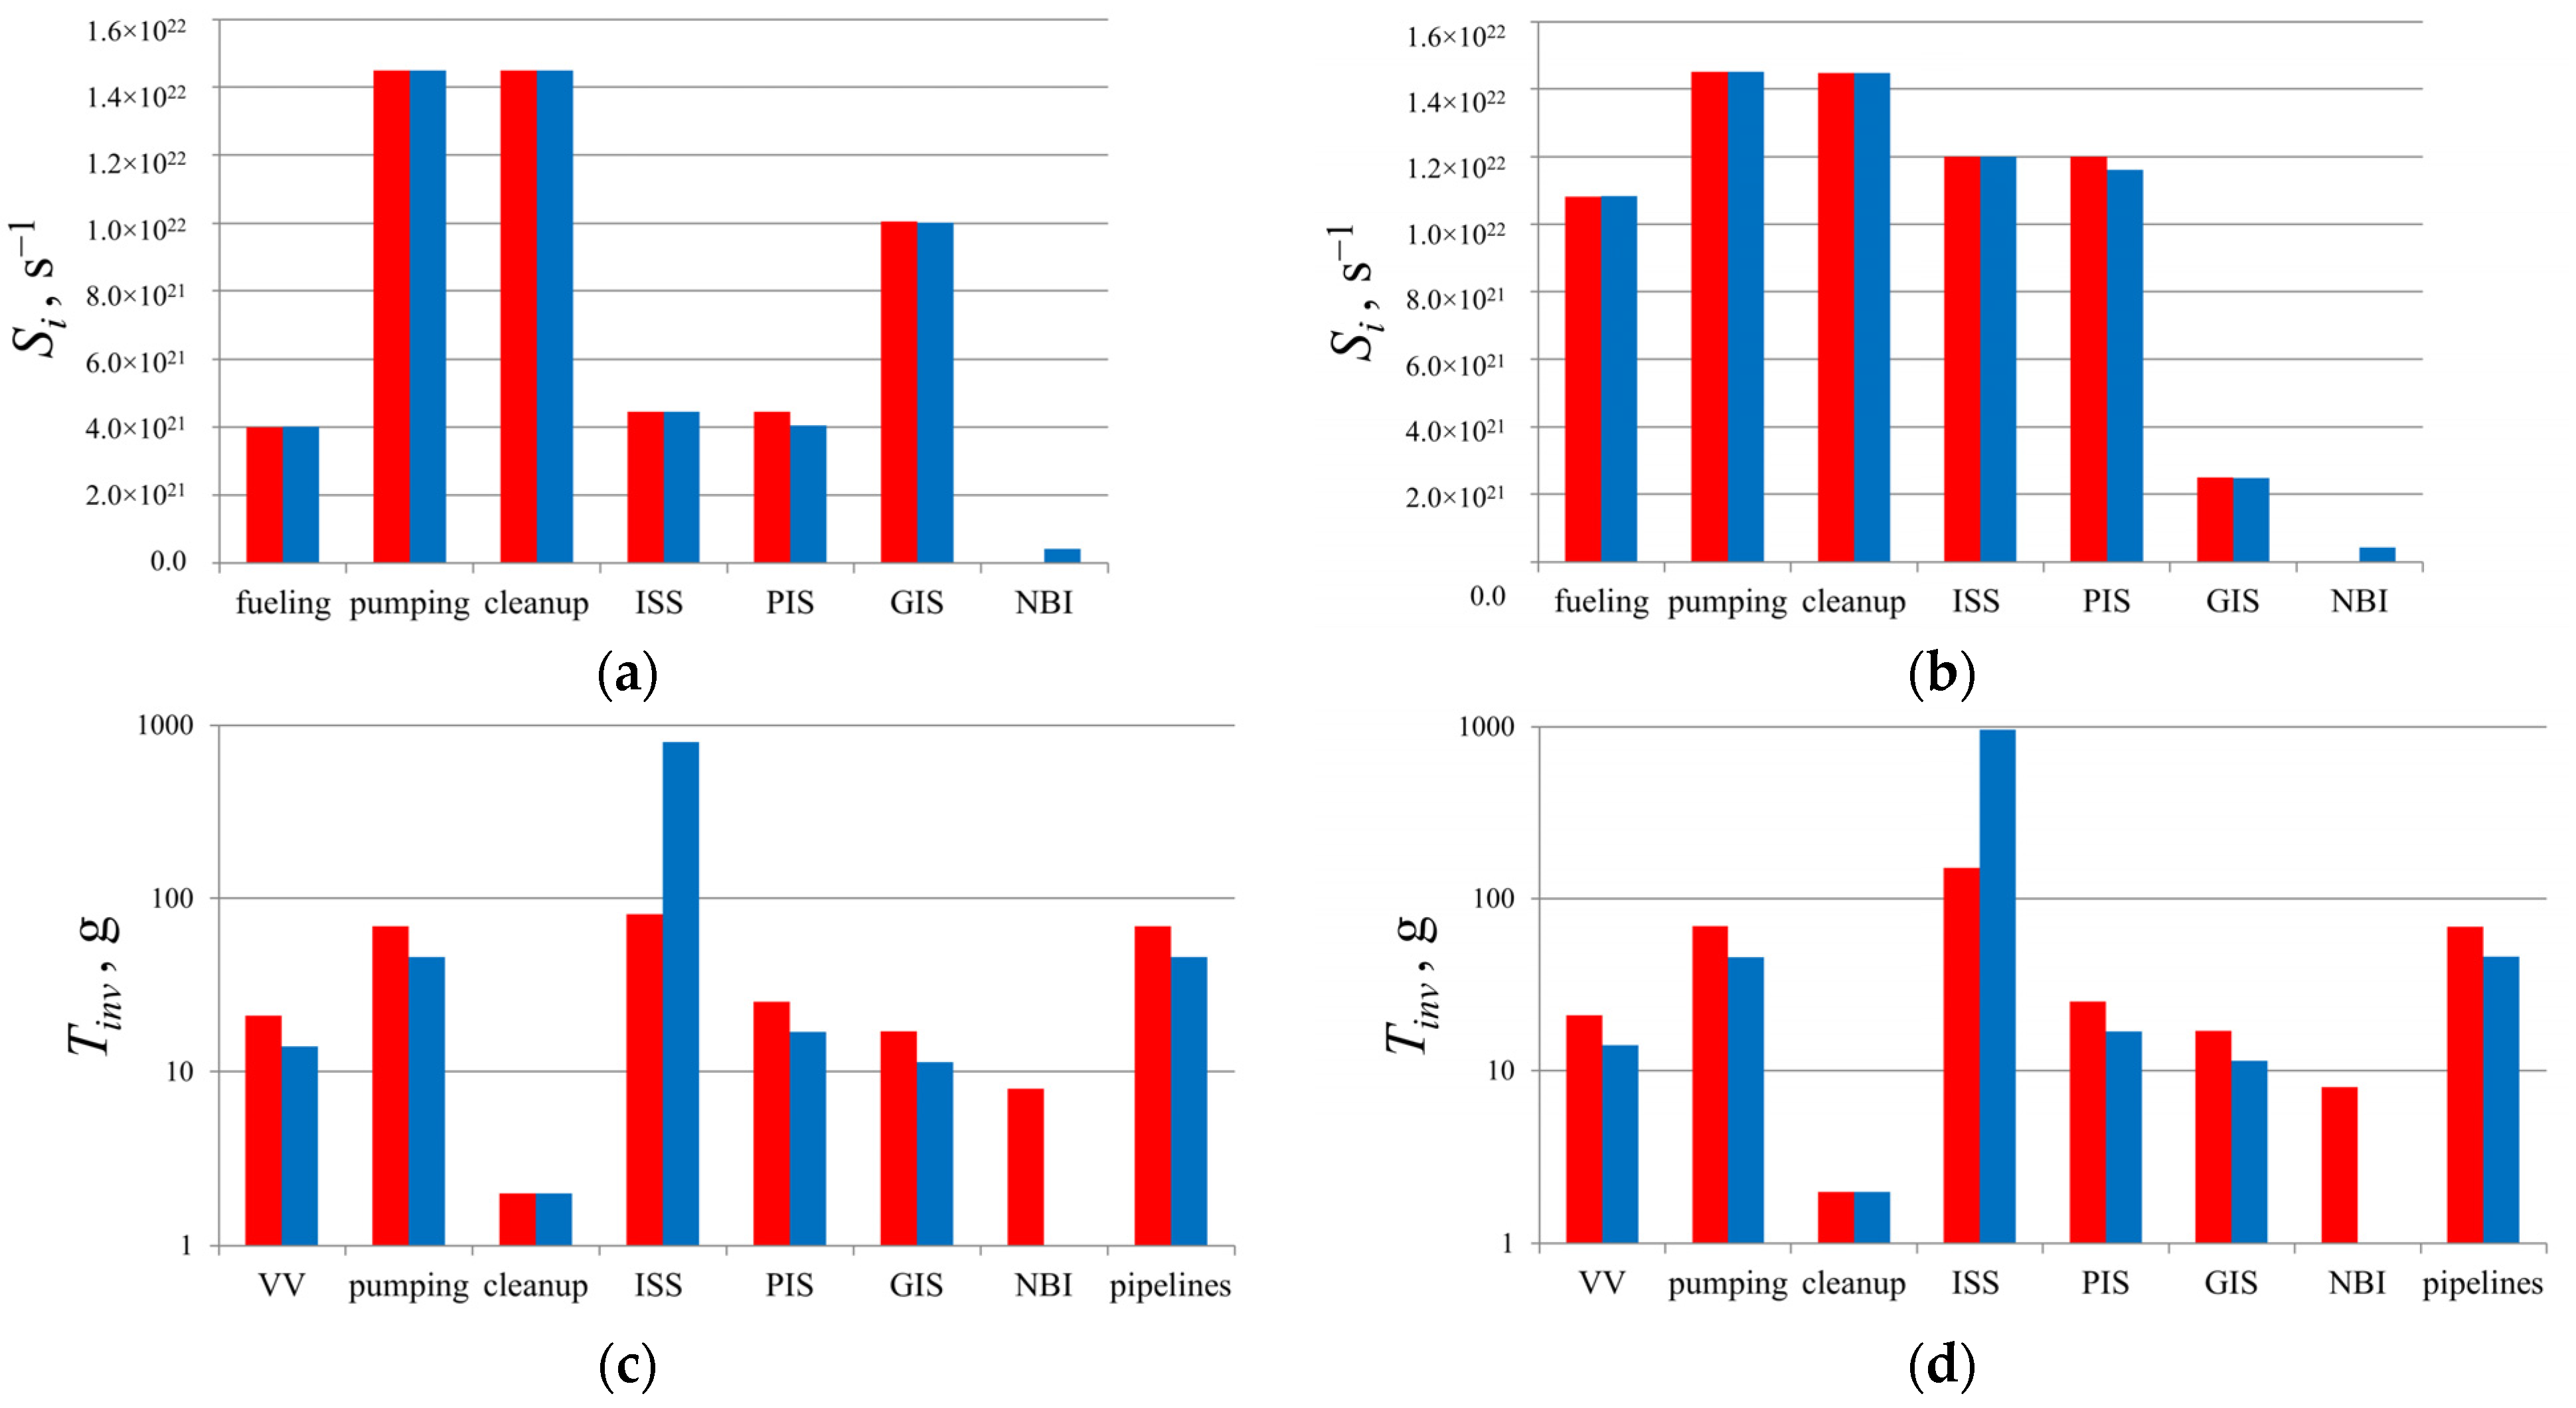
Figure 15 shows the flows and distribution of the hydrogen isotopes inventory in the FC systems in the case of the deuterium beam.
Figure 15a,c show the case with natural ELMs, in which the flows in the FC are lower than in the case of convective ELMs shown in
Figure 15b,d. According to the accepted FC architecture [
21,
22], increasing the particle flows across the plasma increases the loads on the PIS and NBI systems and the hydrogen isotope separation system (ISS) that supply them. At the same time, the flow in the gas injection system (GIS), on the contrary, decreases due to the increase in particle flow in the vacuum vessel due to the partial penetration of pellets through the plasma (the penetration efficiency is <1). The maximum flows of particles through the pumping and cleaning systems are independent of the considered scenarios, since they are determined by the engineering parameters: the pressure in the divertor and the pumping rate [
22].
Figure 15c,d show that the maximum amount of tritium is accumulated in the pipelines, the pumping system (if cryogenic pumps are used), and in the hydrogen isotope separation and the injection systems. The amount of tritium in the injection systems is determined, in the first place, by the construction of these systems. At the same time, the amounts of tritium and deuterium in the hydrogen isotope separation system are determined by the initial gas flows (from different FC components) and by the isotopic composition of these flows. It was noted in [
42] that the method of estimating the amount of tritium inventories in the FC systems with a strong dependence of hydrogen isotope flows on plasma parameters determines the total store of tritium
Tinv in the facility. In the described calculations, we use the earlier-developed specialized ISS module of the FC-FNS code to estimate the amount of tritium in the ISS [
42].
The values calculated using the new ISS module for the FC-FNS code was lower than those obtained earlier [
22]. The estimate of the contingency stock required during the temporary stop of the tritium reproduction systems (for repairs or maintenance) remained the same, and it is about 100 g of tritium. Without taking into account the tritium produced in the blanket of the facility and the tritium stored in the long-term storage for outside consumers, from 350 to 400 g of T
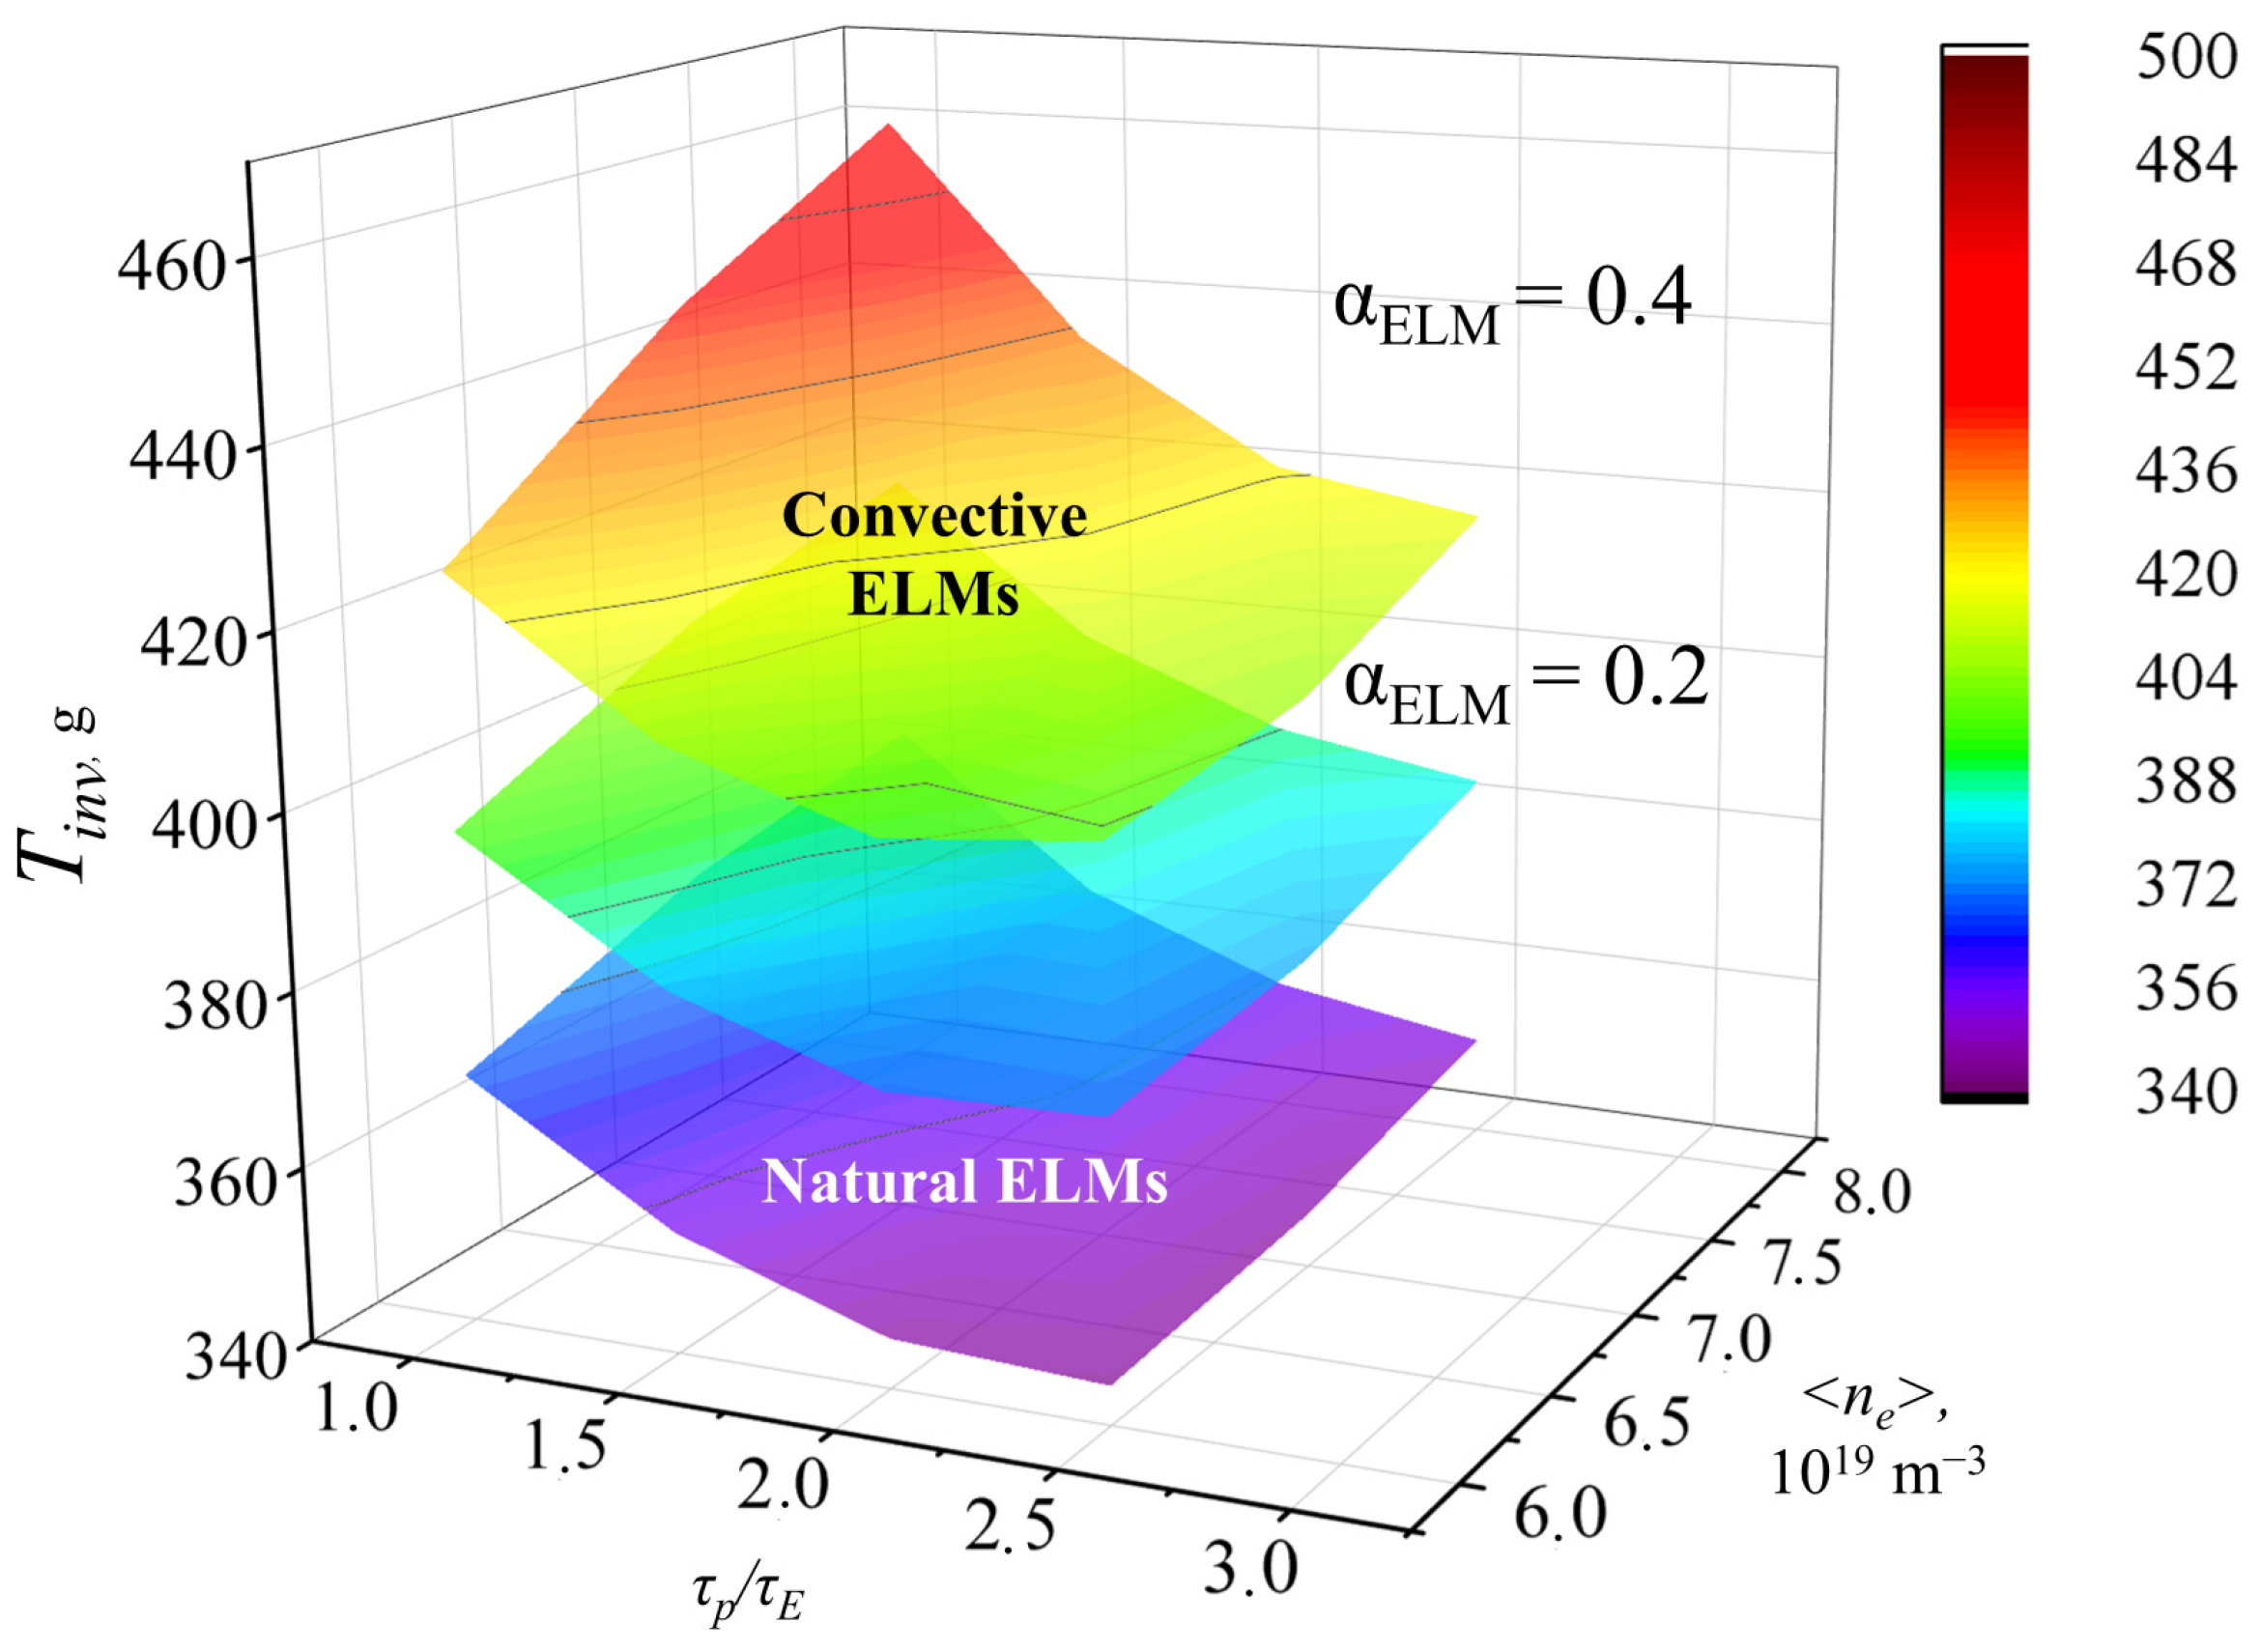
2 will be found at the facility site depending on the ELM scenario (taking into account the losses from radioactive decay). The store of T in the FC (without taking into account the long-term storage), including the particle losses in ELMs, depending on the particle confinement time
τp/
τE and plasma density <
ne>, are shown in
Figure 16. The increase in the flows of fuel components through the injection system, the isotope separation system, and some other systems when convective ELMs are taken into account leads to an increase in the storage of T in the FC. The amount of T in the FC increases to 500 g in the working window of plasma parameters, the density <
ne> and the confinement
τp/
τE for α
ELM = 0.4 for convective ELMs.
As discussed above, the changes in flows in the gas injection system SGIS do not lead to changes of flows in the fuel injection system or the hydrogen isotopes separation system, which can contain the maximum amounts of tritium. However, this leads to an increase in stored tritium in the gas pumping, processing, and puffing systems by up to 50 g in the considered window of parameters.

