Article

Navigation Safety on Shipping Routes during Construction

by
Vytautas Paulauskas
1,
Ludmiła Filina-Dawidowicz
1,2,* and
Donatas Paulauskas
1
1
Marine Engineering Department, Klaipeda University, H. Manto Str. 84, LT-92294 Klaipeda, Lithuania
2
Faculty of Maritime Technology and Transport, West Pomeranian University of Technology, Szczecin, Ave. Piastów 41, 71-065 Szczecin, Poland
*
Author to whom correspondence should be addressed.
Appl. Sci. 2023, 13(15), 8593; https://doi.org/10.3390/app13158593
Submission received: 29 June 2023 / Revised: 17 July 2023 / Accepted: 19 July 2023 / Published: 26 July 2023
(This article belongs to the Special Issue Advances in Nautical Engineering and Maritime Transport)

Abstract

:
Construction work or other maintenance and repair activities in navigational channels are crucial to ensure and improve ships’ movement on the selected routes. However, during the performance of these works, the ships’ navigation along the construction area becomes more difficult due to the decreased parameters of passages for vessels and the operation of specific equipment on the route, e.g., dredgers and floating cranes. During construction work in navigational channels, it is impossible to stop navigation or limit ships’ parameters because there may not be other possibilities for vessels to reach their planned ports or other dedicated areas. The prior determination of ships’ sailing conditions and restrictions is essential to ensure maritime safety in such areas. The aim of this study is to develop a methodology that allows the precise determination of minimum passage parameters for the navigation of ships sailing through the areas in navigational channels where construction or development works are being carried out. The theoretical basis for the minimum passage parameter calculation is presented. The methodology for assessing the conditions and restrictions of navigation during construction work is proposed. The minimum width of the shipping passages in defined navigational, hydro-meteorological, and hydrological conditions and the possible minimum parameters sufficient to guarantee navigational safety are considered in a case study. The research results may be interesting for port authorities, shipping companies, and other entities involved in the organization of ships’ movement during construction work in navigational channels or other areas.

1. Introduction

The trends that have emerged in maritime transport during the last decade indicated a significant increase in the parameters of ships, especially container vessels. This fact impacts port operations. Ports make efforts to attract even bigger ships; however, very often, their infrastructure is not adjusted or improved to service these ships. Navigational channels and adjacent areas also require adaptation to service bigger vessels; therefore, construction work, other infrastructure development, or renovation investments to improve ships’ sailing conditions are carried out. The performance of construction work influences the ships’ traffic conditions and very often causes a temporary decrease in ships’ passage parameters [1]. In such cases, in order to ensure the safety of ships’ navigation during improvement works in these channels, the advanced evaluation of the possibility of crossing the restricted area should be performed.
Weather conditions have a great influence on ship maneuverability; therefore, it is necessary to consider making changes to vessels’ maneuvering capabilities when crossing the navigational channels, especially when construction work is being carried out [2]. Moreover, decisions related to ship traffic in these channels are made depending on a number of factors, including the ship’s speed limitations, hydro-meteorological and hydrological conditions, changes in weather conditions, and the need for additional assistance from tugs or vessel traffic control (VTC) services. Importantly, the mentioned decisions must be made before the ship’s master receives permission to enter the port, navigational channel, or other restricted area. Nevertheless, sometimes, information from VTC or other dedicated systems comes too late. This is why the advanced calculation of the minimum parameters of the passages for vessels becomes significant in facilitating the decision-making process [2].
In order to make rational decisions, the possession of knowledge regarding the methods for calculating the passages for ships on the route may be helpful. However, sometimes, the calculation results and evaluations made in advance cannot be applied in practice due to the following possible changes [3]:
  • The ship’s internal conditions (e.g., maneuverability changes depending on the sailing area);
  • The ship’s external conditions (e.g., weather conditions changing in a short period of time, shallow water in some areas);
  • The traffic of other ships in the analyzed area and hydrodynamic interactions between ships on short distances.
During the construction, renovation, or other improvements in navigational channels or adjacent areas, a decrease in the navigational passage’s width and depth may take place. Moreover, it should be noted that the location of the construction work may change with its progress; work within navigational channels is usually performed on separate sections, which are improved over a certain period [4].
An analysis of the literature revealed that the available methodologies or recommendations for the calculation of navigational channel parameters [5] are not always used in practice due to the number of approximations or a need to possess a significant amount of additional data [6,7]. Practically applicable calculation and evaluation methodologies should comprise external and internal forces and moments influencing the ships, taking into account the ship’s maneuverability and other parameters. Methods for assessing a ship’s optimal trajectory in narrow passages have been developed [8,9]; however, many of them do not include the complex assessment of the ship’s movement and are not practically useful in real operating conditions.
This article aims to develop a methodology that allows for the precise determination of the limited conditions for the navigation of ships passing through areas in navigational channels where construction or development works are being carried out. The scientific novelty of the research deals with the development of a methodology for calculating a ship’s trajectory and sailing band in narrow passages considering hydro-metrological and hydrological conditions to improve navigation safety.
This article includes a Section 2, where selected navigational channels are characterized, and the available related research studies are analyzed. In Section 3, the methodology for calculating the ship’s trajectory and sailing band in navigational channels in restricted sailing conditions is presented. The developed methodology considers the internal and external forces that act on the ship in narrow passages during construction work in navigational channels. The Section 4 includes a case study description and calculation results that prove the possibility of applying the presented methodology in practice. The Section 5 summarizes this study.

2. Literature Review

2.1. Analysis of Selected Navigational Channels

In navigational channels and adjacent areas, various obstacles may take place and impact navigation safety. These obstacles may be constant or temporary; they influence the parameters of passages for ships and the need to assure additional precautionary measures for navigation in such places.
Different natural obstacles take place in fjords and archipelagos, such as the Norwegian fjords, the Stockholm archipelago, and other similar places. These obstacles appear constantly and are related to natural conditions on the routes. Their occurrences influence the decrease in passage width. Therefore, ship navigations along these areas are performed considering the limitations dependent on natural conditions.
Mentioned natural and constant navigational obstacles could be reduced with investments in infrastructure development. However, it should be noted that in some cases, the improvements are rather expensive and time consuming (e.g., may include excavations, dredging works, etc.). Sometimes, it is even impossible to provide changes in infrastructure due to environmental restrictions or other regulations.
Temporary obstacles in navigational channels may deal with construction work or other activities performed on shipping routes that limit for some time the possibility of passing it according to previous regulations. The port gates renovation in Klaipeda port may be taken as an example of temporary navigational obstacles occurrence (Figure 1). During construction work conducted within the approach and inside the navigational channel, a decrease in the channel’s width in some places was observed. Navigational obstacles changed with the progress of construction work, which was challenging for ship master planning sailing trajectories.
In navigational channels or adjacent areas, construction work may be carried out using different equipment that also influences the temporary changes in the ship’s passage parameters (Figure 2).
It should be highlighted that construction work carried out within or close to navigational channels is usually short term. However, different restrictions are applied for ships passing through these places. These restrictions include speed limitations, possible maximum parameters of the ships, the need to use pilots and tug assistance, etc. Therefore, it is very important to find the best solutions to assure navigation safety in such areas that may be conducted, i.e., via the in-advance calculation of the ship’s trajectory and the ship’s sailing band in narrow passages in the case of acting hydro-metrological and hydrological conditions.

2.2. Literature Analysis

In available research studies and introduced recommendations, the issues of ship navigational safety in narrow passages and the determination of safe channel width for passages depending on ship parameters and navigational conditions were analyzed [1,2,11,12]. Special navigational conditions and accidents that occurred in different places were examined, including the Istanbul Strait [13], the Gulf of Gdansk [14,15], and navigation safety in ports and seas [16]. It was noted that narrow passages may also take place in port approach channels. Therefore, vessel traffic safety in such areas was also studied [17,18], and risk analysis for ship traffic was carried out [19,20].
Construction, development, and reconstruction work may take place in different navigational areas. Such works may be carried out within sea areas, e.g., close to windmills farms, where ships maneuvers are very limited, as well as ships accidents may happen [21]. Such accidents may occur between ships or between ships and offshore constructions. In the available studies, the safety of offshore installations was analyzed [22], as well as collisions of vessels with offshore wind turbines were investigated, and risk assessment was performed [23].
Available research studies were also focused on the determination of ship trajectories in different conditions. The research results included visual and optical trajectory checking [24,25], visualization, and simulation of vessel traffic [26,27,28], which is important for shipping safety in complicated navigation conditions. The visual analytic tools for vessel movement were examined [28,29,30]. He et al. [31] studied the quality problems of AIS (Automatic Identification System) data. Öztürk et al. [32] performed visual analytics and analyzed the vessel’s collision probability to improve ship navigation safety. A similar research problem was explored to determine trajectories for ships crossing the open sea close to obstacles influencing navigation safety [33].
A lot of research has been carried out to examine the interaction between ships, as well as ships and banks in narrow channels and sea areas [19,34,35]. Hydrodynamic interactions (considering waves influence) between ships traveling or stationary in shallow waters were investigated [36,37]. Moreover, the identification of collision risk and ship accidents in narrow channels based on AIS data was performed [38,39].
It should be highlighted that AIS data are widely used for the analysis of ship traffic and the occurrence of accidents in navigational channels and sea regions [40,41]. The data obtained from this system may be used for intelligent maritime navigation [42], maritime special planning [43], evaluation of vessels’ traffic with speed control [44], extraction of intelligent maritime routes [45], and other purposes to increase navigational safety. Vessel’s pattern knowledge was discovered from AIS data, which is important to apply in ships traffic planning in narrow channels to avoid collisions and other accidents [46,47]. Attention was paid to the fact that AIS data are also helpful in planning ship trajectories in inland waterways to prevent collisions and accidents due to very narrow passages in some places [48].
Ship collision avoidance methods and dynamic ship heels related to maritime transport safety were investigated in available studies [49,50]. Ship trajectories and shipping density for ships entering or leaving the port [47,51], as well as shipping density in fishing and other regions [52,53,54], were analyzed in detail. Ships movement classification was carried out [55], paying attention to the accuracy of data needed to plan the navigation trajectory [56,57,58].
Many ship collisions and accidents occur due to human errors [19,59], organizational, technical, environmental, and other factors [60,61]. Eleftheria et al. [16] conducted a statistical analysis of ship accidents. It should be noted that it is very difficult to reduce or exclude risk factors that influence the ship, especially human factor impact, due to a small number of crew on various ships, very intensive work regimes, and other reasons.
The analysis of the available literature on ships’ passing limitations in narrow passages revealed that despite in-deep investigations conducted regarding the research issue, there is still a lack of comprehensive research results directly related to navigation safety on shipping routes during performed construction work when ship’s sailing conditions may rapidly change, and it is necessary to make the correct decision to avoid collisions or accidents in narrow channels. Therefore, this article is focused on developing the methodology and showing its practical application to increase navigational safety and avoid ship collisions or accidents in mentioned conditions.

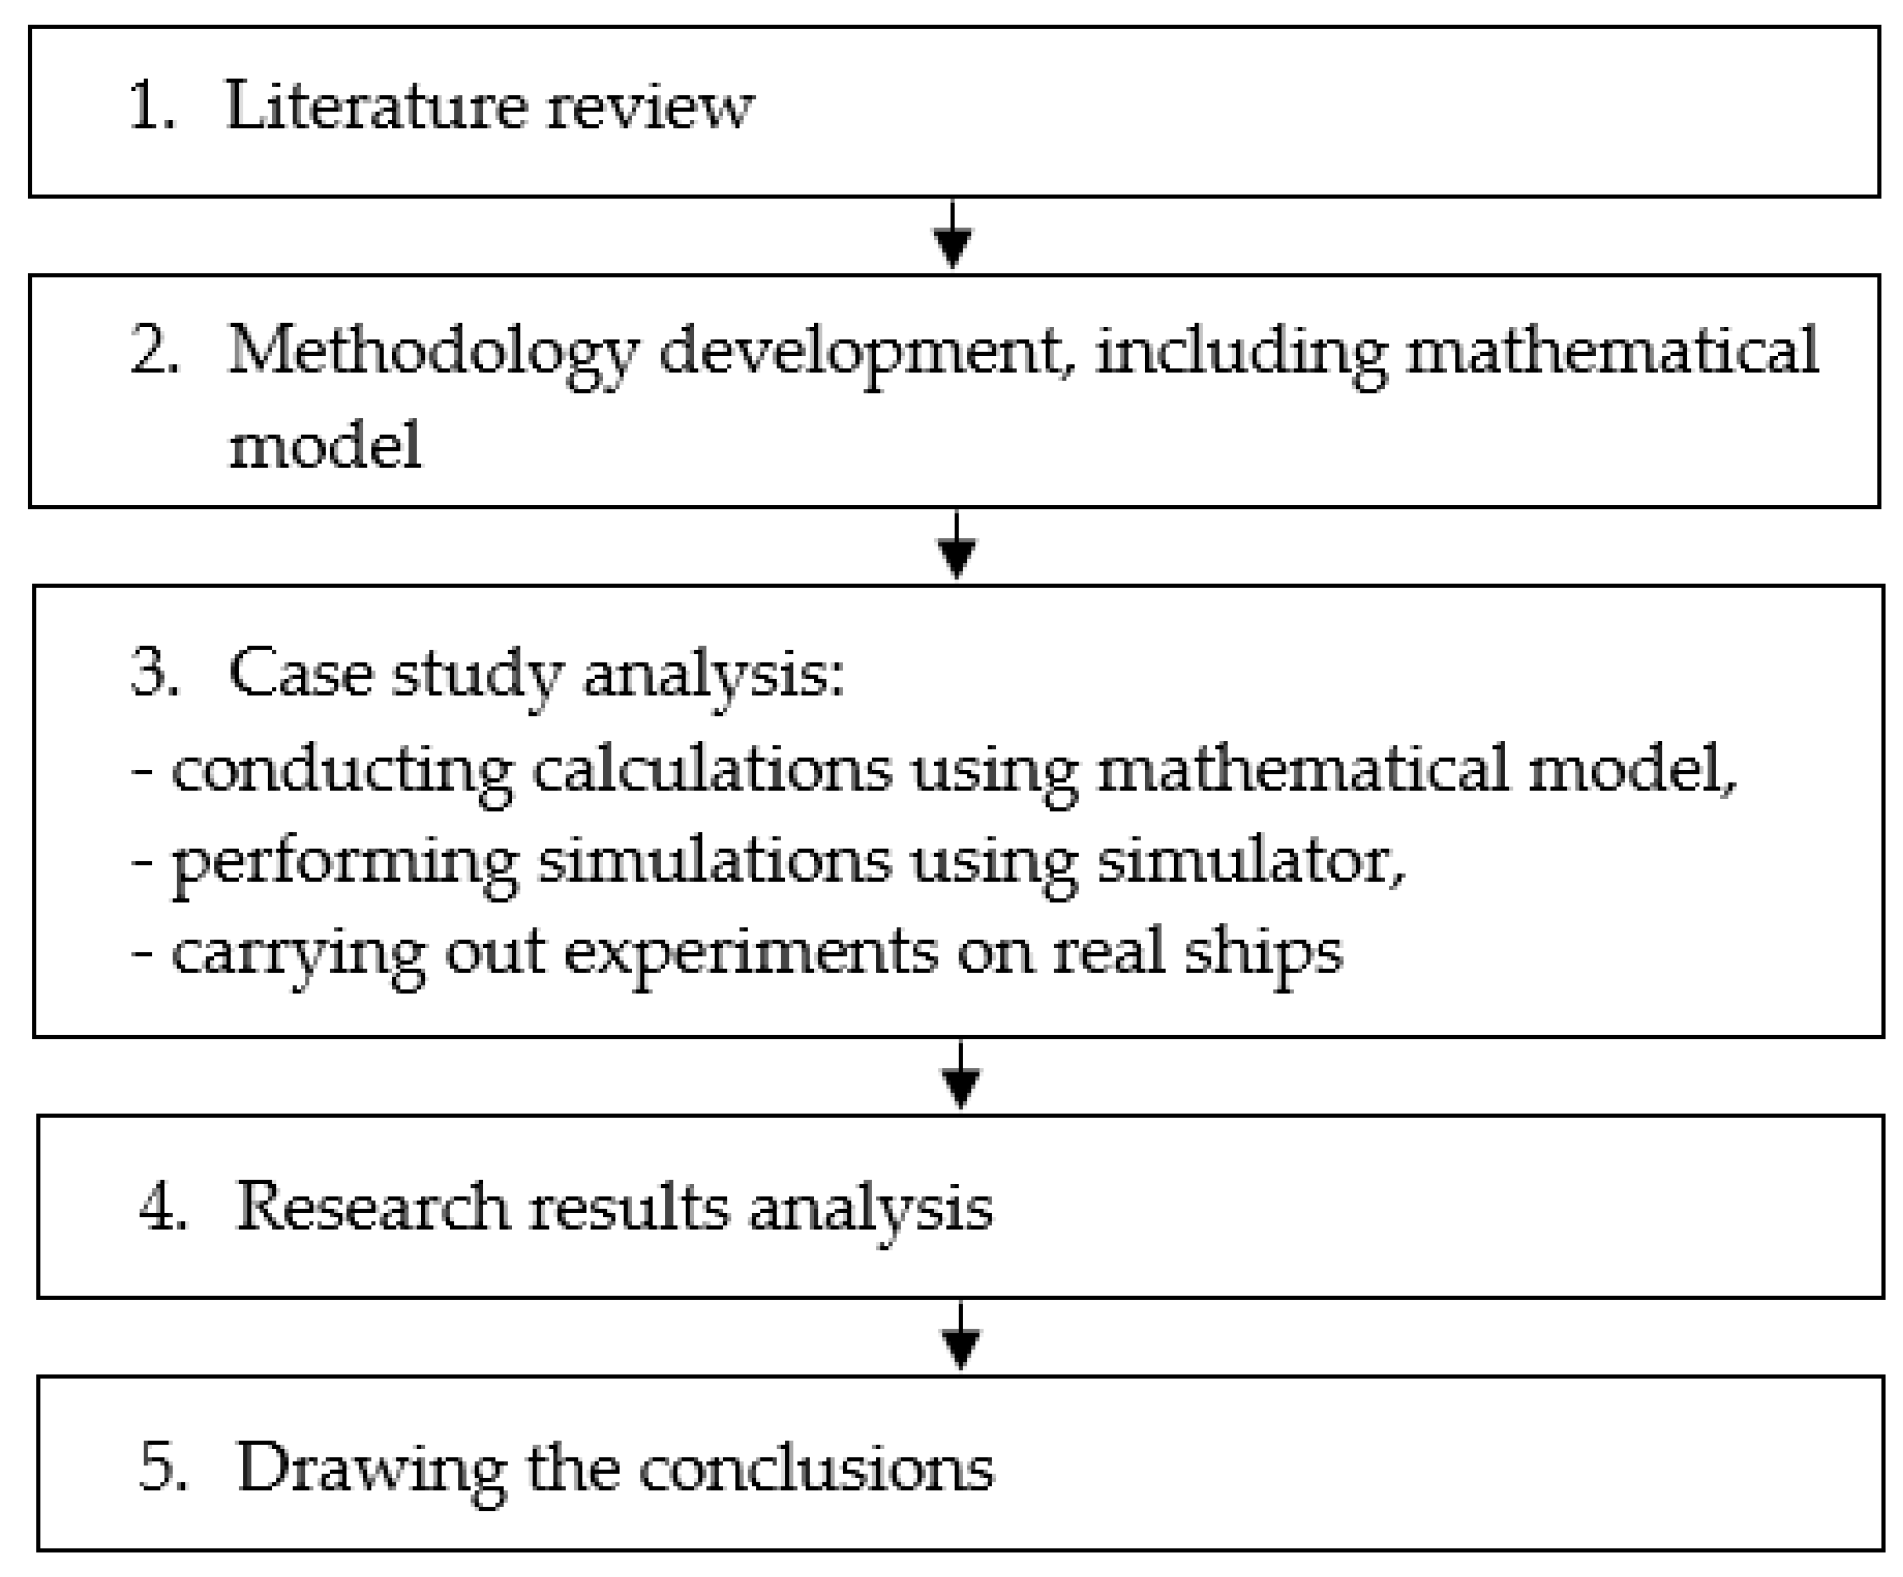
3. Materials and Methods

3.1. Steps of Research Methodology

The following steps of research methodology were applied to conduct our research (Figure 3). After carrying out the literature review, the mathematical model was developed.
The theoretical calculations of passage bands for ships to cross channels in special conditions were performed. For calculation of the real ship’s trajectory in channels, the maximal distribution method was used utilizing data achieved by conducting experiments on simulators and on real ships. Maximal distribution method could be applied in at least 5 measurements that were carried out.
To verify theoretical calculations and practical applications of presented methodology, a case study was considered. Based on the set assumptions, the calculations were conducted, and experiments were performed with the help of a simulator and on real ships. Simulations were carried out using a full mission simulator, “SimFlex Navigator” (Force Technology product) [62], which allowed us to analyze similar maneuvers to real ships, considering the set forces acting on vessels crossing the channel. Experiments performed on real ships covered restricted areas with specific navigational conditions.
Then, the results are analyzed, discussions and conclusions are drawn, and directions for future research are outlined.

3.2. Mathematical Model

During the determination of ship’s possibility of passing navigational channel, the fluctuation of ship’s trajectory should be considered. This fluctuation may depend on the internal and external factors influencing ships’ maneuvering characteristics and the accuracy of ship’s position observation. Therefore, it is important to possess available information about ship’s position and its coordinates at any time of its movement through navigational channel, as well as assess the possible fluctuations of the ship’s trajectory (Figure 4).
Ship’s trajectory coordinates fluctuation ( Δ X and Δ Y ), as shown in Figure 4, can be calculated as follows (Equations (1) and (2)):
Δ X = Δ X + P · σ X ;
Δ Y = Δ Y + P · σ Y ,
where Δ X is ship’s sailing trajectory on X coordinate fluctuation; Δ Y is ship’s sailing trajectory on Y coordinate fluctuation; P is probability coefficient, in case the coefficient is equal to 1, probability is about 63–68%; in case the coefficient is equal to 2, probability is about 93–95%; in case the coefficient is equal to 3, probability is about 97–99%; σ X and σ Y are accuracies of the ship’s position observation in X and Y coordinates depending on type of ship’s position observation equipment and applied methods; this fluctuation may be between 0.05 m (using Real-Time Kinematic (RTK) system) up to 15–25 m (using ship’s or shore radar systems) [63].
The total ship’s position fluctuation on the passage may be assessed at any time on the basis of available information about ship’s position and its coordinates. This position can be calculated using Equation (3):
l = ( Δ X ) 2 + ( Δ Y ) 2 .
This measurement and the obtained values are necessary to plan the path for crossing the channel bands for ships, where the maneuvering accuracy should be estimated in detail (Figure 5).
For the purpose of the research, the passage’s main parameters were defined as passage minimum width and depth, allowing them to cross the restricted area by ships with possible maximum main parameters (length, width, draft), assuring their maneuverability. Requested passages widths and depths could be calculated or selected based on recommendations provided, for example, by Permanent International Association of Navigation Congresses (PIANC) [11], Recommendation for Design of the Maritime Configuration of Ports, Approach Channels and Harbour Basins (ROM) [12], and others.
Ship passage minimum width ( B P ), considering the parameters of biggest ships, which can sail via narrow passage, could be calculated based on mentioned recommendations [11,12], as well as may be achieved from simulators [62] or obtained from the real ships (using Marine traffic system [64] or other platforms). For the minimum ship’s passage width calculation, Equation (4) could be applied as follows [2]:
B P = L · sin β + B · cos β + L · sin Δ K + P · σ Y + b n ,
where L is length of the biggest ship; B is width of the biggest ship; β is possible maximum drift angle for the big ships (length of more than 200 m), drift angle in ports and other navigational channels on straight sections cannot be more than 5° (not in circulation); Δ K is ship’s course fluctuation, for the big ships (length of more than 200 m), and ship’s course fluctuation cannot be more than 2°–3° (wheelman’s ability to keep the ship on course in various conditions); P is probability factor for the line, which is equal to the passage central line the following factors could be taken into account: in case the probability factor is 1, probability is 62–68%; in case the probability factor is 2, probability is 95.3%; in case the probability factor is 3, probability is 99.7%. For the ship’s position (observation) in case of using at least three directions or three distances, it could use 3 σ regular and in case of probability factor 3, probability is about 97%. σ Y is accuracy of the ship’s observation position in passage, depending on ships observation methods and systems; for example, if lead line is used, ships observation position accuracy is between 3 and 10 m; b n is addition to the passage width, depending on the passage bottom conditions, navigation situation, ship’s maneuverability, and so on (could be between 0.25 and 1.5 B ).
According to PIANC recommendations, the width of the passages could be calculated using Equation (5) as follows [11]:
B P = B B M + B i + B B R + B B G ,
where B B M is ship‘s basic maneuvering line, could range from 1.3 B to 1.8 B ; B i is additional corrections to the width of the passage on straight sections, could range from 0 to 1 B depending on the permitted ship’s speed, privileged wind, current velocity and direction, wave characteristics, the aids of navigation characteristics, the depth and types of cargo; B B R and B B G are distances to shallow water on the right and left sides of the passage depending on the channel’s slopes e and ship’s speed (vary from 0.3 B to 1.0 B ).
Today, simulators are frequently used for testing the passages and approaches to channels and waterways [62]. The accuracy of the received results is influenced by the reliability of ship models and external conditions simulation. The human factor is considered in real-time simulations, and, therefore, it matters who is handling the ship in the given terms and conditions because the obtained results strongly depend on the experience of a simulator operator. Moreover, simulations must be repeated (considering wind characteristics, current speed and direction, wave characteristics, etc.) a certain number of times under the same external conditions to collect appropriate data. To receive the final results on width of the passages, approaches, and inside navigational channels provided by simulators, the maximum distribution method could be used, and its application may be expressed as follows (Equation (6)) [2]:
B P = B B M + k n · P · σ Y · R n ,
where B P is width of the approach channel; B B M is maximum width of the biggest ship or ship’s sailing band; P is factor in probabilistic maintenance (in the case of ±1, probability is 68.3%, in the case of ±2, probability is 95.3% and in the case of ±3, probability is 99.7%); k n is the coefficient depending on the number of measurements; in case the number of measurements is 3, the coefficient is equal to 0.55, in case the number of measurements is 4, the coefficient is equal to 0.47, in case the number of measurements is 5, the coefficient is equal to 0.43, in case the number of measurements is 6, the coefficient is equal to 0.395, in case the number of measurements is 7, the coefficient is equal to 0.37, in case the number of measurements is 8, the coefficient is equal to 0.351, in case the number of measurements is 9, the coefficient is equal to 0.337, in case the number of measurements is 10, the coefficient is equal to 0.329, in case the number of measurements is 11, the coefficient is equal to 0.325, in case the number of measurements is 12, the coefficient is equal to 0.322; R n is the distribution of measurement results, means the difference between minimum and maximum measurements results.
Ship navigation trajectory in passage, when it is necessary to pass safely the temporary navigational obstacles (places of construction or other works), may be defined to evaluate the navigation safety. Ship’s sailing trajectory in coordinates X 0 i and Y 0 i can be calculated applying Equations (7) and (8) as follows [63]:
X 0 i = 0 t ν i d t · cos ( 0 t ω i d t β i ) ;
Y 0 i = 0 t ν i d t · sin ( 0 t ω i d t β i ) ,
where ν i is ship’s speed module (can be taken from ship’s navigational equipment or could be calculated) m/s; ω i is turning velocity, rad/s; β i is drift angle, rad; ν i , ω i and β i can be calculated depending on the sailing conditions using methods presented in [2,63].
In case of acting current and wind drift, as well as sailing using ship propulsion system, the vessel’s trajectory coordinates could be determined as follows, applying Equations (9) and (10) [63]:
X 0 i = 0 t ν x d t + 0 t ν x s r d t + 0 t ν x d d t ,
Y 0 i = 0 t ν y d t + 0 t ν y s r d t + 0 t ν y d d t .
Equations (9) and (10), considering the way of conducting calculations presented in Equations (4) and (5), with the evaluation of the shallow water effect, could be expressed as follows (Equations (11) and (12)):
X 0 i = 0 t ν i s cos 0 t ( ω i s d t β i s ) d t + 0 t ν x s r d t + 0 t ν x d d t ,
Y 0 i = 0 t ν i s sin 0 t ( ω i s d t β i s ) d t + 0 t ν y s r d t + 0 t ν y d d t .
Accuracy of the ship’s trajectory calculated by applying Equations (7) and (8), according to methodology expressed in [2], including tug assistance for the increasing of ships’ maneuverability, could be less than 10% of the ship’s circulation diameter. Finally, ship’s sailing trajectory on the bends during maneuvering could be presented as it was shown in Figure 4.
Considering that channels are crossed by various ship types, it is rather difficult to adopt maneuvering characteristics of all ships’; therefore, it is necessary to evaluate the parameters of biggest ships when they are sailing via passages with obstacles. Therefore, according to developed methodology, the navigational conditions for the analyzed sailing area, as well as vessel’s possibilities to cross it, should be evaluated and the accuracy of ship’s position should be determined. Ship’s trajectory on the bends, in case acting of wind and current, as well as shallow water effect influence, could be calculated using Equations (11) and (12).
It should be highlighted that presented methodology for the passage parameters calculation can be applied to any navigational area.

4. Results

Navigational conditions are usually evaluated mainly considering the ship’s possibilities to predict and check the accuracy of its position. In order to test the presented methodology, the calculations were carried out for different kinds of ships crossing specific navigational areas. For example, calculations were performed for the tanker ship with parameters presented in Table 1.
In the case of acting wind and current on the maneuvering ship, the ship’s kinematic parameters and the part of the ship’s trajectory could be calculated by applying the methodology presented in Section 3. The appropriate calculation results for the selected conditions (taken as an example to present the possibility of implementing the developed methodology) are shown in Figure 6 and Figure 7.
A case study of the ship’s movement within the navigational channel during reconstruction work of the port infrastructure close to the approach to Klaipeda port was considered. The big working platform was located near the navigational channel (Figure 8). That fact impacted ships’ movement in this area. Vessels entering the port and departing from the port had to make turns about 25° with very high accuracy very close to the port gate. The main task of this case study analysis was to define the limit conditions for vessels, considering their displacement, maneuverability, and external forces influence (e.g., wind, current, etc.), needed to plan the route allowing to pass mentioned area safely.
The analysis of the sailing trajectories for ships with different displacements was carried out considering set hydro-meteorological and hydrological conditions observed in explored navigational areas. The theoretical calculations were conducted using a developed mathematical model. Then, the calculation results were compared to the data collected from the following:
  • Simulator “SimFlex Navigator” [62];
  • AIS for real ships crossing the analyzed area [64].
For the considered case study, the sailing trajectories, passage bands, and minimal distances between the platform and ship sailing bands for the different types, dimensions, and displacements of ships both entering and departing from the port were calculated. The evaluated ship lengths were from 145 m to 300 m. Analyzed ship displacement constituted from 10,000 t to 150,000 t (considering the density of the water is 1000 kg/m3). Moreover, different wind directions were considered. The southwest was the worst wind direction due to the drift occurrence and the rotation of the ship, in turn, when the ship’s superstructure was at the stern, the northwest wind direction was considered. In case the wind was blowing in the southwest and west directions, the waves broke through the port gate. The currents in many analyzed cases were directed from the port to the sea, and the velocity of the current was up to 2 knots.
The widths of the passages depending on the size of the ships (lengths) and hydro-meteorological conditions received applying developed calculation methods are presented in Figure 9, where the orange line shows the maximum possible safe widths of the passages depending on the sizes of the ships.
By analyzing ships’ passage bands calculated using the theoretical method presented in Section 3 (lines in Figure 9), and comparing it to experimental data received from real ships, it can be stated that differences between theoretical and experimental data were less than 10%. Moreover, experiments conducted on the “SimFlex Navigator” simulator by experienced operators (captain and port pilots) allowed us to achieve the values with the same accuracy (up to 10% difference compared to calculated values).
The calculated distance from the platform to ship passage bands depending on the ship’s size and hydro-meteorological conditions is presented in Figure 10, where the orange line shows the minimum distance between the platform and ship passage bands needed to be assured for safe navigation.
It should be noted that distances between platform location and ship passage bands, calculated using the developed theoretical method (lines in Figure 10) and achieved from real ships (experimental data received using AIS—designations in Figure 10), have almost similar values with differences between theoretical and experimental data less than 10%. Negative Δ B P values may mean that the risk of ships sailing in the passage band is too high, so it is necessary to provide restrictions on ships’ sailing conditions in the analyzed area.
According to the decision of the harbormaster, a minimum distance of at least 25 m must be maintained between the platform and the shipping band (horizontal line in Figure 10). However, some vessels sailed on a distance that was less than 25 m to the platform (the smallest distance was 20 m). Similar results were obtained during experiments conducted by experienced operators (captain and harbor pilots) using a calibrated “SimFlex Navigator” simulator [62]. Applying the dispersion and maximum distribution methods, the widths of the ship’s bands occupied by ships were calculated, which were up to 10% of the distance between the center line of the channel and the platform. The accuracy of the calculation results is confirmed using the analysis of the data obtained from real ships sailing in the studied area, which allowed us to state that the developed calculation method may be applied in other similar places.
The illustration of the containership MSC “Lisbon” [65] (length = 337 m, width = 45.6 m, draft = 12.1 m, container capacity 9200 TEU) sailing trajectory analysis while crossing the approach to Klaipeda port is shown in Figure 11.
In case of difficulties of sailing in such complicated conditions due to the high probability of an accident, it is necessary to take external assistance (tugs), which can increase the maneuverability of the ship. For example, in Klaipeda port, LNG standard tankers (with a capacity of about 150,000 m3) need to use four tugs with a bollard pool not less than 500 kN to avoid sailing too close to the working platform (Figure 12). Two tugs are used for increasing the ship’s maneuverability on tugging ropes, and two tugs are involved as assistance tugs.
Difficult sailing conditions may be also observed in other navigation areas. A similar study may be conducted, for example, in the Fehmarn Belt strait [66] during the construction work of underwater tunnels (Figure 13). Using the presented methodology, it would be possible to plan safe ship trajectories in this restricted area during the performance of construction work.
Fehmarn Belt Strait services different kinds of ships, including G-class container vessels, which have capacities of up to 24,000 TEU. The length of such vessels is about 400 m, width about 61 m, and draft up to 15 m [67]. Moreover, tankers and bulk ships with lengths up to 320 m (LNG Q-Flex tankers), widths up to 60 m (VLCC tankers and bulk ships), and a permitted draft up to 15 m (according to Denmark Maritime Authority regulations [68]) may pass this strait. In such complicated sailing areas, it is very important to provide preliminary investigations to determine the needed passage width. Therefore, the presented approach may be helpful to estimate this width for similarly restricted places in the world by applying the methodology presented in this article, conducting theoretical calculations, and comparing achieved data to simulation results and real ships’ sailing trajectories.

5. Discussions and Conclusions

Construction, renovation, and other similar works are carried out in many ports and other navigation areas where intensive ship traffic takes place. During these works, the width of ship passages may dramatically decrease. This fact brings a number of challenges for ship masters and pilots, as well as ports and authorities responsible for ship traffic planning. On the one hand, it is necessary to assure ships’ access to ports (both directions traffic) in a way not decreasing port attractiveness during these works’ performance. On the other hand, navigation safety in these areas must be guaranteed. Therefore, the in-advance accuracy evaluation of ships sailing trajectories and bands is required.
In this present article, the methodology was developed to determine the limited conditions for the navigation of ships passing through navigational channels or other areas, where construction or development work is carried out. Applying the presented methodology, the safe distances between ships and working objects (e.g., platforms, cranes, dredgers, etc.) as well as passage bands may be estimated. The methodology includes conducting calculations using established mathematical models, performing experiments on simulators, as well as using data received on real ships in similar conditions. Research results allowed us to extend the current knowledge in the field of methods to calculate the ship’s trajectory and passage width for safe navigation of ships along the narrow channels and ports where construction work is carried out.
The presented case study proved that the developed methodology may be applied in practice. The results achieved using theoretical calculations, experiments conducted on a simulator, and data received from real ships did not differ by more than 10%. It should be emphasized that developed methodology may be used to calculate passage bands for different ships and navigational conditions during construction work on the routes in various areas of the world.
The methodology presented in this article could be helpful in searching for rational solutions for ship trajectory planning. Nevertheless, to apply the presented methodology, a high accuracy of operated data is required since wrong or low-quality data can lead to mistakes in the calculations of ship trajectory parameters for sailing in complicated conditions. External data, which influence ships sailing in navigational channels, ports, or other complicated areas, could be received by sensors that measure hydro-meteorological and hydrological conditions, depths and their changes, and other parameters. These sensors may be located close to complicated sailing places and on ships, like RTK or other measuring equipment.
Considering the current and wind acting on the ship, as well as the shallow water effect, it is possible to plan the vessel’s sailing trajectories more precisely and influence the ship’s safety in narrow passages in view of temporary obstacles occurring in navigational channels or other areas. Conducting preparation works (e.g., calculations applying developed methodology) and in-advance determination of the passing bands and ship trajectories could allow us to decrease the probability of accidents and incidents appearing in complicated navigational conditions. It also may be helpful to set limitations for ship navigation in case navigation safety could not be guaranteed. On that basis, additional navigation safety measures may be developed and introduced, like using tugs, minimum requested bollard pools of the tugs, or other solutions. The research results may also be useful in developing safety rules and emergency procedures for ships and ports in cases when the weather conditions deteriorate over a short period of time during a ship’s passing through tight passage. Ship trajectories should be planned carefully to avoid undesirable consequences [69,70]. The improvement of navigation safety influences the reliability of maritime transport, which, in turn, affects the efficiency of transport chains performed using different transport modes.
It should be highlighted that the presented calculations were carried out under specific assumptions. These assumptions dealt with set external conditions impacting the ship’s movement inside the port and navigational channel, which were constant for the set time unit. Therefore, in order to apply the developed methodology in practice, calculations may be carried out considering possible changes in external conditions. Importantly, trajectory calculations may be carried out on ships by masters or pilots who may use current data to modify the sailing route if needed. Moreover, the presented calculation model may form the basis for the software development that could be installed on ships and facilitate the decision-making process of ships’ masters and pilots while trajectory planning to improve safe navigation during construction work in navigational channels, ports, and other areas.
It should also be noted that research results are limited to selected case study analysis. The ship’s movement within the navigational channel close to the approach to Klaipeda port during infrastructure reconstruction work was analyzed in detail. Applying the developed calculation method, it was possible to receive the dependence of passage widths on the size of the ships (lengths), as well as the dependence of distances between platform and ship passage bands on ship sizes under set hydro-meteorological conditions. These research results show the dependencies achieved for specific external conditions. Therefore, the calculations may be repeated for a selected case study but testing another set of conditions, including hydro-meteorological. Moreover, it may be reasonable to examine the possibility of applying the developed methodology in other external conditions, for example, considering ship navigation in the Fehmarn Belt strait during the construction work of an underwater tunnel.
Research results may be interesting for shipping companies, ports, and maritime authorities involved in planning and performing ships traffic in different navigational conditions. Ship masters and navigators, as well as port pilots, must be educated and trained in advance to make them familiar with local special conditions and their influence on ships sailing trajectories and passage bands. These activities are needed to prepare them better for ship traffic planning before the start of construction work in ports and navigational channels. Moreover, the results of the analysis could be also beneficial for the operators of specific equipment taking part in the construction work in the port and navigational channels (e.g., cranes, platforms, etc.).
The directions of our future research will focus on the further development of the presented methodology and conducting advanced investigations searching for ways to increase maritime transport safety and efficiency.

Author Contributions

Conceptualization, V.P.; methodology, V.P., D.P. and L.F.-D.; software, V.P.; validation, V.P., D.P. and L.F.-D.; formal analysis, V.P.; investigation, V.P.; resources, V.P. and D.P.; data curation, V.P.; writing—original draft preparation, V.P. and D.P.; writing—review and editing, L.F.-D.; visualization, D.P. and L.F.-D.; supervision, V.P.; project administration, V.P.; funding acquisition, V.P. All authors have read and agreed to the published version of the manuscript.

Funding

This research received no external funding. The APC was funded by Klaipeda University (Lithuania).

Institutional Review Board Statement

Not applicable.

Informed Consent Statement

Not applicable.

Data Availability Statement

Not applicable.

Conflicts of Interest

The authors declare no conflict of interest. The funders had no role in the design of this study; in the collection, analyses, or interpretation of data; in the writing of the manuscript; or in the decision to publish the results.

References

  1. Zalewski, P.; Montewka, J. Navigation safety assessment in an entrance channel, based on real experiments. In Proceedings of the International Congress of the International Maritime Association of the Mediterranean, Varna, Bulgaria, 2–6 September 2007; pp. 1113–1117. [Google Scholar]
  2. Paulauskas, V. Ships Entering the Ports; N.I.M.S. Publishing House: Riga, Latvia, 2013; 240p, ISBN 9984-679-71-3. [Google Scholar]
  3. Jurdziński, M. Processes of a Freely Drifting Vessel. TransNav Int. J. Mar. Navig. Saf. Sea Transp. 2020, 14, 687–693. [Google Scholar] [CrossRef]
  4. Zhang, Y.; Lin, Y. An interactive method for identifying the stay points of the trajectory of moving objects. J. Vis. Commun. Image Represent. 2019, 59, 387–392. [Google Scholar] [CrossRef]
  5. Lazarowska, A. Verification of a Deterministic Ship’s Safe Trajectory Planning Algorithm from Different Ships’ Perspectives and with Changing Strategies of Target Ships. TransNav Int. J. Mar. Navig. Saf. Sea Transp. 2021, 15, 623–628. [Google Scholar] [CrossRef]
  6. Lataire, E.; Vantorre, M. Hydrodynamic interaction between ships and restricted waterways. Int. J. Marit. Eng. 2017, 151, A77–A87. [Google Scholar] [CrossRef]
  7. Liu, H.; Chen, X.; Wang, Y.; Zhang, B.; Chen, Y.; Zhao, Y.; Zhou, F. Visualization and visual analysis of vessel trajectory data: A survey. Vis. Inform. 2021, 5, 1–10. [Google Scholar] [CrossRef]
  8. Lee, C.-K.; Moon, S.-B.; Jeong, T.-G. The investigation of ship maneuvering with hydrodynamic effects between ships in curved narrow channel. Int. J. Nav. Archit. Ocean Eng. 2016, 8, 102–109. [Google Scholar] [CrossRef] [Green Version]
  9. Wang, Z.; Zou, Z.; Soares, C.G. Identification of ship maneuvering motion based on support vector machine. Ocean Eng. 2019, 183, 270–281. [Google Scholar] [CrossRef]
  10. Available online: https://portofklaipeda.lt/en/main-page/ (accessed on 10 December 2022).
  11. PIANC. Harbour Approach Channels and Design Guidelines—Report No. 121-2014, s.l.: The World Association for Waterborne Transport Infrastructure. 2014. Available online: http://marineman.ir/wp-content/uploads/2015/04/NAVIGATION-PIANC-Harbour-Approach-Channels-Design-Guidelines-2014.pdf (accessed on 5 December 2022).
  12. Puertos del Estado. ROM 3.1-99: Recommendation for Design of the Maritime Configuration of Ports, Approach Channels and Harbour Basins; Puertos del Estado [Ports of the State]: Madrid, Spain, 1999; 382p. [Google Scholar]
  13. Erol, S.; Demir, M.; Çetişli, B.; Eyüboğlu, E. Analysis of Ship Accidents in the Istanbul Strait Using Neuro-Fuzzy and Genetically Optimized Fuzzy Classifiers. J. Navig. 2018, 71, 419–436. [Google Scholar] [CrossRef]
  14. Rojek, B.; Wawruch, R. Traffic Separation Schemes and Mandatory Ship Reporting System in the Baltic for the approaches to the Polish ports in the Gulf of Gdansk. TransNav Int. J. Mar. Navig. Saf. Sea Transp. 2007, 1, 387–391. [Google Scholar]
  15. Wawruch, R. Ships’ Routes to Polish Ports of the Gulf of Gdańsk. TransNav Int. J. Mar. Navig. Saf. Sea Transp. 2021, 15, 583–590. [Google Scholar] [CrossRef]
  16. Eleftheria, E.; Apostolos, P.; Markos, V. Statistical analysis of ship accidents and review of safety level. Saf. Sci. 2016, 85, 282–292. [Google Scholar] [CrossRef]
  17. Bojić, F.; Bošnjak, R.; Lušić, Z.; Gudelj, A. Methodology for the Development of Parameters for the Navigational Safety Risk Assessment Model in Port Approaches. TransNav Int. J. Mar. Navig. Saf. Sea Transp. 2021, 15, 365–370. [Google Scholar] [CrossRef]
  18. Bellsolà Olba, X.; Daamen, W.; Vellinga, T.; Hoogendoorn, S.P. Risk Assessment Methodology for Vessel Traffic in Ports by Defining the Nautical Port Risk Index. J. Mar. Sci. Eng. 2020, 8, 10. [Google Scholar] [CrossRef] [Green Version]
  19. Paulauskas, V.; Filina-Dawidowicz, L.; Paulauskas, D. Ships speed limitations for reliable maintenance of the quay walls of navigation channels in ports. Eksploat. I Niezawodn. Maint. Reliab. 2020, 22, 306–315. [Google Scholar] [CrossRef]
  20. Mou, J.M.; Chen, P.F.; He, Y.X.; Yip, T.L.; Li, W.H.; Tang, J.; Zhang, H.Z. Vessel traffic safety in busy waterways: A case study of accidents in western Shenzhen port. Accid. Anal. Prev. 2019, 123, 461–468. [Google Scholar] [CrossRef]
  21. Huang, Y.; van Gelder, P.H.A.J.M.; Wen, Y. Velocity obstacle algorithms for collision prevention at sea. Ocean Eng. 2018, 151, 308–321. [Google Scholar] [CrossRef]
  22. Mrozowska, A.; Mrozowski, P. How to Improve Safety on the Offshore Installations. TransNav Int. J. Mar. Navig. Saf. Sea Transp. 2019, 13, 291–296. [Google Scholar] [CrossRef]
  23. Biehl, F.; Lehmann, E. Collisions of Ships with Offshore Wind Turbines: Calculation and Risk Evaluation. In Offshore Wind Energy; Köller, J., Köppel, J., Peters, W., Eds.; Springer: Berlin/Heidelberg, Germany, 2006; pp. 281–304. [Google Scholar] [CrossRef]
  24. Ankerst, M.; Breunig, M.M.; Kriegel, H.-P.; Sander, J. OPTICS: Ordering points to identify the clustering structure. ACM Sigmod Rec. 1999, 28, 49–60. [Google Scholar] [CrossRef]
  25. Lei, J.; Chu, X.; He, W. Trajectory Data Restoring: A Way of Visual Analysis of Vessel Identity Base on OPTICS. J. Web Eng. 2021, 20, 413–430. [Google Scholar] [CrossRef]
  26. Willems, N.; Scheepens, R.; van de Wetering, H.; van Wijk, J.J. Visualization of Vessel Traffic. In Situation Awareness with Systems of Systems; van de Laar, P., Tretmans, J., Eds.; Springer: New York, NY, USA, 2013; pp. 73–87. [Google Scholar] [CrossRef] [Green Version]
  27. Scheepens, R.; Willems, N.; van de Wetering, H.; Van Wijk, J.J. Interactive visualization of multivariate trajectory data with density maps. In Proceedings of the 2011 IEEE Pacific Visualization Symposium, Hong Kong, China, 1–4 March 2011; pp. 147–154. [Google Scholar] [CrossRef] [Green Version]
  28. Willems, N.; van de Wetering, H.; van Wijk, J.J. Visualization of vessel movements. Comput. Graph. Forum 2009, 28, 959–966. [Google Scholar] [CrossRef]
  29. Wang, G.; Malik, A.; Yau, C.; Surakitbanharn, C.; Ebert, D.S. TraSeer: A visual analytics tool for vessel movements in the coastal areas. In Proceedings of the 2017 IEEE International Symposium on Technologies for Homeland Security (HST), Waltham, MA, USA, 25–26 April 2017; pp. 1–6. [Google Scholar] [CrossRef]
  30. Jin, L.; Luo, Z.; Gao, S. Visual Analytics Approach to Vessel Behaviour Analysis. J. Navig. 2018, 71, 1195–1209. [Google Scholar] [CrossRef]
  31. He, W.; Lei, J.; Chu, X.; Xie, S.; Zhong, C.; Li, Z. A Visual Analysis Approach to Understand and Explore Quality Problems of AIS Data. J. Mar. Sci. Eng. 2021, 9, 198. [Google Scholar] [CrossRef]
  32. Öztürk, Ü.; Boz, H.A.; Balcisoy, S. Visual analytic based ship collision probability modeling for ship navigation safety. Expert Syst. Appl. 2021, 175, 114755. [Google Scholar] [CrossRef]
  33. Huang, Y.; Li, Y.; Zhang, Z.; Liu, R.W. GPU-accelerated compression and visualization of large-scale vessel trajectories in maritime IoT industries. IEEE Internet Things J. 2020, 7, 10794–10812. [Google Scholar] [CrossRef]
  34. Chun-Ki, L.; Sam-Goo, L. Investigation of ship maneuvering with hydrodynamic effects between ship and bank. J. Mech. Sci. Technol. 2008, 22, 1230–1236. [Google Scholar] [CrossRef]
  35. Wnęk, A.D.; Sutulo, S.; Soares, G.C. CFD analysis of ship-to-ship hydrodynamic interaction. J. Mar. Sci. Appl. 2018, 17, 21–37. [Google Scholar] [CrossRef]
  36. Chen, G.-R.; Fang, M.-C. Hydrodynamic interactions between two ships advancing in waves. Ocean Eng. 2001, 28, 1053–1078. [Google Scholar] [CrossRef]
  37. Yuan, Z.-M.; Incecik, A.; Dai, S.; Alexander, D.; Ji, C.-Y.; Zhang, X. Hydrodynamic interaction between two ships travelling or stationary in shallow waters. Ocean Eng. 2015, 108, 620–635. [Google Scholar] [CrossRef] [Green Version]
  38. Liu, Z.; Wu, Z.; Zheng, Z. A novel framework for regional collision risk identification based on AIS data. Appl. Ocean Res. 2019, 89, 261–272. [Google Scholar] [CrossRef]
  39. Aalberg, A.L.; Bye, R.J.; Ellevseth, P.R. Risk factors and navigation accidents: A historical analysis comparing accident-free and accident-prone vessels using indicators from AIS data and vessel databases. Marit. Transp. Res. 2022, 3, 100062. [Google Scholar] [CrossRef]
  40. Yang, D.; Wu, L.; Wang, S.; Jia, H.; Li, K.X. How big data enriches maritime research—A critical review of Automatic Identification System (AIS) data applications. Transp. Rev. 2019, 39, 755–773. [Google Scholar] [CrossRef]
  41. Svanberg, M.; Santén, V.; Hörteborn, A.; Holm, H.; Finnsgard, C. AIS in maritime research. Mar. Policy 2019, 106, 103520. [Google Scholar] [CrossRef]
  42. Tu, E.; Zhang, G.; Rachmawati, L.; Rajabally, E.; Huang, G.-B. Exploiting AIS data for intelligent maritime navigation: A comprehensive survey from data to methodology. IEEE Trans. Intell. Transp. Syst. 2017, 19, 1559–1582. [Google Scholar] [CrossRef]
  43. Le Tixerant, M.; Le Guyader, D.; Gourmelon, F.; Queffelec, B. How can Automatic Identification System (AIS) data be used for maritime spatial planning? Ocean Coast. Manag. 2018, 166, 18–30. [Google Scholar] [CrossRef] [Green Version]
  44. Wang, L.; Li, Y.; Wan, Z.; Yang, Z.; Wang, T.; Guan, K.; Fu, L. Use of AIS data for performance evaluation of ship traffic with speed control. Ocean Eng. 2020, 204, 107259. [Google Scholar] [CrossRef]
  45. Yan, Z.; Xiao, Y.; Cheng, L.; He, R.; Ruan, X.; Zhou, X.; Li, M.; Bin, R. Exploring AIS data for intelligent maritime routes extraction. Appl. Ocean Res. 2020, 101, 102271. [Google Scholar] [CrossRef]
  46. Pallotta, G.; Vespe, M.; Bryan, K. Vessel pattern knowledge discovery from AIS data: A framework for anomaly detection and route prediction. Entropy 2013, 15, 2218–2245. [Google Scholar] [CrossRef] [Green Version]
  47. Wu, L.; Xu, Y.; Wang, Q.; Wang, F.; Xu, Z. Mapping global shipping density from AIS data. J. Navig. 2017, 70, 67–81. [Google Scholar] [CrossRef]
  48. Chen, Z.; Xue, J.; Wu, C.; Qin, L.; Liu, L.; Cheng, X. Classification of vessel motion pattern in inland waterways based on Automatic Identification System. Ocean Eng. 2018, 161, 69–76. [Google Scholar] [CrossRef]
  49. Huang, Y.; Chen, L.; Chen, P.; Negenborn, R.R.; van Gelder, P.H.A.J.M. Ship collision avoidance methods: State-of-the-art. Saf. Sci. 2020, 121, 451–473. [Google Scholar] [CrossRef]
  50. Mironiuk, W. Model-based investigations on dynamic ship heels in relation to maritime transport safety. Arch. Transp. 2015, 33, 69–80. [Google Scholar] [CrossRef]
  51. Liu, C.; Liu, J.; Zhou, X.; Zhao, Z.; Wan, C.; Liu, Z. AIS data-driven approach to estimate navigable capacity of busy waterways focusing on ships entering and leaving port. Ocean Eng. 2020, 218, 108215. [Google Scholar] [CrossRef]
  52. Zou, Y.; Chen, Y.; He, J.; Pang, G.; Zhang, K. 4D Time Density of Trajectories: Discovering Spatiotemporal Patterns in Movement Data. ISPRS Int. J. Geo-Inform. 2018, 7, 212. [Google Scholar] [CrossRef] [Green Version]
  53. Zhao, L.; Shi, G. Maritime anomaly detection using density-based clustering and recurrent neural network. J. Navig. 2019, 72, 894–916. [Google Scholar] [CrossRef]
  54. Storm-Furru, S.; Bruckner, S. VATRAC: Geospatial Trajectory Analysis for Monitoring, Identification, and Verification in Fishing Vessel Operations. Comput. Graph. Forum 2020, 39, 101–114. [Google Scholar] [CrossRef]
  55. Chen, X.; Liu, Y.; Achuthan, K.; Zhang, X. A ship movement classification based on Automatic Identification System (AIS) data using Convolutional Neural Network. Ocean Eng. 2020, 218, 108182. [Google Scholar] [CrossRef]
  56. Zheng, Y. Trajectory data mining: An overview. ACM Trans. Intell. Syst. Technol. 2015, 6, 2743025. [Google Scholar] [CrossRef]
  57. Li, Y.; Chen, H.; Wang, L.; Xiao, Q. Stay point identification based on density. Big Data Res. 2018, 4, 80–93. [Google Scholar] [CrossRef]
  58. Salvador, S.; Chan, P. Toward accurate dynamic time warping in linear time and space. Intell. Data Anal. 2007, 11, 561–580. [Google Scholar] [CrossRef]
  59. Harati-Mokhtari, A.; Wall, A.; Brooks, P.; Wang, J. Automatic Identification System (AIS): Data reliability and human error implications. J. Navig. 2007, 60, 373–389. [Google Scholar] [CrossRef]
  60. Chauvin, C.; Lardjane, S.; Morel, G.; Clostermann, J.P.; Langard, B. Human and organizational factors in maritime accidents: Analysis of collisions at sea using the HFACS. Accid. Anal. Prev. 2013, 59, 26–37. [Google Scholar] [CrossRef] [PubMed]
  61. Filina-Dawidowicz, L.; Możdrzeń, D.; Rosochacki, W. Assessment of the Impact of Seafarers’ Professional Experience on the Perception of Risk Factors from the Perspective of Polish Container Ships Crews Members. Period. Polytech. Transp. Eng. 2021, 49, 416–425. [Google Scholar] [CrossRef]
  62. “SimFlex Navigator” Simulator, Force Technology, Denmark, License No. 159.
  63. Paulauskas, V.; Filina-Dawidowicz, L.; Paulauskas, D. Navigation of Ships in Channel Bends under Special Conditions Using Sensors Systems. Sensors 2022, 22, 8783. [Google Scholar] [CrossRef]
  64. AIS. Available online: https://www.marinetraffic.com/en/ais/home/centerx:21.146/centery:55.656/zoom:15 (accessed on 10 December 2022).
  65. Available online: https://www.vesselfinder.com/vessels/details/9304459 (accessed on 10 June 2023).
  66. Fehmarn Belt Tunnel. Available online: https://femern.com/the-tunnel/fehmarnbelt-tunnel/ (accessed on 10 December 2022).
  67. Available online: https://www.marineinsight.com/know-more/top-10-worlds-largest-container-ships-in-2019/ (accessed on 15 July 2023).
  68. Available online: https://dma.dk/growth-and-framework-conditions/rules-and-legislation (accessed on 10 June 2023).
  69. Lazarowska, A. A Discrete Planning Approach in Collision Avoidance for Smart Ships. Procedia Comput. Sci. 2020, 176, 380–389. [Google Scholar] [CrossRef]
  70. Karbowska-Chilinska, J.; Koszelew, J.; Ostrowski, K.; Kuczynski, P.; Kulbiej, E.; Wolejsza, P. Beam Search Algorithm for Ship Anti-Collision Trajectory Planning. Sensors 2019, 19, 5338. [Google Scholar] [CrossRef] [Green Version]
Figure 1. Klaipeda port gates renovation process [10].
Applsci 13 08593 g001
Figure 2. Construction work carried out close to navigational channel in Klaipeda port [own picture].
Applsci 13 08593 g002
Figure 3. The steps of research methodology [own elaboration].
Applsci 13 08593 g003
Figure 4. Possible ship’s position during maneuvering [own elaboration], where l is the total distance between calculated trajectory and possible fluctuation from ship’s sailing trajectory (line).
Applsci 13 08593 g004
Figure 5. Ship’s (length = 350 m) sailing trajectory band at the entrance to the Klaipeda port during renovation works close to the quay wall No. 1 (blue square depicts lifting platform, shown in Figure 2; red color depicts the ship; green color depicts ship’s sailing trajectory) [own elaboration based on [62]].
Applsci 13 08593 g005
Figure 6. Kinematic parameters of ship motion during circulation with current perpendicular to the port side at the beginning of the circulation ( ν s r = 2.0 knots) and wind perpendicular to the port side at the beginning of the circulation ( ν a = 15 m/s) [own elaboration based on [62]].
Applsci 13 08593 g006
Figure 7. The part of trajectory of ship’s passage in the presence of current and wind to the starboard side (considering the kinematic parameters of the ship, motion, and current presented in Figure 6) (as an example) [own elaboration based on [62]].
Applsci 13 08593 g007
Figure 8. Ship sailing near working platform located close to navigational channel within approach to Klaipeda port (blue square depicts lifting platform, shown in Figure 2; arrow depicts the distance from platform to the passing ship) [own elaboration based [62]].
Applsci 13 08593 g008
Figure 9. The widths of the passages depending on the sizes of the ships (lengths) and hydro-meteorological conditions [own elaboration], where lines are data achieved from conducted calculations, and designations are data from real ships’ passages received via AIS [own elaboration based [62,64]].
Applsci 13 08593 g009
Figure 10. Distances between platform and ships passage bands ( Δ B P ) depending on ships sizes and hydro-meteorological conditions [own elaboration], where lines are data achieved from conducted calculations, and designations are data from real ships passages received via AIS and simulator [62,64].
Applsci 13 08593 g010
Figure 11. MSC “Lisbon” sailing close to working platform in Klaipeda port (blue square depicts lifting platform, as shown in Figure 2) [own elaboration based on [64]].
Applsci 13 08593 g011
Figure 12. Ship’s entering port using two tugs for increasing maneuverability (blue square depicts lifting platform, as shown in Figure 2) [62].
Applsci 13 08593 g012
Figure 13. Tunnel construction place under Fehmarn Belt strait and planned ships’ sailing directions (yellow square depicts working platform; red square depicts technological area restricted for ships; red dots depicts navigational obstacles; blue arrow depicts passing ship route; red arrow depicts the direction of traffic of ships that participate in construction work; black arrow depicts direction of ferry traffic; green arrow depicts the distance between the platforms; yellow arrow depicts the distance between the passing ship route and the shallow waters (navigational obstacles)) [66].
Applsci 13 08593 g013
Table 1. Parameters of tanker ship used in calculations [62].
ParameterValue
Length [m]185
Width [m]27.5
Bow draft [m]5.0
Astern draft [m]7.0
Displacement [m3]20,780
Ruder angle starboard [°]35
Initial speed [knots]14.0
Disclaimer/Publisher’s Note: The statements, opinions and data contained in all publications are solely those of the individual author(s) and contributor(s) and not of MDPI and/or the editor(s). MDPI and/or the editor(s) disclaim responsibility for any injury to people or property resulting from any ideas, methods, instructions or products referred to in the content.

