Article

Dynamic Responses of a Coupled Tunnel with Large Span and Small Clear Distance under Blasting Load of the Construction of Transverse Passage

1
China Railway No. 7 Engineering Group Co., Ltd. (Guangzhou Engineering Company), Guangzhou 510700, China
2
School of Aeronautics Astronautics, Shenzhen Campus of Sun Yat-sen University, No. 66 Gongchang Road, Guangming District, Shenzhen 518107, China
3
School of Civil Engineering, Sun Yat-sen University, Zhuhai 519000, China
*
Authors to whom correspondence should be addressed.
Appl. Sci. 2023, 13(15), 8599; https://doi.org/10.3390/app13158599
Submission received: 26 May 2023 / Revised: 11 July 2023 / Accepted: 14 July 2023 / Published: 26 July 2023
(This article belongs to the Special Issue Advances in Sustainable Geotechnical Engineering)

Abstract

:
In order to investigate the law of the dynamic responses of a coupled tunnel with a large span and a small clear distance induced by the blasting load applied on the excavation face of the new horizontal adit for vehicles, a dynamic 3D finite element model was established based on the blasting excavation project of Yonghe tunnel’s new transverse passage in Guangzhou, China. The laws of the induced vibration velocity and dynamic stress of the existing tunnel are systematically analyzed according to the numerical calculation results. The results show that the main affected area of the existing lining is the lower arch waist facing the blast, where both the maximum vibration velocity and the maximum tensile stress appear. The horizontally radial vibration velocity (along the axis of the transverse passage) is the main contributor in the resulting vibration velocity of the lining. The distributed law and varying trend of the dynamic stress of the lining are similar to the vibration velocity, and there appears to be a satisfied positive linear correlation between the two indexes. When the distance from the excavation face of the horizontal adit to the existing tunnel is 10 m, the blasting-load-induced maximal vibration velocity and dynamic tensile stress of the tunnel are only 2.96 cm/s and 0.20 MPa, respectively, which are far less than that stipulated by the related technical code. A negative power exponential relationship between the peak vibration velocity of the existing tunnel lining and the distance from the excavation face of the transverse passage to the tunnel was also found. According to this relationship, the induced vibration velocity will exceed the threshold stipulated by the standard, i.e., 8 cm/s, if the distance decreases to 5.9 m. To improve the safety redundancy of the construction, the threshold of the distance from the excavation face of the horizontal adit to the existing tunnel is suggested to be 10 m under the current construction scheme.

1. Introduction

As urbanization continues to accelerate, the existing transportation infrastructure has become inadequate in keeping up with the growing demands of society’s activities. To increase the efficiency of transportation, it is essential to rebuild and upgrade obsolete engineering projects. In recent years, there has been a significant increase in upgrading engineering projects, with tunnel upgrades posing a particularly difficult and challenging task [1]. Since tunnels are typically buried underground, the reconstruction process can have a profound impact on the mechanical responses of the existing tunnels. As a result, tunnels are often viewed as crucial engineering projects that can significantly impact the overall investment and construction timeline of upgrading projects. To enhance the transportation capacity of tunnels, a common approach is to construct a new tunnel adjacent to the existing ones [2]. Depending on the circumstances, the newly constructed tunnel may be located close to the existing one. The use of mining methods to construct a new tunnel can result in cracking and damage to the existing tunnels. Inappropriate blasting parameters can pose a severe risk to the stability and safety of the existing tunnel [3]. The drilling and blasting process, with its release of thermal and explosive energy, poses a significant risk of causing structural damage, particularly due to the elevated heat and compression loads, as demonstrated by Laurence’s team [4] in their research on the increased structural response of columns. In long tunnels, cross passages must be constructed to enable emergency access in the event of fires or traffic accidents [5]. When upgrading tunnels, the mining method used for constructing cross passages can impact the mechanical state of the surrounding rocks, which may result in damage to the existing tunnel lining structures. To address these issues, it is critical to conduct research on the dynamic responses of existing tunnels when a new adjacent tunnel is being constructed, as well as to develop strategies to minimize the impact of blasting loads on the safety of the existing tunnels [6].
Researchers have extensively studied the dynamic response of twin tunnels under blast loads. Qian Yaofeng and Wang Xinghua [7] conducted a numerical simulation to analyze the impact of blasting loads from a newly constructed tunnel on an existing tunnel, considering four of the most unfavorable conditions. In their research, the Javier team [8] introduced a novel finite element model for accurately predicting ground vibrations that result from blasting activities. They outlined a comprehensive methodology that incorporates the element of randomness. Song et al. [9] examined the dynamic effects of blasting loads on adjacent tunnels by utilizing an equivalent blasting load model that considered the millisecond delay effect. Xu et al. [10] systematically studied the influence of blasting excavation on the traversing chamber and surrounding rocks by performing both blasting tests and numerical simulations on the powerhouse. Drilling and blasting methods are widely used in the construction of large-scale underground caverns. The powerful energy generated during explosions significantly affects the safety and stability of the excavated cavern complex within a specific radius of the blast source [11]. Dengke Wang et al. [12] utilized the superposition principle and stress wave attenuation theory to develop a model for determining the equivalent load of blasting in large underground chambers. M. G. Abuov [13] investigated the instantaneous failure process that occurs during rock mass blasting operations. The study specifically analyzed the stress state changes in the rock mass during this process. The findings revealed that the rapid release of stress in the rock mass, caused by blasting excavation on the tunnel face, can induce significant dynamic effects. Additionally, J. P. Carter and his team [14] calculated that during the instantaneous excavation of a long tunnel, the transient unloading of initial stress in the rock mass leads to the occurrence of dynamic tensile stress in the surrounding rocks. The magnitude of this stress is closely related to the unloading rate. The investigation of this issue entails a host of complex engineering challenges. Current research has primarily emphasized the numerical modeling and analysis of a specific issue. Obtaining an effective blasting load is critical in the numerical analysis of the dynamic response of an adjacent tunnel. There are two main strategies. In the numerical analysis of adjacent tunnels, converting the impact load into a pulse that is applied to the tunnel excavation faces is a typical approach for obtaining an effective blasting load [15,16,17]. The research conducted by the Shyi GenChen team [18] demonstrated the importance of incorporating dynamic parameters in rock mass modeling for an accurate prediction of response under the explosion. By correcting the triangular pulse load and employing a mixed format of AUTODYN and UDEC, the team achieved prediction results that closely aligned with the on-site test results. This highlights the significance of including dynamic parameters to ensure the reliability of prediction outcomes. To obtain an effective blasting load for the numerical analysis of adjacent tunnels, another approach is to directly simulate the complete process of the blasting construction [6,19,20]. In their study, Chunfeng Zhang et al. [20] utilized LS-DYNA finite element software to simulate the complete blasting process. A systematic analysis and study were conducted on the safety and stability of an underground cavern group under dynamic loads. While simulating the entire blasting process yields a high simulation accuracy, for more efficient engineering analysis, utilizing an equivalent impact load calculation is favorable and effective. This approach is supported by previous research [21].
As mentioned above, abundant research has been carried out to explore the influence of the blasting load on existing tunnel structures. However, these existing studies mainly focus on the scenarios where the blasting load is applied to the outline of the new tunnels. In this scenario, the existing tunnel is parallel to the new tunnel. A scenario where the excavation face that acts on the blasting load is perpendicular to the new tunnel is seldom investigated. In light of this, the latter scenario is particularly investigated in this work, where the blasting construction of a horizontal adit for vehicles towards the existing Yonghe tunnel, located on the Huangpu Open Avenue in Guangzhou, is referenced as a background project. Based on the equivalent blasting load model, a 3D numerical model was established to analyze the dynamic responses of the existing tunnel lining when a perpendicular horizontal adit is constructed using the blasting method. Additionally, the threshold value of the distance from the excavation face of the horizontal adit to the existing tunnel is proposed to guarantee the safety of the existing tunnel based on the numerical analysis results.

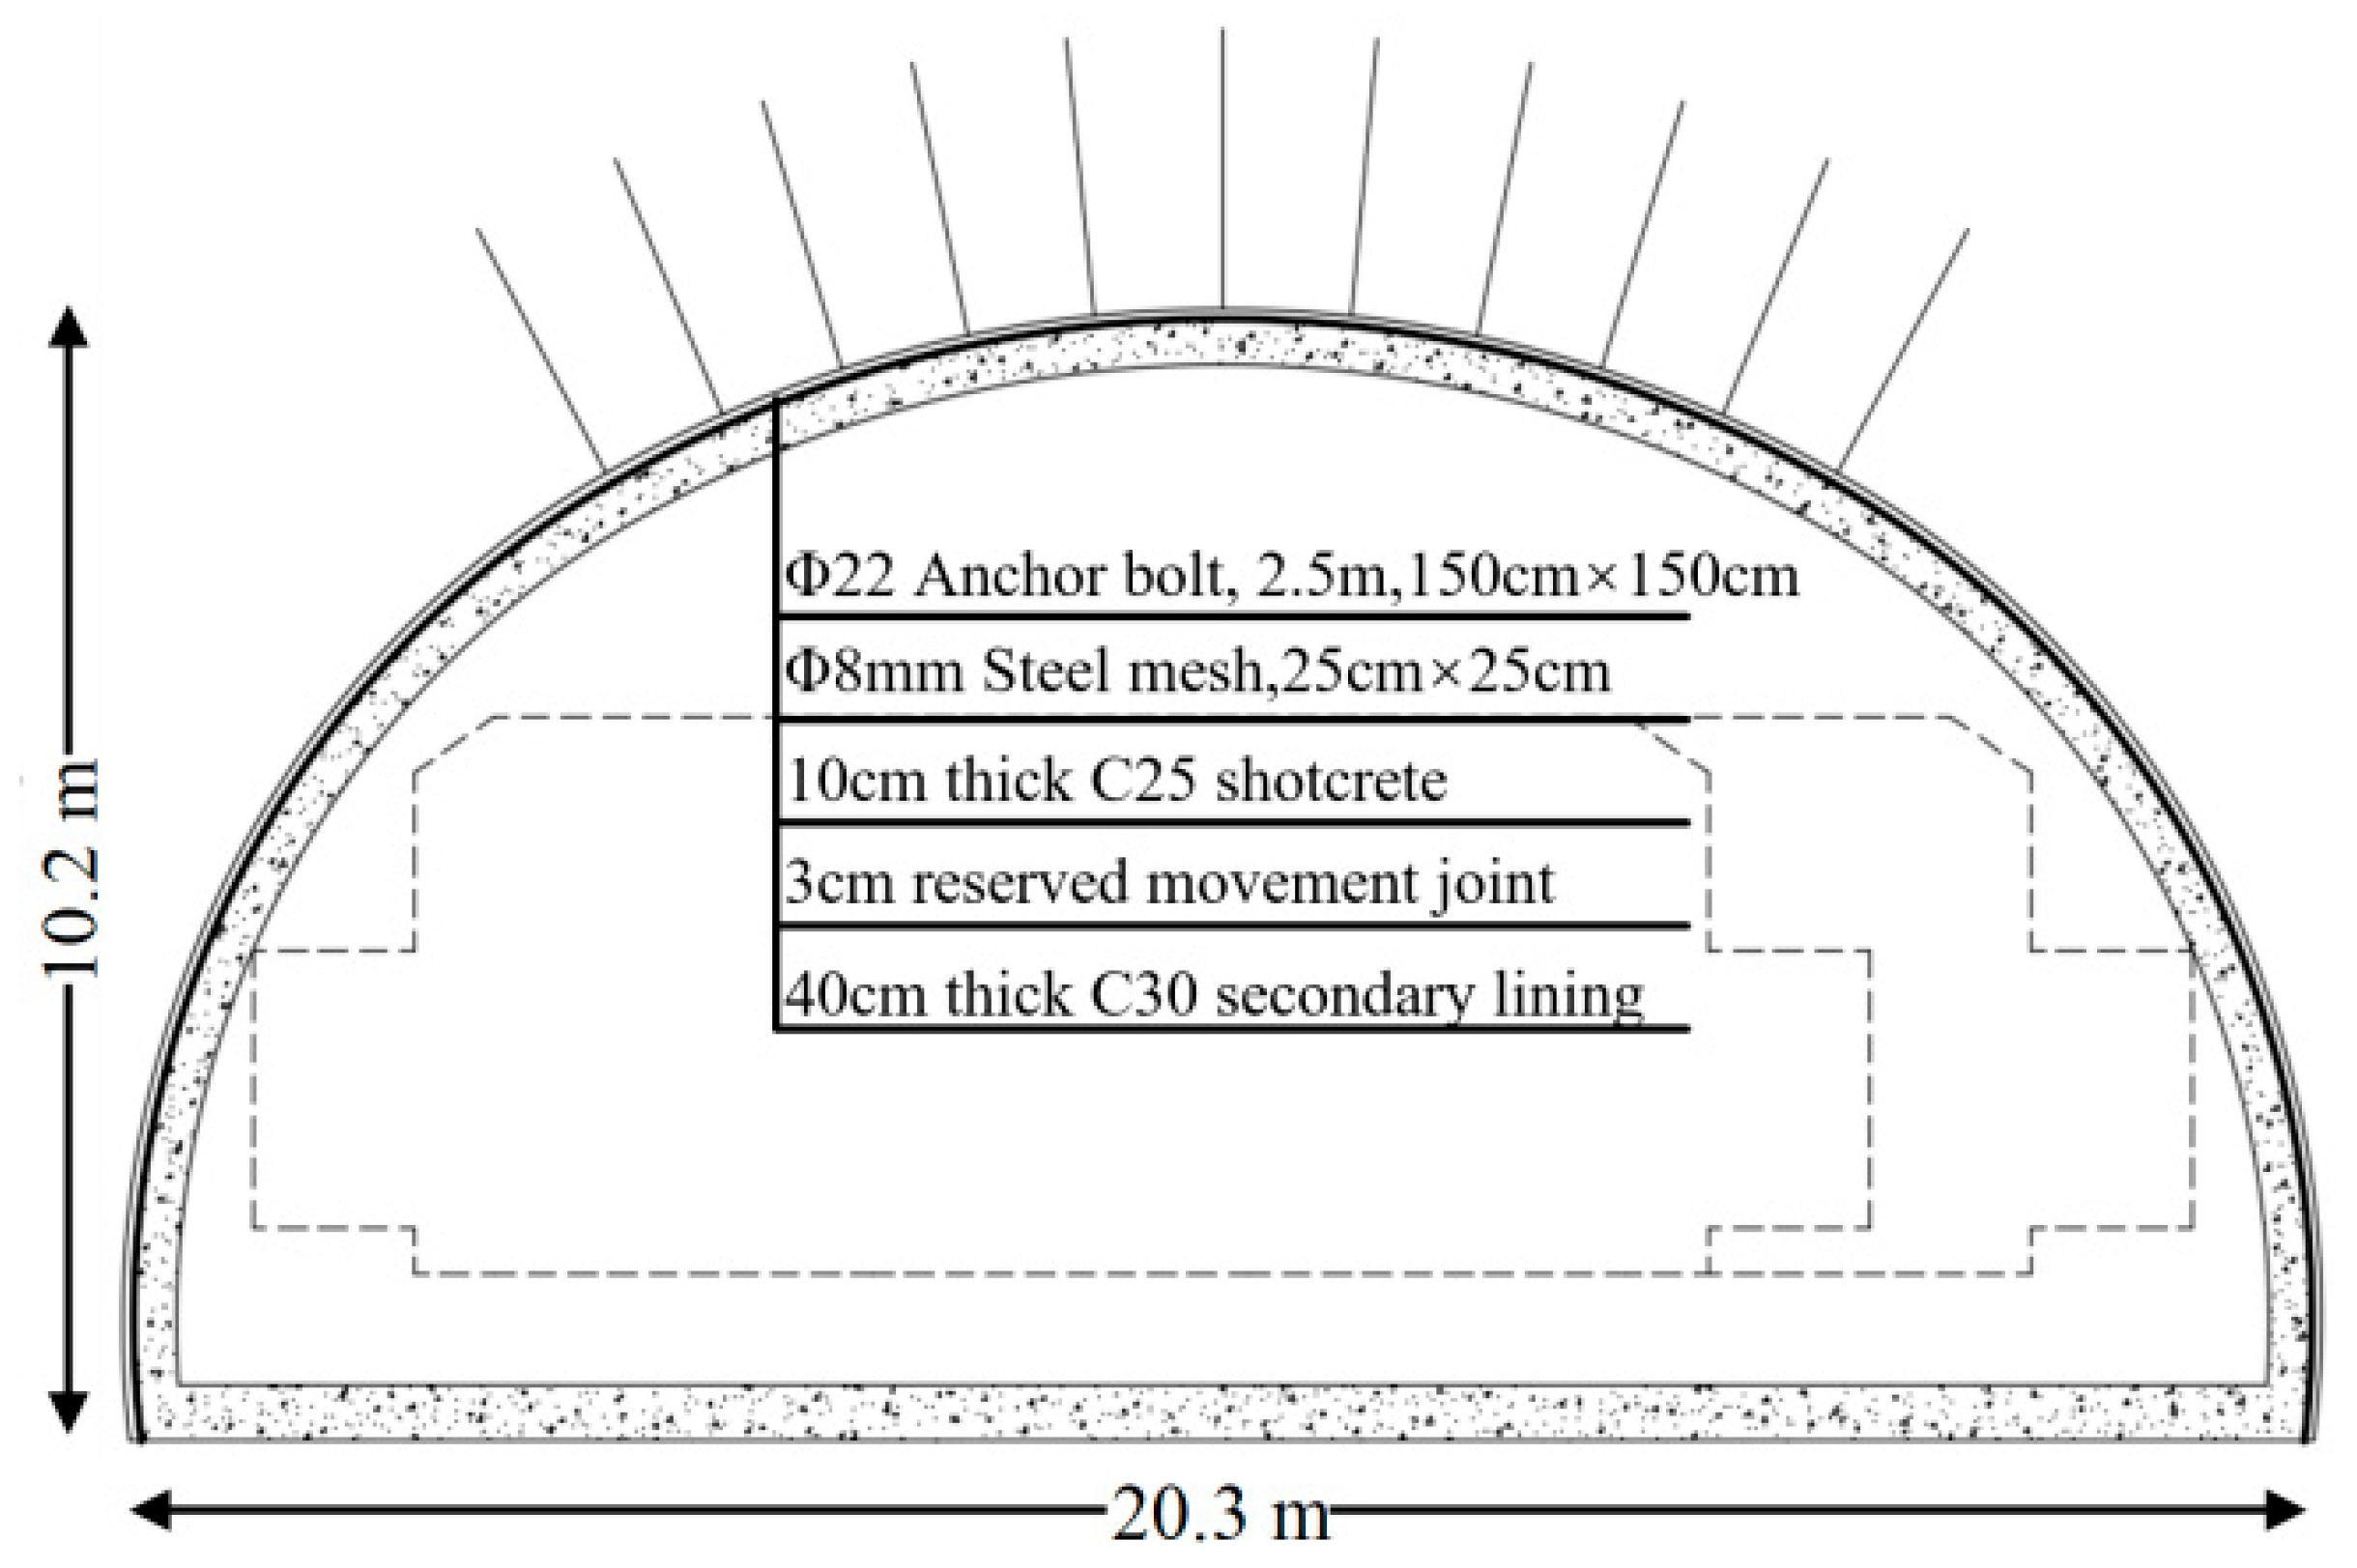
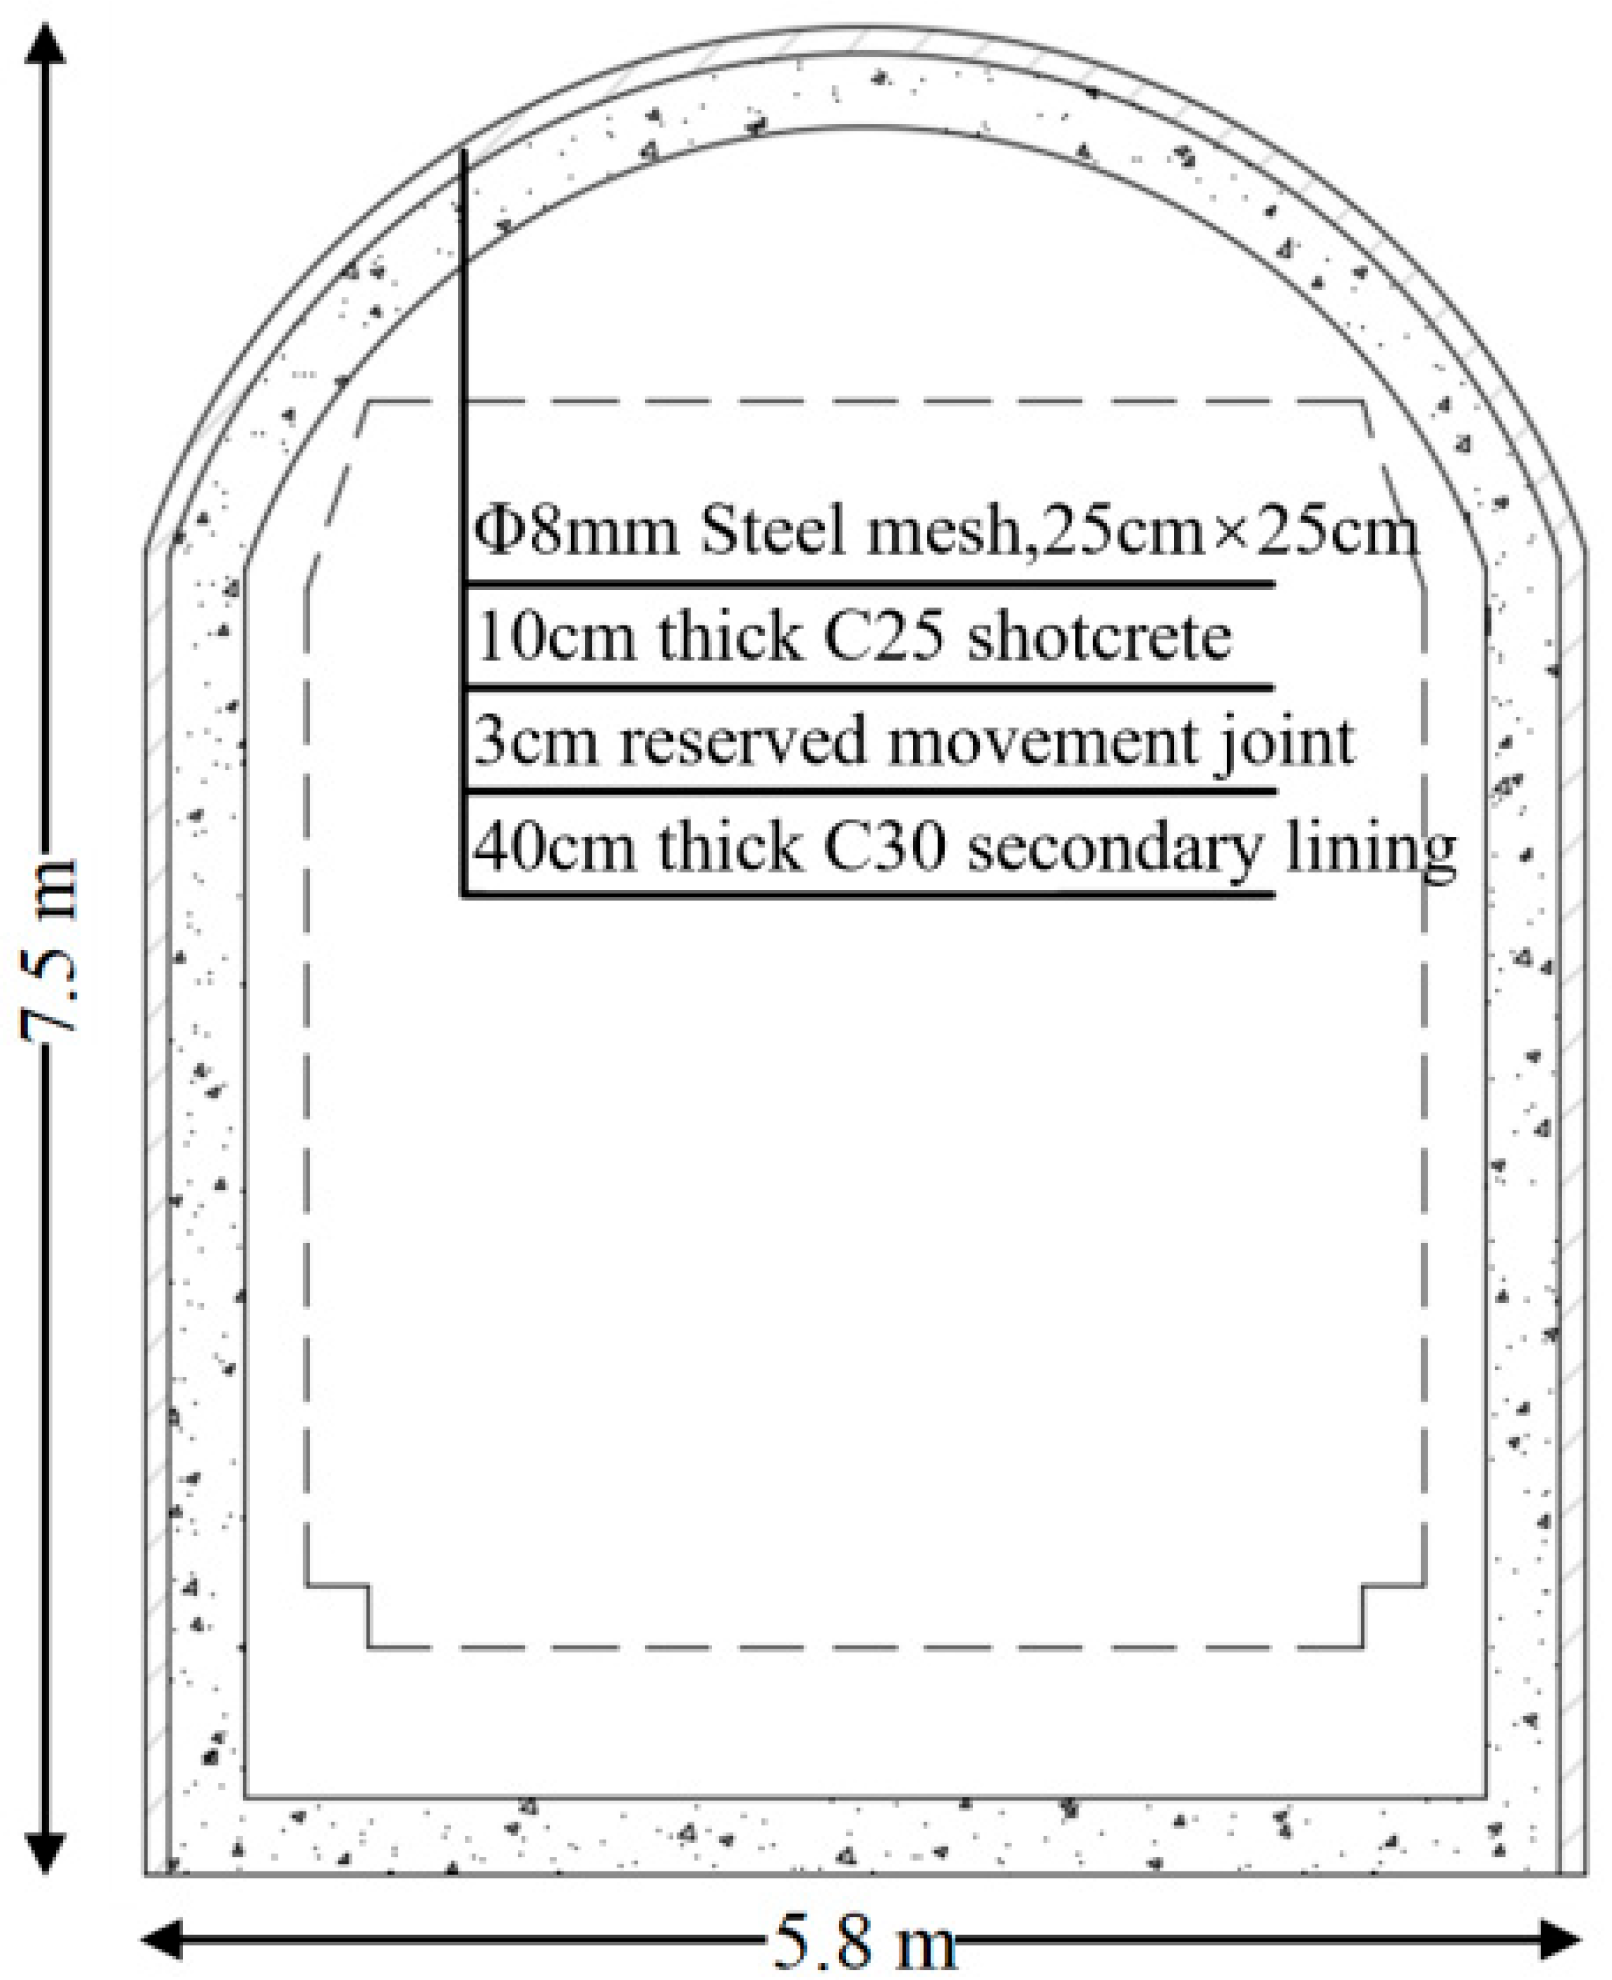
2. Overview of the Project

The North Construction Project aims to connect several existing roads by establishing a transverse passage. The current Yonghe tunnel node is a two-way, five-lane tunnel, while the new Yonghe tunnel is located on the east side of the current tunnel and is a one-way, three-lane tunnel. The maximum speed limit for the lane is 60 km/h. Figure 1 illustrates the spatial position relationship between the existing Yonghe tunnel and the new Yonghe tunnel.
The total length of the new Yonghe tunnel is 1170 m, comprising a 30 m open-cut section. The length distribution for each level of the surrounding rocks is as follows: 297 m for surrounding rock II, 307 m for surrounding rock III, 221 m for surrounding rock IV, and 315 m for surrounding rock V. The maximum depth of the tunnel below the surface is approximately 182.85 m, and the minimum clearance distance from the existing left line is approximately 39.02 m. The maximum excavation width and height of the main tunnel are approximately 17.6 m and 12 m, respectively. The excavation width and height of the vehicle-running cross passage are approximately 5.8 m and 7.5 m, while the widened section has an excavation width and height of approximately 20.3 m and 10.2 m. This section of the cross tunnel has a complete surrounding of rock type II. Both the main and branch tunnels have a composite lining, and the construction sections are shown in Figure 2 and Figure 3.

3. Numerical Computing Model

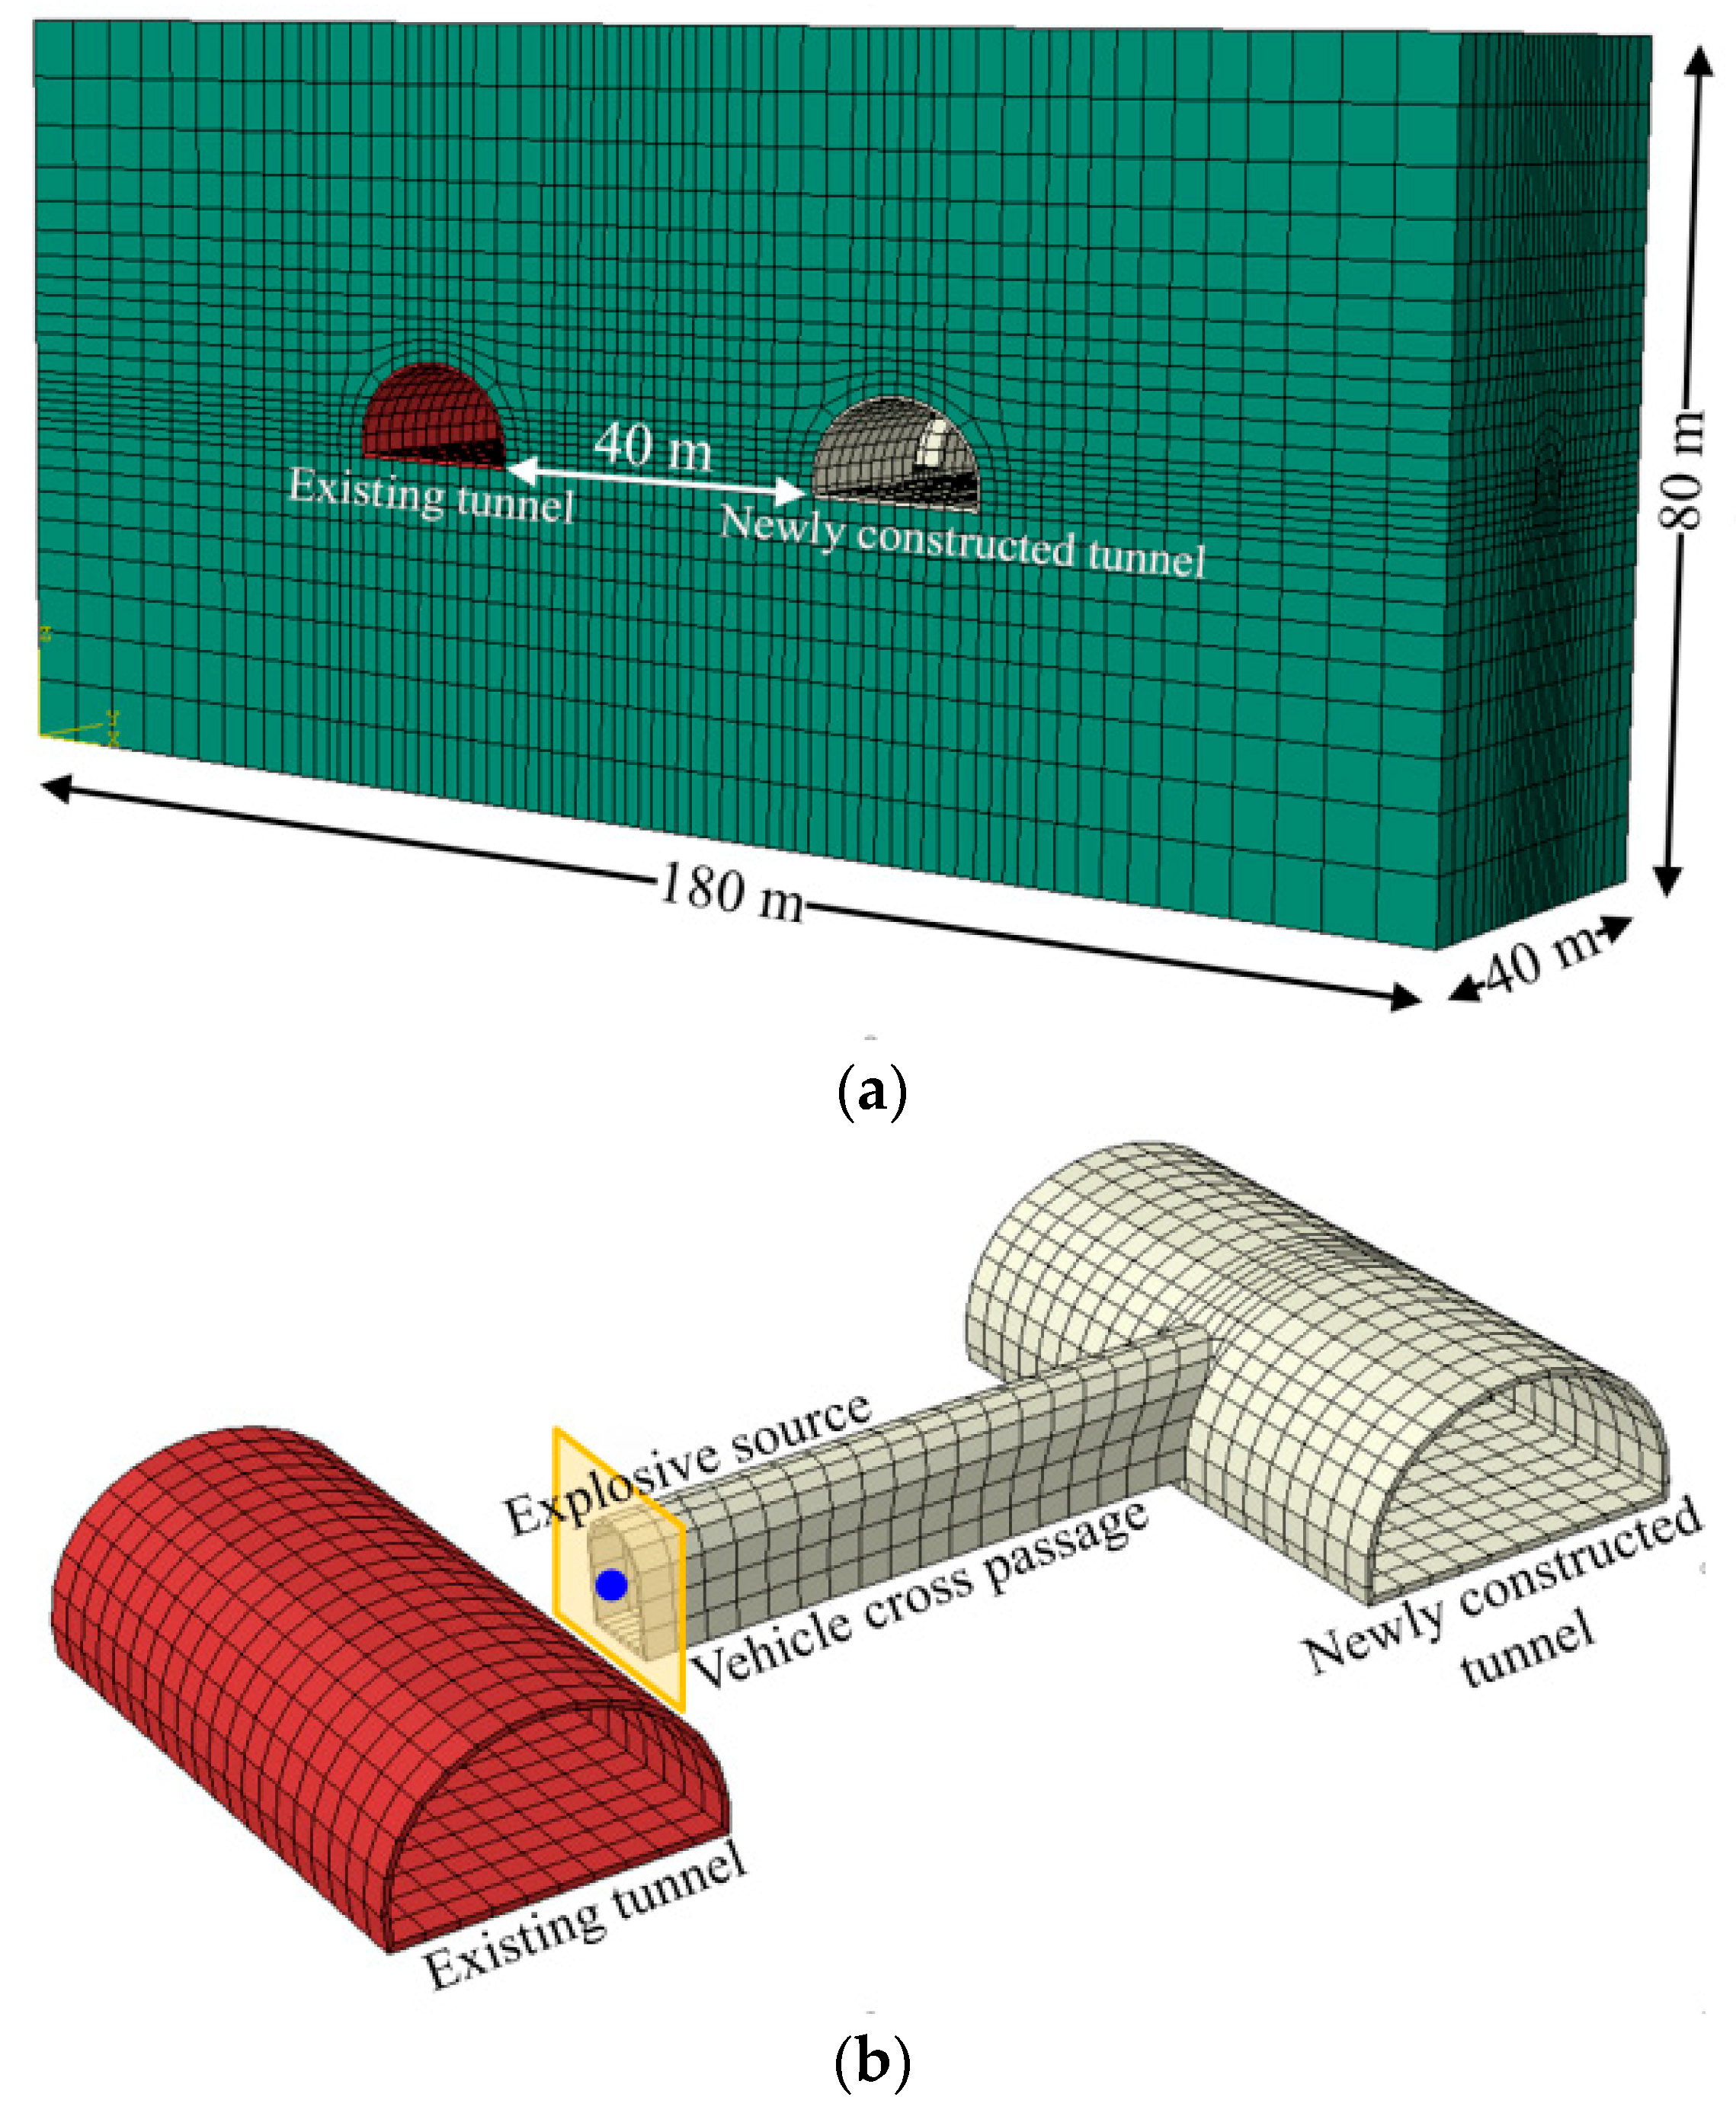
3.1. Model Establishment

The new Yonghe tunnel was constructed using the mining method. Smooth blasting can be used to reduce disturbances and control overbreak or underbreak. Since the existing tunnel is in front of the explosion, the dynamic load generated by blasting may affect the structure of the existing tunnel. Thus, we employed a dynamic finite element model to study the dynamic response of the existing tunnel structure under the blasting load generated by the transverse tunnel.

3.1.1. Fundamental Model and Boundary Conditions

With an extensive library of material models, Abaqus can simulate stress and deformation at low and high strain rates and at small and large strains. It especially has a huge advantage for dealing with the problems of interaction, large deformation, and nonlinearity. Consequently, it is used in our work. A numerical model established with this finite element software is shown in Figure 4. The overall size of the model is 180 m × 40 m × 80 m x × y × z , where x represents the axis of the transverse tunnel,   y represents the direction along the tunnel axis, and z represents the vertical direction. The actual engineering tunnel is buried at a depth of 180 m. In the numerical model, the thickness of the soil covering the top of the tunnel is approximately 35 m. The gravity load is applied directly on the top of the model. In the numerical model, the “Tie constraint” is utilized to describe the soil–tunnel interaction, and thereby, the deformation compatibility condition between the displacements of the tunnel and the surrounding rock is realized.
To increase the accuracy of the model, artificial viscoelastic boundaries were established around the numerical model. Based on existing research results, the parameters of the spring-damping system at the artificial boundary node can be calculated as follows:
K n = α n G r A , C n = ρ c p A K T = α t G r A , C T = ρ c s A  
The normal stiffness coefficient and tangential stiffness coefficient of the spring are denoted as K n and   K T respectively, while C n and   C T represent the normal and tangential damping coefficients. The existing research results can be used to calculate these parameters. The correction coefficients for the normal and tangential viscoelastic artificial boundaries are denoted as α n and α t , respectively. For three-dimensional problems, the typical range for α n is 1.0 to 2.0, while the range for α t is 0.5 to 1.0, based on existing research results. It is recommended by Guyin et al. [22] to use correction coefficients α n = 1.33 and α t = 0.67. G represents the shear modulus, while C s and C p are the velocities of the S wave and P wave, respectively. ρ is the density of the medium, r is the distance from the wave source to the artificial boundary, and A represents the control area of a cell node. A dynamic and implicit analysis step is created in Abaqus/Standard to acquire the dynamic responses of the tunnel, which involves a direct-integration dynamic analysis method.

3.1.2. Computational Parameters

The Mohr–Coulomb model is used to represent the behavior of surrounding rock II. Based on the guidelines outlined in the Design Rules for Highway Tunnel (JTG/T D70–2010) [23], the parameters for surrounding rock Ⅱ are specified as follows: the density of surrounding rock Ⅱ is 2500 kg/m3, with an elastic modulus of 20 GPa, Poisson’s ratio of 0.25, cohesion of 1.5 MPa, and an internal friction angle of 50°. The tunnel lining is modeled using a linear elastic constitutive relation. The lining material is C30 reinforced concrete, and the calculation parameters are based on the Code for Designing Concrete Structures (GB 50010–2010) [24]. Specifically, the elastic modulus of the lining is set to 30 GPa, and Poisson’s ratio is 0.2.
In vibration analysis, a proportional damping model is widely used to capture the damping behavior of vibrating structures. The popularity of this model is due to its simplicity in implementation, de-coupling of the governing equations, and control over the tuning of the mass and stiffness proportional constants, a and b, respectively. Many FE analysis codes implement the Rayleigh damping model [25]:
C = α M + β K
The damping matrix C , mass matrix M , and stiffness matrix K are defined, with α and β representing the mass damping and stiffness damping proportionality constants, respectively. The values of α and β can be determined according to the publication:
ξ n = α 2 ω n + β ω n 2
In the formula, ξ n represents the modal damping ratio of the N-th mode form, and ω n represents the frequency of the N-th mode.
With a modal analysis, the first two fundamental frequencies, ω 1 and ω 2 , can be obtained. The values of α and β can be determined using ξ 1 and ξ 2 , typically set at 0.05, obtained through modal analysis. The modal analysis yielded the first and second mode frequencies of the surrounding rock as ω 1 = 15.758 and ω 2 = 20.412, respectively. Based on these results, the Rayleigh damping coefficients were determined as α = 0.8893 and β = 0.0028.

3.2. Simulation of Transverse Tunnel Blasting Construction

3.2.1. Construction Plan

The construction of the cross passage employed the up-and-down step approach. The blasting footage for each section was between 1 and 2 m, with a hole depth of 1.2 to 2.3 m in the cutting area. The peripheral holes were spaced at 450 to 550 mm, the minimum resistance line was set at 600 mm, and the auxiliary holes were spaced between 600 mm and 1100 mm. The blasting parameters for the vehicle passage can be found in Table 1, while Figure 5 displays the layout of the blasting holes.

3.2.2. Blasting Equivalent Load

The complexity of the research problem renders it difficult to establish every element of the explosion process. Although the research problem is complex, we can analyze blast waves using empirical formulas and monitoring data from vibration measuring points.
Building on the research findings of [21], the maximum detonation pressure resulting from an explosion can be determined using the following calculation:
P b = ρ c v 2 4
In the formula: P b is the maximum detonation pressure; ρ c is the charge density; ρ c = 1000   kg / m 3 ;   v is the explosive detonation speed; and v = 3400   m / s .
Due to variations in gas and rock properties, as well as contact conditions, the pressure of the explosive gas and the resulting detonation pressure may not be equivalent. Under explosion dynamics, the maximum impact force on the perforation wall can be determined when the perforation is filled with explosives, as follows:
P m a x = 2 ρ 0 c p ρ 0 c p + ρ c V P b
In the formula: P m a x is the maximum impact pressure on the pore wall. ρ 0 and   C p are rock density and p-wave velocity.
To calculate the correct formula for non-full charge conditions, it is necessary to consider the proportional relationship between the single hole charge and the hole volume. This relationship can be described as follows:
P m a x = 1 D / d n v V 0 V P m a x
To accurately calculate the necessary values for this project, the formula below incorporates specific parameters, such as D (blast hole diameter) set to 42 mm, d (cartridge diameter) at 32 mm, V 0 (charge volume), V (blast volume), n (ratio of the length of the propellant charge to the diameter of the projectile), β (cylindrical charging coefficient), and ν (adiabatic index of gas). It should be noted that ν is assumed to be 1.4.
Based on the construction plan, the second section of the stepped structure was designed to hold the largest amount of explosives when using a single ignition point. As a result of this, the potential exists for significant adverse impacts on existing tunnels. A minimal impact was observed during later-stage blasting, as there was enough clearance space available. Accordingly, the blasting load excitation parameters for this section were calculated using Equation (5). The calculation yielded a maximum impact pressure for a single blast hole of P m a x = 1019.60 MPa. At present, the parabolic and triangular blasting load curves are the most commonly used ones. The triangular load curve model was chosen to simulate the blasting in this paper because of its ease of use and parameter determination. The calculation results reveal the equivalent blasting load curve of the satellite holes at the upper bench, as illustrated in Figure 6.

4. Analysis of Results

4.1. Vibration Velocity of the Existing Lining

The vibration velocity is usually selected to evaluate the performance of the tunnel in a dynamic analysis [26,27,28]. Compared with the internal forces of the tunnel, the vibration velocity is more easily monitored in both numerical analysis and practice. Additionally, the threshold value of this indicator has been specifically stipulated in a related technical code. As a consequence, the blasting-induced vibration velocity of the tunnel is first analyzed herein.
Figure 7 displays the distribution cloud diagram of the existing tunnel’s lining vibration velocity at various times when the excavation face is situated 10 m away from it. The figure provides evidence that tunnel blasting generates shock waves. These shock waves travel towards the tunnel wall near the blasting face, resulting in vibration in that particular area. The vibration of the tunnel wall at that location gradually increases with the continuous blasting until it reaches its maximum value and gradually propagates along the tunnel axis, as observed over time. Over time, the vibration waves progressively spread towards both ends of the tunnel. However, it is worth noting that the peak value of the synthesized vibration, after superimposition, becomes weaker compared to the initial time. During blasting operations, the vibration response is more prominent on the side where the blasting is executed, while the perpendicular side experiences a less intense vibration response. Thus, the side perpendicular to the blasting location is a potentially dangerous zone, and it requires special attention to maintain safety in this area.
The most unfavorable section of the existing tunnel depicts the vibration velocity distributions as presented in Figure 8. As shown in the figure, the transverse tunnel blasting has a noticeable impact on the bending area on the right side of the tunnel. Consequently, the peak vibration velocity of the lining at this specific position can be utilized as a control index. This index helps guide the blasting construction of the new transverse passage and ensures its proper management. In the latter phase of the blasting load, the tunnel floor also exhibits a certain degree of vibration response. When t = 6 ms, the maximum vibration velocity of the lining in the right arch waist area due to blasting was 2.63 cm/s. However, this value is lower than the standard control value of 8~10 cm/s as recommended in reference [29].
The velocity–time curves of characteristic points at the most vulnerable section are illustrated in Figure 9. As observed from the figure, the vibration response during blasting is the most severe at the lower arch position of the tunnel, owing to its proximity to the blasting source. According to the calculation result, in the whole process of the blasting load, the vibration at points C and D on the right side of the tunnel is the strongest. The maximum vibration velocity of 2.96 cm/s was observed at point D around 10.5 milliseconds after blasting. Subsequently, the vibration inside the tunnel reduced significantly after 80 milliseconds of blasting.
Figure 10 shows the velocity–time curves of characteristic point D in all directions. As can be seen from the figure, the value of the vibration velocity at the most unfavorable position of the blasting side lining is V x > V z > V y . The blasting vibration velocity along the y direction is almost negligible, while the x direction exhibits the highest vibration velocity. Hence, it is crucial to enhance the monitoring of radial vibration velocity during tunnel construction. The time–history curve shows that the vibration response of the tunnel lining lasts for approximately 50 milliseconds under these conditions.

4.2. Stress on the Existing Lining

When the blasting face is located 10 m away from the existing tunnel, the maximum principal stress distribution contour of the existing tunnel is shown in Figure 11. By comparing Figure 7 and Figure 11, we can observe that the variation pattern of the stress wave in the existing tunnel lining is similar to the law of blasting vibration velocity under the influence of blasting load. The vibrations waves generated by blasting initially reach the lower arch waist of the lining on the side facing the explosion and then propagate to the opposite side. As time passes, the location of the maximum stress shifts from the lower arch waist to the arch crown, but the peak stress gradually decreases.
Figure 12 shows the maximum principal stress–time curve of the existing tunnel. According to the figure, the trend of the maximum principal stress of the tunnel lining is consistent with the variation trend of the maximum lining vibration velocity. The peak of the maximum principal stress is observed to occur with a certain delay effect compared to the peak of the lining vibration velocity. The blasting at this position results in a maximum principal stress of 196.5 kPa. This stress level is well below the tensile strength of the lining. This could be attributed to the fact that the surrounding rock in this section has good shock wave absorption properties.

5. Exploring the Rational Clear Distance from the Excavation Face: A Discussion

The graph presented in Figure 13 illustrates the correlation between the maximum vibration velocity of the lining and the loading distance of the blasting load. As shown in the figure, blasting has the potential to generate vibrations that affect the entire tunnel structure. Moreover, as the excavation face of the tunnel approaches an existing tunnel, the magnitude of these vibrations increases significantly. When the distance between the excavation face and the existing tunnel is less than 10 m, the intensity of the vibrations will increase significantly. A good fit of the calculated data suggests that there is a strong power–law relationship between the maximum vibration velocity of the existing tunnel lining and the distance of the blasting load effect:
V m a x = 186.72 D 1.77
In the equation: V m a x   is the maximum vibration velocity of the existing tunnel lining, cm / s ; D is the distance between the location of the blasting load and the existing tunnel, m.
Based on the calculation data, to ensure that the vibration velocity remains within the standard limit of 8 cm/s [25], the distance between the excavation face of the transverse tunnel and the existing tunnel lining should be kept at approximately 5.9 m [9]. To ensure the safety of the existing lining, it is advisable to optimize the blasting construction parameters. This optimization should occur when the distance between the face of the transverse tunnel and the existing tunnel lining approaches 10 m during excavation.
Figure 14 illustrates the relationship between the maximum vibration velocity and the maximum principal stress of the existing tunnel. The figure suggests a strong linear correlation between the maximum principal stress and the maximum vibration velocity.
σ 1 = 0.016 + 0.051 V m a x
In the formula: σ 1   is   the   maximum   principal   stress   of   lining , Mpa .
Due to the favorable rock conditions in the section where the horizontal tunnel blasting was being conducted, the stress state of the lining will not be substantially affected. This would remain true even if the vibrations from the construction work reached the recommended control value of 8 cm/s. Even with the additional maximum tensile stress of 0.42 MPa, the material’s tensile strength design value of 1.43 MPa still exceeds the current level by a significant margin.

6. Conclusions

This article examines the effect of excavating a new transverse roadway for vehicle traffic in the Yonghe tunnel on the existing lining of the tunnel. A three-dimensional finite element analysis was conducted to determine the dynamic response of the existing tunnel lining to nearby blasting vibrations. Based on the results, a safe distance threshold between the excavation face and the existing tunnel was established under the current blasting parameters. The conclusions are as follows:
(1) The blasting-load-induced maximal vibration velocity of the existing tunnel is located at the hance of that. Moreover, the vibration velocity along the axial direction of the horizontal adit has a dramatic contribution to the resultant vibration velocity of the existing tunnel. Thus, the monitored measurement of the vibration velocity at this region should be enhanced during the construction, and the influence of the blasting load applied on the excavation face of the horizontal adit on the existing tunnel can be evaluated using the horizontal–radial vibration velocity;
(2) The law of the stress of the existing tunnel induced by the adjacent blasting load is consistent with that of the vibration velocity. Similarly, the stress responses mainly locate the tunnel hance towards the direction of the blasting load. When the distance from the excavation face of the horizontal adit to the existing tunnel is 10 m, the blasting-load-induced maximal vibration velocity and dynamic tensile stress of the tunnel are only 2.96 cm/s and 0.20 MPa, respectively, which are far less than that stipulated by the related technical code;
(3) A negative power exponent relationship between the maximal vibration velocity and the clear distance from the excavation face to the existing tunnel is observed. According to this relationship, the induced vibration velocity will exceed the threshold stipulated by the standard, i.e., 8 cm/s, if the distance decreases to 5.9 m. Considering the uncertainties in the site, such as the parameters of the surrounding rock, blasting construction, and the tunnel, the controlling distance of the background project is proposed to be 10 m under the current construction scheme.

Author Contributions

Conceptualization, W.Z., G.L. and Y.L.; methodology, W.Z.; G.L., software, Z.Z.; validation, W.Z., Y.L. and C.X.; formal analysis, Y.L.; investigation, G.L.; resources, W.Z.; data curation, C.X.; writing—original draft preparation, G.L.; writing—review and editing, W.Z.; visualization, Z.Z.; supervision, W.Z.; project administration, W.Z.; funding acquisition, Y.L. All authors have read and agreed to the published version of the manuscript.

Funding

The author gratefully acknowledges the financial support provided by the National Nature Science Foundation of China: 51978677; the Shenzhen Natural Science Foundation (Sustainable Development Project: KCXFZ20201221173207020); and the GuangDong Basic and Applied Basic Research Foundation: 2023A1515030258.

Institutional Review Board Statement

Not applicable.

Informed Consent Statement

Not applicable.

Data Availability Statement

Data available on request from the corresponding authors.

Conflicts of Interest

The author declared that he has no known competing financial interests or personal relationships that could have appeared to influence the work reported in this paper.

References

  1. Zhang, Z.C.; Lin, C.M.; Li, J.S.; Dong, Y.; Shen, Y. Development status and prospect of highway tunnel rehabilitation and expansion in China. Tunn. Constr. 2022, 42, 570–585. [Google Scholar]
  2. Huang, L.; Ma, J.; Lei, M.; Liu, L.; Lin, Y.; Zhang, Z. Soil-water inrush induced shield tunnel lining damage and its stabilization: A case study. Tunn. Undergr. Space Technol. 2020, 97, 103290. [Google Scholar] [CrossRef]
  3. Bai, G.Q.; Li, Z.H.; Zhang, T. Exploration and discussion on the setting of cross passages between new and old tunnels of highway reconstruction and extension project. Mod. Tunn. Technol. 2019, 56, 21–27. [Google Scholar]
  4. Clough, L.G.; Clubley, S.K. Steel column response to thermal and long duration blast loads inside an air blast tunnel. Struct. Infrastruct. Eng. 2019, 15, 1510–1528. [Google Scholar] [CrossRef]
  5. Sun, T.J.; Wang, W.; Luo, R.M. Influences of different lining structure defects on overall safety of tunnel structure. J. Archit. Civ. Eng. 2017, 34, 82–90. [Google Scholar]
  6. Wang, W.; Jiang, H.; Yuan, Q. Numerical analysis of dynamic response of existing lining under close tunnel blasting. Eng. Blasting 2022, 28, 33–39. [Google Scholar]
  7. Qian, Y.F.; Wang, X.H. Study on safety influence of blasting construction close to existing tunnel. J. Beijing Jiaotong Univ. 2014, 38, 90–96. [Google Scholar]
  8. Torano, J.; Rodríguez, R.; Diego, I.; Rivas, J.M.; Casal, M.D. FEM models including randomness and its application to the blasting vibrations prediction. Comput. Geotech. 2006, 33, 15–28. [Google Scholar] [CrossRef]
  9. Ma, J.; Chen, J.; Guan, J.; Lin, Y.; Chen, W.; Huang, L. Implementation of Johnson-Holmquist-Beissel model in four-dimensional lattice spring model and its application in projectile penetration. Int. J. Impact Eng. 2022, 170, 104340. [Google Scholar] [CrossRef]
  10. Xu, M.; Li, X.; Liu, T.; Luo, Y.; Huang, J.; Wang, G.; Gao, W. A study on hollow effect and safety design of deep crossing Caverns under blasting vibration. Tunn. Undergr. Space Technol. 2021, 111, 103866. [Google Scholar] [CrossRef]
  11. Blair, D.P. Blast vibration dependence on charge length, velocity of detonation and layered media. Int. J. Rock Mech. Min. Sci. 2014, 65, 29–39. [Google Scholar] [CrossRef]
  12. Wang, D.K.; Luo, J.J.; Gao, L.P. Analysis of reasonable spacing of large underground caverns based on blasting equivalent load. J. Cent. South Univ. 2022, 53, 2224–2233. [Google Scholar]
  13. Abuov, M.G.; Aitaliev, S.M.; Ermekov, T.M.; Zhanbyrbaev, N.B.; Kayupov, M.A. Studies of the effect of dynamic processes during explosive break-out upon the roof of mining excavations. Sov. Min. Sci. 1988, 24, 581–590. [Google Scholar] [CrossRef]
  14. Carter, J.P.; Booker, J.R. Sudden excavation of a long circular tunnel in elastic ground. Int. J. Rock Mech. Min. Sci. Geomech. Abstr. 1990, 27, 129–132. [Google Scholar] [CrossRef]
  15. Lu, W.B.; Geng, X.; Chen, M.; Shu, D.Q.; Zhou, C.B. Study of selection of excavation procedure and contour blasting method for deep underground powerhouse. Chin. J. Rock Mech. Eng. 2011, 30, 1531–1539. [Google Scholar]
  16. Lu, W.; Yang, J.; Chen, M.; Zhou, C. Mechanism and equivalent numerical simulation of transient release of excavation load for deep tunnel. Chin. J. Rock Mech. Eng. 2011, 30, 1089–1096. [Google Scholar]
  17. Jun, H.U.; Zhong, L. Exploration for open-pit mine blasting load equivalent way. Met. Mine 2014, 43, 37–41. [Google Scholar]
  18. Chen, S.G.; Zhao, J.; Zhou, Y.X. UDEC modeling of a field explosion test. Fragblast 2000, 4, 149–163. [Google Scholar] [CrossRef]
  19. Luo, Y.; Yang, J.H.; Hu, D.R. Study on the Impact of Blasting Vibration on Surrounding Rock of Small Clearance Tunnels. Chin. J. Undergr. Space Eng. 2021, 17, 1309–1314. [Google Scholar]
  20. Zhang, C.F.; Qin, T.G.; Zhang, X. Study on Effect of Blasting Vibration on Underground Caverns. Blasting 2022, 39, 56–63. [Google Scholar]
  21. Wang, X.Q.; Huang, Y.B.; Peng, L.M.; Chen, J.W.; Lei, M.F. Study on full-time load function of tunnel blasting and its application. J. Railw. Sci. Eng. 2019, 16, 144–151. [Google Scholar]
  22. Gu, Y.; Liu, J.B.; Du, Y.X. 3D consistent viscous-spring artificial boundary and viscous-spring boundary element. Eng. Mech. 2007, 24, 31–37. [Google Scholar]
  23. JTG/T D70-2010; Guidelines for Design of Highway Tunnel. Ministry of Transport of the People’s Republic of China: Beijing, China; China Communications Publishing & Media Management Co., Ltd.: Beijing, China, 2010.
  24. GB 50010-2010; Code for Design of Concrete Structures. Ministry of Housing and Urban-Rural Development of the People’s Republic of China, State Administration for Market Regulation: Beijing, China; Architecture & Building Press: Beijing, China, 2010.
  25. Ramadas, C.; Balasubramaniam, K.; Hood, A.; Joshi, M.; Krishnamurthy, C.V. Modelling of attenuation of Lamb waves using Rayleigh damping: Numerical and experimental studies. Compos. Struct. 2011, 93, 2020–2025. [Google Scholar] [CrossRef]
  26. Lin, Y.X.; Lai, Z.S.; Ma, J.J.; Huang, L.C.; Lei, M.F. A FDEM approach to study mechanical and fracturing responses of geo-materials with high inclusion contents using a novel reconstruction strategy. Eng. Fract. Mech. 2023, 282, 109171. [Google Scholar] [CrossRef]
  27. Lin, Y.; Yin, Z.Y.; Wang, X.; Huang, L. A systematic 3D simulation method for geomaterials with block inclusions from image recognition to fracturing modelling. Theor. Appl. Fract. Mech. 2021, 117, 103194. [Google Scholar] [CrossRef]
  28. Lin, Y.; Wang, X.; Ma, J.; Huang, L. A finite-discrete element based appoach for modelling the hydraulic fracturing of rocks with irregular inclusions. Eng. Fract. Mech. 2022, 261, 108209. [Google Scholar] [CrossRef]
  29. JTG/T F60-2009; Technical Guidelines for Construction of Highway Tunnel. Ministry of Transport of the People’s Republic of China: Beijing, China; China Communications Publishing & Media Management Co., Ltd.: Beijing, China, 2009.
Figure 1. BIM diagram of the new Yonghe tunnel north of Kaifang Avenue.
Applsci 13 08599 g001
Figure 2. The cross section for lining the structure of the widened tunnel.
Applsci 13 08599 g002
Figure 3. The cross section of the lining structure for vehicle passage.
Applsci 13 08599 g003
Figure 4. (a) Overall model. (b) Tunnel section.
Applsci 13 08599 g004
Figure 5. The layout of the blasting holes for vehicle passage.
Applsci 13 08599 g005
Figure 6. Equivalent blasting load curve of satellite holes at the upper bench.
Applsci 13 08599 g006
Figure 7. The contour of the resultant vibration velocity distribution of the existing tunnel (units: m/s).
Applsci 13 08599 g007
Figure 8. Vibration velocity distributions at the most unfavorable section of the existing tunnel.
Applsci 13 08599 g008
Figure 9. Velocity–time curves of characteristic points at the most unfavorable section.
Applsci 13 08599 g009
Figure 10. Velocity−time curves of characteristic point D in all directions.
Applsci 13 08599 g010
Figure 11. The contour of the maximum principal stress distributions of the existing tunnel.
Applsci 13 08599 g011
Figure 12. The maximum principal stress–time curve of the existing tunnel.
Applsci 13 08599 g012
Figure 13. Relationship between the maximum vibration velocity of the lining and loading distance of blasting load.
Applsci 13 08599 g013
Figure 14. Relationship between the maximum vibration velocity and the maximum principal stress of the existing tunnel.
Applsci 13 08599 g014
Table 1. Blasting parameters of vehicle passage.
PartBlasthole
Name
Blasting Caps per BlastholeBlasthole Depth
(m)
Number of HolesCharge
Weight
per
Blasthole
(kg)
Explosive Amount per Blasthole (kg)Advance per Round
(m)
Blasthole
Utilization Rate (%)
Total Charge Weight
(kg)
Total Number of Blast HolesExplosive Specific Consumption Rate
(kg/m3)
Berm constructionDrift hole11.841.054.201.58527.60551.2
Auxiliary hole31.7140.7510.50
Auxiliary hole51.760.603.60
Auxiliary hole71.750.603.00
Peripheral hole91.7200.450.90
Bottom plate hole111.760.905.40
Berm removalAuxiliary hole11.750.753.751.58816.65330.7
Auxiliary hole31.750.753.75
Auxiliary hole51.750.753.75
Peripheral hole71.7180.455.40
Disclaimer/Publisher’s Note: The statements, opinions and data contained in all publications are solely those of the individual author(s) and contributor(s) and not of MDPI and/or the editor(s). MDPI and/or the editor(s) disclaim responsibility for any injury to people or property resulting from any ideas, methods, instructions or products referred to in the content.

