Article

Porous Carbon Materials Based on Blue Shark Waste for Application in High-Performance Energy Storage Devices

1
Instituto de Ciências Moleculares IMS-CIQUP, Departamento de Química e Bioquímica, Faculdade de Ciências, Universidade do Porto, Rua do Campo Alegre, 687, 4169-007 Porto, Portugal
2
Center for Surface Science and Nanotechnology, University Politehnica of Bucharest, Splaiul Independentei, 313, 060042 Bucharest, Romania
3
Faculty of Medical Engineering, University Politehnica of Bucharest, Gheorghe Polizu Street, 1–7, 011061 Bucharest, Romania
4
Grupo de Reciclado y Valorización de Residuos (REVAL), Instituto de Investigaciones Marinas (IIM-CSIC), Eduardo Cabello, 6, 36208 Vigo, Spain
5
Academy of Romanian Scientists, Splaiul Independentei, 54, 050094 Bucharest, Romania
*
Author to whom correspondence should be addressed.
Appl. Sci. 2023, 13(15), 8676; https://doi.org/10.3390/app13158676
Submission received: 13 June 2023 / Revised: 17 July 2023 / Accepted: 20 July 2023 / Published: 27 July 2023
(This article belongs to the Special Issue Advances in Carbon Nanomaterials)

Abstract

:
The scientific community’s interest in developing sustainable carbon materials from biomass waste is increasing steadily, responding to the need to reduce dependence on fossil fuels. Every day, different biomass sources are suggested for obtaining porous carbon materials with characteristics for application in different areas. Porous carbon materials with a high specific surface area are a subject of interest for application in energy storage devices. This work reports the use of blue shark chondroitin sulfate and gelatine as precursors for developing porous carbon materials for energy storage devices. Commercial chondroitin sulfate was used for comparison. The porous carbons obtained in this study underwent various characterization techniques to assess their properties. A BET surface area analyzer measured the specific surface area and pore size. Additionally, scanning electron microscopy (SEM) coupled with energy dispersive X-ray analysis (EDX), a high resolution-scanning transmission electron microscope (HR-STEM), Raman spectroscopy, attenuated total reflectance Fourier transform infrared (ATR-FTIR) spectroscopy, X-ray diffraction (XRD), and X-ray photoelectron spectroscopy (XPS) were employed to examine the morphology, composition, and structure of the carbons. A modified glassy carbon (GC) electrode was used as the working electrode for the electrochemical characterization. Cyclic voltammetry and galvanostatic charge/discharge techniques were employed with ethaline, an environmentally friendly and sustainable electrolyte based on choline chloride, to assess the electrochemical performance. Furthermore, the most promising samples were subjected to ball-milling to investigate the impact of this process on surface area and capacitance. Blue shark chondroitin sulfate-based carbon presented a specific surface area of 135.2 m2 g−1, compared to 76.11 m2 g−1 of commercial chondroitin sulfate, both carbonized for 1 h at 1000 °C. Blue shark gelatine presented a specific surface area of 30.32 m2 g−1. The associated specific capacitance of these three samples is 40 F g−1, 25 F g−1, and 7 F g−1. Ball-milling on these samples increased the specific surface area and capacitance of the three studied samples with different optimal milling times. This study presents the novel utilization of carbon materials derived from blue shark (with and without ball-milling) through a one-step carbonization process. These carbon materials were combined with an environmentally friendly DES electrolyte. The aim was to explore their potential application in energy storage devices, representing the first instance of employing blue shark-based carbon materials in this manner.

1. Introduction

The increasing need for high-performance energy storage devices, including supercapacitors and lithium-ion batteries, has prompted extensive research efforts aiming to develop advanced electrode materials. The objective is to enhance the energy storage properties of these devices, driven by the growing demand in the industry. [1]. Porous carbon materials have garnered significant attention due to their excellent electrical conductivity, large specific surface area, and tunable pore structures, which enable efficient charge transfer and high energy storage capacity [2]. Consequently, exploring sustainable and cost-effective sources for synthesizing such materials has become imperative.
In recent years, using waste materials from diverse sources for producing functional carbon-based materials has gained prominence in energy storage [3]. Blue sharks (Prionace glauca) are widely distributed in oceans worldwide, and historically have been intensively used as food source. However, the enormous volume of blue shark catches and their processing generates large amounts of waste (~100,000 tons per year, according to the FAO database [4]), which poses significant environmental challenges. This underscores the need for innovative approaches to transform this waste into valuable resources [5].
Around 10–20% of the total weight of a shark is comprised of a by-product consisting of vertebral discs and intervertebral fibrocartilage [6]. This by-product contains minerals like apatite, proteins, and glycosaminoglycans. Despite being largely unexplored, the valorization of the shark skeleton is crucial for promoting the sustainability of shark fisheries. Moreover, it could enable the recovery of valuable apatite and glycosaminoglycan fraction, which has great potential for diverse pharmaceutical applications [7,8,9]. Chondroitin sulfate (CS), obtained from heads and skins, is a particularly abundant glycosaminoglycan type. Its structure consists of a repeating sequence of glucuronic acid (GlcA) and N-acetyl galactosamine (GalNAc), linked by alternating β-(1→4) and β-(1→3) glycosidic bonds [5]. Gelatine, partially hydrolyzed collagen, is a protein material that can also be obtained from connective tissues of blue sharks like cartilage and skin, which are other relevant by-products of shark filleting.
This research paper investigates the potential of biocompounds isolated from blue shark wastes as a precursor for synthesizing porous carbon materials suitable for high-performance energy storage devices. Converting these substrates into a valuable carbon-based resource is essential for waste management and sustainability. It will allow us to explore the resulting materials’ performance characteristics in energy storage applications.
The utilization of blue shark waste as a carbon precursor offers several advantages. Firstly, blue shark waste is abundantly available due to commercial fishing activities and can provide a consistent raw material source for large-scale production [10]. Secondly, the unique composition of blue shark waste, rich in organic compounds, polysaccharides, and proteins, presents an opportunity to engineer carbon materials with tailored structures and properties. Moreover, repurposing blue shark waste for sustainable energy storage applications can potentially reduce the ecological impact of waste disposal and promote the efficient use of marine resources.
As far as the author’s knowledge goes, this is the first time that blue shark chondroitin sulfate and gelatine have been used as precursors for producing carbon electrodes for supercapacitor applications. Several published papers used marine waste-based carbons for application as electrodes in energy storage devices, with promising results considering capacitance and retention over time. Brandão et al. [11] recently presented glycogen (from mussel cooking wastewater) and chitin [12] (from squid pen and prawn exoskeleton) as precursors for producing carbons with a high porosity and specific surface area, up to 3.3 nm and 1526 m2 g−1, respectively. Glycogen-based carbon presented an associated specific capacitance of 657 F g−1 at a current density of 1 A g−1, at 30 °C, with 99% retention after 1000 cycles. Several precursors have been studied for producing carbon materials, from crab shells [13], fish scales [14,15,16], prawn shells [17], and fish bones [18], among others.
In this work, the authors employ a one-step carbonization process to transform blue shark biopolymers (chondroitin sulfate and gelatine) recovered from wastes into porous carbon materials. Commercial chondroitin sulfate will be used for comparison. Morphological characterization techniques and electrochemical evaluation, including specific capacitance and cycling stability, will determine their suitability for high-performance energy storage devices.
The effect of time and temperature on carbonization was studied. The best-resulting parameters (1 h at 1000 °C) for the three studied materials were chosen to proceed with the characterization of the materials. The maximum specific surface area and pore size for blue shark chondroitin sulfate, gelatine, and commercial chondroitin sulfate are 135.24 m2 g−1 and 1.44 nm, 30.32 m2 g−1 and 0.87 nm, and 76.11 m2 g−1 and 1.11 nm, respectively.
The effect of ball-milling on these materials’ surface area and porosity was also evaluated. Ball-milling, a mechanical activation technique, has been proven effective in creating porous carbon materials with controlled pore structures and increased surface area. This technique can be sustainable for synthesizing porous carbon materials with tailored structures and enhanced electrochemical properties. The obtained results showed an optimal specific surface area and pore size at different ball-milling times; however, in the three materials, there is an increase in both parameters, up to 260 m2 g−1 and 1.55 nm for blue shark chondroitin sulfate, 33.56 m2 g−1 and 0.91 nm for blue shark gelatine, and 125 m2 g−1 and 1.26 nm for commercial chondroitin sulfate. This increase in area and pore size is recognizes as promoting the increase in capacitance, as already presented by Brandão et al. [19] and evidenced in this work, with the best-resulting ball-milled samples subjected to the electrochemical analysis and the three studied samples showing an increase in capacitance (40 F g−1 to 122 F g−1 for blue shark chondroitin sulfate, 7 to 49 F g−1 for blue shark gelatine, and 10 to 25 F g−1 for commercial chondroitin sulfate).

2. Materials and Methods

2.1. Preparation of Biocarbon from Fish Waste (Blue Shark Chondroitin Sulfate and Blue Shark Gelatine)

By-products (heads and skins) generated in the industrial filleting of blue shark (Prionace glauca) were kindly provided by Propegal S.L. (Vigo, Spain) and stored at −20 °C. Chondroitin sulfate (CS) was isolated from head cartilage according to the procedure and characterization reported in the works of Vázquez et al. [20] and Novoa-Carballal et al. [21], with slight modifications. Briefly, to achieve this isolation, (a) the heads were heated in a water bath (80 °C/30 min), and the cartilage was manually separated from the muscle after cooking, and then milled; (b) this cartilaginous substrate was enzymatically digested by alcalase, and the resulting hydrolysate after centrifugation (supernatant) was chemically treated with the alkaline solution to improve protein proteolysis; (c) this impurified CS was neutralized with HCl and purified by a combination of concentration–diafiltration stages using a 30 kDa ultrafiltration membrane; (d) the concentrates of CS were finally dried in an air-forced convection oven. CS reached a purity value of 90% (w/w) concerning protein content, a richness of 75% (w/w) of CS regarding other glycosaminoglycans, a molecular weight of 60 kDa, and a sulfation ratio (4S/6S) of 0.17.
Gelatin was recovered from the skins of blue shark using various chemical washes and thermal extraction, as described in the work of Sousa et al. [22]. To summarize, frozen skins were cut into 5 × 5 cm portions, washed with water to remove impurities on the skin surface, and processed as follows. (a) Sequential alkaline (using NaOH) and two acids (with sulphuric and citric acids) treatments were used, including washing between them; (b) gelatin was extracted from treated skins by soaking them in slightly warm water; (c) the gelatin solution was deodorized and purified via adsorption with active charcoal; (d) dried gelatin was produced in an air-forced convection oven. The gelatin sample was composed of 93% (w/w) of protein, 1% (w/w) fat, 4% (w/w) of moisture, and 2% (w/w) ash (salts and minerals). The contents of amino acids in gelatins were (%, w/w of total amino acids): 32, 10.3, and 8.5 of glycine, proline, and hydroxyproline, respectively. The strength of the blue shark gelatin gel was 189 g [22].
Commercial chondroitin sulfate (chondroitin sulfate C sodium salt, N-acetyl galactosamine sulfate linked β1,4 to glucuronic acid, Biosynth, Compton, UK) was used as a comparison.
The raw biomass/commercial chondroitin sulfate was placed in a tube-shaped furnace and subjected to a controlled environment with a flow of N2 gas at a rate of 0.3 L h−1. Different combinations of time and temperature were tested to determine the optimal conditions for carbonization. Among these, the best outcomes were observed at a temperature of 1000 °C and a duration of 1 h, resulting in the formation of carbonized materials, which accounted for approximately 39% of the original weight. These specific parameters were therefore selected for further investigation in this study. The detailed findings are in Table S1, which is included in the Supplementary Materials.

2.2. Ball-Milling

The biomass-based carbon was modified by dry ball-milling using the Retsch Mixer Mill MM500 Vibro machine (Retsch GmbH, Haan, Germany) (using 1 cm diameter stainless steel (SS) balls, in a proportion of 0.02 g of carbon material per 5 SS balls, bouncing at 25 Hz).

2.3. Morphological Characterization of the Carbon Materials

The morphological characterization of the carbon materials was assessed through several pieces of equipment and methods. Detailed information [23,24,25] about the equipment and techniques is presented in the Supplementary Materials (Section A).

2.4. Electrochemical Studies

The electrochemical studies were conducted following the method previously presented by Brandão et al. [19]. The Supplementary Materials (Section A) provides detailed information about the electrolytes’ and working electrodes’ preparation. The electrochemical characterization of the half-cell setup is also discussed, which includes specific details regarding the parameters used for cyclic voltammetry, galvanostatic charge/discharge curves, and electrochemical impedance spectroscopy.
To prevent the crystallization of the eutectic mixture (ethaline), the electrochemical experiments were performed at 30 °C.

3. Results

The morphological characterization and the elemental composition analysis of the blue shark chondroitin sulfate, blue shark gelatine, and commercial chondroitin sulfate, carbonized for 1 h at 1000 °C (parameters already optimized, refer to Table S1 in Supplementary Materials), were studied to determine how the different composition of these materials can influence their capacitive behavior. The electrochemical investigation included cyclic voltammetry and galvanostatic charge–discharge measurements to validate the capacitive performance of the electrode.
Figure 1 presents the chemical structures of chondroitin sulfate and gelatine, showing the distinct backbone structures of the starting materials, which can influence the morphological and electrochemical characteristics. Due to the natural sources of chondroitin sulfate and the gelatine derived from blue shark, it is impossible to predict the exact structure of its molecules, so these structures can only be seen as estimative.

3.1. Structural Characteristics

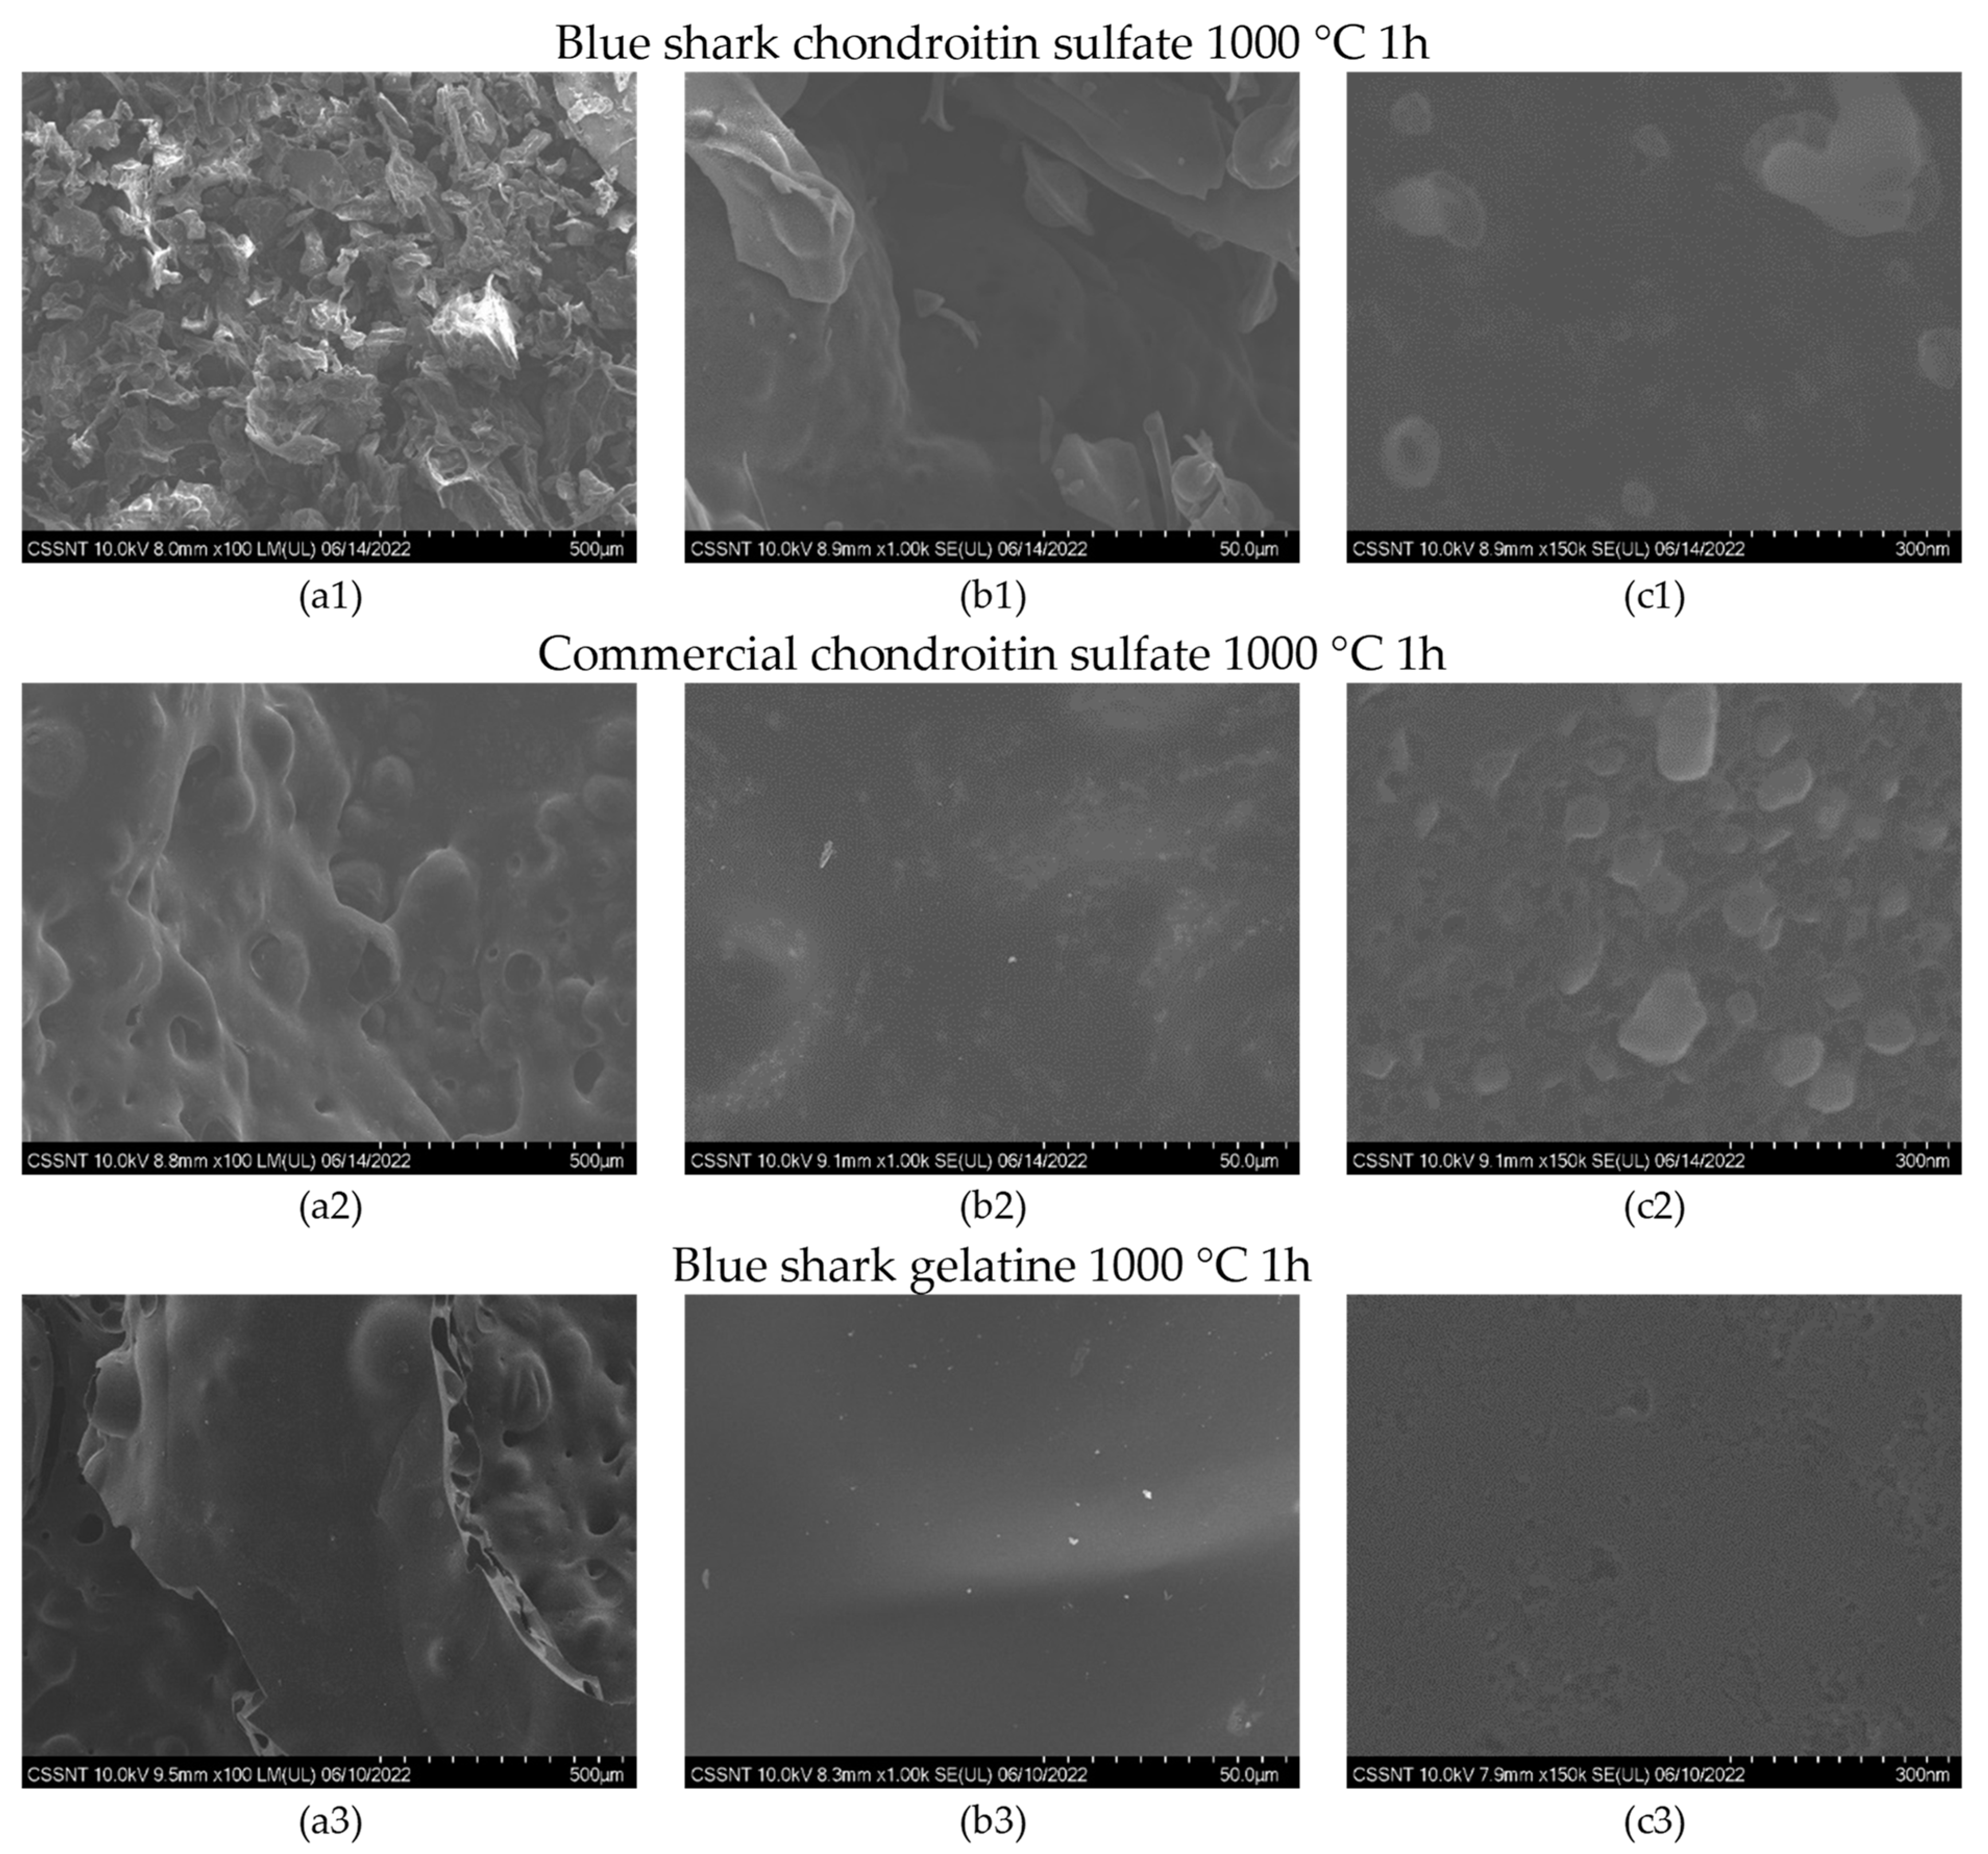
The morphology of the chondroitin sulfate (blue shark and commercial) and gelatine (blue shark)-based carbons obtained after carbonization under N2 flow for 1 h at 1000 °C was demonstrated via SEM, and the images are shown in Figure 2.
There is a notorious difference in the morphology of the two chondroitin sulfate samples (blue shark and commercial). The ×100 magnification (Figure 2(a1,a2)) shows well-defined carbon flakes for the blue shark chondroitin sulfate-based carbon, while for the commercial type, the morphology presents a spongy shape. With increasing magnification, the images show a very distinct porous structure.
The ×100 magnification image of the blue shark gelatine-based carbon (Figure 2(a3)) presents an entirely different morphology from the chondroitin sulfate sample, with a non-porous structure on the outer layer. At the same time, a porous morphology is visible on the inside. The increase in the magnification makes the non-porous nature of this sample more visible.
In Supplementary Materials, the EDX analysis was performed for the three carbon samples, as presented in Figure S1a–c. Comparing the EDX results for the chondroitin sulfate from both blue shark and commercial sources, both samples show a high carbon and oxygen content.
The blue shark chondroitin-based carbon presents high calcium, sodium, magnesium, sulfur, and potassium levels, characteristic of the natural precursor source used to obtain this carbon. The commercial version of the chondroitin sulfate presents a high level of carbon, with slight traces of the elements shown earlier. This may indicate the higher porosity of the chondroitin sulfate when studying the commercial version.

3.2. XPS (X-ray Photoelectron Spectroscopy)

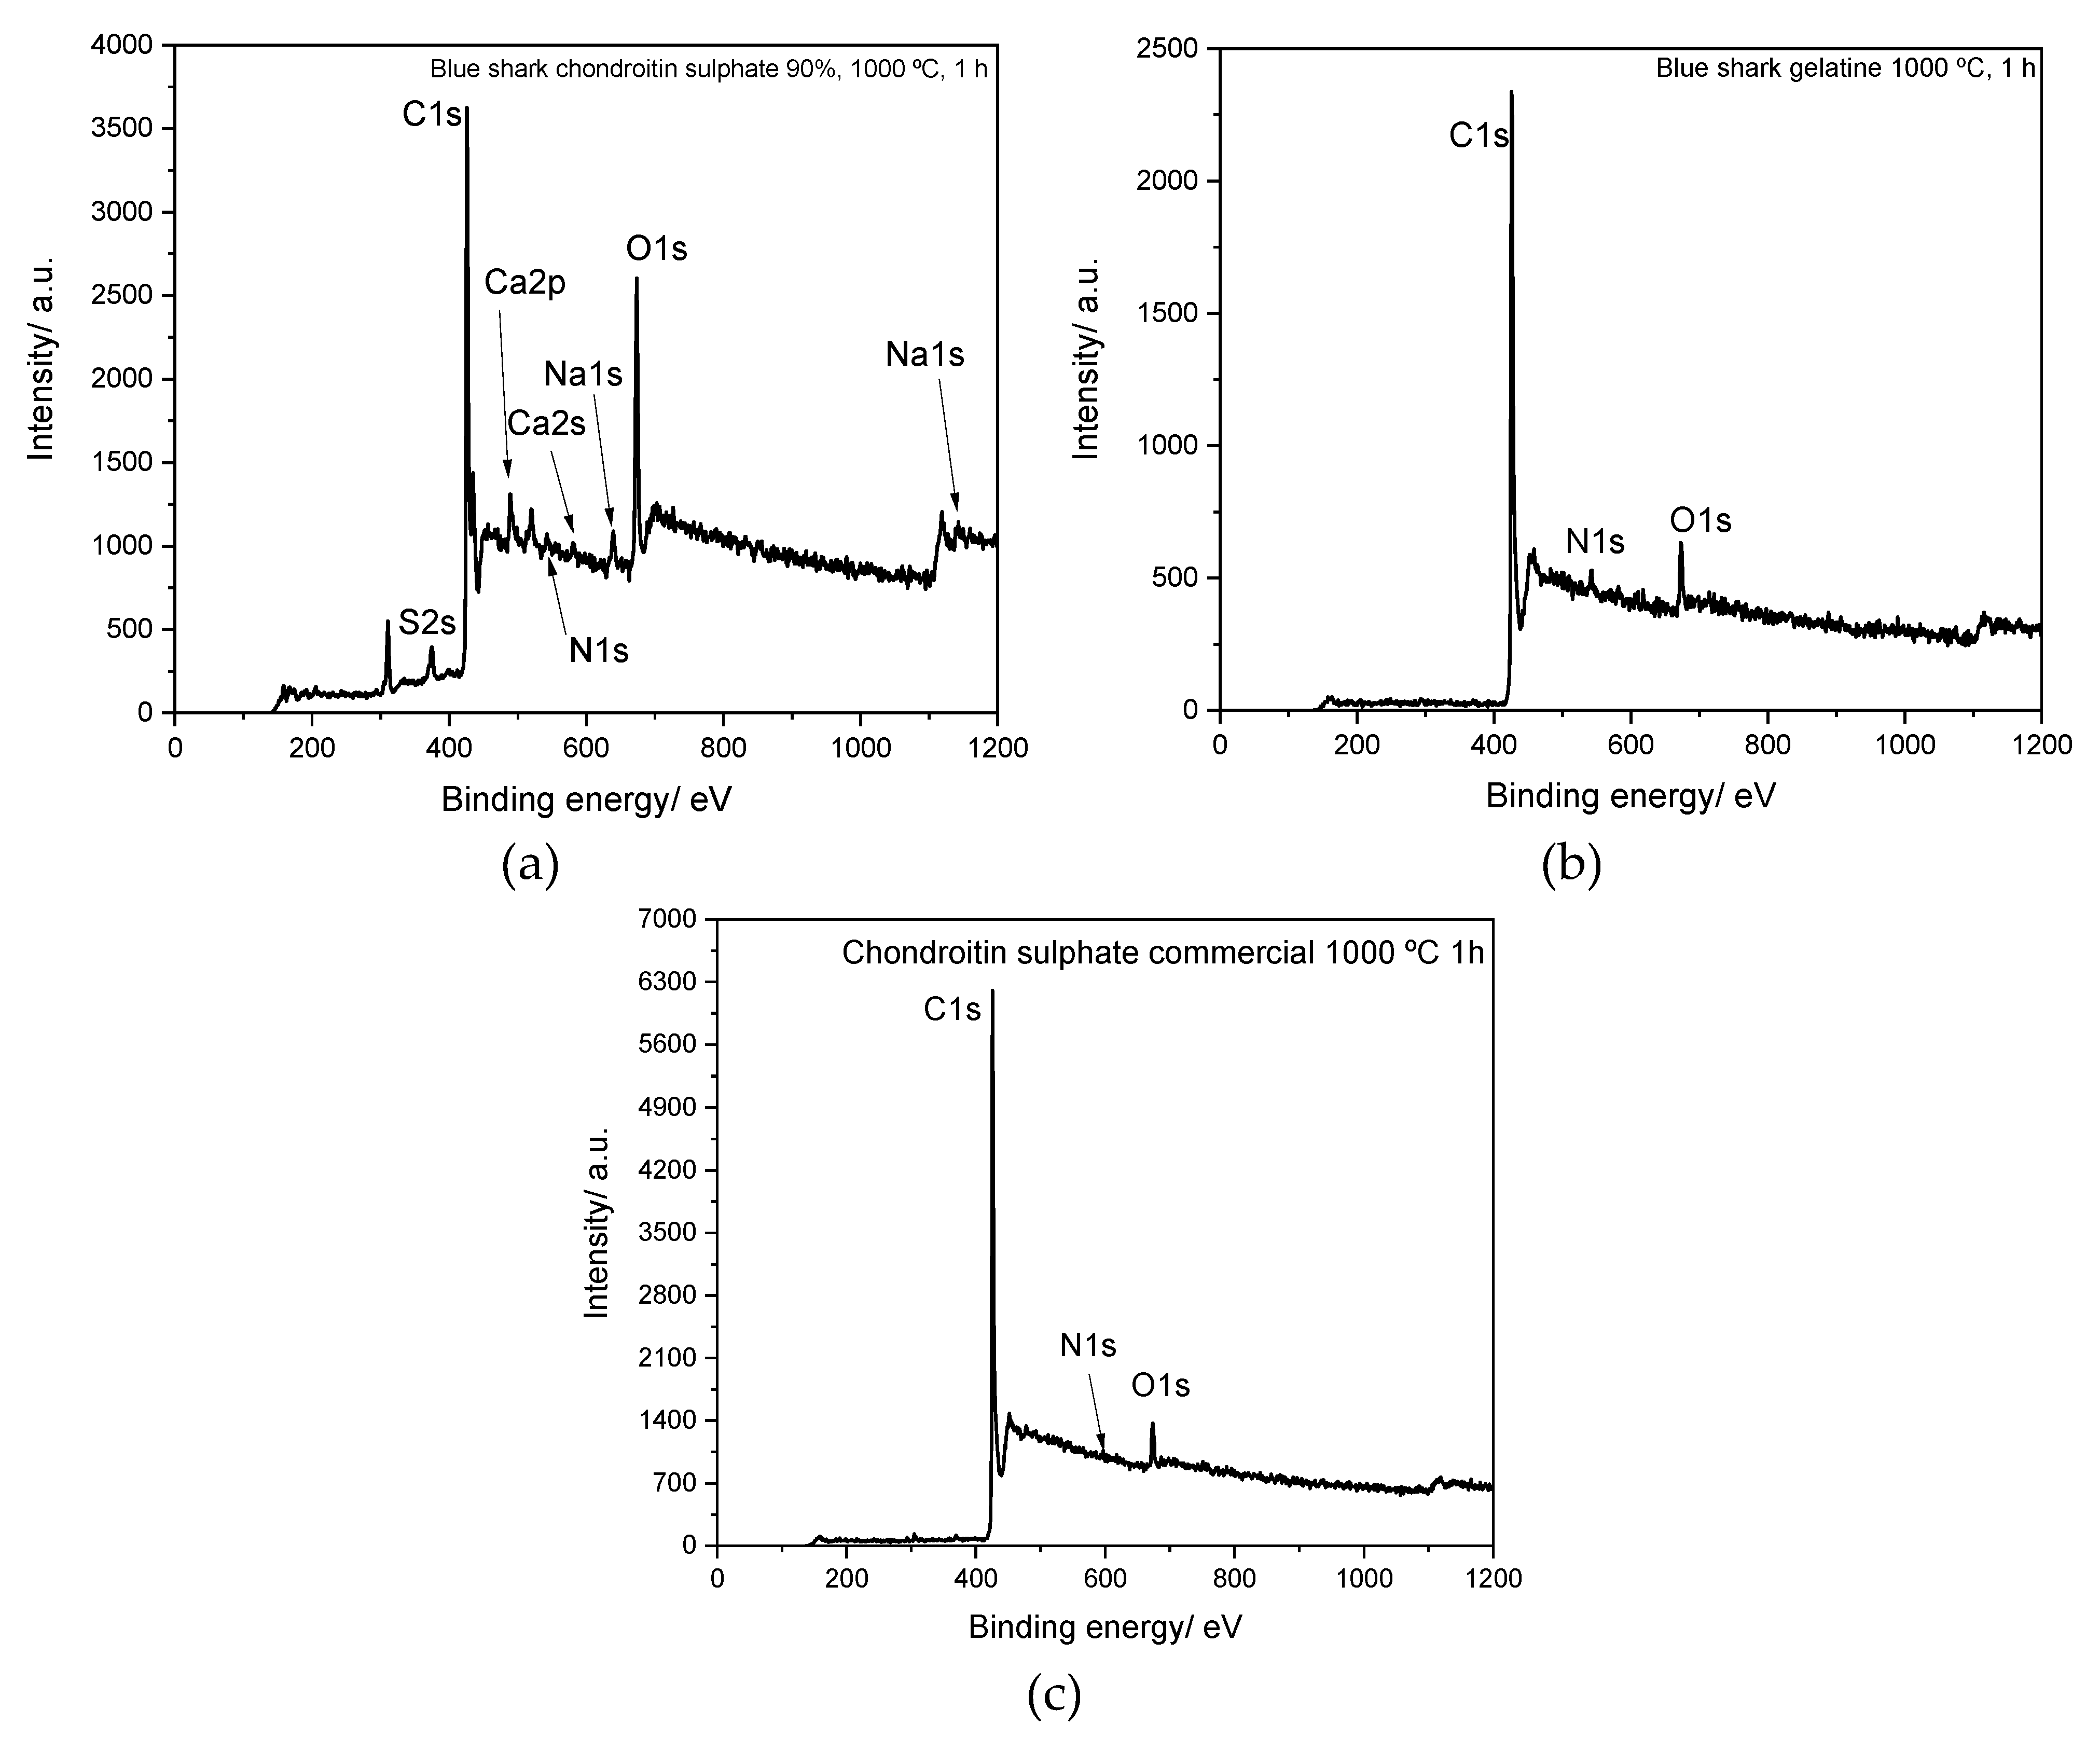
XPS was performed to better understand the elemental analysis obtained from the EDX analysis. Figure 3 presents the overall XPS survey spectra for (a) blue shark chondroitin sulfate, (b) blue shark gelatine, and (c) commercial chondroitin sulfate, carbonized for 1 h at 1000 °C under N2 flow. The deconvoluted peaks for carbon (C1s), oxygen (O1s), nitrogen (N1s), and sodium (Na1s) are presented in Figures S2–S4 for the three studied carbon-based samples.
The results of the elemental analysis of the two chondroitin sulfate and gelatine-based carbons and raw materials are presented in Table 1. The atomic elements of the three carbonized samples are consistent with the results obtained in the EDX analysis. All carbon materials present a high carbon content, from 75.4% to 81.4% of the atomic percentage (At%), compared to the raw precursors (respectively, 49.1% and 68.1%).
The significant peaks observed in the spectrum correspond to C1s, O1s, and N1s, as reported in reference [28]. These findings indicate the presence of carbon, oxygen, and nitrogen functional groups within the structure of the carbon material in all three samples. Additional elements such as Na1s, S2p, K2p, and Ca2p were also examined, with N1s exhibiting the highest intensity in the blue shark gelatine-based carbon. It is expected that the remaining elements are present in the analyzed samples due to the natural origins of the raw blue shark-based materials. The analysis of the commercial chondroitin sulfate revealed the presence of C1s, N1s, and O1s peaks associated with the pure compound.

3.3. Scanning Transmission Electron Microscope (STEM)

To obtain more in-depth information on the morphology of the carbonized samples, an ultra-high-resolution scanning transmission electron microscopy (UHR-STEM) was performed.
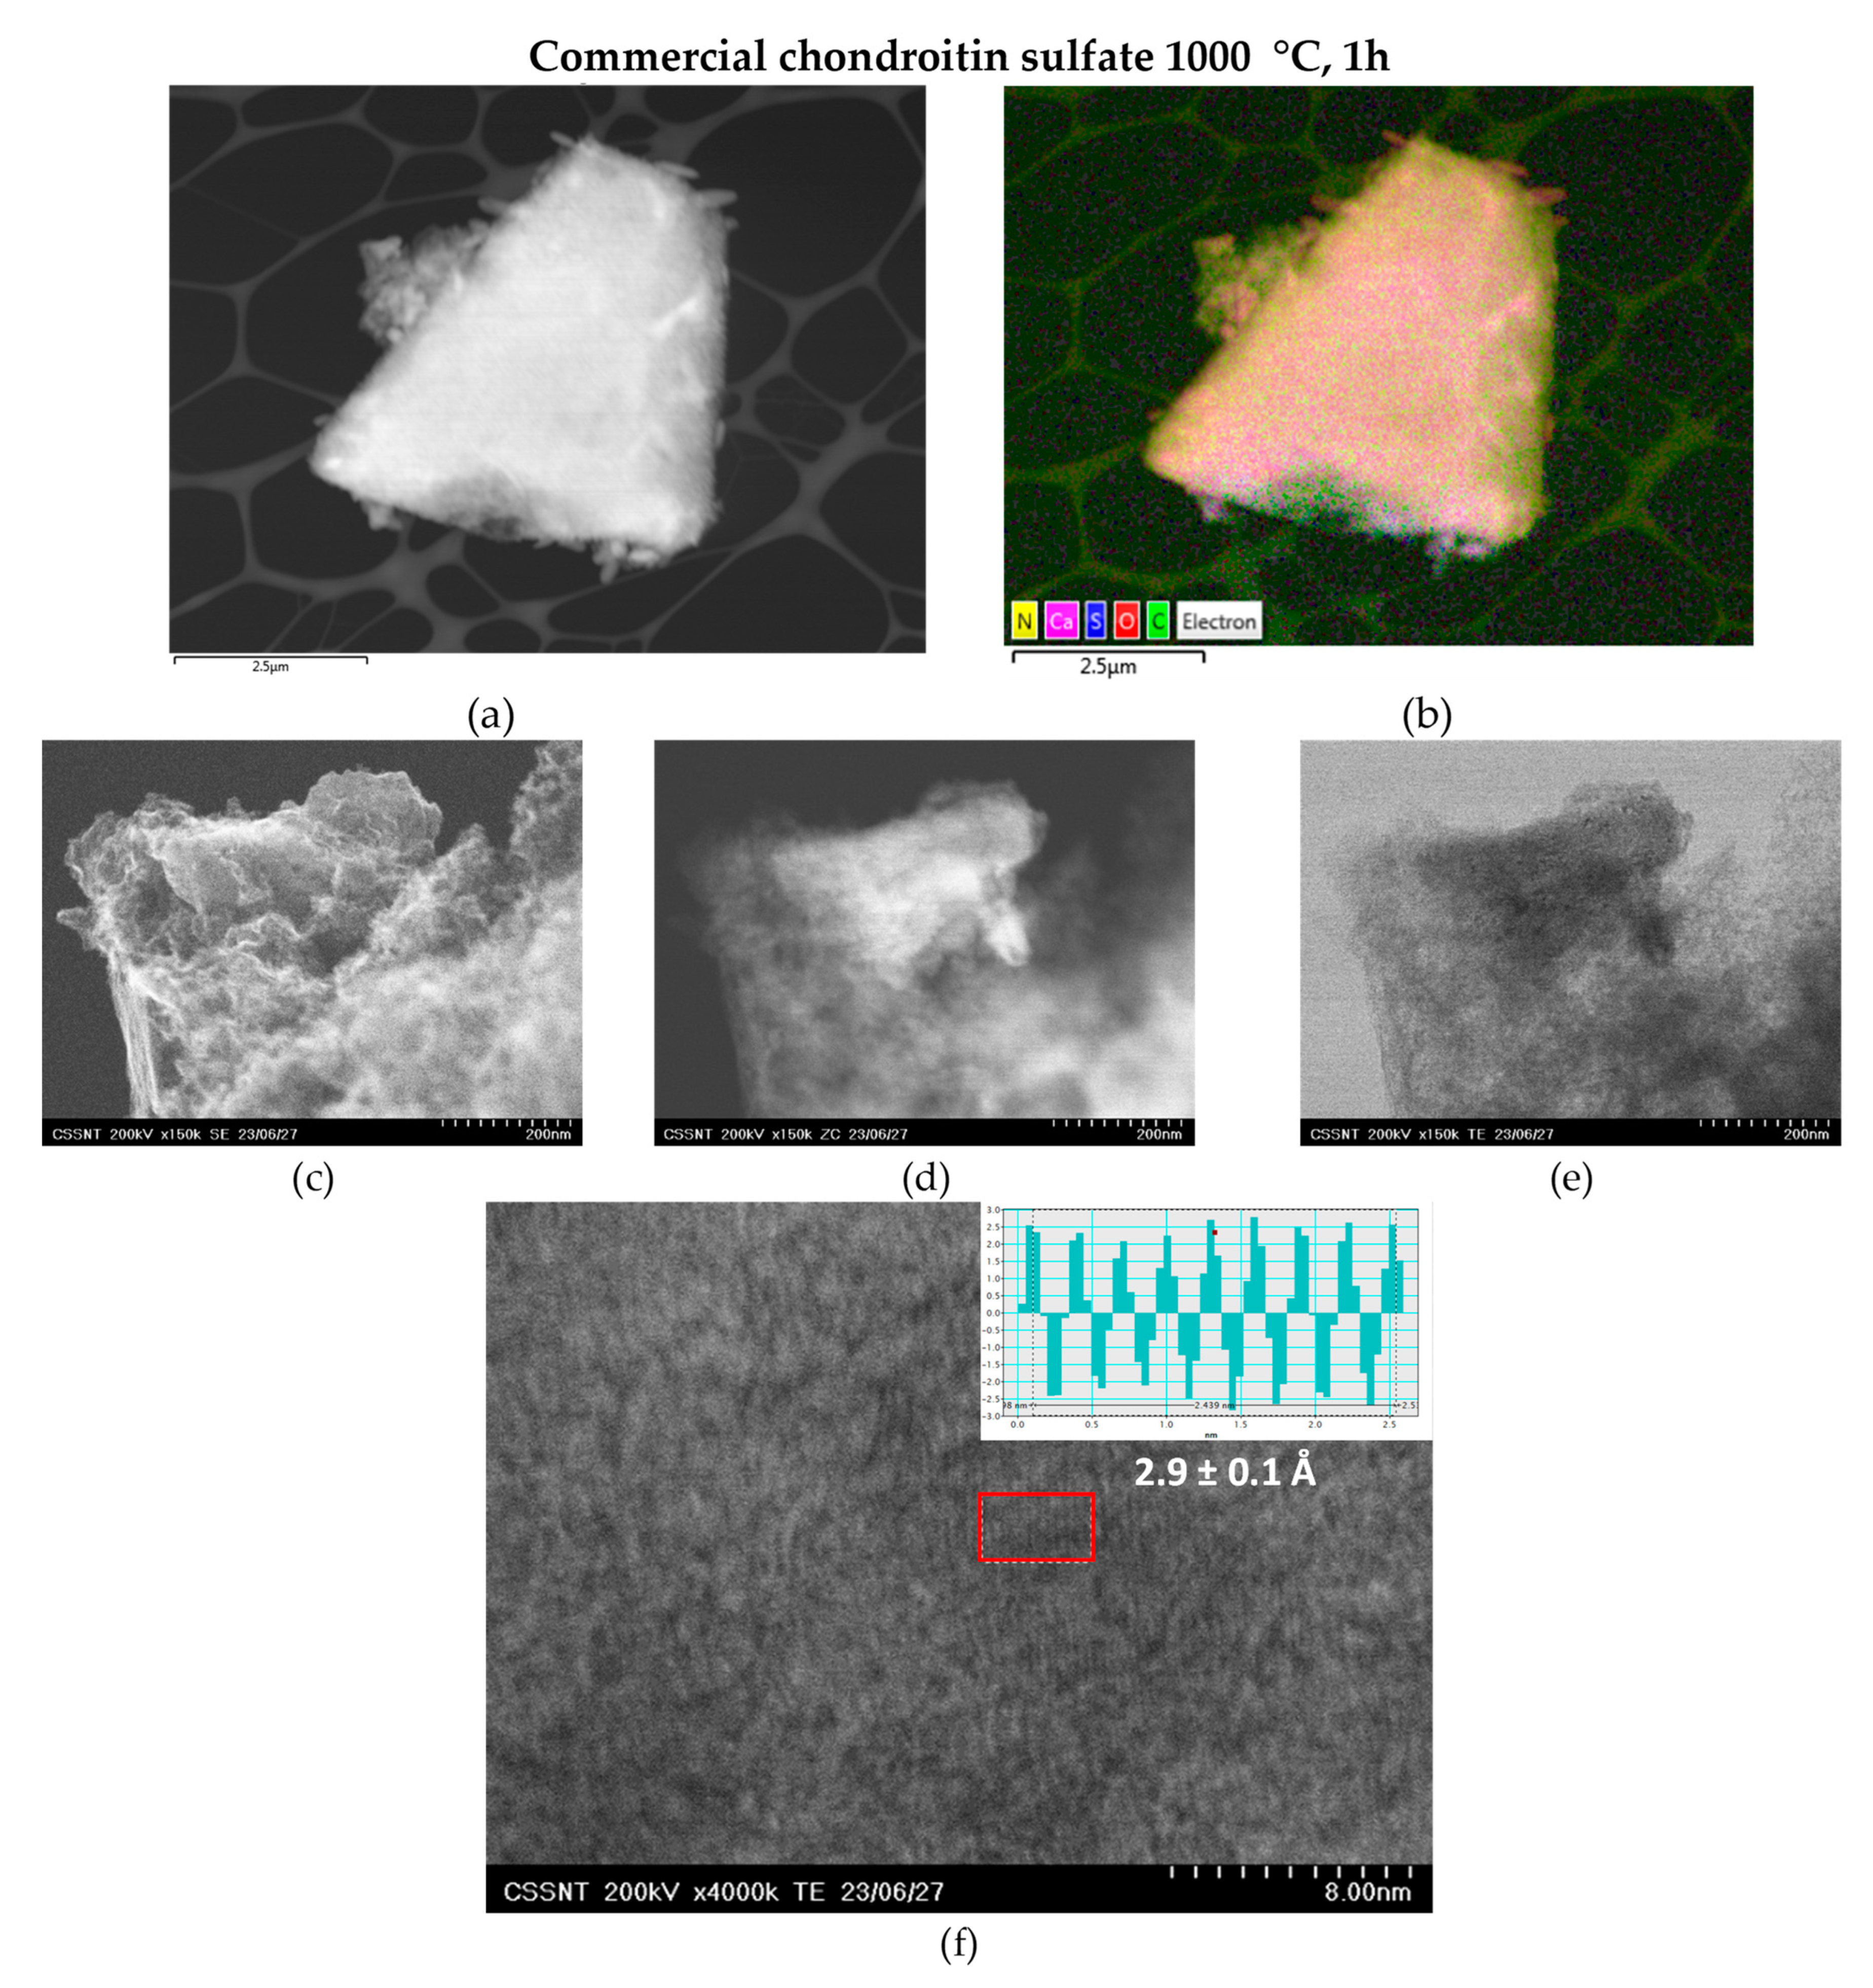
STEM presents several advantages when compared to conventional TEM. One of the most relevant is that it can deploy a focused beam to scan the specimen’s surface and analyze the scattered signal. A high-angle dark-field detector (HAADF) almost eliminates diffraction contrast. It has become the most widely used imaging method in STEM because of its efficiency and ease in interpreting the obtained images [29]. Figure 4, Figure 5 and Figure 6 present the UHR-STEM analysis, with EDX mapping analysis (a), SEM (b), Z-contrast (c), and STEM (d) modes, and HR-STEM with an interplanar distance graph (e) for the three carbonized samples.
The STEM images reveal a three-dimensional porous network for the blue shark and commercial chondroitin sulfate-based carbons at SEM, Z-contrast, and STEM images. On the other hand, the blue shark gelatine-based carbon presents a completely distinct morphology in which overlayered sheets are visible. Regarding the compositional analysis, the EDX mapping evidences the uniform distribution of calcium in the blue shark and commercial chondroitin sulfate carbon-based samples. However, the presence of calcium in the blue shark gelatine sample is not so evident. The results agree with the EDX analysis performed in SEM, wherein clearly, this sample showed the lowest calcium content (Figure S1). Figure 4, Figure 5 and Figure 6 (e) present the HR-STEM analysis with the determination of the interplanar distance (d). The blue shark chondroitin sulfate-based carbon presents a d value of 2.6 ± 0.2 Å, followed by the commercial chondroitin sulfate-based carbon with a d value of 2.9 ± 0.1 Å, while the blue shark gelatine-based carbon presents a d value of 3.4 ± 0.05 Å.
The interplanar distance is the distance between adjacent graphene layers in a stack of graphene sheets. In pure graphene, the interplanar distance is approximately 3.35 Å [30]. This value is often called the “ideal” or “equilibrium” interplanar distance for graphene. However, it is worth noting that the interplanar distance in graphene can be influenced by various factors such as intercalation, strain, and doping. By introducing foreign atoms or molecules between graphene layers or applying mechanical strain, it is possible to modify the interplanar distance [31]. The blue shark gelatine-based carbon is the only material in the study with similar values (3.41 ± 0.05 Å). Both the blue shark and commercial chondroitin sulfate-based carbons present lower values (2.6 ± 0.2 Å and 2.9 ± 0.1 Å, respectively), indicating that the presence of doped atoms (N and O) can change the interplanar distance.

3.4. ATR-FTIR and Raman Spectra Analysis

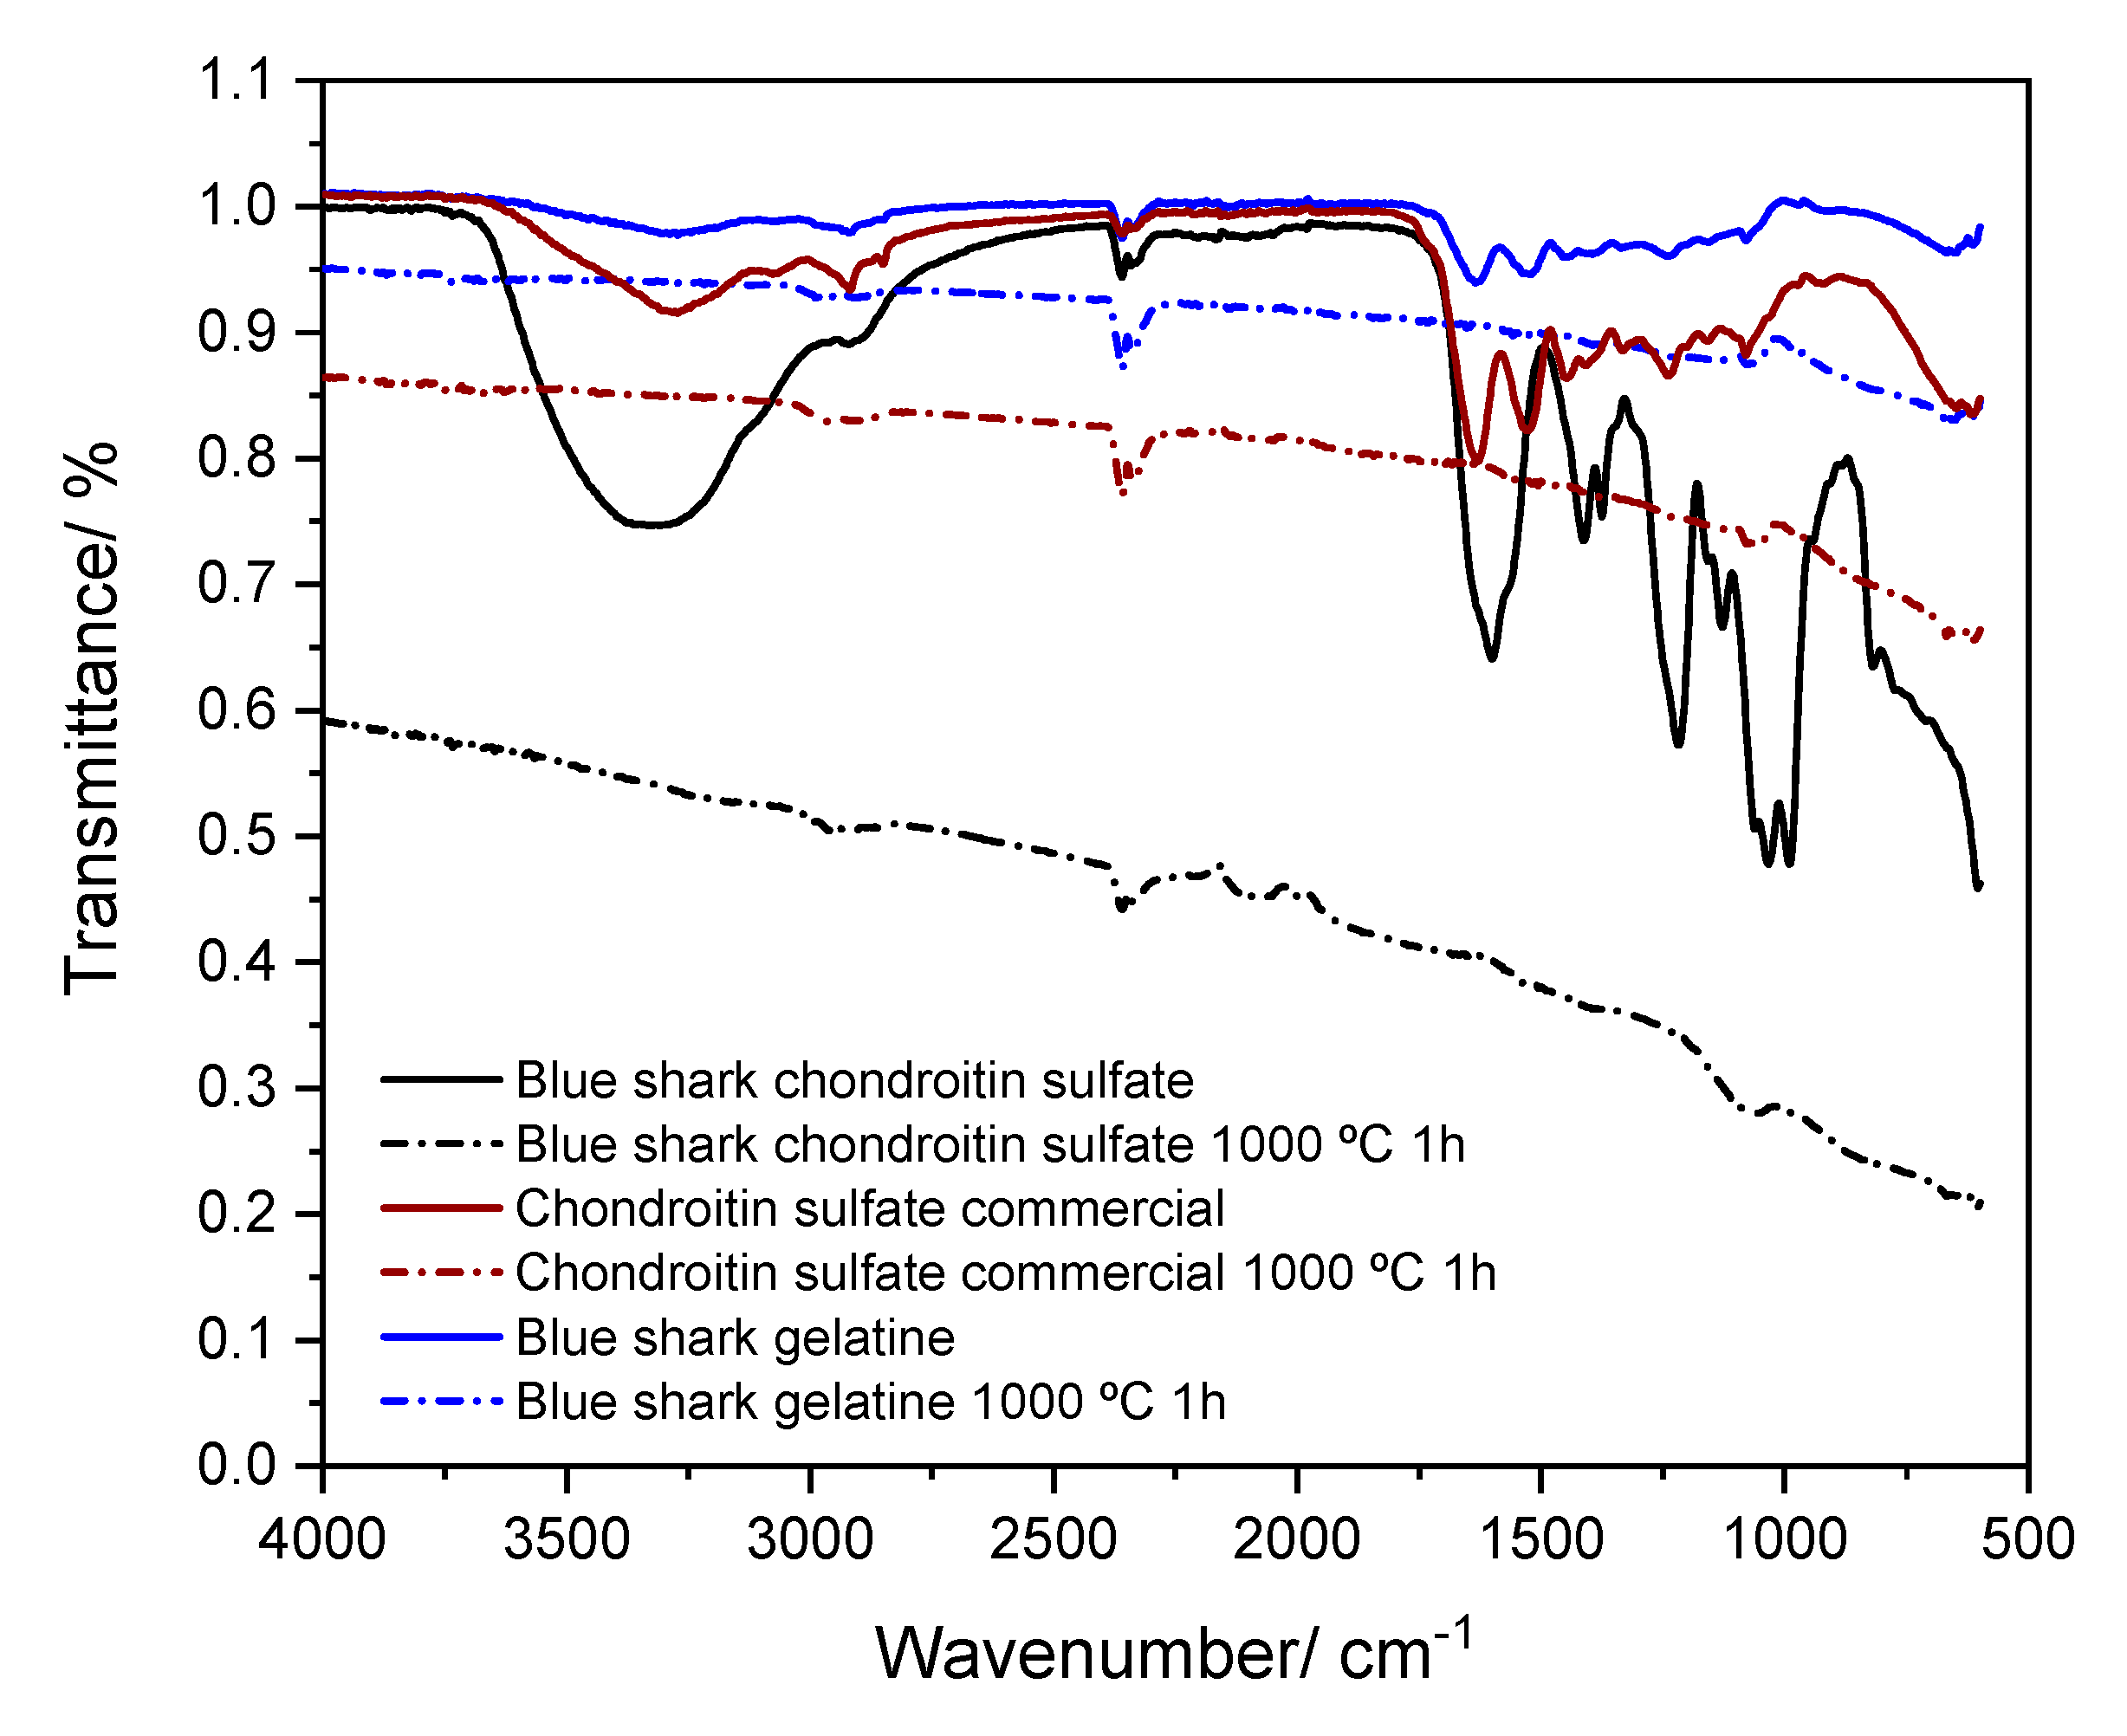
The ATR-FTIR spectra of the blue shark and commercial chondroitin sulfate-based carbons, and the blue shark gelatine-based carbon (as well as their precursors) were studied in the range of 4000–600 cm−1, and are presented in Figure 7.
The spectra of raw blue shark chondroitin sulfate exhibit a clear and notable band between 3500 and 3250 cm−1, which can be assigned to the stretching vibrations of the hydroxyl (-OH) groups [12]. However, this band is absent after the carbonization process. Additionally, the intensity of this peak is less prominent in commercial chondroitin sulfate and blue shark gelatine. A prominent peak at approximately 1000 cm−1 in the raw blue shark chondroitin sulfate corresponds to the stretching vibration of the C-O group. This indicates the presence of oxygen-containing functional groups. These functional groups’ existence contributes to the surface’s hydrophilic nature.
The spectrum of the raw materials reveals a double band between 1089 and 1043 cm−1, with a more noticeable presence in the blue shark chondroitin sulfate. This double band is attributed to the vibration of the =C-O-C bond in the aromatic ether [32]. This same band is also visible in both carbonized samples, albeit with reduced intensity. With low intensity, the C-H bands of aliphatic hydrocarbons can be assigned to the band noted between 2900 and 2800 cm−1 in all three biocarbon samples [33,34]. The peak detected at around 2350 cm−1 arises from the C=C stretching vibrations [35].
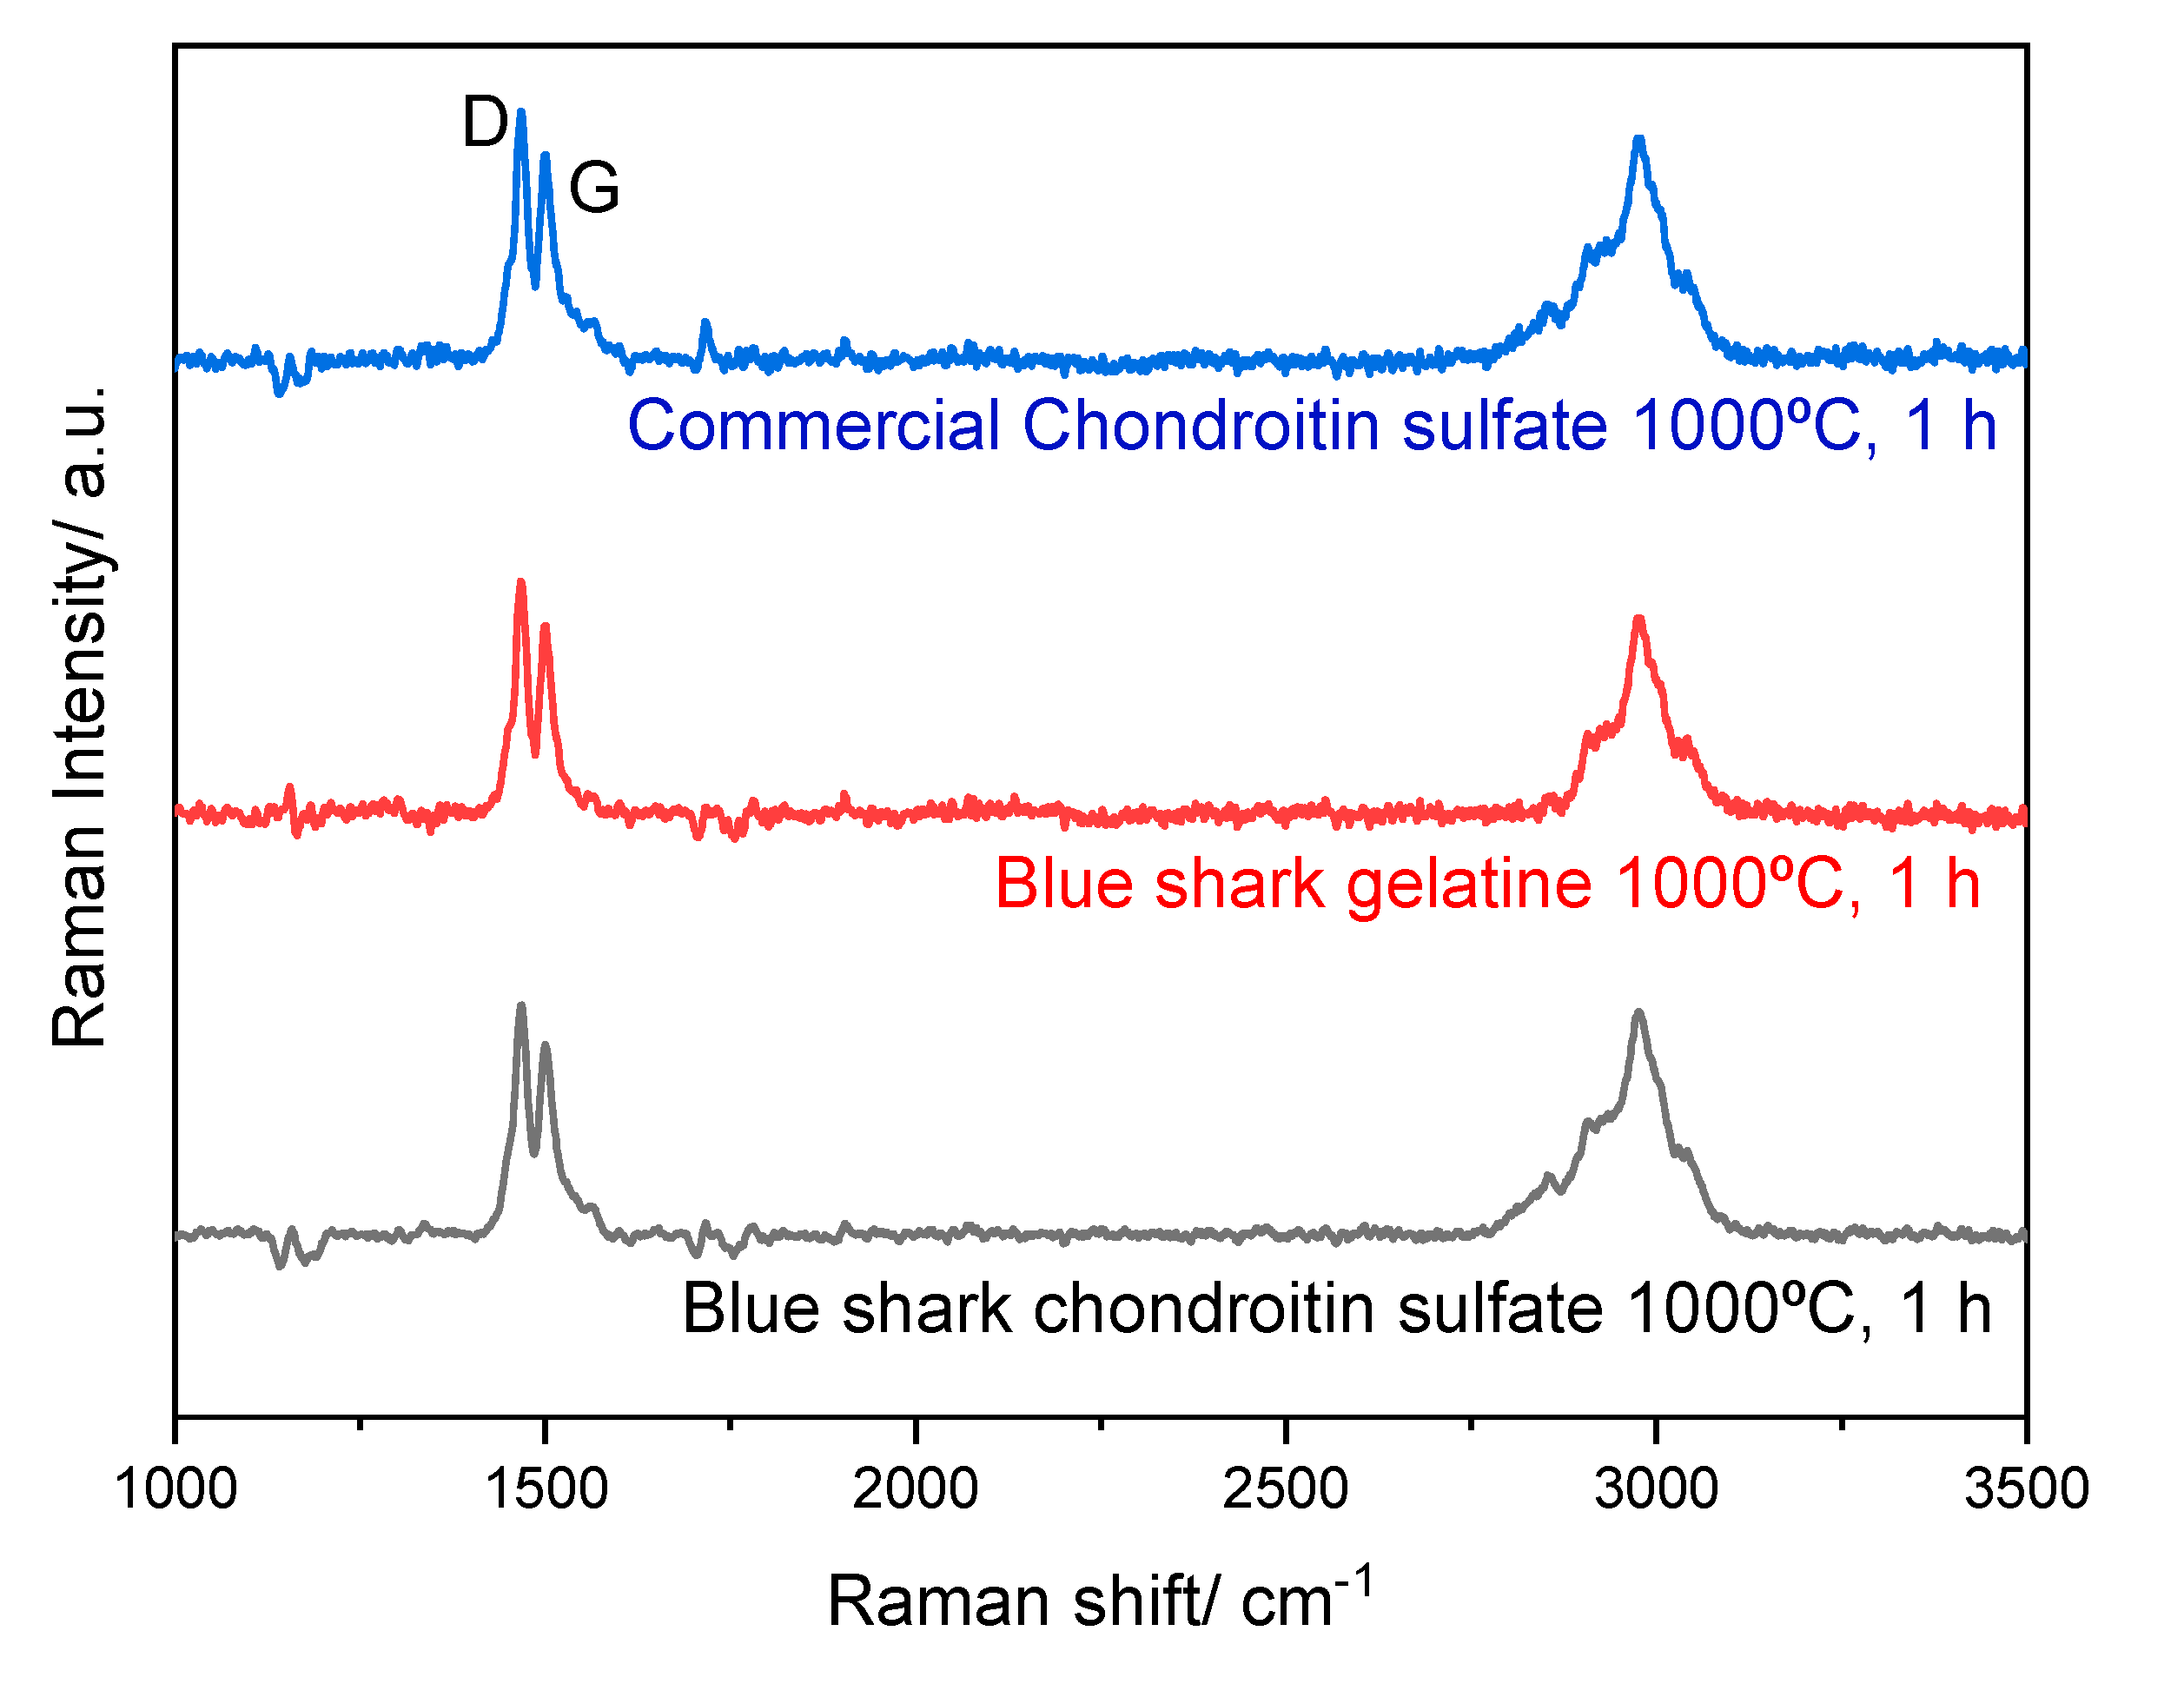
The Raman spectra measured for the three biocarbons are presented in Figure 8. Ilnicka et al. [36] developed nitrogen-rich carbon materials from gelatine precursors showing similar D and G peaks in the first Raman region. The same comparison could not be presented for the chondroitin sulfate-based carbons due to the lack of information in the literature.
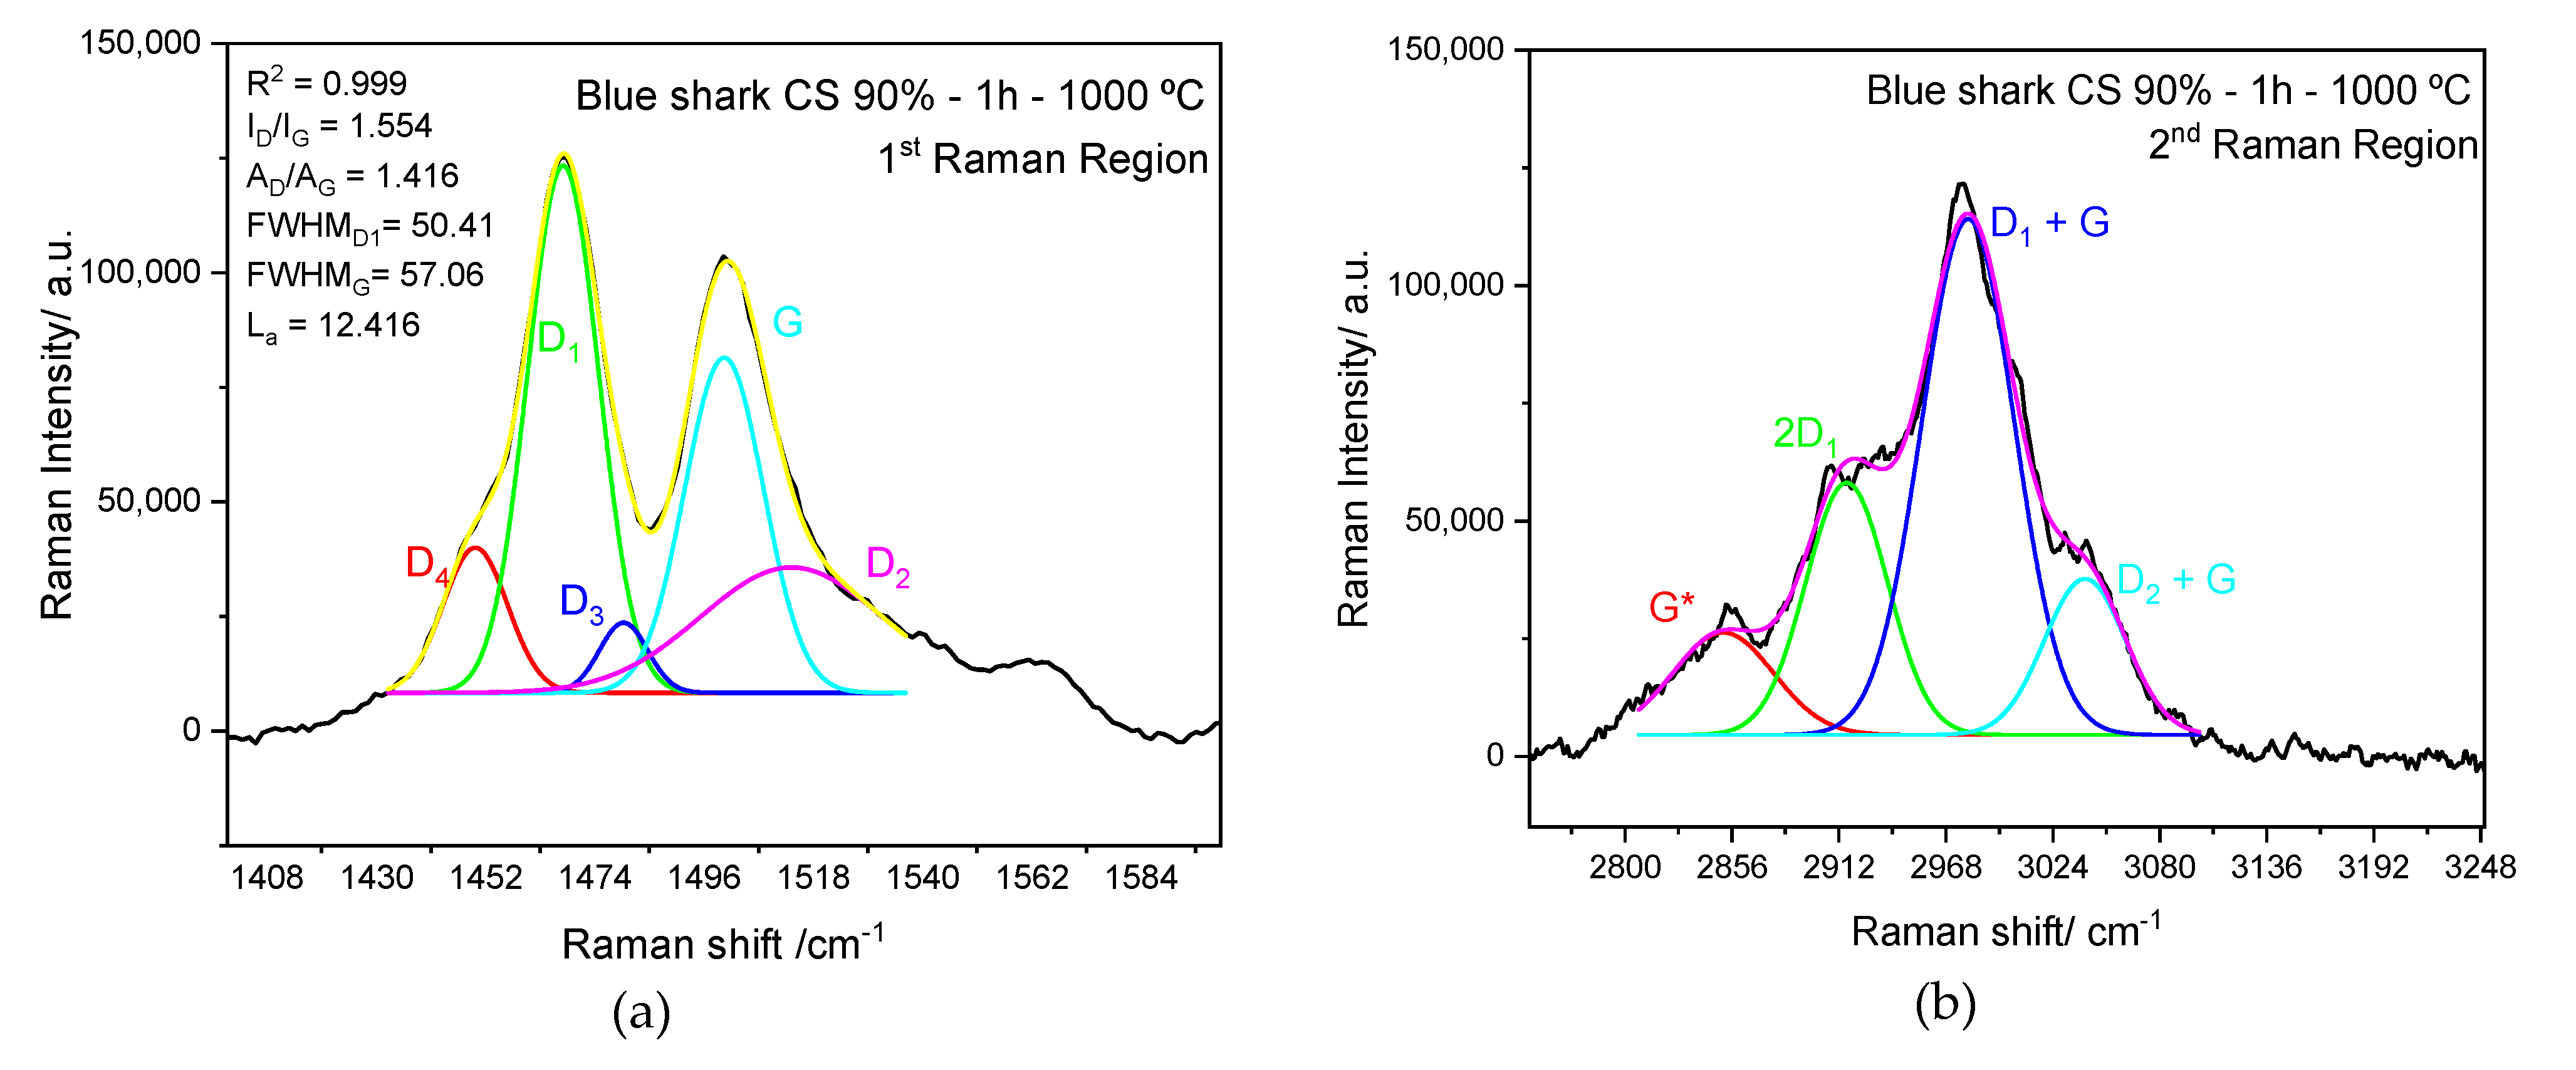
An assessment of the first and second Raman regions for the blue shark chondroitin sulfate-based carbon is presented in Figure 9a,b. The first and second Raman regions for the blue shark gelatine and commercial chondroitin sulfate-based carbons are shown in Figure S5 in Supplementary Materials.
After the deconvolution analysis, different peaks are presented in the first Raman region [37,38,39]. The D1, D2, D3, and D4 (D peaks) correspond to the breathing mode of carbon atoms in graphene or carbon-based materials, and it is associated with defects and disorders in the crystal lattice. The G peak is a prominent feature in the Raman spectrum of carbon-based materials, particularly graphene. It arises from the stretching mode of the carbon-carbon (C-C) bonds in the hexagonal lattice of graphene. The G peak is sensitive to the sp2 hybridization of carbon atoms and is used to determine the number of graphene layers and the level of graphitic carbon in a sample.
In the second Raman region [37,38,39], the D1+G peak combines the D1 peak (related to defects and disorder in carbon-based materials) and the G peak (associated with the stretching mode of carbon-carbon bonds in the hexagonal lattice of graphene). The 2D1 peak provides information about the number of layers and the stacking order of graphene sheets. The D2+G peak results from the D2 peak (related to defects and disorder) and the G peak. It also indicates the coexistence of disorder and graphitic carbon in the material. The G* peak is a variation of the G peak that arises when graphene is under strain or in a highly doped state.
Figure 9a displays the first Raman region subjected to Gaussian fit deconvolution analysis. The appearance of the D band around 1470 cm−1 suggests the presence of structural defects and a disordered carbon structure. In contrast, the G band observed at 1510 cm−1 indicates the presence of structural graphitic order in the material [40,41].
The standard Raman shifts for carbon, the D peak around 1350 cm−1 and the G peak around 1582 cm−1, are commonly observed in Raman spectra of carbon materials such as graphene and carbon nanotubes. However, it is essential to note that the exact Raman shift values can vary depending on various factors, leading to differences in observed values, as can be observed in Figure 9a.
Several factors can contribute to variations in Raman shift values for carbon materials, from the chemical composition of the material and the presence of strain and defects.
The chemical composition and structure of the carbon material can influence the Raman shifts. Graphene, amorphous carbon, and carbon nanotubes, for example, can exhibit variations in peak positions due to their distinct lattice structures and levels of disorder [37]. The presence of strain or defects in the carbon lattice can cause shifts in the Raman peaks. Strain can arise from mechanical deformation or interactions with the substrate, while defects can result from impurities, lattice vacancies, or edges. It is also necessary to refer to the instrumental effect, in which laser power, wavelength, and spectral resolution can influence the Raman shifts. Calibration errors or differences in instrument configurations can contribute to discrepancies in the observed peak positions [42].
Even though these are not the only factors that can affect Raman peak positions, it is necessary to consider that these peaks can present different Raman shifts (cm−1).
Table 2 presents the intensity ratio between the two characteristic bands (ID/IG) mentioned earlier and calculated using the D1 and G peaks from the first Raman region. The Blue shark gelatine-based carbon has a higher ID/IG ratio (2.11) than the blue shark chondroitin sulfate-based carbon, which has a ratio of 1.55, with crystallite sizes of 9 and 12 nm, respectively.
Comparing the two chondroitin sulfate samples, the blue shark source sample exhibits a lower ID/IG value of 1.56 ± 0.02 and a higher crystallite size of 12.40 nm in contrast to the commercial version, which has an ID/IG ratio of 1.84 ± 0.06 and an La value of 10.29 nm. A decrease in the ID/IG ratio may indicate an increase in the graphitization degree [43]. The ID/IG for the blue shark gelatine-based carbon is 2× higher (2.09 ± 0.04) compared to the values presented by Ilnicka et al. [36] (0.96–0.97), probably reflecting distinct characteristics in the gelatine precursors.
The observed changes in crystallinity among the three analyzed samples have the potential to cause modifications in the physical properties of the biocarbon. Conversely, increasing crystallinity can be associated with improving the reported capacitance value [44].
In particular, the comparison between chondroitin sulfate derived from natural and commercial sources shows a noticeable difference between the two carbonized samples. The presence of residual compounds in the blue shark chondroitin sulfate sample could explain the crystallinity disparity between the two samples.

3.5. XRD Analysis

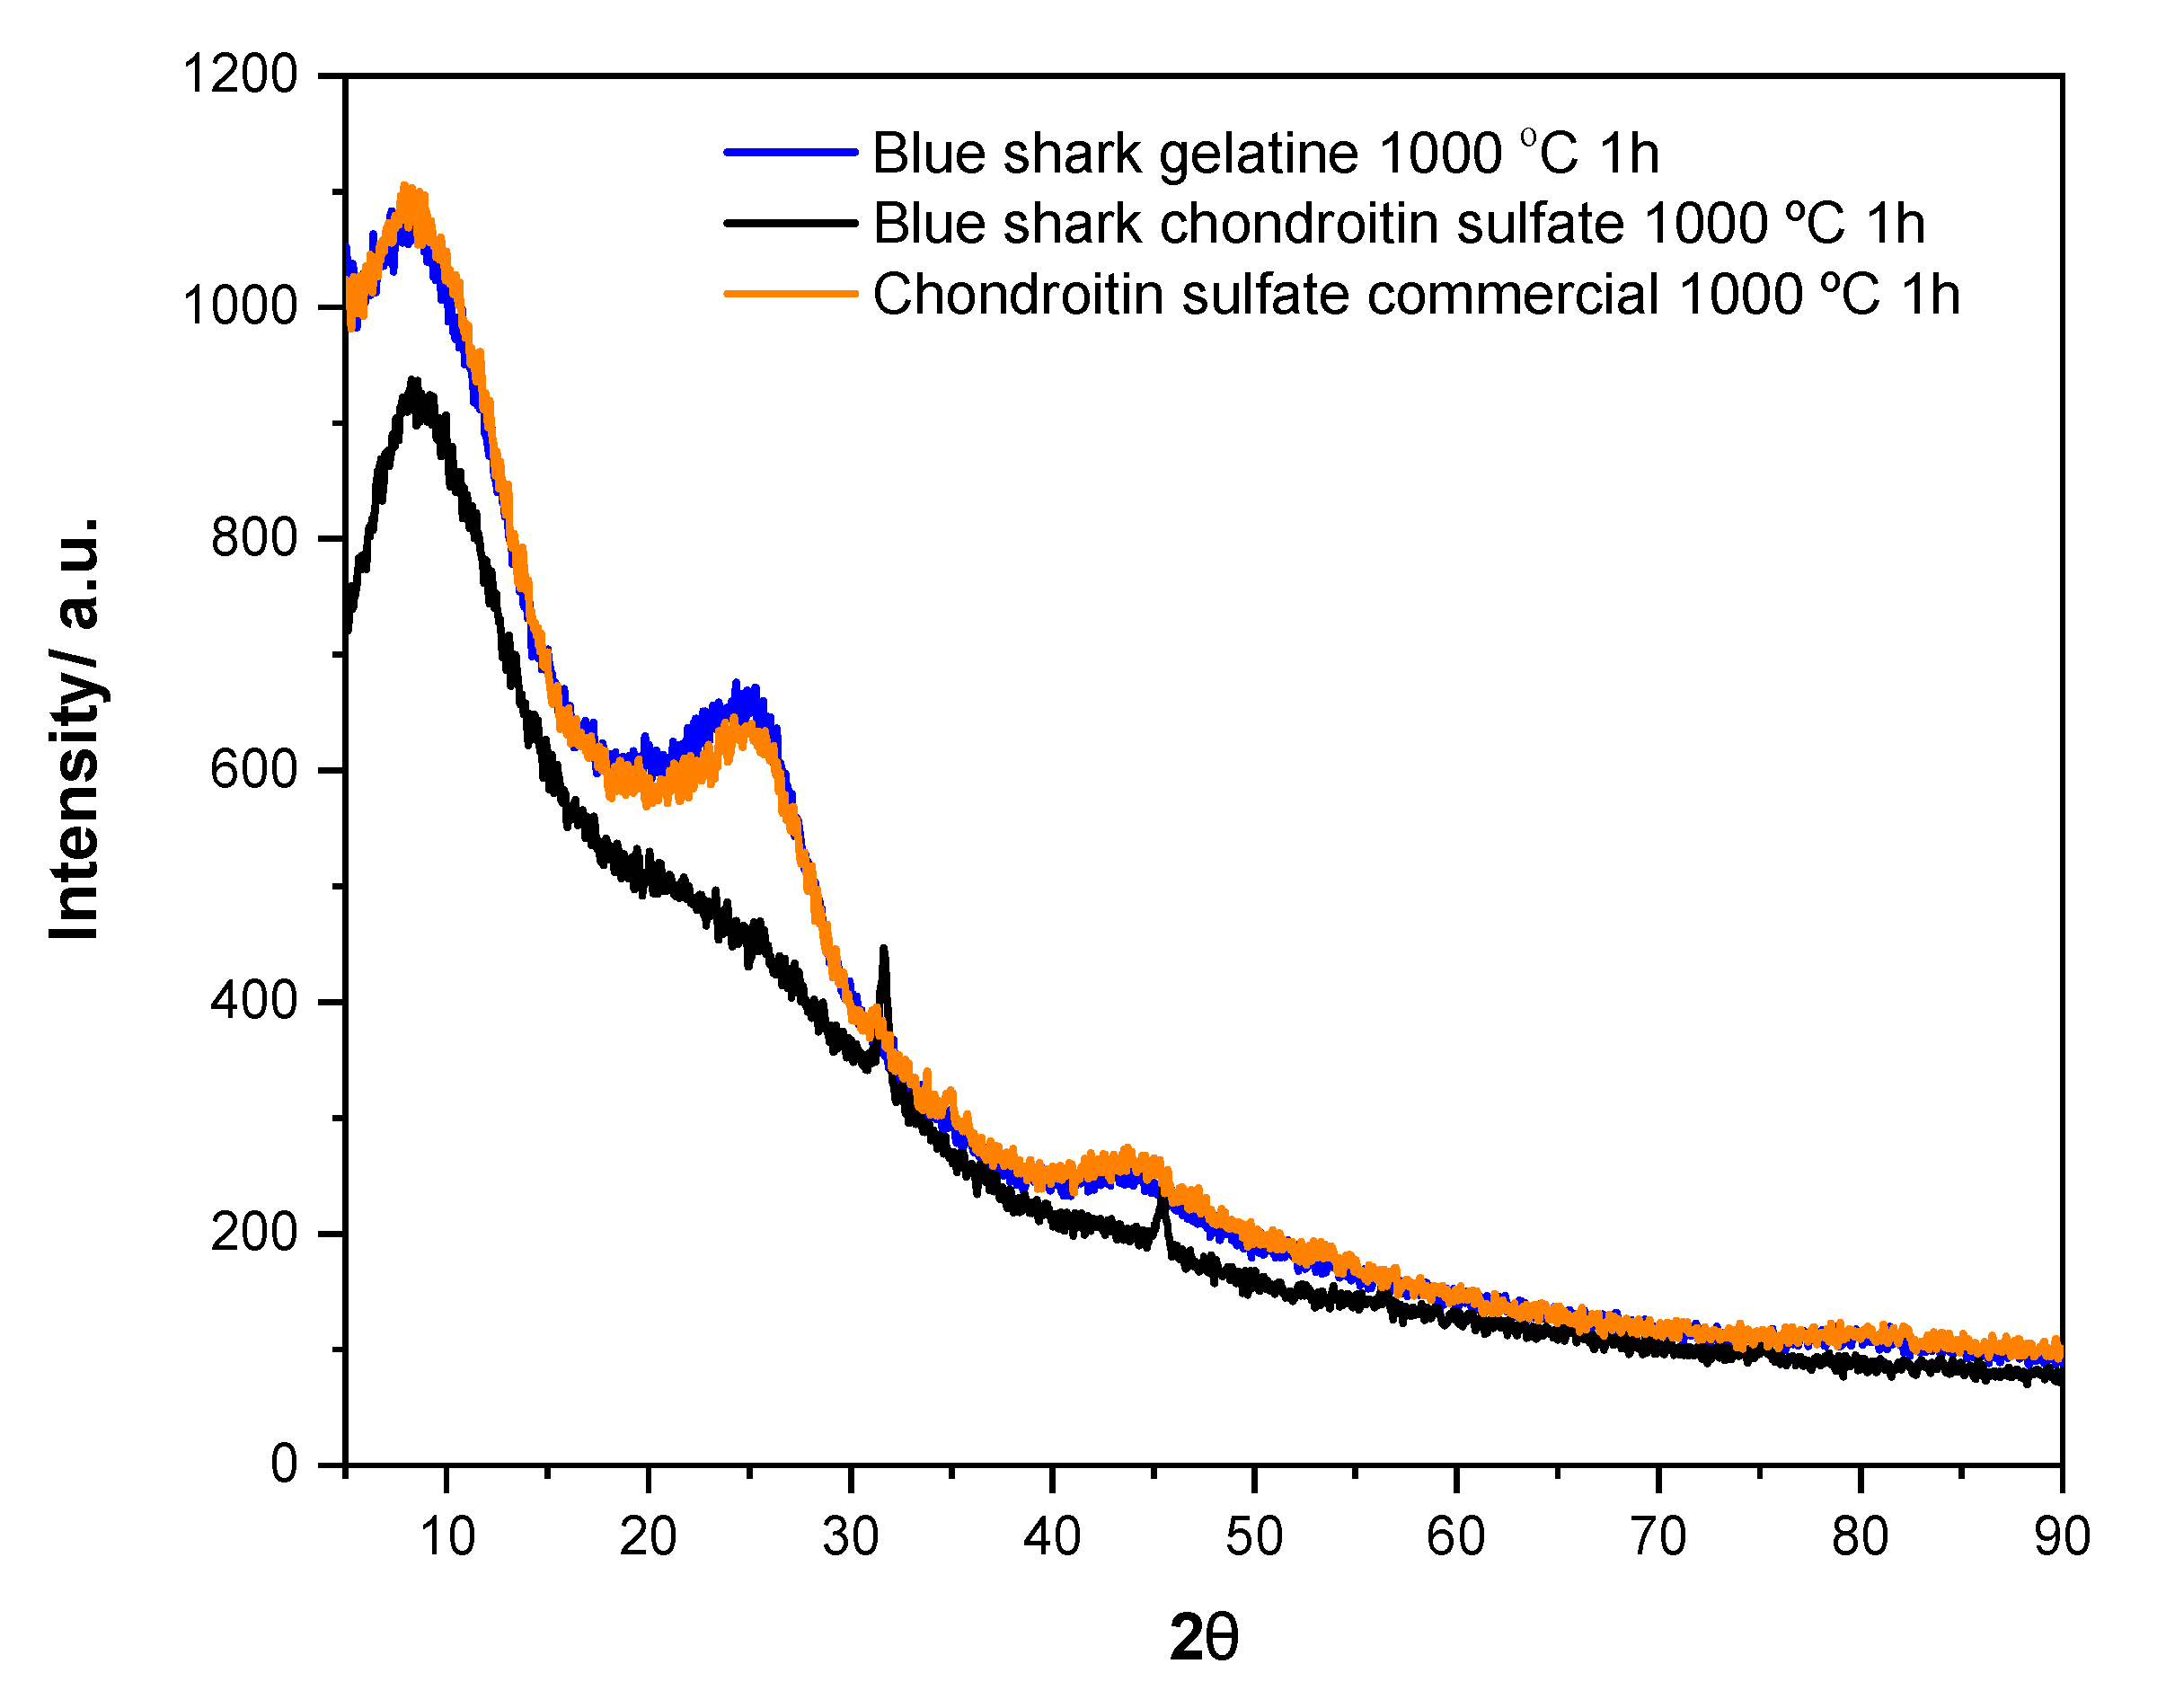
Figure 10 shows the XRD patterns of the three biocarbons. The biocarbon samples exhibit similar X-ray diffraction patterns.
The three samples display a structure that lacks a definite pattern, known as an amorphous structure. They also exhibit broad reflection peaks at approximately 8, 26, and 45 degrees. Specifically, the peaks observed at 2θ values of 24 and 44/45 degrees match the (002) and (100) planes, respectively. These findings have been supported by previous research [45,46]. The broad diffraction pattern observed for the (002) plane indicates the presence of graphene sheets stacked parallel to each other in the carbon materials [47].
Additionally, the presence of the (100) plane suggests the existence of sp2 hybridized carbon arranged in a honeycomb structure. This arrangement enhances the material’s conductivity [48,49]. These characteristics are expected to impact the electrochemical properties and the morphology of the composite electrodes made from the biocarbon material and the interface with the electrolyte.
Table S2 reviews the peaks obtained from the diffraction pattern of the three biocarbons, all carbonized for 1 h at 1000 °C. Notably, the blue shark chondroitin sulfate sample exhibits a significantly higher intensity in the (100) plane, indicating a higher density of pores within the solid-state graphitic carbon [30,50]. The interlayer spacing, calculated from the (002) plane, is 2.8 Å for chondroitin sulfate derived from blue shark and 3.5 Å for the commercial source. For blue shark gelatine, the value is 3.5 Å. The interlayer spacing for pure graphene is 3.35 Å [51], with the blue shark chondroitin sulfate-based carbon displaying a lower value.
Determining the interlayer spacing of a material, such as carbon, through X-ray diffraction (XRD) can provide valuable information about its structure. However, the interlayer spacing calculation accuracy depends on several factors, including the broadness of the XRD peak. XRD is based on the principle of Bragg’s Law, which relates the X-ray diffraction angles to the crystal lattice’s interplanar spacing. In the case of layered materials like graphite or graphene, the interlayer spacing can be determined by measuring the angle at which the diffraction peak occurs [52].
When the XRD peak is broad, it suggests that the material has a high degree of disorder or a relatively large distribution of interlayer spacing. In such cases, accurately determining the interlayer spacing becomes more challenging due to the overlapping diffraction patterns. The broadening can result from various factors, including stacking faults, lattice strain, or the disordered stacking of layers [53].
The XRD peak should ideally be sharp and well-defined to obtain accurate interlayer spacing calculations. A broad peak indicates that the interlayer spacing may not be accurately determined from the diffraction pattern alone. The interplanar distance values determined by XRD agree with those obtained from the UHR-STEM analysis. For blue shark-based samples, the d spacing is nearly identical; for the commercial sample, the interplanar spacing obtained via UHR-STEM is significantly lower. Considering the broad character of the peaks, determining the interplanar distance may not be as accurate using the X-ray diffraction technique as it is with UHR-STEM. A comparison between the two methods can be observed in Table 3.

3.6. BET Analysis

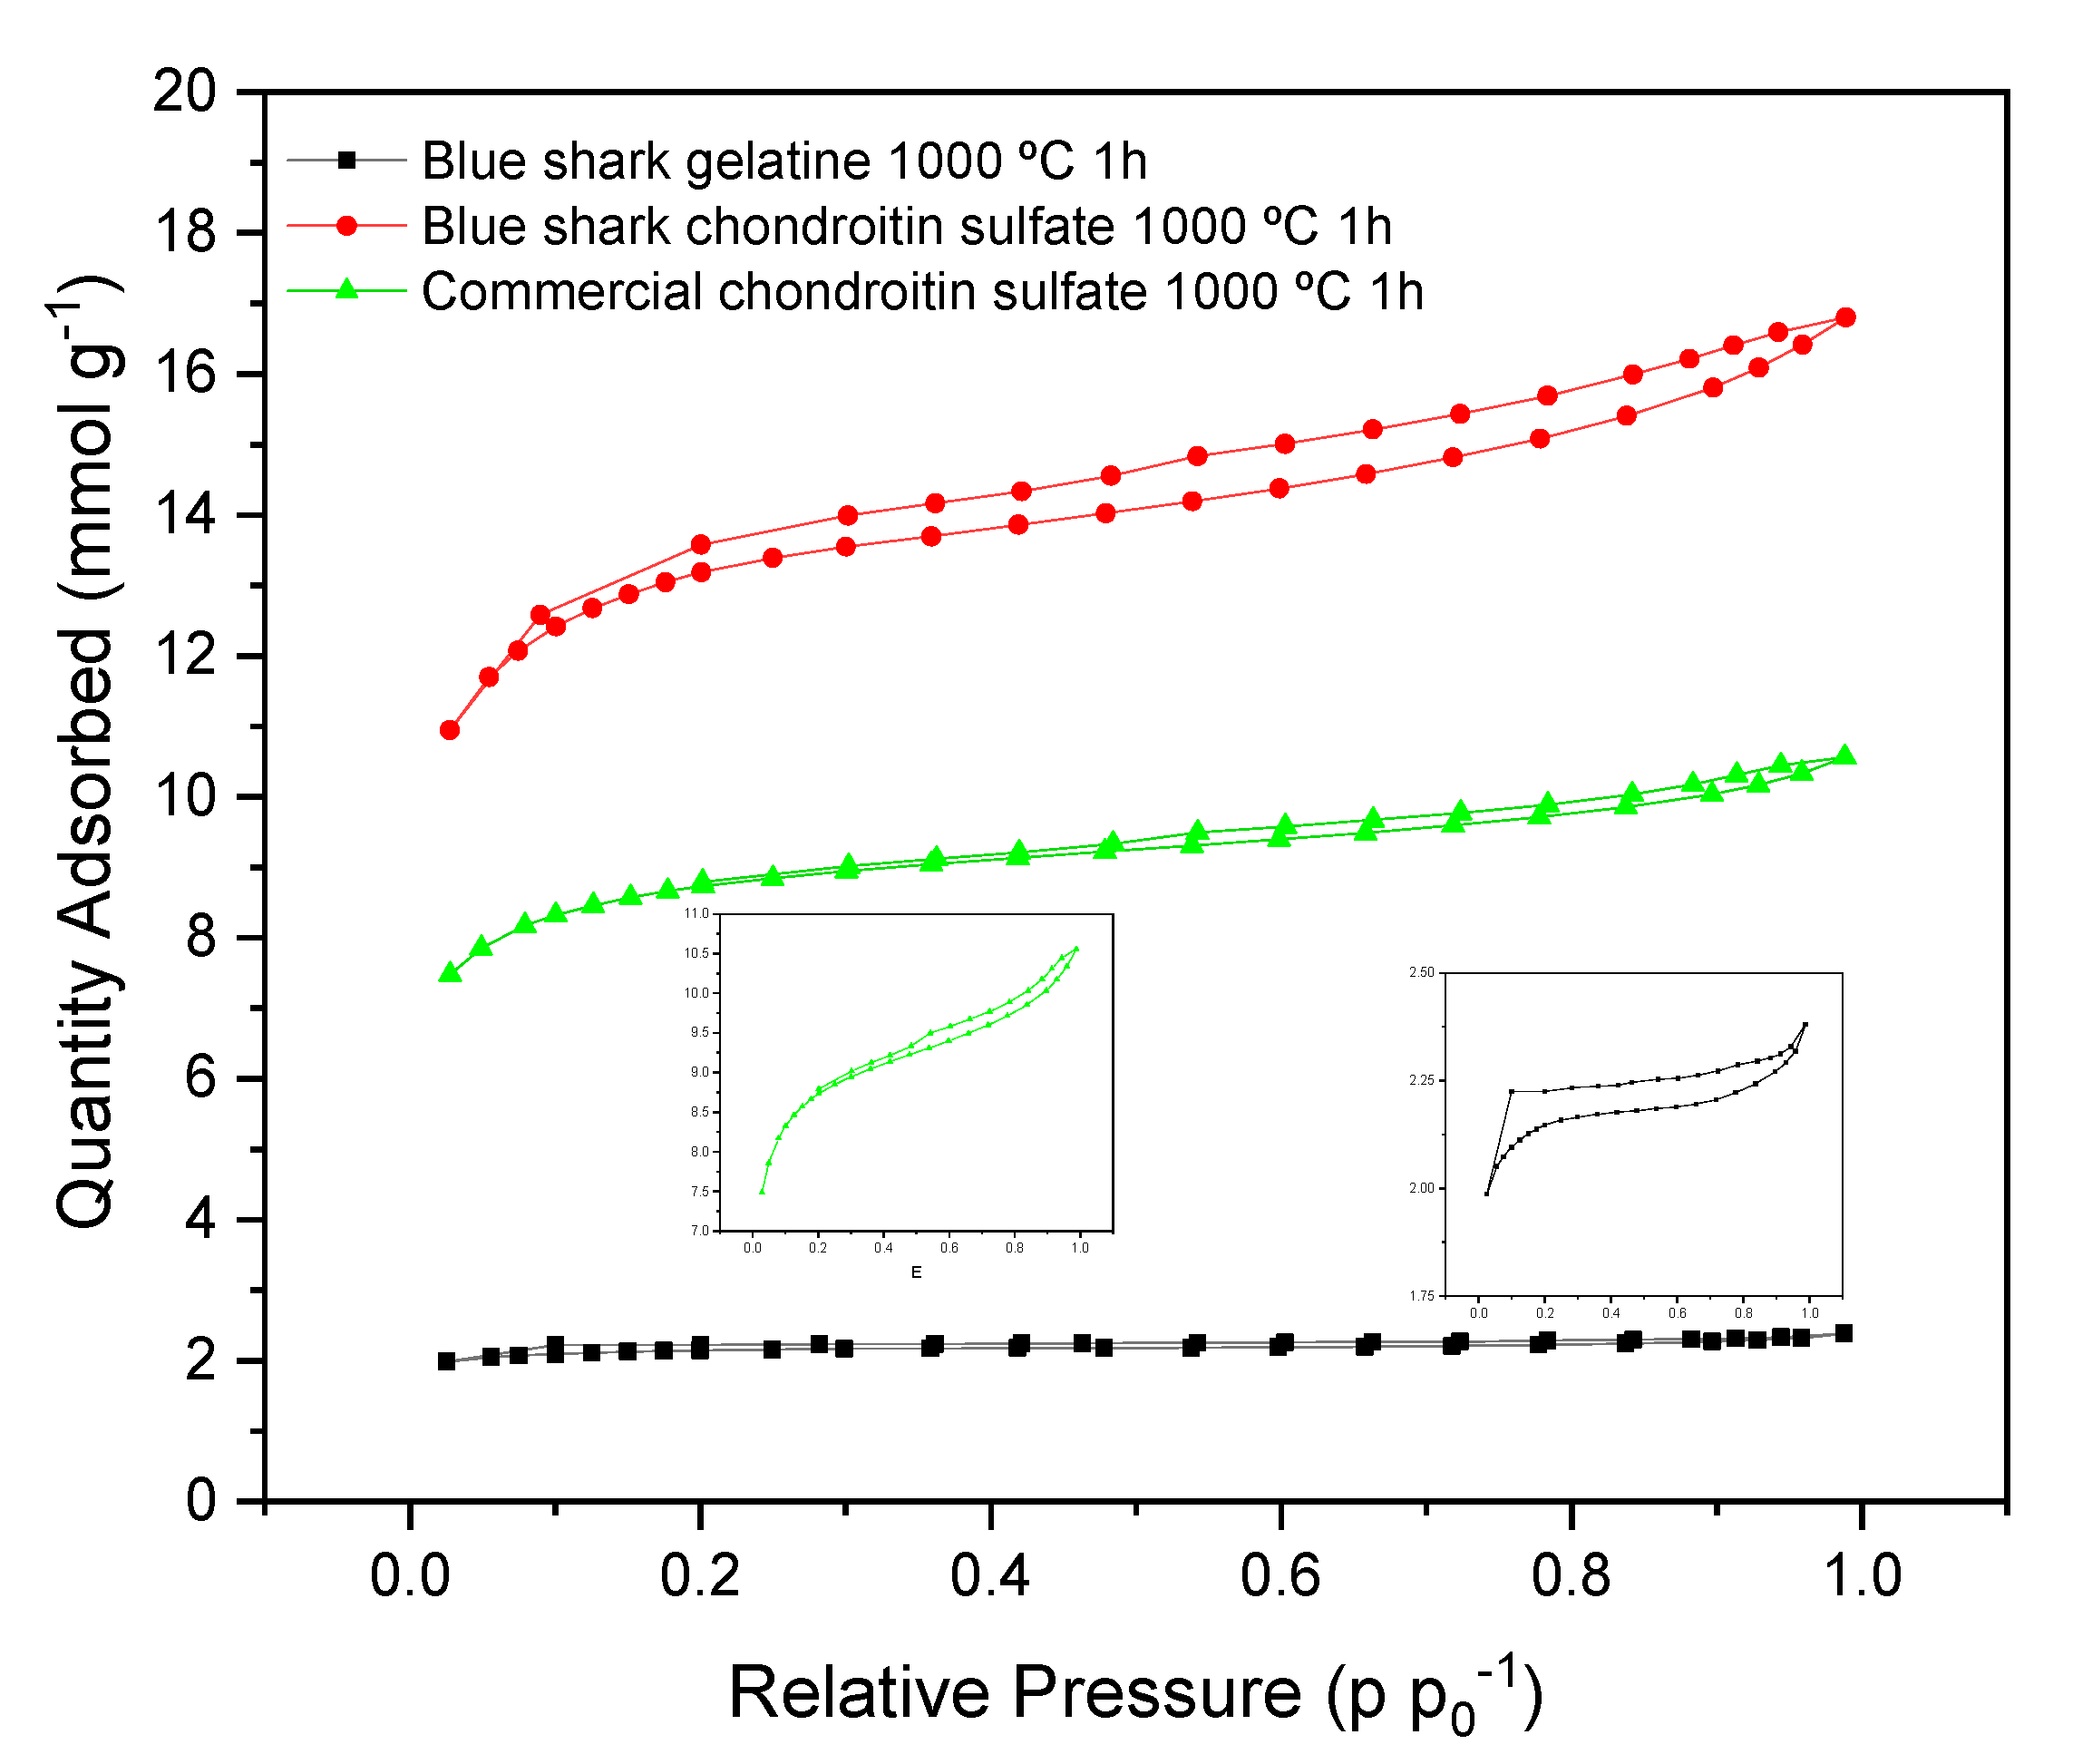
The N2 adsorption/desorption isotherms for the blue shark-based carbons (chondroitin sulfate and gelatine) and the commercial chondroitin sulfate-based carbon are shown in Figure 11. The isotherms of both samples correspond to Type IV classification based on the Brunauer, Deming, and Teller (BDT) classification system [54]. These isotherms display a hysteresis loop attributed to capillary condensation in the mesopores, and a saturation uptake at higher P/P0 values.
Table 4 reviews the BET surface area, microporous and mesoporous volume, total pore volume, and mean pore diameter for the three biocarbons. The investigation reveals that the chondroitin sulfate-based carbon derived from blue shark exhibits a BET surface area of ~135 m2 g−1 and a pore diameter of 1.44 nm, compared to the ~76 m2 g−1 and 1.11 nm from the commercial precursor. On the other side, the blue shark gelatine-based carbon presents the lowest values, ~30 m2 g−1 and 0.87 nm, respectively.
The obtained values indicate that the precursors’ nature can significantly affect the porosity of the carbon materials, allowing the enhancement of their characteristics.
As previously stated, Table S1 presents the effect of time and temperature on the SBET results. For the three studied carbon precursors, optimal parameters were obtained, showing a maximum value of SBET. The trend of an increase and then a decrease in specific surface area (SBET) with carbonization time can be attributed to changes in the structure and chemical components of the carbon material during the carbonization process. These effects rely on several facts.
During carbonization, the carbon material undergoes a structural transformation as volatile components, such as hydrogen, oxygen, and nitrogen, are progressively removed, forming a more graphitic carbon structure. With shorter carbonization times, the removal of volatile components may not be completed, resulting in a partially carbonized material with more amorphousness. This can increase the specific surface area, as the amorphous carbon structure possesses a more significant number of surface sites and defects that contribute to the higher surface area. As carbonization time increases, the remaining volatile components are further expelled, and the carbon structure becomes more graphitic and ordered [55]. This increased graphitization leads to the growth of larger graphitic domains, which can reduce the overall surface area, causing a decrease in SBET. The chemical composition of the carbon material can significantly influence its properties. With shorter carbonization times, a higher content of non-carbon elements, such as oxygen and hydrogen, may be present due to incomplete removal. These elements can introduce functional groups and surface functionalities, increasing the surface area through increased surface roughness and oxygen-containing groups [56]. As the carbonization time increases, these non-carbon elements are gradually eliminated, resulting in a decrease in the concentration of surface functional groups and an associated reduction in specific surface area. The carbonization process affects the formation and development of the pore structure within the carbon material. During the initial stages of carbonization, as volatile components are expelled, the material undergoes expansion and the formation of small micropores. This expansion and the presence of volatile species can contribute to a higher specific surface area. However, as carbonization progresses, the growth of graphitic domains can lead to the closure or coalescence of smaller pores, forming larger micropores or mesopores. These larger pores may have a reduced surface area compared to the initial small micropores, leading to a decrease in specific surface area [57,58].

3.7. Electrochemical Characterization

The functioning of carbon composite electrodes with a high surface area in a supercapacitor setup depends on developing an electrochemical double layer at the boundary between the electrode and the electrolyte. The double layer enables enhanced adsorption and desorption of ions from the electrolyte due to the larger surface area. A cyclic voltammetry analysis was carried out to evaluate the electrochemical performance of the three carbon composite electrodes and determine their stability compared to a reference electrode made of silver wire, through a three-electrode cell (a half-cell setup). This setup allows an accurate measurement due to the presence of a reference electrode and good control, which minimizes unwanted side reactions. This ensures better control over the reaction kinetics due to the separation of the counter and working electrodes. Some limitations also need to be considered when moving from a complex setup, and when applying the setup in a real system. The two-electrode setup (full-cell setup) is an important way of evaluating how the electrode–electrolyte system behaves in setup that closely mimics commercial supercapacitors. However, in this work, the authors focused on the study in a three-electrode setup to understand the electrode (coated carbon materials)–electrolyte interface. In the future, the full-cell configuration will be properly addressed in the scale-up process.
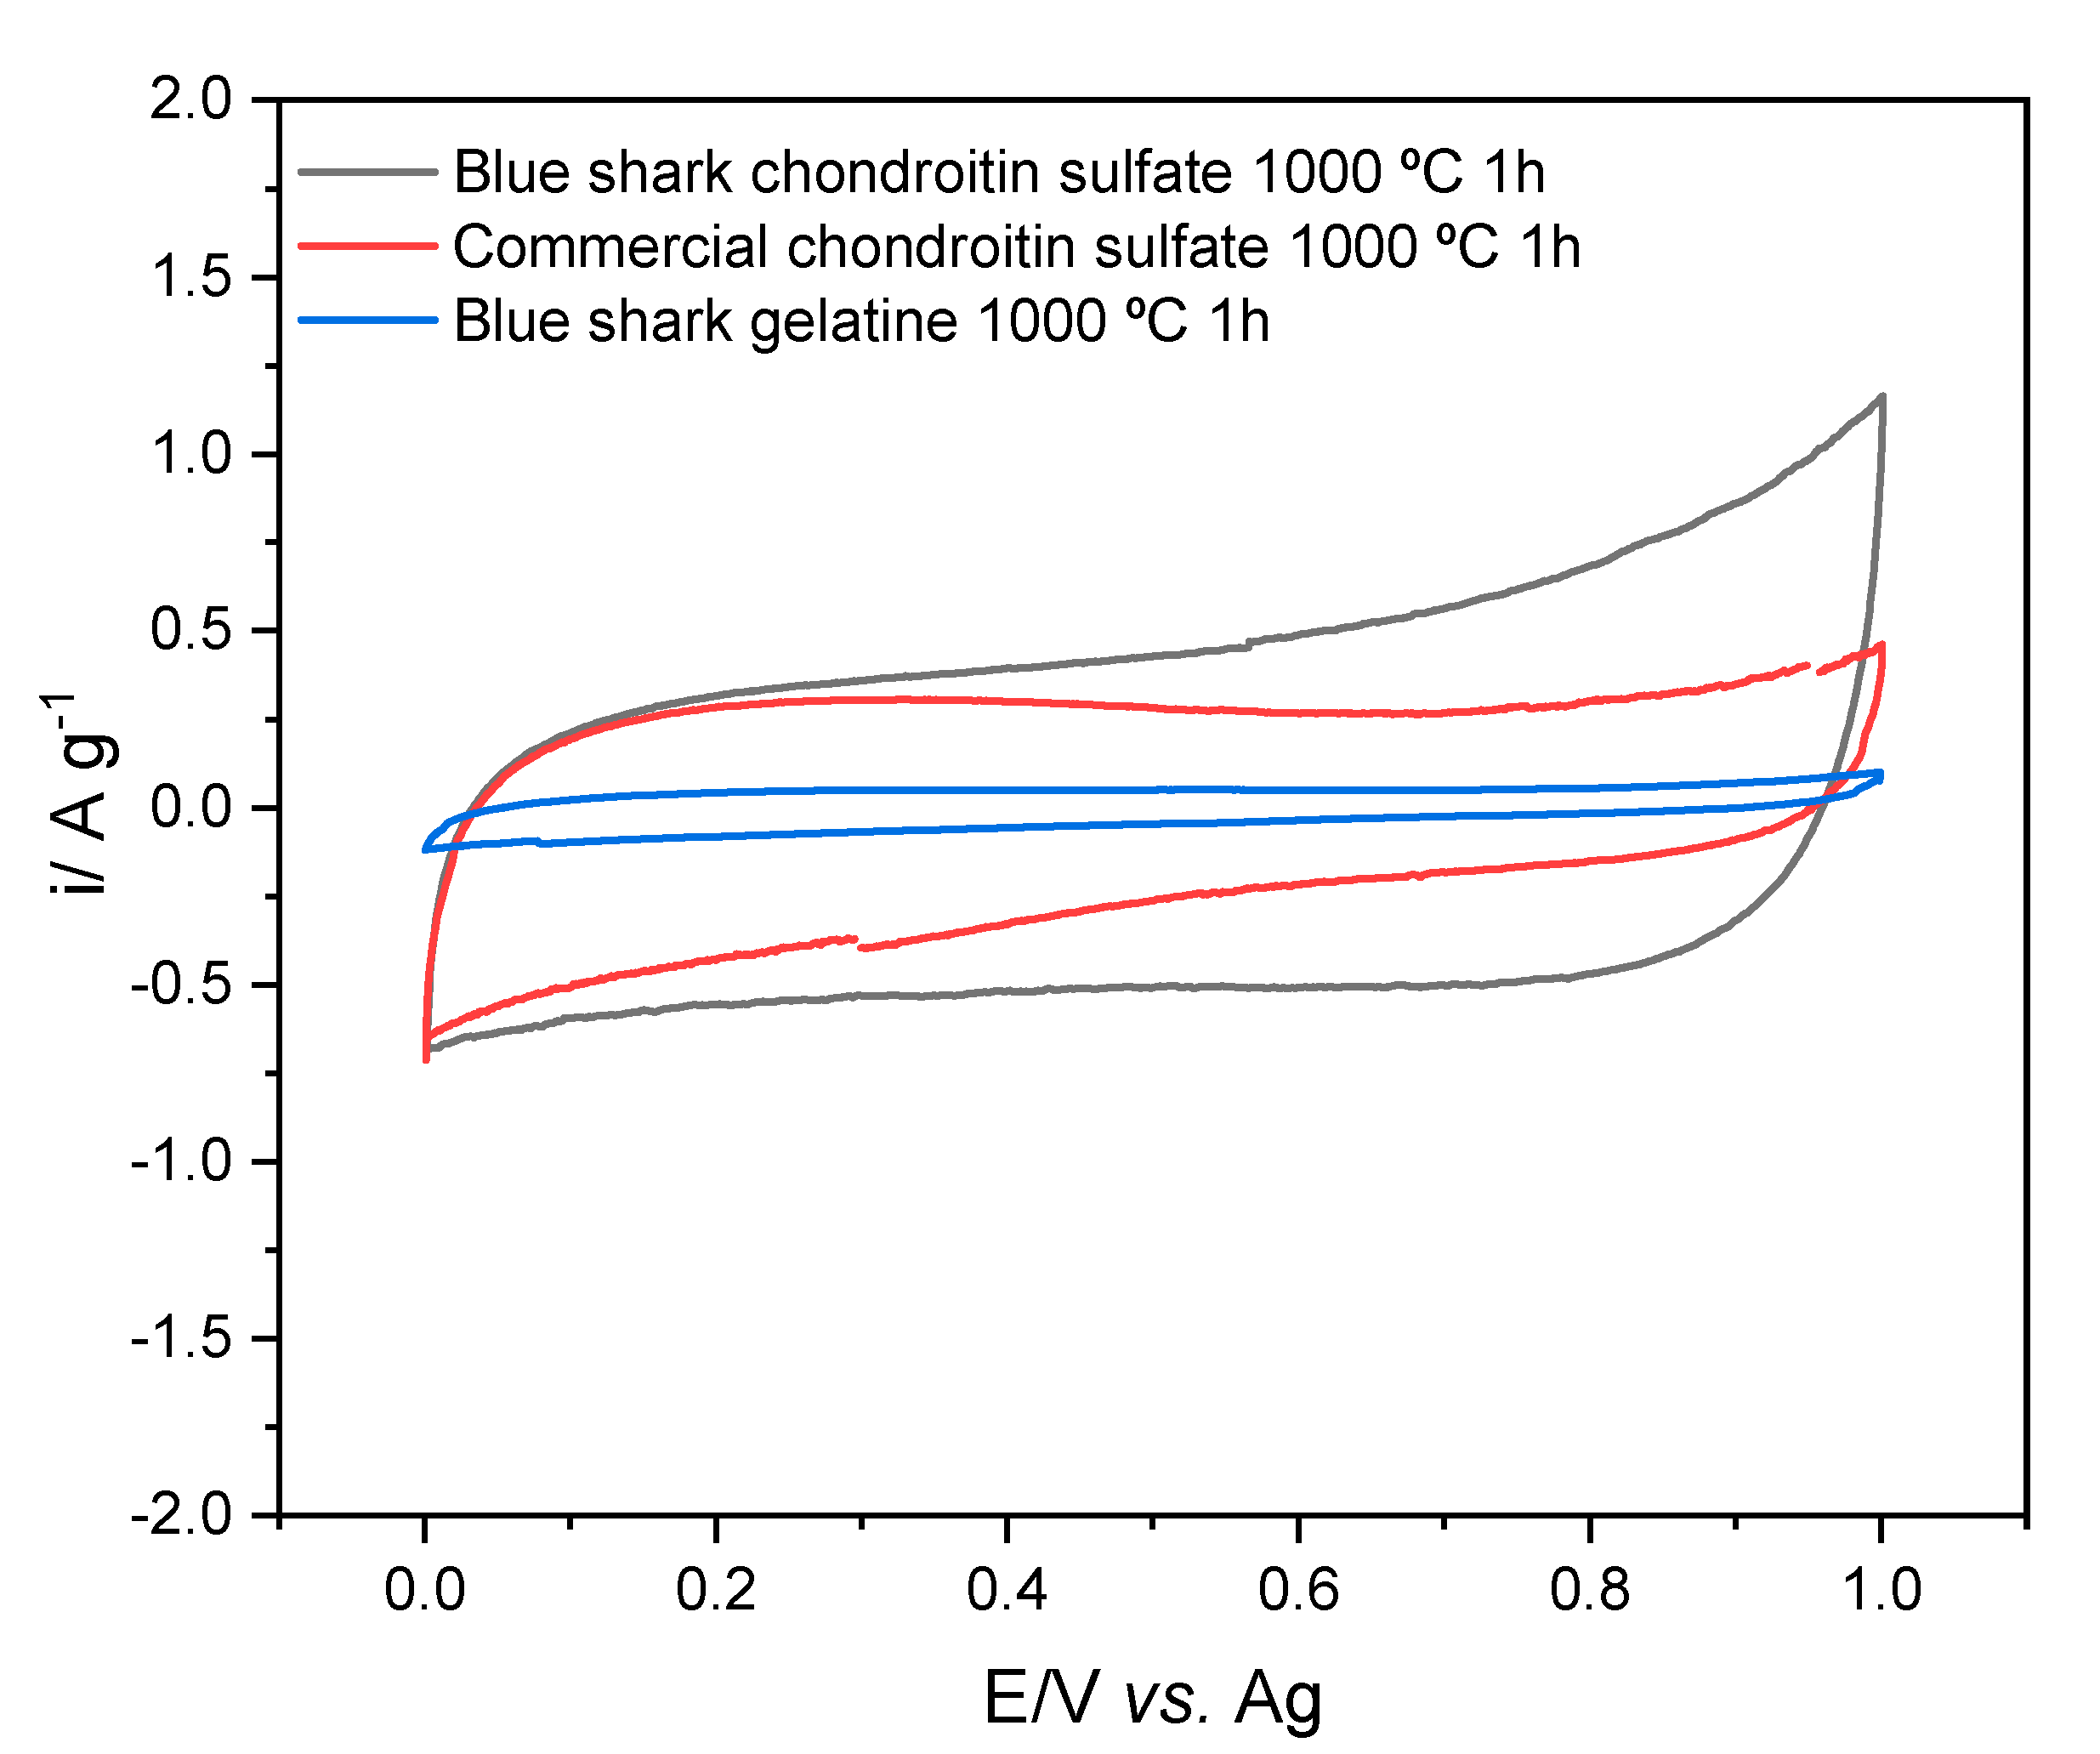
Figure 12 illustrates the voltammetric behavior of GC electrodes modified by the three biocarbons when scanned at a rate of 50 mV s−1.
All the cyclic voltammograms exhibited quasi-rectangular voltammetric profiles, suggesting an electric double-layer capacitive behavior [59].
The variations in the shape and current intensity of the curves can be attributed to the differences in the chemical composition, surface structure, and morphology of the carbon materials. Factors such as the degree of graphitization and porosity can contribute to these differences. In general, the shapes of the cyclic voltammograms offer valuable insight into the distinct electrochemical properties of the materials, which can facilitate the development and optimization of materials for various energy storage applications.
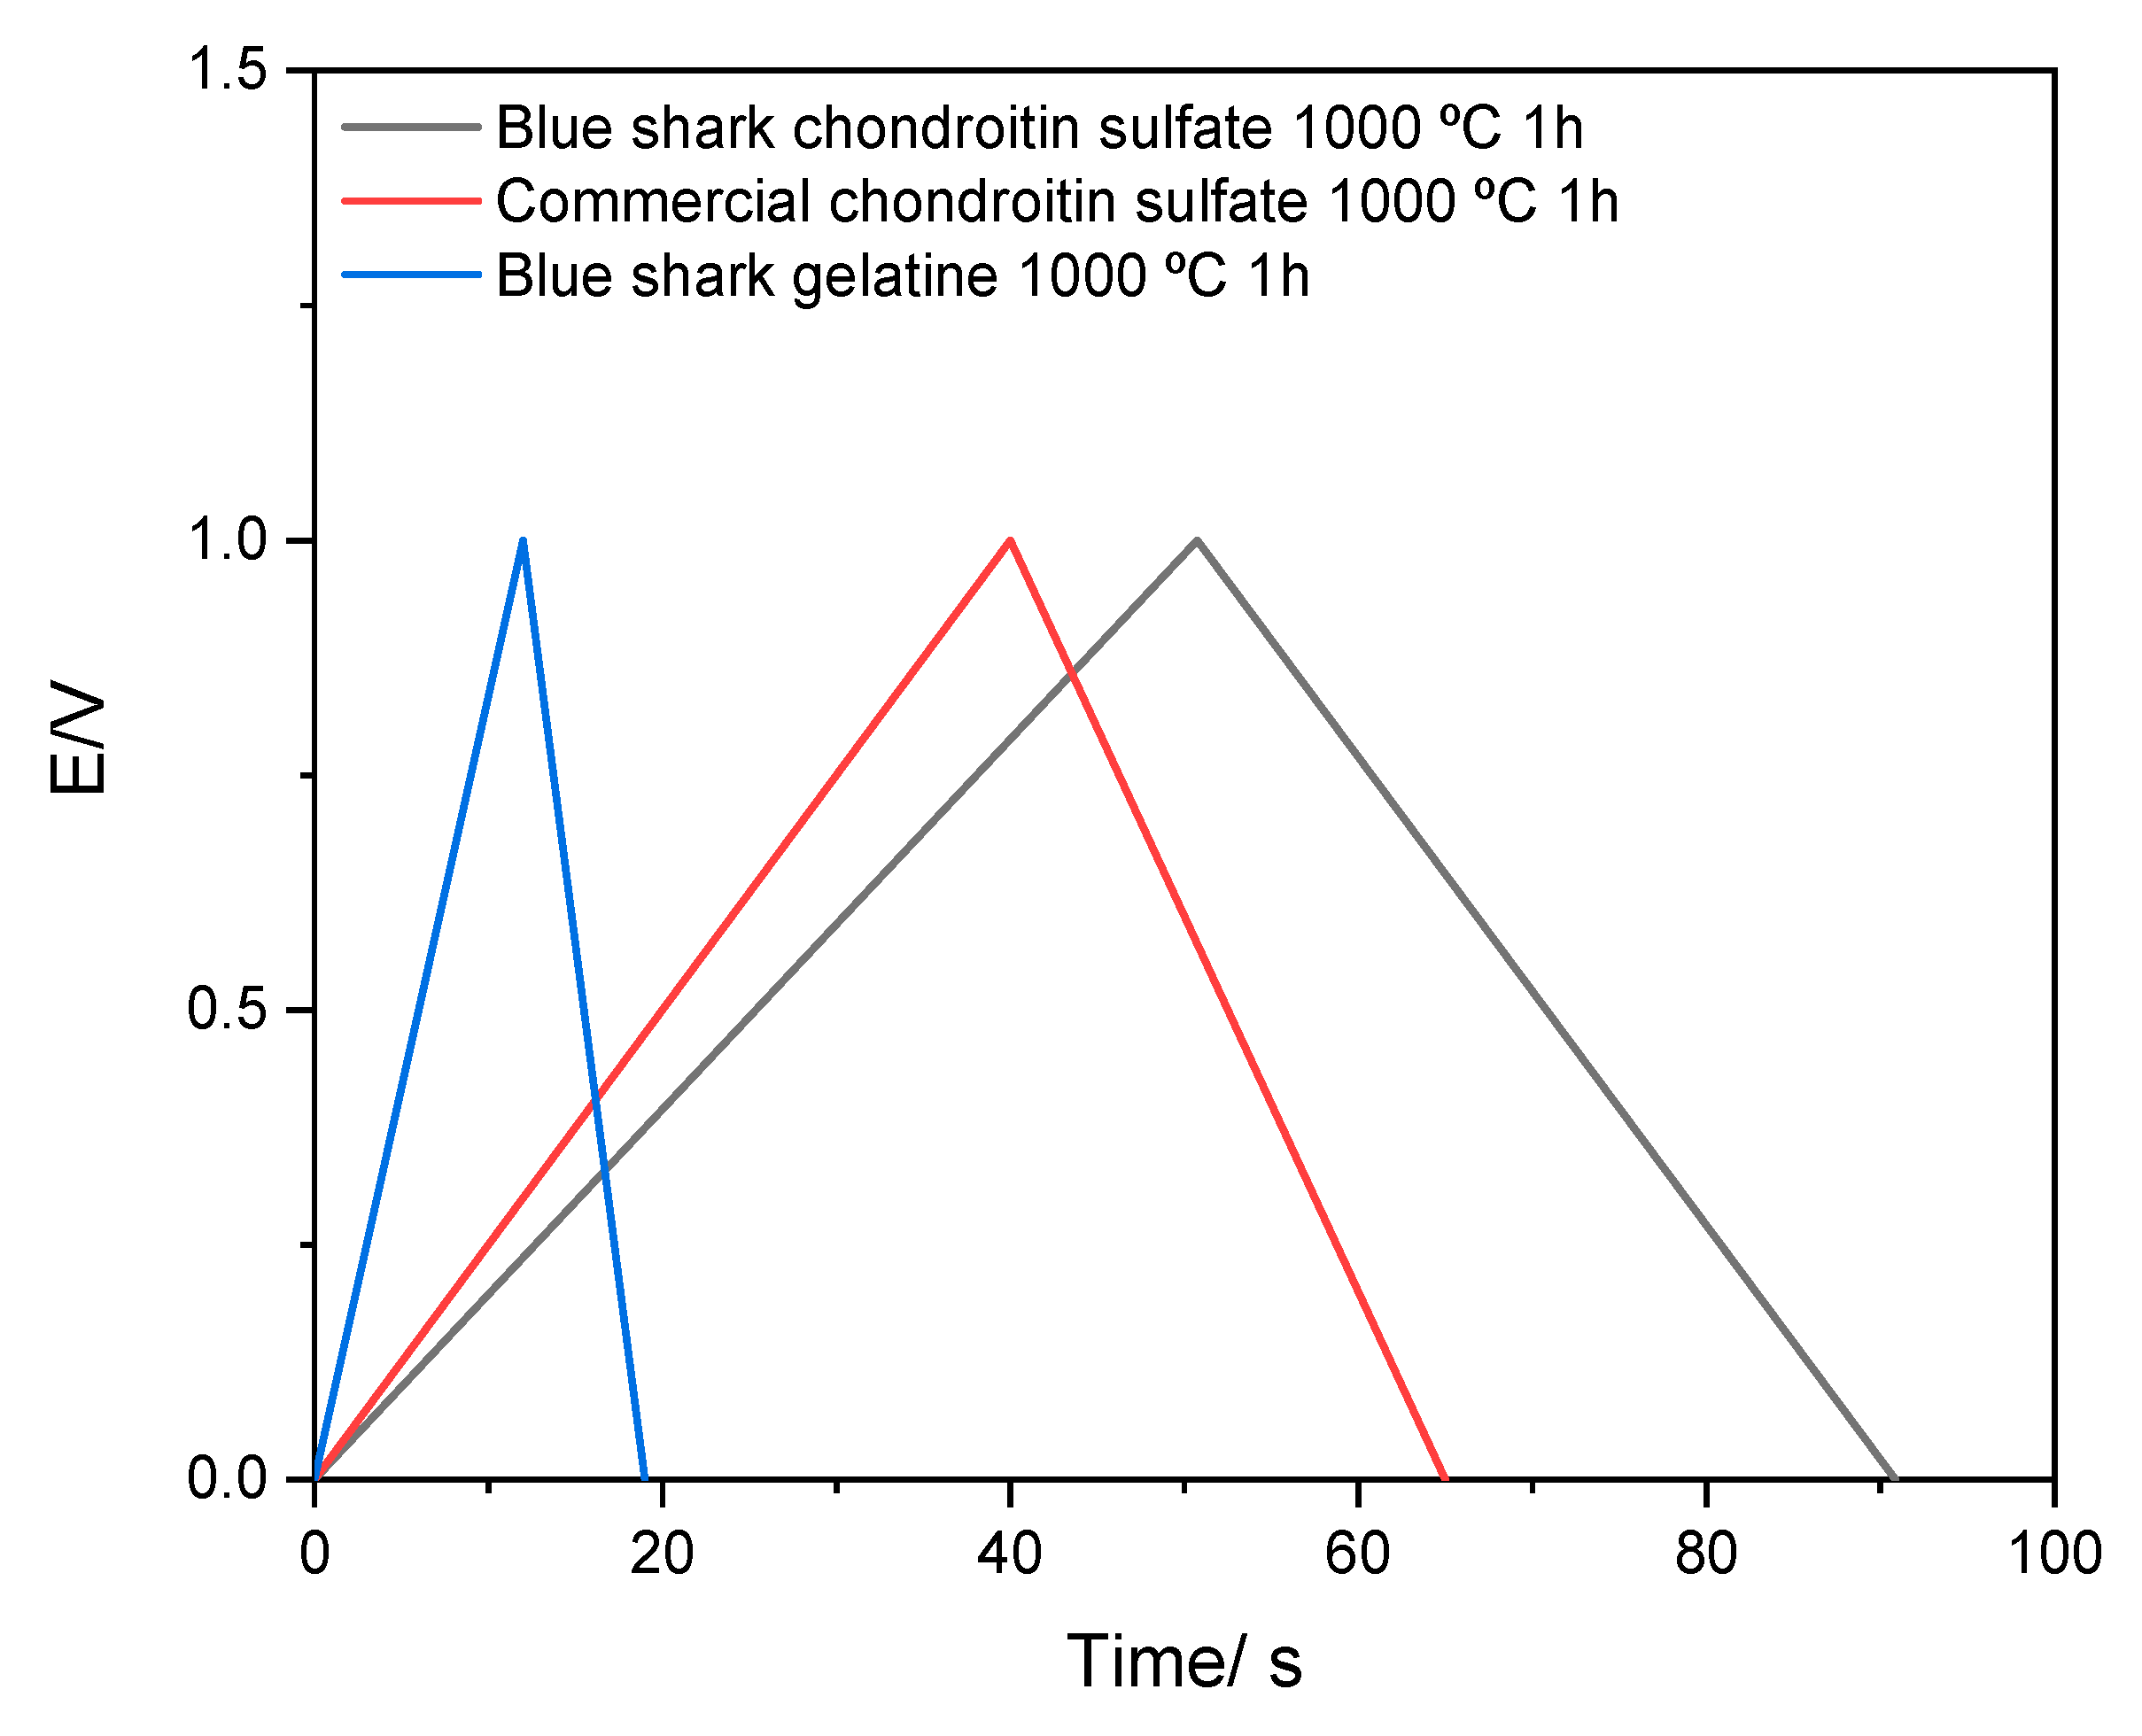
Figure 13 presents the charge–discharge curves obtained from high-specific-area materials used in a supercapacitor configuration. These curves illustrate the correlation between the electrode potential and the charge stored or released during the charging and discharging. These curves are essential for understanding and improving supercapacitor systems for various applications.
Recording charge–discharge curves from high-specific-area materials, such as biocarbon derived from marine waste, is particularly important, since it provides crucial insight into the electrochemical properties and performance of the electrode material. By analyzing these curves, researchers can better understand how the material behaves during supercapacitors’ energy storage and release processes. This knowledge can then be applied to optimize the design and performance of supercapacitor systems for enhanced efficiency and suitability in different applications.
Galvanostatic charge–discharge (GCD) curves of the biocarbon composite electrodes exhibit a symmetrical triangular shape, with distinct charge and discharge time scales. However, their performance (as shown in Table 5) varies, indicating the behavior of electric double-layer capacitors and the high reversibility of the carbon electrodes [60]. Notably, the blue shark chondroitin sulfate-based carbon showcases higher capacitance (40 F g−1) compared to the commercial chondroitin sulfate-based carbon (25 F g−1), followed by the blue shark gelatine-based carbon (7 F g−1), at a current density of 1 A g−1.
Table 5 summarizes the electrochemical studies of the three materials studied in this work. For comparison, other fish waste-based carbons studied by this group were considered. The authors addressed different biopolymers recovered from marine waste sources as carbon precursors for application in energy storage devices. In this case, for the sake of comparison, the carbonization parameters (1000 °C for 1 h, under N2 atmosphere) and the electrolyte conditions and setup during the electrochemical studies were kept constant. Within the literature, it is very difficult to find similar or identical carbonization protocols for biomass precursors for comparison, since the carbonization process leads to different characteristics in the obtained carbon materials.
High-specific-area materials have a greater surface area per unit mass, allowing them to store and discharge more charge more effectively than low-specific-area materials. Brandão et al. [11,12,19] showed that the higher the specific capacitance, the larger the surface area of carbons. An increased surface area can accommodate more electrolyte ions, leading to a more significant amount of stored charge. This statement is consistent with the results presented in Table 5, except with the blue shark chondroitin sulfate-based carbon and the squid chitin-based carbon [12], which present a higher surface area and consequent lower capacitance. This may be due to the entirely different morphology of the materials.
Numerous investigations have established a correlation between an augmented surface area and pore volume, which results in the availability of more active surface sites for charge accumulation [61,62,63]. Alongside its high specific surface area, the carbon derived from blue shark chondroitin sulfate also possesses a highly porous structure characterized by a substantial volume of pores. The porous structure in the biocarbon material contributes to its high specific capacitance. The pores create an additional surface area, allowing for more efficient charge storage. Moreover, the pores facilitate the movement of ions in and out of the electrode, enabling efficient ion diffusion.
The capacity of electrolyte ions to penetrate and access the pores of biocarbon-based materials is a crucial factor that directly impacts the performance of these materials in energy storage devices. The easy accessibility of the pores to the electrolyte ions allows for effective charge transfer, leading to improved energy storage capabilities and overall device performance. Regarding capacitance retention, the blue shark precursors (chondroitin sulfate and gelatine) exhibited a value of 71% after 5000 cycles, while the commercial chondroitin sulfate precursor demonstrated a value of 86%. This may be evidence of the presence of more easily degradable residuals in the materials extracted from blue shark wastes.
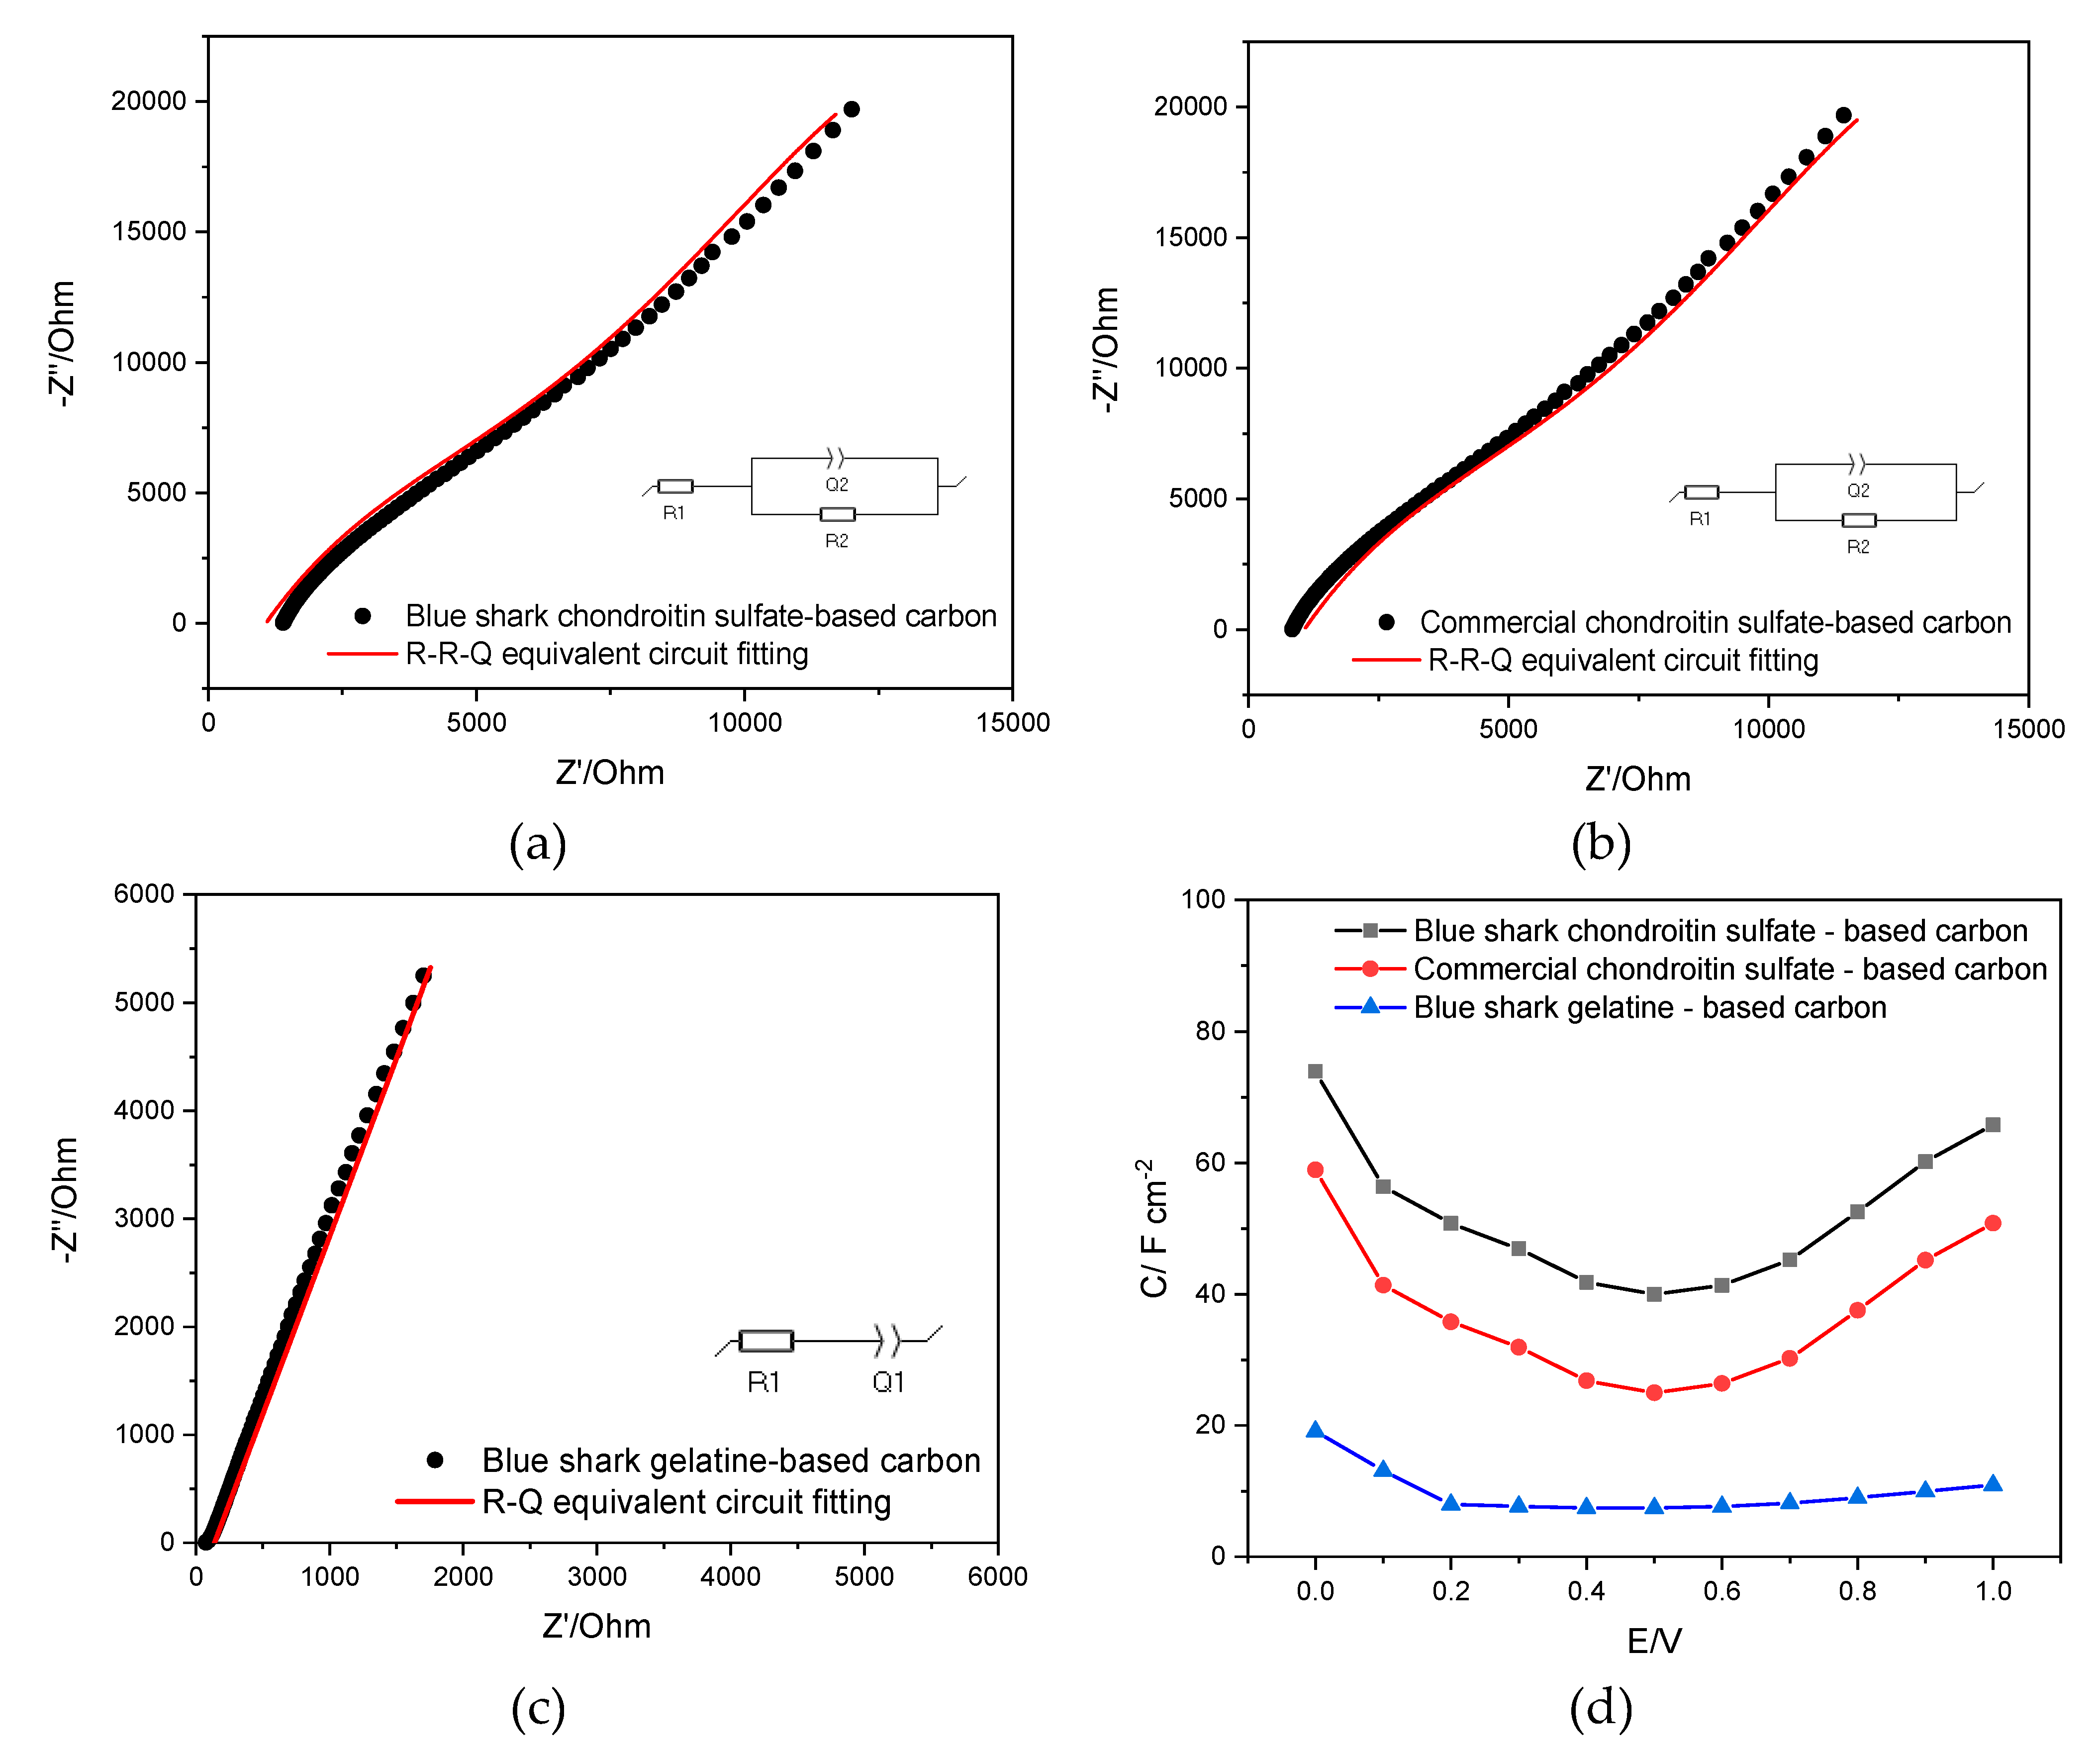
Figure 14 shows the Nyquist (Z” vs. Z’) plots for blue shark chondroitin sulfate, gelatine, and commercial chondroitin sulfate-based carbons coated on the GC electrode. The presented plots are associated with one fixed potential (0.5 V).
The equivalent circuit used to adjust the data for the electrodes modified with blue shark and commercial chondroitin sulfate-based carbons is an RRQ equivalent circuit. In contrast, an RQ is the most suitable fitting circuit for the blue shark gelatine-based carbon. The extraction of the differential capacitance through the equivalent circuits is presented in the Supplementary Materials (Section A). These results allow the determination of the differential capacitance (F cm−2) for the different potentials from 0 to 1 V, presented in Figure 14d, showing a U-shape curve for both carbons. This shape regarding the GC/carbon/electrolyte interface was previously obtained by Brandão et al. [19]. Using this method for capacitance calculation shows a higher capacitance for blue shark chondroitin sulfate-based carbon, as seen in the galvanostatic charge–discharge method presented earlier, even though the capacitance units are different.

3.8. Preliminary Results: Ball-Milling Effect

Several methods, such as chemical functionalization, doping with heteroatoms, chemical activation during carbonization, and ball-milling, are used to enhance carbon materials’ performance by changing the materials’ characteristics (e.g., increasing their surface area, porosity, conductivity, etc.).
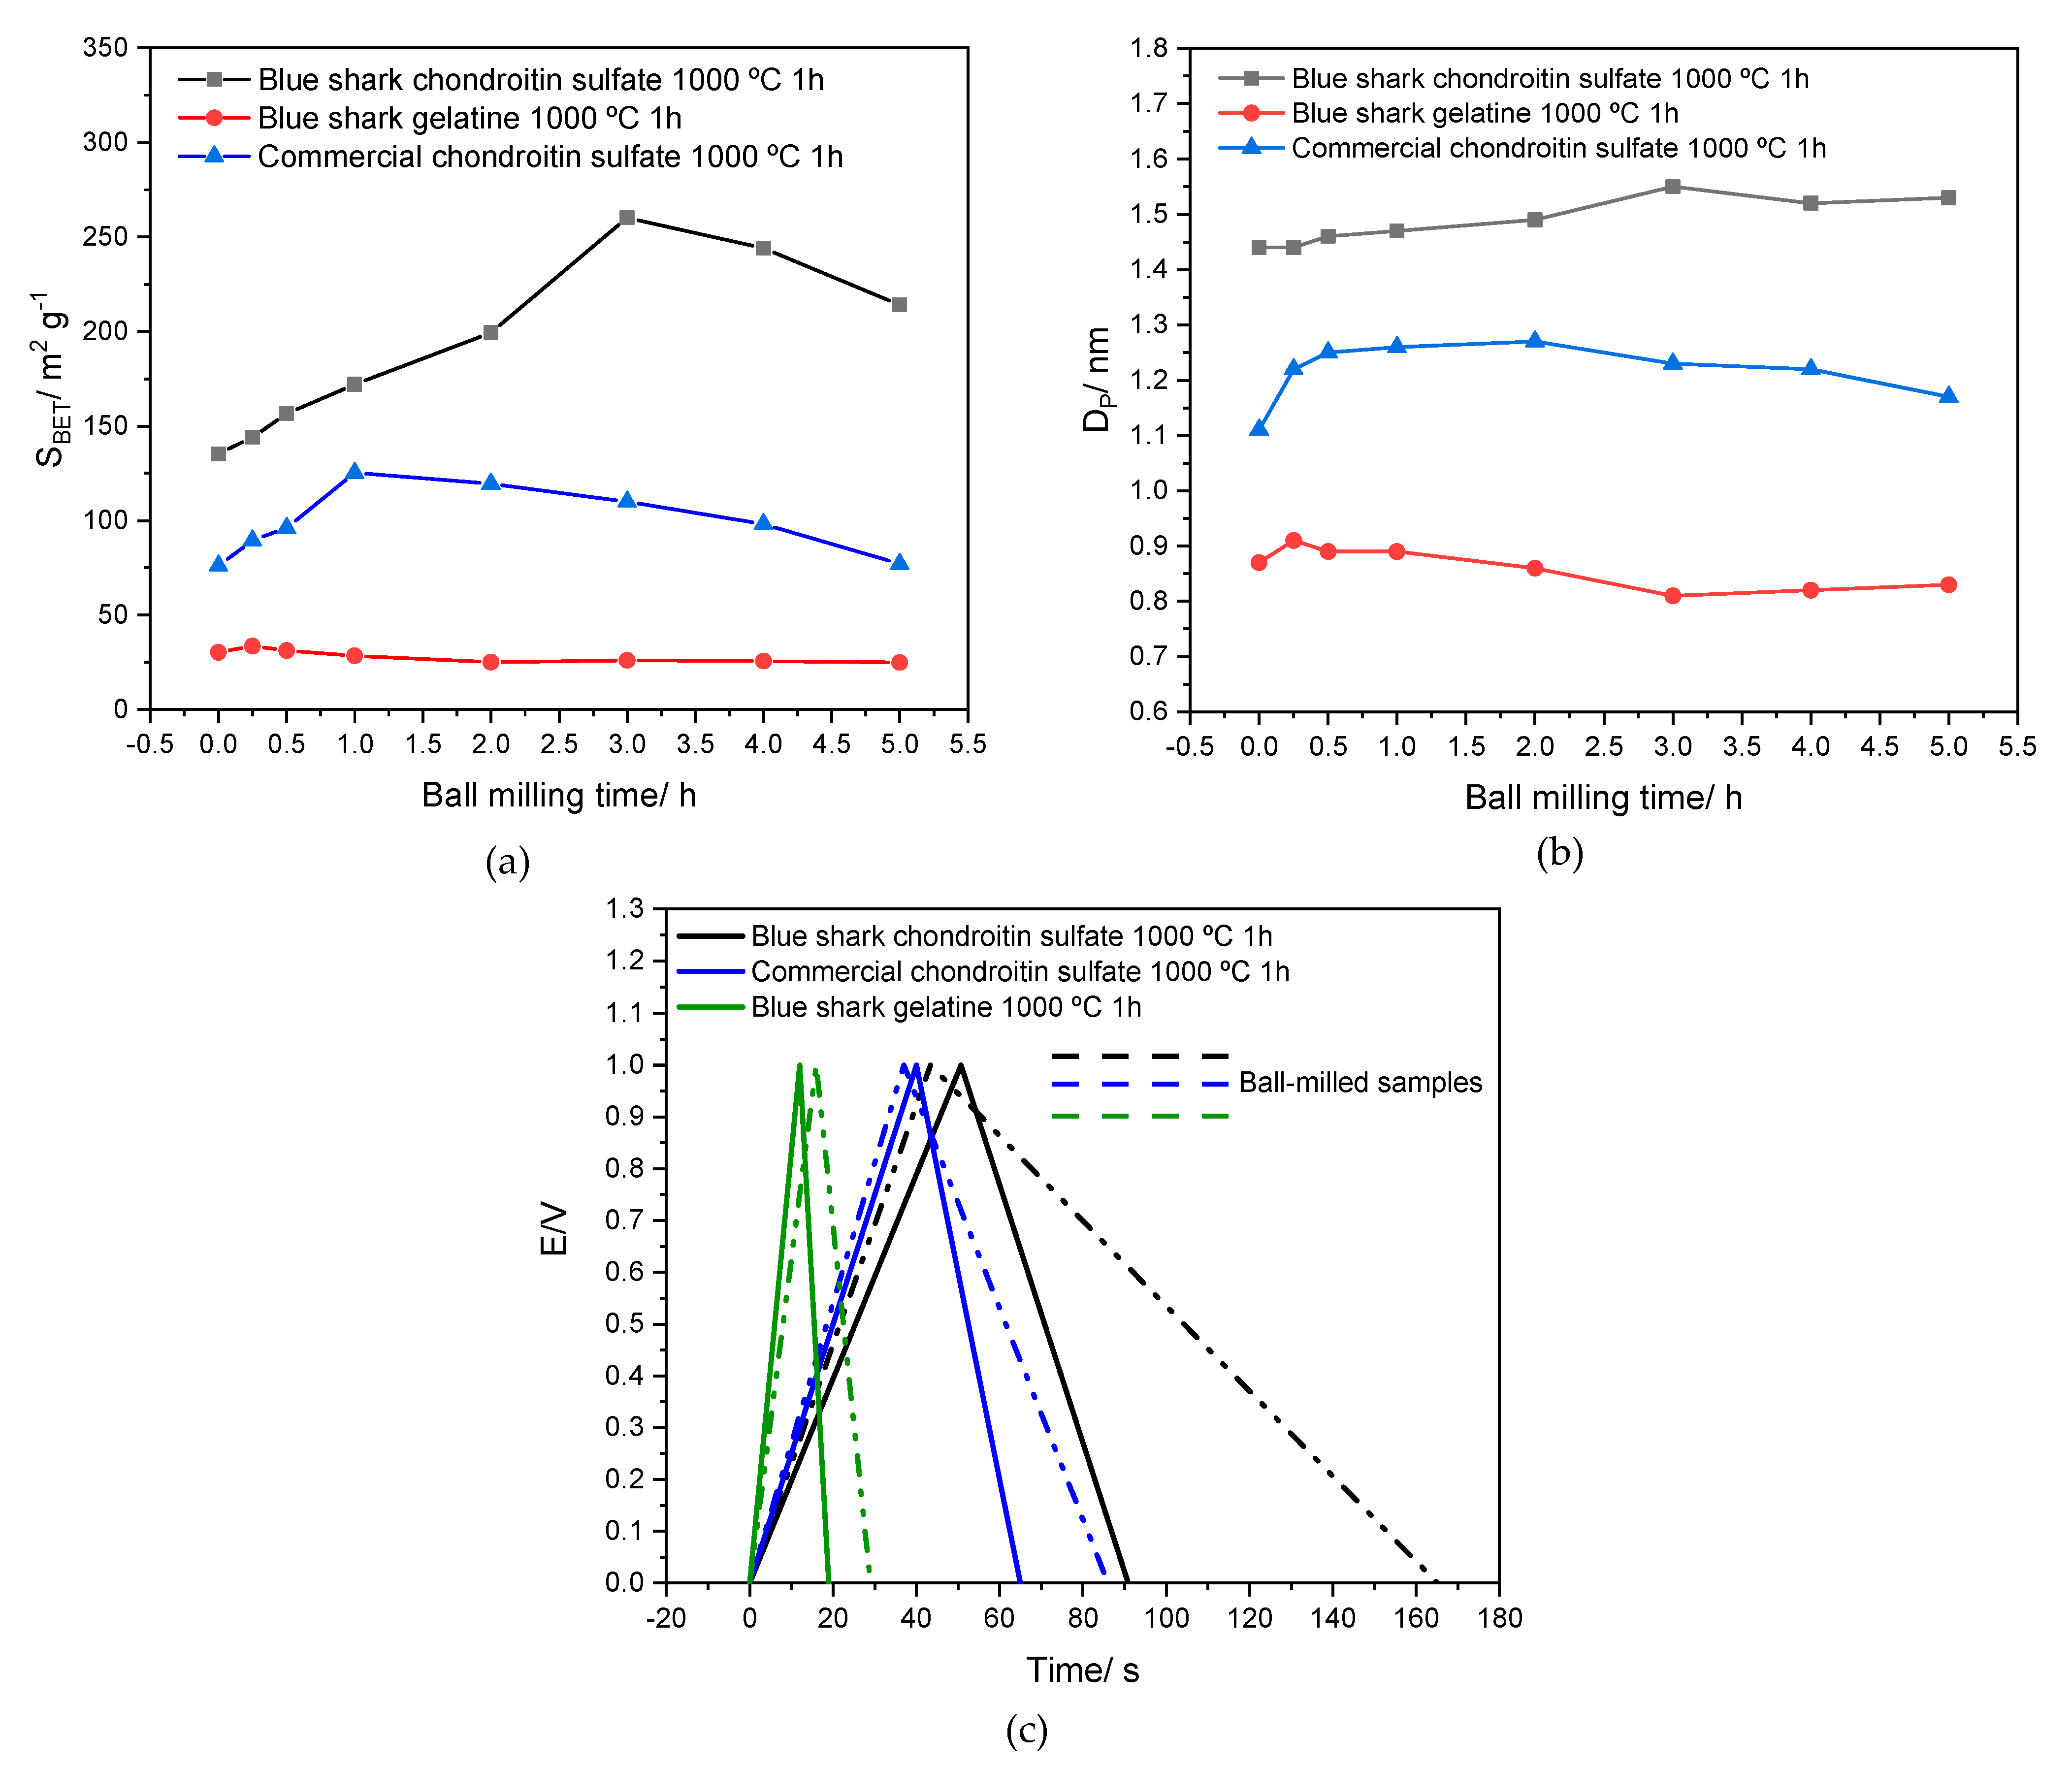
Although the electrochemical performance of the blue shark-based carbon materials presents lower capacitance values when compared to commercial carbons [64,65], these sustainable carbons can provide a starting point for the application of techniques to enhance their characteristics. In a previous paper [12], the authors successfully used chemical activation of the carbon precursor (prawn and squid chitins) during the carbonization process to improve the surface characteristics and electrochemical performance of the carbon materials. In this work, a different approach was taken by using ball-milling, a greener route to modification of carbon materials [66,67], thereby avoiding the use of wet chemistry processes. The ball-milling of the bio-carbon samples was performed, fixing the bouncing frequency (25 Hz) and size of the stainless steel balls (1 cm). The ball-milling times applied were up to 5 h. A BET analysis was performed for all the new ball-milled samples, with the results in Tables S3–S5 in the Supplementary Materials. Figure 15 presents the SBET and Dp for the different milling times and the galvanostatic charge–discharge curves for the higher surface samples.
The maximum surface area is reached at different times for the different biocarbons. Figure 15a,b show that the blue shark chondroitin sulfate-based carbon reaches the maximum surface area and pore diameter after 3 h of ball-milling. In contrast, commercial chondroitin-based carbon takes 1 h, and blue shark gelatine-based carbon takes only 15 min. After the maximum values are achieved, they start to decrease, and the particles tend to agglomerate, leading to a decrease in surface area (breakage/rewelding process), as already stated by Welham et al. [68] and Brandão et al. [19]. Considering these results, a GCD analysis was performed with the materials presenting a higher surface area and pore size. Figure 15c presents the GCD analysis with the blue shark chondroitin sulfate, commercial chondroitin sulfate, and the blue shark gelatine-based carbons (1000 °C for 1 h) before milling (continuous line) and after milling (line-dot-line). These studies were performed using the same electrolyte and conditions presented earlier.
Figure 16 presents the comparison between the specific capacitance of non-milled and ball-milled materials, showing that the ball-milling applied to these carbons can significantly increase the specific capacitance of these materials, with an increase of ×3 in the case of the blue shark chondroitin sulfate-based carbon, followed by the rise of ×5 in the blue shark gelatine-based carbon, and ×2.5 for the commercial chondroitin sulfate-based carbon. The difference in the optimal ball-milling time and the rate of increase in the specific capacitance can be associated with the distinct characteristics of the three carbon precursors. No changes are observed when comparing the capacitance retention before and after the milling process.
Increasing the specific surface area and porosity of carbons is desirable because it can lead to more active surface sites being available for charge accumulation. A larger surface area per unit mass allows for more efficient charge storage and release. Additionally, the pores can provide additional surface area for charge storage, and facilitate the diffusion of ions into and out of the electrode.
Even though, to the best of our knowledge, there are no reports in the literature about the use of organic materials extracted from blue shark discards (gelatine and chondroitin sulfate) for the preparation of carbon electrodes for application in energy storage devices, several marine waste precursors have been used for this application, such as glycogen [11], crab shells [13], fish scales [14,15,16], prawn shells [17], fish bones [18], and squid pens [12]. These studies present higher specific surface areas, pores, and specific capacitances than the present results. Albeit porous carbon materials generated from blue shark gelatine and chondroitin sulfate underperform in the previously listed materials, it is essential to study their use as porous carbon materials’ precursors to fully understand the potential of fisheries’ discards as a source of valuable resources to enhance the circular economy and contribute to further research.

4. Conclusions

A straightforward and sustainable protocol strategy was proposed to prepare porous biocarbon materials from chondroitin sulfate and gelatine extracted from blue shark waste products. This work obtained porous carbon materials with a one-step carbonization process for 1 h at 1000 °C without any further chemical activation treatment. A commercial chondroitin precursor was used for comparison.
Blue shark chondroitin sulfate-based carbon presented a specific surface area of 135.2 m2 g−1, compared to the 76.11 m2 g−1 are of the commercial chondroitin sulfate, with both carbonized for 1 h at 1000 °C. Blue shark gelatine presented a specific surface area of 30.32 m2 g−1. The associated specific capacitance of these three samples is 40 F g−1, 25 F g−1, and 7 F g−1, using a sustainable electrolyte and choline chloride-based deep eutectic solvent, ethaline.
The preliminary results regarding the ball-milling method’s effectiveness in increasing the surface area and porosity of the three studied materials allowed the determination of an optimal ball-milling time and an associated optimal specific capacitance. Further studies are required for a deeper understanding of the impact of the ball-milling method on the interfacial structure and performance of the carbon–DES interface.
While the surface area and capacitance of blue shark-based biocarbons may be lower when compared to other published results, it is still a significant finding that these materials have potential as replacements for carbon electrodes derived from fossil fuels in supercapacitors, especially when paired with eco-friendly electrolytes, to promote sustainable and effective energy storage. Nonetheless, remaining challenges must be addressed to establish protocols that enable the production of marine waste-derived biocarbons that can compete with conventional materials for use in electrode production.

Supplementary Materials

The following supporting information can be downloaded at: https://www.mdpi.com/article/10.3390/app13158676/s1, Table S1: Carbonization time and temperature for blue shark (chondroitin sulfate and gelatine) and commercial chondroitin sulfate with associated SBET, capacitance, and % retention; Table S2: Peaks extracted from the diffraction patterns in Figure 10; Table S3: SBET, Vmicro, Vmeso, and Dp parameters for blue shark chondroitin sulfate-based carbon at different ball-milling times; Table S4: SBET, Vmicro, Vmeso, and Dp parameters for blue shark gelatine-based carbon at different ball-milling times; Table S5: SBET, Vmicro, Vmeso, and Dp parameters for commercial chondroitin sulfate-based carbon at different ball-milling times; Figure S1: EDX analysis of (a) Blue shark chondroitin sulfate, commercial chondroitin sulfate, and (c) blue shark gelatine; Figure S2: Deconvolution of the peaks of the XPS survey spectra for blue shark chondroitin sulfate carbonized for 1 h at 1000 °C: C1s (a), O1s (b), N1s (c) and Na1s (d); Figure S3: Deconvolution of the peaks of the XPS survey spectra for blue shark gelatine carbonized for 1 h at 1000 °C: C1s (a), O1s (b), and N1s (c); Figure S4: Deconvolution of the peaks of the XPS survey spectra for commercial chondroitin sulfate carbonized for 1 h at 1000 °C: C1s (a), O1s (b), and N1s (c); Figure S5: First Raman region (a–c) and second Raman region (b–d) of the Raman spectra of the blue shark gelatine and commercial chondroitin sulfate-based carbons, respectively.

Author Contributions

Conceptualization, A.T.S.C.B., C.M.P. and J.V.; methodology, A.T.S.C.B. and C.M.P.; formal analysis, A.T.S.C.B., L.-B.E., P.P., A.F.S. and C.M.P.; investigation, A.T.S.C.B., R.C., S.S., L.-B.E., P.P., J.A.V., J.V. and C.M.P.; writing—original draft, A.T.S.C.B.; writing—review and editing, A.T.S.C.B., S.S., R.C., M.E. and C.M.P.; supervision: A.F.S., M.E. and C.M.P.; resources, M.E. and C.M.P.; funding acquisition, C.M.P. All authors have read and agreed to the published version of the manuscript.

Funding

The FCT financially supported this work under Research Grant UIDB/00081/2020–CIQUP, LA/P/0056/2020 (IMS) and H2Innovate NORTE-01-0145-FEDER-000076. ECSEL JU funded this research under the following grant agreements: No. 826422 (PIn3S), No. 876124 (BEYOND5), and No. 875999 (IT2). JU receives support from the European Union’s Horizon 2020 research and innovation program and Italy, Switzerland, Germany, Belgium, Sweden, Austria, Romania, Slovakia, France, Poland, Spain, Ireland, Israel, Portugal, Greece, Netherlands, Hungary, United Kingdom. This work is financially supported by the Romanian Ministry of Research, Innovation, and Digitalization under the following ECSEL—H2020 Projects: PIn3S—Contract no. 10/1.1.3H/03.04.2020, POC-SMIS code 135127, BEYOND5—Contract no. 12/1.1.3/31.07.2020, POC-SMIS code 136877 and IT2—Contract. no. 11/1.1.3H/06.07.2020, POC-SMIS code 136697. José Antonio Vázquez and Jesus Valcarcel thank Xunta de Galicia (Grupos de Potential Crecimiento, IN607B 2021/11) for financial support and Mr. Javier Fraguas for his technical contribution. Ana Brandão thanks the scholarship awarded by FCT with reference 2021.04783.BD, and the Schwäbisch Gmünd Scientific Exchange Grant awarded by the European Academy of Surface Technology. Renata Costa thanks FCT for funding through program DL 57/2016–Norma transitória (SFRH/BPD/89752/2012).

Institutional Review Board Statement

Not applicable.

Informed Consent Statement

Not applicable.

Data Availability Statement

Available upon request.

Conflicts of Interest

The authors declare no conflict of interest.

References

  1. Bhat, M.Y.; Hashmi, S.A.; Khan, M.; Choi, D.; Qurashi, A. Frontiers and recent developments on supercapacitor’s materials, design, and applications: Transport and power system applications. J. Energy Storage 2023, 58, 106104. [Google Scholar] [CrossRef]
  2. Mehdipour-Ataei, S.; Aram, E. Mesoporous Carbon-Based Materials: A Review of Synthesis, Modification, and Applications. Catalysts 2023, 13. [Google Scholar] [CrossRef]
  3. Soffian, M.S.; Abdul Halim, F.Z.; Aziz, F.; Rahman, M.A.; Mohamed Amin, M.A.; Awang Chee, D.N. Carbon-based material derived from biomass waste for wastewater treatment. Environ. Adv. 2022, 9, 100259. [Google Scholar] [CrossRef]
  4. FAO United Nations. The State of World Fisheries and Aquaculture 2022; FAO: Rome, Italy, 2022. [Google Scholar]
  5. Vázquez, J.A.; Fraguas, J.; González, P.; Serra, J.; Valcarcel, J. Optimal Recovery of Valuable Biomaterials, Chondroitin Sulfate and Bioapatites, from Central Skeleton Wastes of Blue Shark. Polymers 2020, 12, 2613. [Google Scholar] [CrossRef] [PubMed]
  6. De Iuliis, G.; Pulerà, D. Chapter 3—The Shark. In The Dissection of Vertebrates, 3rd ed.; De Iuliis, G., Pulerà, D., Eds.; Academic Press: Boston, MA, USA, 2019; pp. 53–109. ISBN 978-0-12-410460-0. [Google Scholar]
  7. López-Álvarez, M.; González, P.; Serra, J.; Fraguas, J.; Valcarcel, J.; Vázquez, J.A. Chondroitin sulfate and hydroxyapatite from Prionace glauca shark jaw: Physicochemical and structural characterization. Int. J. Biol. Macromol. 2020, 156, 329–339. [Google Scholar] [CrossRef]
  8. López-Álvarez, M.; Pérez-Davila, S.; Rodríguez-Valencia, C.; González, P.; Serra, J. The improved biological response of shark tooth bioapatites in a comparative in vitro study with synthetic and bovine bone grafts. Biomed. Mater. 2016, 11, 35011. [Google Scholar] [CrossRef]
  9. Valcarcel, J.; Novoa-Carballal, R.; Pérez-Martín, R.I.; Reis, R.L.; Vázquez, J.A. Glycosaminoglycans from marine sources as therapeutic agents. Biotechnol. Adv. 2017, 35, 711–725. [Google Scholar] [CrossRef]
  10. Taelman, S.E.; Tonini, D.; Wandl, A.; Dewulf, J. A Holistic Sustainability Framework for Waste Management in European Cities: Concept Development. Sustainability 2018, 10, 2184. [Google Scholar] [CrossRef] [Green Version]
  11. Brandão, A.T.S.C.; State, S.; Costa, R.; Potorac, P.; Vázquez, J.A.; Valcarcel, J.; Silva, A.F.; Anicai, L.; Enachescu, M.; Pereira, C.M. Renewable Carbon Materials as Electrodes for High-Performance Supercapacitors: From Marine Biowaste to High Specific Surface Area Porous Biocarbons. ACS Omega 2023, 8, 18782–18798. [Google Scholar] [CrossRef]
  12. Brandão, A.T.S.C.; Costa, R.; State, S.; Potorac, P.; Dias, C.; Vázquez, J.A.; Valcarcel, J.; Silva, A.F.; Enachescu, M.; Pereira, C.M. Chitins from Seafood Waste as Sustainable Porous Carbon Precursors for the Development of Eco-Friendly Supercapacitors. Materials 2023, 16, 2332. [Google Scholar] [CrossRef]
  13. Liu, H.-J.; Wang, X.-M.; Cui, W.-J.; Dou, Y.-Q.; Zhao, D.-Y.; Xia, Y.-Y. Highly ordered mesoporous carbon nanofiber arrays from a crab shell biological template and its application in supercapacitors and fuel cells. J. Mater. Chem. 2010, 20, 4223–4230. [Google Scholar] [CrossRef]
  14. Chen, W.; Zhang, H.; Huang, Y.; Wang, W. A fish scale based hierarchical lamellar porous carbon material obtained using a natural template for high performance electrochemical capacitors. J. Mater. Chem. 2010, 20, 4773–4775. [Google Scholar] [CrossRef]
  15. Wang, J.; Shen, L.; Xu, Y.; Dou, H.; Zhang, X. Lamellar-structured biomass-derived phosphorus- and nitrogen-co-doped porous carbon for high-performance supercapacitors. New J. Chem. 2015, 39, 9497–9503. [Google Scholar] [CrossRef]
  16. Zingare, P.A.; Dhoble, S.J.; Deshmukh, A.D. Highly stable fish-scale derived lamellar carbon for high performance supercapacitor application. Diam. Relat. Mater. 2022, 124, 108925. [Google Scholar] [CrossRef]
  17. Gao, F.; Qu, J.; Zhao, Z.; Wang, Z.; Qiu, J. Nitrogen-doped activated carbon derived from prawn shells for high-performance supercapacitors. Electrochim. Acta 2016, 190, 1134–1141. [Google Scholar] [CrossRef]
  18. Shan, B.; Cui, Y.; Liu, W.; Zhang, Y.; Liu, S.; Wang, H.; Sun, L.; Wang, Z.; Wu, R. Fibrous Bio-Carbon Foams: A New Material for Lithium-Ion Hybrid Supercapacitors with Ultrahigh Integrated Energy/Power Density and Ultralong Cycle Life. ACS Sustain. Chem. Eng. 2018, 6, 14989–15000. [Google Scholar] [CrossRef]
  19. Brandão, A.T.S.C.; Costa, R.; Silva, A.F.; Pereira, C.M. Sustainable Preparation of Nanoporous Carbons via Dry Ball Milling: Electrochemical Studies Using Nanocarbon Composite Electrodes and a Deep Eutectic Solvent as Electrolyte. Nanomaterials 2021, 11, 3258. [Google Scholar] [CrossRef]
  20. Vázquez, J.A.; Blanco, M.; Fraguas, J.; Pastrana, L.; Pérez-Martín, R. Optimisation of the extraction and purification of chondroitin sulphate from head by-products of Prionace glauca by environmental friendly processes. Food Chem. 2016, 198, 28–35. [Google Scholar] [CrossRef] [Green Version]
  21. Novoa-Carballal, R.; Pérez-Martín, R.; Blanco, M.; Sotelo, C.G.; Fassini, D.; Nunes, C.; Coimbra, M.A.; Silva, T.H.; Reis, R.L.; Vázquez, J.A. By-products of Scyliorhinus canicula, Prionace glauca and Raja clavata: A valuable source of predominantly 6S sulfated chondroitin sulfate. Carbohydr. Polym. 2017, 157, 31–37. [Google Scholar] [CrossRef] [Green Version]
  22. Sousa, S.C.; Vázquez, J.A.; Pérez-Martín, R.I.; Carvalho, A.P.; Gomes, A.M. Valorization of By-Products from Commercial Fish Species: Extraction and Chemical Properties of Skin Gelatins. Molecules 2017, 22, 1545. [Google Scholar] [CrossRef] [Green Version]
  23. Pimenta, M.A.; Dresselhaus, G.; Dresselhaus, M.S.; Cançado, L.G.; Jorio, A.; Saito, R. Studying disorder in graphite-based systems by Raman spectroscopy. Phys. Chem. Chem. Phys. 2007, 9, 1276–1290. [Google Scholar] [CrossRef] [PubMed]
  24. Salomé, S.; Pereira, N.M.; Ferreira, E.S.; Pereira, C.M.; Silva, A.F. Tin electrodeposition from choline chloride based solvent: Influence of the hydrogen bond donors. J. Electroanal. Chem. 2013, 703, 80–87. [Google Scholar] [CrossRef]
  25. Stoller, M.D.; Ruoff, R.S. Best practice methods for determining an electrode material’s performance for ultracapacitors. Energy Environ. Sci. 2010, 3, 1294–1301. [Google Scholar] [CrossRef]
  26. Neamtu, A.; Stoica, B.; Vasile, C. Cellulose/Chondroitin Sulphate Hydrogels As Carriers for Drug Delivery Applications; Analele Ştiinţifice ale Universităţii “Alexandru Ioan Cuza”, Secţiunea Genetică şi Biologie Moleculară: Iasi, Romania, 2009; Volume 10, pp. 85–92. [Google Scholar]
  27. Kommareddy, S.; Shenoy, D.; Amiji, M. Gelatin Nanoparticles and Their Biofunctionalization. In Nanotechnologies for the Life Sciences, Vol. 1 Biofunctionalization of Nanomaterials; Wiley: Hoboken, NJ, USA, 2007; ISBN 9783527610419. [Google Scholar]
  28. Yu, M.; Han, Y.; Li, J.; Wang, L. Magnetic N-doped carbon aerogel from sodium carboxymethyl cellulose/collagen composite aerogel for dye adsorption and electrochemical supercapacitor. Int. J. Biol. Macromol. 2018, 115, 185–193. [Google Scholar] [CrossRef]
  29. Ponce, A.; Mejía-Rosales, S.; José-Yacamán, M. Scanning transmission electron microscopy methods for the analysis of nanoparticles. Methods Mol. Biol. 2012, 906, 453–471. [Google Scholar] [PubMed]
  30. Qian, W.; Sun, F.; Xu, Y.; Qiu, L.; Liu, C.; Wang, S.; Yan, F. Human hair-derived carbon flakes for electrochemical supercapacitors. Energy Environ. Sci. 2014, 7, 379–386. [Google Scholar] [CrossRef]
  31. Guo, Y.; Peng, F.; Wang, H.; Huang, F.; Meng, F.; Hui, D.; Zhou, Z. Intercalation Polymerization Approach for Preparing Graphene/Polymer Composites. Polymers 2018, 10, 61. [Google Scholar] [CrossRef] [Green Version]
  32. Barroso-Bogeat, A.; Alexandre-Franco, M.; Fernández-González, C.; Macías-García, A.; Gómez-Serrano, V. Preparation of Activated Carbon-SnO2, TiO2, and WO3 Catalysts. Study by FT-IR Spectroscopy. Ind. Eng. Chem. Res. 2016, 55, 5200–5206. [Google Scholar] [CrossRef]
  33. Al Bahri, M.; Calvo, L.; Gilarranz, M.A.; Rodriguez, J.J. Activated carbon from grape seeds upon chemical activation with phosphoric acid: Application to the adsorption of diuron from water. Chem. Eng. J. 2012, 203, 348–356. [Google Scholar] [CrossRef] [Green Version]
  34. Xu, J.; Chen, L.; Qu, H.; Jiao, Y.; Xie, J.; Xing, G. Preparation and characterization of activated carbon from reedy grass leaves by chemical activation with H 3 PO 4. Appl. Surf. Sci. 2014, 320, 674–680. [Google Scholar] [CrossRef]
  35. Luo, Y.; Li, D.; Chen, Y.; Sun, X.; Cao, Q.; Liu, X. The performance of phosphoric acid in the preparation of activated carbon-containing phosphorus species from rice husk residue. J. Mater. Sci. 2019, 54, 5008–5021. [Google Scholar] [CrossRef]
  36. Ilnicka, A.; Skorupska, M.; Tyc, M.; Kowalska, K.; Kamedulski, P.; Zielinski, W.; Lukaszewicz, J.P. Green algae and gelatine derived nitrogen rich carbon as an outstanding competitor to Pt loaded carbon catalysts. Sci. Rep. 2021, 11, 7084. [Google Scholar] [CrossRef] [PubMed]
  37. Li, Z.; Deng, L.; Kinloch, I.A.; Young, R.J. Raman spectroscopy of carbon materials and their composites: Graphene, nanotubes and fibres. Prog. Mater. Sci. 2023, 135, 101089. [Google Scholar]
  38. Villa-Aleman, E.; Darvin, J.R.; Nielsen, M.H.; Willey, T.M. Raman signatures of detonation soot. J. Raman Spectrosc. 2022, 53, 1571–1579. [Google Scholar] [CrossRef]
  39. Henry, D.G.; Jarvis, I.; Gillmore, G.; Stephenson, M. Raman spectroscopy as a tool to determine the thermal maturity of organic matter: Application to sedimentary, metamorphic and structural geology. Earth-Sci. Rev. 2019, 198, 102936. [Google Scholar] [CrossRef]
  40. Zhang, S.; Su, Y.; Zhu, S.; Zhang, H.; Zhang, Q. Effects of pretreatment and FeCl3 preload of rice husk on synthesis of magnetic carbon composites by pyrolysis for supercapacitor application. J. Anal. Appl. Pyrolysis 2018, 135, 22–31. [Google Scholar] [CrossRef]
  41. Rodríguez-Sánchez, S.; Ruiz, B.; Martínez-Blanco, D.; Sánchez-Arenillas, M.; Diez, M.A.; Marco, J.F.; Gorria, P.; Fuente, E. Towards advanced industrial waste-based magnetic activated carbons with tunable chemical, textural and magnetic properties. Appl. Surf. Sci. 2021, 551, 149407. [Google Scholar] [CrossRef]
  42. Krishna, R.; Wade, J.; Jones, A.N.; Lasithiotakis, M.; Mummery, P.M.; Marsden, B.J. An understanding of lattice strain, defects and disorder in nuclear graphite. Carbon N. Y. 2017, 124, 314–333. [Google Scholar] [CrossRef] [Green Version]
  43. Hu, S.C.; Cheng, J.; Wang, W.P.; Sun, G.T.; Hu, L.L.; Zhu, M.Q.; Huang, X.H. Structural changes and electrochemical properties of lacquer wood activated carbon prepared by phosphoric acid-chemical activation for supercapacitor applications. Renew. Energy 2021, 177, 82–94. [Google Scholar] [CrossRef]
  44. Flygare, M.; Svensson, K. Quantifying crystallinity in carbon nanotubes and its influence on mechanical behaviour. Mater. Today Commun. 2019, 18, 39–45. [Google Scholar] [CrossRef]
  45. Wang, L.; Mu, G.; Tian, C.; Sun, L.; Zhou, W.; Yu, P.; Yin, J.; Fu, H. Porous graphitic carbon nanosheets derived from cornstalk biomass for advanced supercapacitors. ChemSusChem 2013, 6, 880–889. [Google Scholar] [CrossRef] [PubMed]
  46. Sankar, S.; Saravanan, S.; Ahmed, A.T.A.; Inamdar, A.I.; Im, H.; Lee, S.; Kim, D.Y. Spherical activated-carbon nanoparticles derived from biomass green tea wastes for anode material of lithium-ion battery. Mater. Lett. 2019, 240, 189–192. [Google Scholar] [CrossRef]
  47. Tian, W.; Gao, Q.; Tan, Y.; Li, Z. Unusual interconnected graphitized carbon nanosheets as the electrode of high-rate ionic liquid-based supercapacitor. Carbon N. Y. 2017, 119, 287–295. [Google Scholar] [CrossRef] [Green Version]
  48. Stephan, A.M.; Kumar, T.P.; Ramesh, R.; Thomas, S.; Jeong, S.K.; Nahm, K.S. Pyrolitic carbon from biomass precursors as anode materials for lithium batteries. Mater. Sci. Eng. A 2006, 430, 132–137. [Google Scholar] [CrossRef]
  49. Tian, W.; Gao, Q.; Tan, Y.; Yang, K.; Zhu, L.; Yang, C.; Zhang, H. Bio-inspired beehive-like hierarchical nanoporous carbon derived from bamboo-based industrial by-product as a high performance supercapacitor electrode material. J. Mater. Chem. A 2015, 3, 5656–5664. [Google Scholar] [CrossRef]
  50. Zhu, Y.; Murali, S.; Stoller, M.D.; Ganesh, K.J.; Cai, W.; Ferreira, P.J.; Pirkle, A.; Wallace, R.M.; Cychosz, K.A.; Thommes, M.; et al. Carbon-based supercapacitors produced by activation of graphene. Science 2011, 332, 1537–1541. [Google Scholar] [CrossRef] [Green Version]
  51. Kubicka, M.; Bakierska, M.; Chudzik, K.; Rutkowska, M.; Pacek, J.; Molenda, M. Electrochemical Properties and Structure Evolution of Starch-Based Carbon Nanomaterials as Li-Ion Anodes with Regard to Thermal Treatment. Polymers 2019, 11, 1527. [Google Scholar] [CrossRef] [Green Version]
  52. Ali, A.; Chiang, Y.W.; Santos, R.M. X-ray Diffraction Techniques for Mineral Characterization: A Review for Engineers of the Fundamentals, Applications, and Research Directions. Minerals 2022, 12, 205. [Google Scholar] [CrossRef]
  53. Hallam, K.R.; Darnbrough, J.E.; Paraskevoulakos, C.; Heard, P.J.; Marrow, T.J.; Flewitt, P.E.J. Measurements by x-ray diffraction of the temperature dependence of lattice parameter and crystallite size for isostatically-pressed graphite. Carbon Trends 2021, 4, 100071. [Google Scholar] [CrossRef]
  54. Örkün, Y.; Karatepe, N.; Yavuz, R. Influence of temperature and impregnation ratio of H3PO 4 on the production of activated carbon from hazelnut shell. Acta Phys. Pol. A 2012, 121, 277–280. [Google Scholar] [CrossRef]
  55. Devi, M.; Rawat, S.; Sharma, S. A comprehensive review of the pyrolysis process: From carbon nanomaterial synthesis to waste treatment. Oxford Open Mater. Sci. 2021, 1, itab014. [Google Scholar] [CrossRef]
  56. Asif, F.C.; Saha, G.C. Graphene-like Carbon Structure Synthesis from Biomass Pyrolysis: A Critical Review on Feedstock–Process–Properties Relationship. C 2023, 9, 31. [Google Scholar] [CrossRef]
  57. Mruthunjayappa, M.H.; Kotrappanavar, N.S.; Mondal, D. New prospects on solvothermal carbonisation assisted by organic solvents, ionic liquids and eutectic mixtures—A critical review. Prog. Mater. Sci. 2022, 126, 100932. [Google Scholar] [CrossRef]
  58. Amalina, F.; Razak, A.S.A.; Krishnan, S.; Zularisam, A.W.; Nasrullah, M. A comprehensive assessment of the method for producing biochar, its characterization, stability, and potential applications in regenerative economic sustainability—A review. Clean. Mater. 2022, 3, 100045. [Google Scholar] [CrossRef]
  59. Wang, A.; Sun, K.; Xu, R.; Sun, Y.; Jiang, J. Cleanly synthesizing rotten potato-based activated carbon for supercapacitor by self-catalytic activation. J. Clean. Prod. 2021, 283, 125385. [Google Scholar] [CrossRef]
  60. Yakaboylu, G.A.; Jiang, C.; Yumak, T.; Zondlo, J.W.; Wang, J.; Sabolsky, E.M. Engineered hierarchical porous carbons for supercapacitor applications through chemical pretreatment and activation of biomass precursors. Renew. Energy 2021, 163, 276–287. [Google Scholar] [CrossRef]
  61. Heimböckel, R.; Hoffmann, F.; Fröba, M. Insights into the influence of the pore size and surface area of activated carbons on the energy storage of electric double layer capacitors with a new potentially universally applicable capacitor model. Phys. Chem. Chem. Phys. 2019, 21, 3122–3133. [Google Scholar] [CrossRef] [Green Version]
  62. Taer, E.; Agustino, A.; Farma, R.; Taslim, R.; Awitdrus; Paiszal, M.; Ira, A.; Yardi, S.D.; Sari, Y.P.; Yusra, H.; et al. The relationship of surface area to cell capacitance for monolith carbon electrode from biomass materials for supercapacitor aplication. J. Phys. Conf. Ser. 2018, 1116, 32040. [Google Scholar] [CrossRef]
  63. Lee, E.J.; Lee, L.; Abbas, M.A.; Bang, J.H. The influence of surface area, porous structure, and surface state on the supercapacitor performance of titanium oxynitride: Implications for a nanostructuring strategy. Phys. Chem. Chem. Phys. 2017, 19, 21140–21151. [Google Scholar] [CrossRef]
  64. Chen, T.; Dai, L. Carbon nanomaterials for high-performance supercapacitors. Mater. Today 2013, 16, 272–280. [Google Scholar] [CrossRef]
  65. Ab. Rahim, A.H.; Ramli, N.; Nordin, A.N.; Abd. Wahab, M.F. Supercapacitor performance with activated carbon and graphene nanoplatelets composite electrodes, and insights from the equivalent circuit model. Carbon Trends 2021, 5, 100101. [Google Scholar] [CrossRef]
  66. Lopez-Tenllado, F.J.; Motta, I.L.; Hill, J.M. Modification of biochar with high-energy ball milling: Development of porosity and surface acid functional groups. Bioresour. Technol. Reports 2021, 15, 100704. [Google Scholar] [CrossRef]
  67. Naghdi, M.; Taheran, M.; Brar, S.K.; Rouissi, T.; Verma, M.; Surampalli, R.Y.; Valero, J.R. A green method for production of nanobiochar by ball milling- optimization and characterization. J. Clean. Prod. 2017, 164, 1394–1405. [Google Scholar] [CrossRef] [Green Version]
  68. Welham, N.J.; Williams, J.S. Extended milling of graphite and activated carbon. Carbon N. Y. 1998, 36, 1309–1315. [Google Scholar] [CrossRef]
Figure 1. Chemical structure of chondroitin sulfate [26] (a) and gelatine [27] (b). R1–R3 in chondroitin sulfate structure are sulfate groups.
Applsci 13 08676 g001
Figure 2. SEM images of blue shark chondroitin sulfate, commercial chondroitin sulfate, and blue shark gelatine carbonized for 1 h at 1000 °C, at ×100 (a1a3), ×1.00 k (b1b3), and ×150 k (c1c3) magnification.
Applsci 13 08676 g002
Figure 3. Overall XPS survey spectra for (a) blue shark chondroitin sulfate, (b) blue shark gelatine, and (c) commercial chondroitin sulfate, carbonized for 1 h at 1000 °C under N2 flow.
Applsci 13 08676 g003
Figure 4. ZC image (a) with EDX mapping analysis at ×80 K magnification (b); (c) SEM mode ×150 k; (d) Z-contrast mode ×150 k; (e) STEM mode ×150 k; (f) HR-STEM at 200 kV and interplanar distance graph (inset) obtained from the analysis of the area inside the red box, of blue shark chondroitin sulfate carbonized at 1000 °C for 1 h.
Applsci 13 08676 g004
Figure 5. ZC image (a) with EDX mapping analysis at ×80 K magnification (b); (c) SEM mode ×150 k; (d) Z-contrast mode ×150 k; (e) STEM mode ×150 k; (f) HR-STEM at 200 kV and interplanar distance graph (inset) obtained from the analysis of the area inside the red box, of commercial chondroitin sulfate carbonized at 1000 °C for 1 h.
Applsci 13 08676 g005
Figure 6. ZC image (a) with EDX mapping analysis at ×80 K magnification (b); (c) SEM mode ×150 k; (d) Z-contrast mode ×100 k; (e) STEM mode ×100 k; (f) HR-STEM at 200 kV and interplanar distance graph (inset) obtained from the analysis of the area inside the red box, of blue shark gelatine carbonized at 1000 °C for 1 h.
Applsci 13 08676 g006
Figure 7. FTIR-ATR spectra of gelatine and chondroitin sulfate-based carbons (dashed line) and raw gelatine and chondroitin sulfate (solid line).
Applsci 13 08676 g007
Figure 8. Raman spectra of (black) blue shark chondroitin sulfate-based carbon (1000 °C, 1 h), (red) blue shark gelatine-based carbon (1000 °C, 1 h), and (blue) commercial chondroitin sulfate-based carbon (1000 °C, 1 h).
Applsci 13 08676 g008
Figure 9. First Raman region (a) and second Raman region (b) of the blue shark chondroitin sulfate-based carbon (1000 °C, 1 h).
Applsci 13 08676 g009
Figure 10. X-ray diffraction (XRD) patterns for gelatine and chondroitin sulfate-based carbons (1 h at 1000 °C).
Applsci 13 08676 g010
Figure 11. Relationship between the volume of N2 adsorbed and desorbed by the gelatine and chondroitin sulfate-based carbons and the relative pressure.
Applsci 13 08676 g011
Figure 12. Cyclic voltammetry curves (30 °C, ethaline, 50 mV s−1) for gelatine and chondroitin sulfate-based carbon electrodes.
Applsci 13 08676 g012
Figure 13. Galvanostatic charge–discharge curves in ethaline at 30 °C (1st cycle) for gelatine and chondroitin-based sulfate-based carbons.
Applsci 13 08676 g013
Figure 14. Nyquist plots for blue shark chondroitin sulfate (a), commercial chondroitin sulfate (b), and blue shark gelatine (c) -based carbons (+0.5 V vs. Ag). R(RQ) and RQ fitted to experimental data. (d) Differential capacitance (F cm−2) curves measured at the carbon/DES interface in the accessible potential window (0–1 V).
Applsci 13 08676 g014
Figure 15. SBET (a), Dp (b) for different ball-milling times and galvanostatic charge–discharge curves (c), in ethaline at 30 °C (1st cycle at 1 A g−1) (for the best performing materials) and for gelatine and chondroitin-based sulfate-based carbons.
Applsci 13 08676 g015
Figure 16. Comparison between the specific capacitance of non-milled and ball-milled (BM) materials (with the highest specific surface area).
Applsci 13 08676 g016
Table 1. At % (atomic percentage %) composition of the elements presented in the raw and based carbons at 1000 °C for 1 h.
At %
ElementBlue Shark Chondroitin SulfateCommercial Chondroitin SulfateBlue Shark Gelatine
Raw1000 °C 1 hRaw1000 °C 1 hRaw1000 °C 1 h
C 1s49.175.445.671.268.181.4
N 1s0.10.50.10.70.92.2
O 1s38.115.754.328.114.14.1
Na 1s2.01.0----
P 2p------
S 2p5.13.2--9.14.3
K 2p4.43.0--4.52.5
Ca 2p1.21.2--6.32.5
Table 2. ID/IG and crystallite size values of the blue shark and commercial-based carbons throughout the peak deconvolution of the Raman spectra in the first Raman region.
Carbon SourceR2ID/IGLa/nm
Blue shark chondroitin sulfate0.9991.56 ± 0.0212.40
Commercial chondroitin sulfate0.9981.84 ± 0.0610.29
Blue shark gelatine0.9952.09 ± 0.049.13
Table 3. Interplanar distances (d) calculated using UHR-STEM and XRD techniques.
Carbon SourceInterplanar Distance (d)
UHR-STEMXRD
Blue shark chondroitin sulfate2.6 ± 0.2 Å2.8
Commercial chondroitin sulfate2.9 ± 0.1 Å3.5
Blue shark gelatine3.41 ± 0.05 Å3.5
Table 4. Features obtained from the BET analysis of the gelatine and chondroitin sulfate-based carbons at 1000 °C for 1 h.
BET Isotherm Analysis
Carbon SourceSBET
(m2 g−1)
Vmicro
(cm3 g−1)
Vmeso
(cm3 g−1)
Vtotal
(cm3 g−1)
Dp
(nm)
Blue shark chondroitin sulfate135.240.0230.0440.0671.44
Blue shark gelatine30.320.0110.0190.0300.87
Commercial chondroitin sulfate76.110.0190.0240.0431.11
Table 5. Galvanostatic charge–discharge analysis of the marine biopolymer-based carbons from different waste sources (carbonized for 1 h at 1000 °C).
Galvanostatic Charge–Discharge Analysis
SourceCarbon SourceSBET (m2 g−1)C (F g−1)%C RetentionReference
Blue sharkChondroitin sulfate135.2440 ± 271 @5000 cyclesThis work
Gelatine30.327 ± 171 @5000 cycles
CommercialCommercial chondroitin sulfate76.1125 ± 386 @5000 cycles
Squidβ-Chitin149.320 ± 196 @1000 cycles[12]
Prawnα-Chitin85.015 ± 292 @1000 cycles
MusselGlycogen768.198 ± 299 @1000 cycles[11]
Disclaimer/Publisher’s Note: The statements, opinions and data contained in all publications are solely those of the individual author(s) and contributor(s) and not of MDPI and/or the editor(s). MDPI and/or the editor(s) disclaim responsibility for any injury to people or property resulting from any ideas, methods, instructions or products referred to in the content.