Article

Study on Filling Material Strength and Dam Failure Characteristics of Loess Dam

1
School of Highway, Chang’an University, Xi’an 710064, China
2
China Electronic Research Institute of Engineering Investigations and Design, Xi’an 710054, China
3
Shaanxi Province Soil Engineering Technology Research Center, Xi’an 710054, China
*
Author to whom correspondence should be addressed.
Appl. Sci. 2023, 13(15), 8683; https://doi.org/10.3390/app13158683
Submission received: 29 June 2023 / Revised: 20 July 2023 / Accepted: 26 July 2023 / Published: 27 July 2023

Abstract

:
In the Loess Plateau region, loess, as a widely distributed building material, is often used as a filling material for dams. When the water level reaches a certain height, the body of a dam is prone to shear failure due to the penetration of water. The change in the shear performance of local loess filler can affect the overall strength of loess dams. Therefore, the filler of a loess dam is selected to study the shear performance. The progressive failure process of a loess dam is simulated. The shear failure characteristics of loess filler under the influence of water content, confining pressure, and dry density were explored. The characteristics of the shear failure of a loess dam were analyzed. The remolded loess is prone to shear expansion failure under low confining pressure, low water content, and high dry density, and is prone to shear shrinkage failure under high confining pressure, high water content, and low dry density. When the water content is constant, the cohesion increases with the increase in dry density. When the dry density is constant, the internal friction angle generally increases with the increase in water content. However, when the dry density is high, the permeability of the remolded loess is weakened, resulting in uneven water distribution under a low water content, which affects the test results. The failure process of the loess dam is a progressive shear failure, which is affected by the water level and water pressure, and is destroyed under the action of pore water pressure and water body lateral pressure.

1. Introduction

Loess has a wide distribution range and covers a large area in China (Zheng 2019) [1]. Liu (1965) completed the distribution map of loess in China and put forward the “new wind formation theory” of loess, which provides a profound theoretical basis for subsequent studies by scholars [2]. In some engineering structures, especially in the Loess Plateau region of China, local materials are taken into account under the consideration of economic cost and other factors, which greatly reduces engineering costs. Loess accumulation dams and siltation dams are built in northwestern China for soil and water conservation. During the service of geotechnical buildings, the shear strength of filling materials is relatively high in their natural state. When rain falls or groundwater flows, the soil inside is soaked by water; therefore, this causes many geological disasters [3]. The change in water content after wetting causes structural changes in the soil [4,5], which change the matric suction and stress–strain properties of the soil [6,7]. Loess underwent volume and shear deformations as a result of soaking, which indicated compression and shearing behavior [8]. The linear form of the Mohr–Coulomb strength theory can accurately reflect the failure behavior of the loess along a wetting path, which is dependent on the stress level, the loss degree of matric suction, as well as the hydro-mechanical path [9]. Based on this information, the stress level threshold value was determined, which may be used for assessing whether the loess will fail due to moisture. To investigate the degree of matric suction loss from stable conditions to malfunction, the threshold value of matric suction at failure was established. The volumetric water content is a typical indicator of the degree of humidification. Under various volumetric water contents, the equivalent matric suction can be derived in accordance with the soil–water characteristic curve. Experiments can be used to establish the relationship between soil strength and deformation parameters and matric suction [10]. The effective stress parameter can be determined using the CU (consolidated undrained) test to establish the absorption stress curve, which is straightforward to implement in reality, as the measurement of the matric suction is challenging and time consuming [11]. The Duncan–Zhang model is frequently used to investigate the stress–strain properties of unsaturated loess. Many academics examine the characteristics of unsaturated loess and alter the formula, nonetheless, due to its inherent limits [12,13]. The relationship between shear rate, confining pressure, dry density, and the shear strength index of soil has a strong regularity when the stress–strain characteristics of the soil are obtained through testing [14,15,16,17], and the equation with the good fitting relationship can be established to calculate the strength of multi-dimensional loess. Additionally, as suction increases, the internal friction angle lowers and the shear strength rises, both of which are non-linear changes [18,19,20].
Researchers have simulated the accumulation dam’s overflow failure process in order to analyze the seepage failure of the dam. Du (2021) studied the stability of the dam reinforced by a geogrid and geotextiles through a model test of a tailings dam reinforced in the design site, primarily analyzing the change in pore pressure and pressure inside the dam under the action of water pressure, and obtaining the reinforcing mechanism of the two materials [21]. The general design of the dam body and the physical characteristics of dam filling are both factors in the dam’s collapse mechanism. A test method created by Sainsbury (2021) can be used to describe the stability of extensive cemented fillings. By gluing large-sized waste rock fragments, the filling accumulation body can be mimicked. In order to successfully replicate the failure of the mine filling body, the direct shear test and three-point bending test were performed on the sample. The results were excellent [22].
At present, there are relatively few studies on the seepage damage of loess dams caused by water bodies because such type of accumulation dam generally only exists in an area where loess is widely distributed. With reference to the existing research results of loess materials and accumulation dams, field loess was sampled, and the variation law of the shear strength index under the influence of internal and external factors was studied after remodeling. The failure process of the dam was simulated, and the deformation and stress inside the dam body in three failure stages were analyzed. The results of this study can only be used for a qualitative analysis of the failure of the dam. The physical and mechanical properties of each part of the soil inside the dam are different under the action of water, and the scour flow effect of water inside the soil is not considered. For the seepage failure repair of the loess dam, the results of the triaxial test can provide an effective material parameter interval, and the deformation data of the numerical simulation can provide some reference for the reinforcement design and construction of the dam.

2. Materials and Methods

The soil used for this experiment was taken from a loess accumulation dam in Ansai Nangou, Yan’an city, Shaanxi province, which is ML in the USCS classification of loess. A Bettersize2000 laser particle size distribution instrument was used for particle analysis of dam body soil. The particle grading curve of the sample is shown in Figure 1. Part of the soil was dried to measure its natural moisture content, and the natural weight was calculated by retrieving the ring cutter sample. The basic physical properties of dam body soil are shown in Table 1.
The triaxial test used GDS unsaturated soil triaxial apparatus. The range of confining pressure controller of the system is 0–1 Mpa, and the axial pressure controller can provide the maximum axial pressure of 5 kN. The sensor and data conversion device of the triaxial test system can automatically collect and output data from various parameters to be tested. The sample required for this instrument is 39.1 mm in diameter and 80 mm in height. It is prepared using the layered compaction method. An equal mass of soil is added four times. In this test, four moisture contents, namely 10%, 15%, 20% and 25%, were used, and the dry densities were 1.4 g/cm3, 1.5 g/cm3, 1.6 g/cm3 and 1.7 g/cm3, respectively. The samples were subjected to confining pressures of 50 kPa, 100 kPa, 150 kPa, and 200 kPa, respectively.
The remolded soil samples retrieved from the site were air-dried under natural conditions. After the soil sample was dried, it was put into the oven for drying; the temperature was 105 degrees Celsius, the time was 24 h, and it was weighed before and after drying. The moisture content was obtained after natural air drying. Then, the moisture content of soil samples after natural air drying and the quality of water added to soil samples with moisture contents of 10% and 15% could both be calculated. After adding extra water during the stirring process to achieve the target moisture content, it was left to stand for 24 h before compacting. In this process, the water loss of soil samples with water contents of 10% and 15% during compaction was ignored. For the samples with a water contents of 20% and 25%, due to their high water content, it was impossible to add water first and then compact. Therefore, the soil samples with a water content of 15% were first compacted in layers to achieve the target dry density, and then the pre-determined water content was dripped into the sample with a rubber dropper to achieve the target water content. It was placed in a moisturizing container and stood for 48 h to make the water uniform.
After the sample preparation was completed, Unconsolidated undrained triaxial shear tests were carried out on the samples. The sample was installed in the GDS static triaxial apparatus, the shear rate and confining pressure were set, and the test was stopped when the shear strain variable reaches 20%.

3. Results

3.1. Indoor Triaxial Tests

The failure types of soil in the triaxial test are mainly divided into three types: brittle failure, plastic failure, and approximate ideal plastic failure. Brittle failure and plastic failure can be divided into four types according to their stress–strain curves: strong strain softening, weak strain softening, strong strain hardening, and weak strain hardening. As can be seen from Figure 2, when the dry density is 1.7 g/cm3, the relative displacement of soil samples on the shear plane gradually decreases with the increase in confining pressure, and the penetration degree of the fracture surface also decreases. When the confining pressure values are 50 kPa and 100 kPa, the shear plane is more significant. The confining pressure values increase to 150 kPa and 200 kPa, and the shear interface is more blurred when the sample is destroyed. When confining pressure remains unchanged and dry density increases, the failure type of samples changes from plastic failure to brittle failure (Figure 3). The soil sample with lower dry density has more pores inside, and the soil particles overlap with each other. The contacts between the particles are mainly point–point or point–line, and the strength is low. When subjected to a small external force, the structure is destroyed, and the soil particles fall into the pores. Therefore, most of the deformation during the shearing process is caused by the constant compression of the pore volume, and shearing contraction occurs during the shearing process. The increase in the dry density of soil samples creates a closer internal granular arrangement, and internal contact between samples becomes a priority, with mosaic structures between particles. The forms are mainly line–line and line–face, and the particles are closely attached. Therefore, there are less pores between the particles, the pore compression amount is small, and the mutual displacement between the soil particles during the shearing process causes the volume of the soil sample to increase after shearing, that is, the shear dilatancy phenomenon occurs. As shown in Figure 4, with the increase in water content, the shear outlet at the lower end of the shear plane moves up gradually, the included angle (acute angle) between the shear plane and the horizontal plane decreases gradually, the length of the shear plane decreases, and the sample changes from brittle failure to plastic failure.
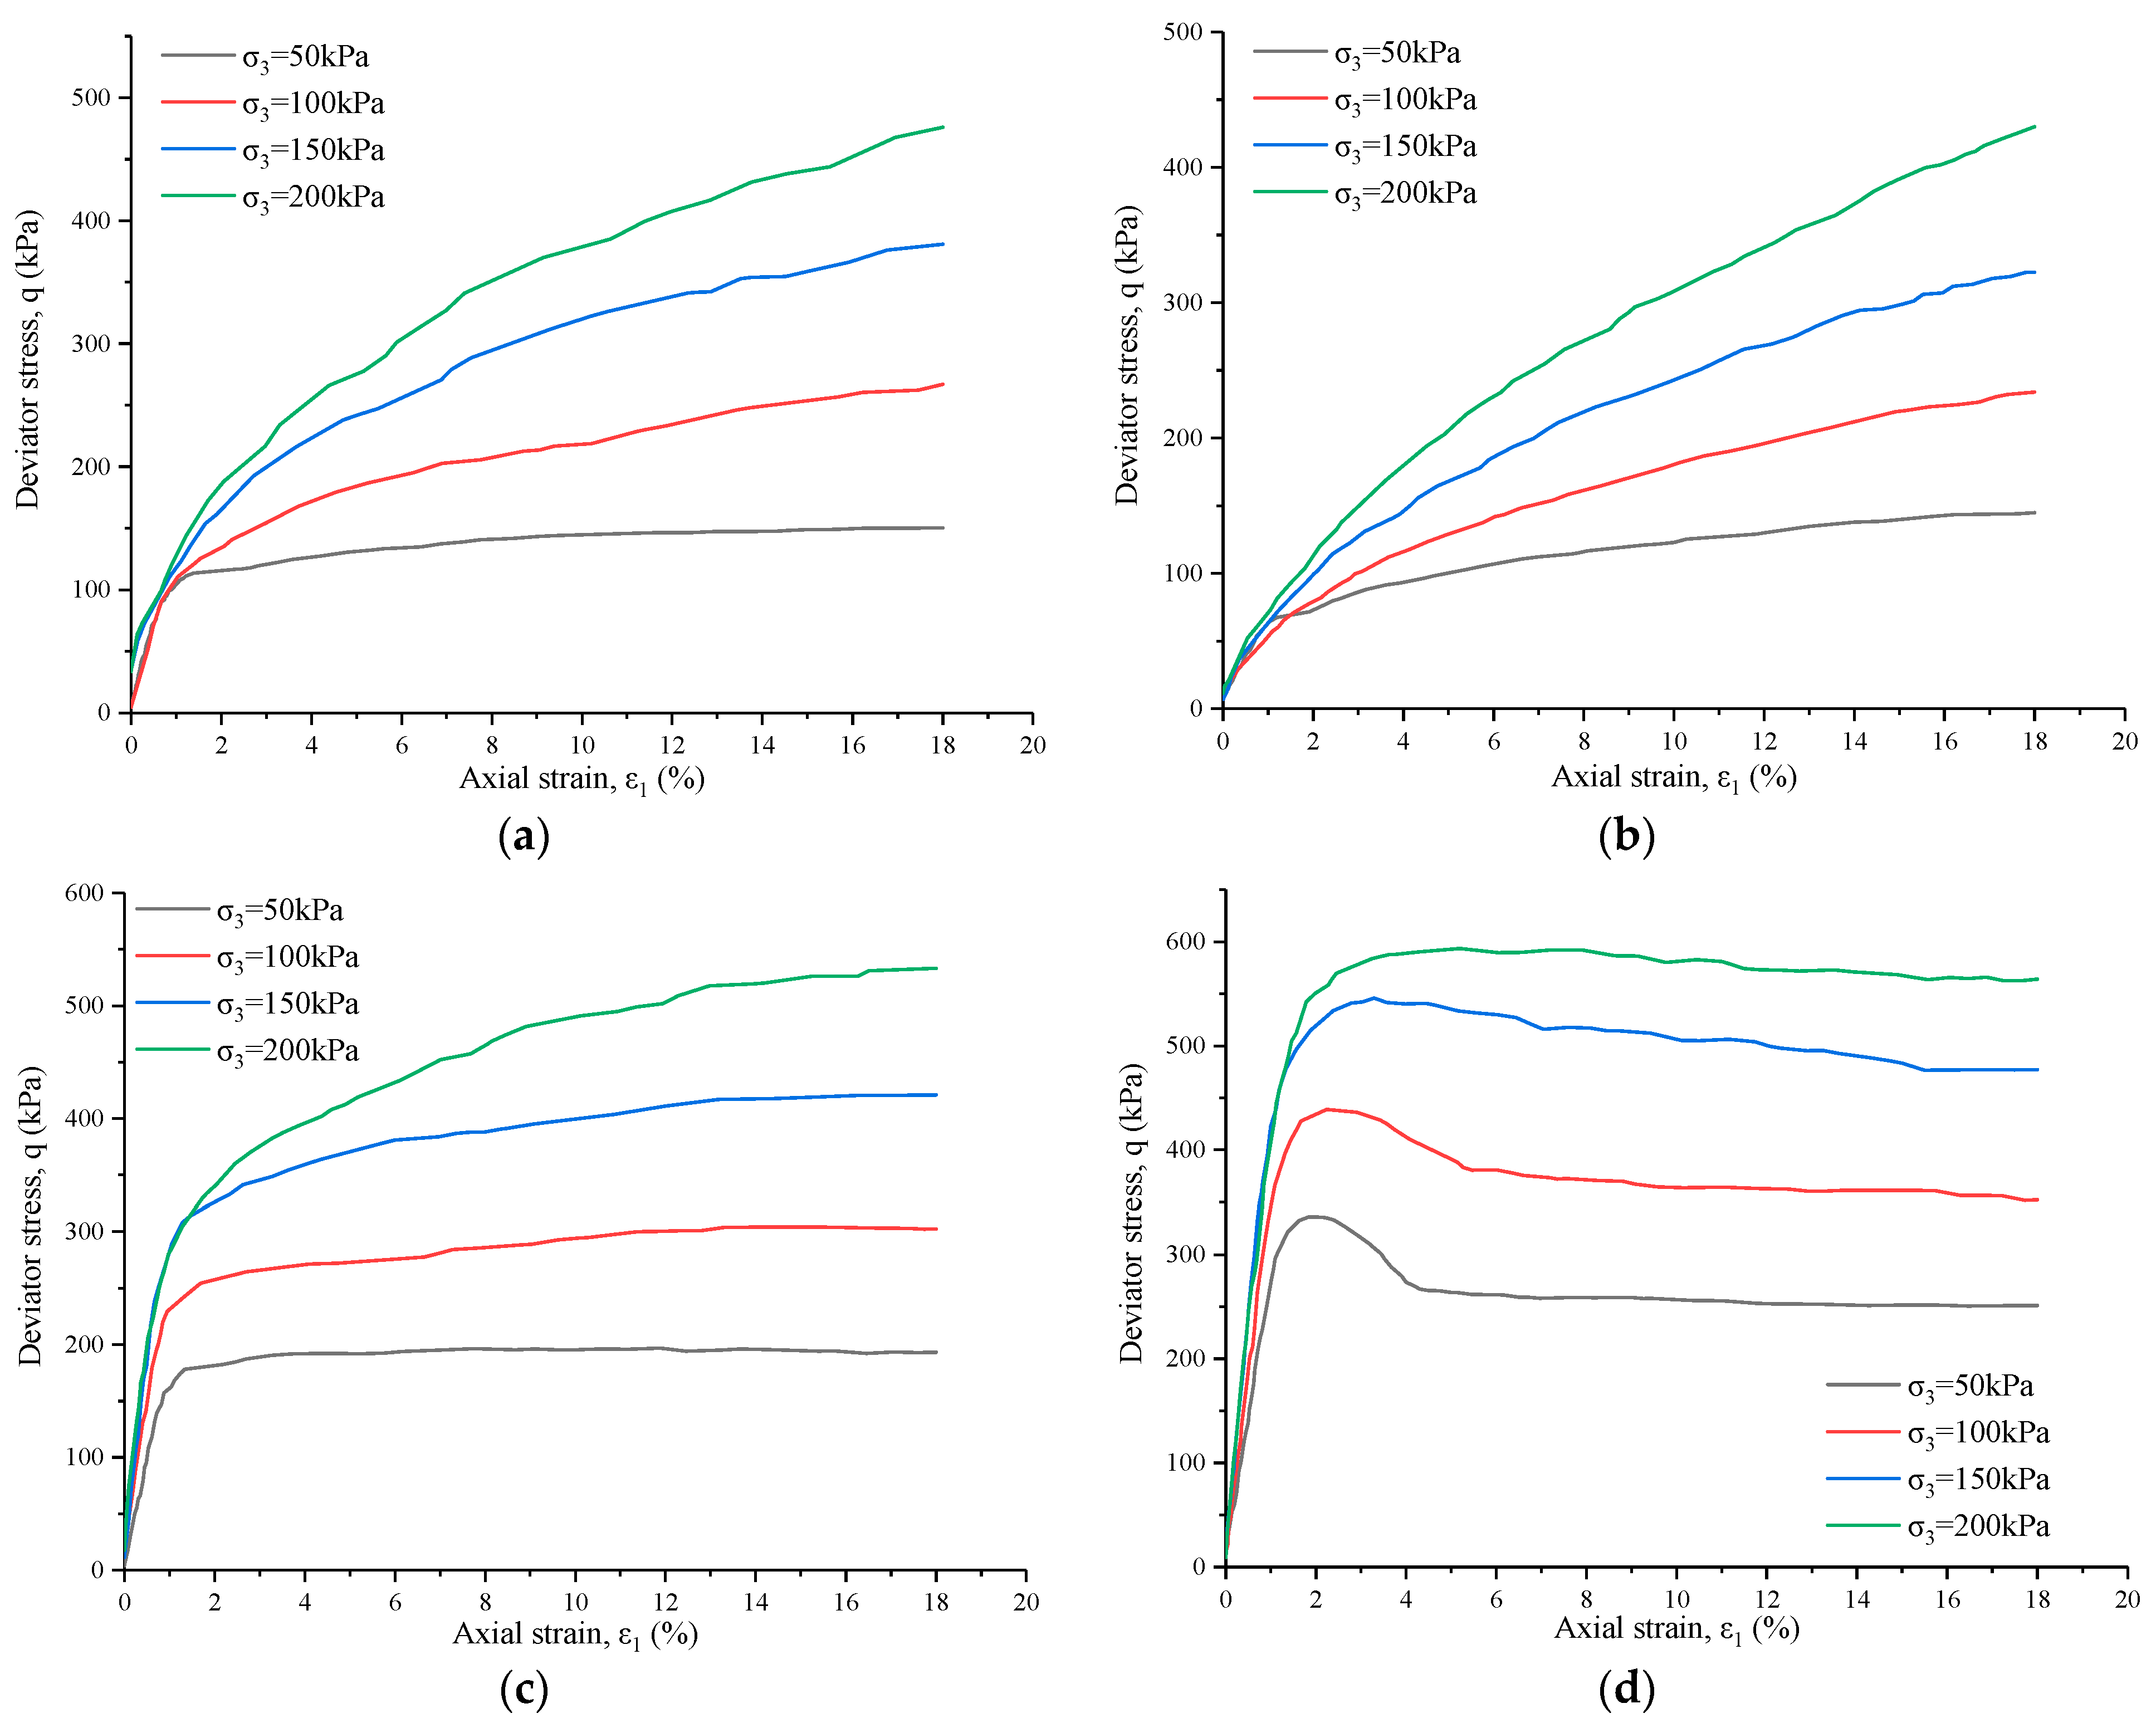
Figure 5 shows the stress–strain curves of remolded loess under different confining pressures and dry density conditions. As the confining pressure increases, the stress–strain curve moves up and the peak strength of the sample increases. After increasing the confining pressure, the strain-hardening degrees of all the samples are more significant than the upper confining pressure, and a strong strain-hardening type is observed under high confining pressure.
When a sample has a water content of 10%, the dry density values of 1.4 g/cm3 and 1.5 g/cm3 are strain hardened under different confining pressure conditions; when the sample with a dry density of 1.6 g/cm3 was shear under a confining pressure of 50 kPa, the deviator stress remained almost unchanged with the increase in axial strain, showing an approximate ideal plastic failure characteristic.
Samples with a dry density of 1.7 g/cm3 showed different degrees of strain softening under different confining pressures. During the formation of loess, the combination and arrangement of the spatial stacking of scattered particles directly affect the strength and deformation characteristics of the soil. Under a low confining pressure, the confining pressure will compress the pores between the soil particles but does not change the contact mode between the skeleton elements, and the microstructure does not change significantly, so the shear strength is low. When the confining pressure gradually increases, the pores between the soil particles are compressed, and the pores of the supports formed by lapping between the coarse particles are destroyed by external forces, forming a more stable skeleton structure. Therefore, the threshold of resistance to external forces is higher, and the shear strength index also rises. In the triaxial shearing process, changes in the contact mode between the particles and the mutual position of the particles, as well as the secondary structure formation process of re-engagement between the particles, occur. Then, the process from unstable to stable to unstable occurs, followed by the destruction of the dam.
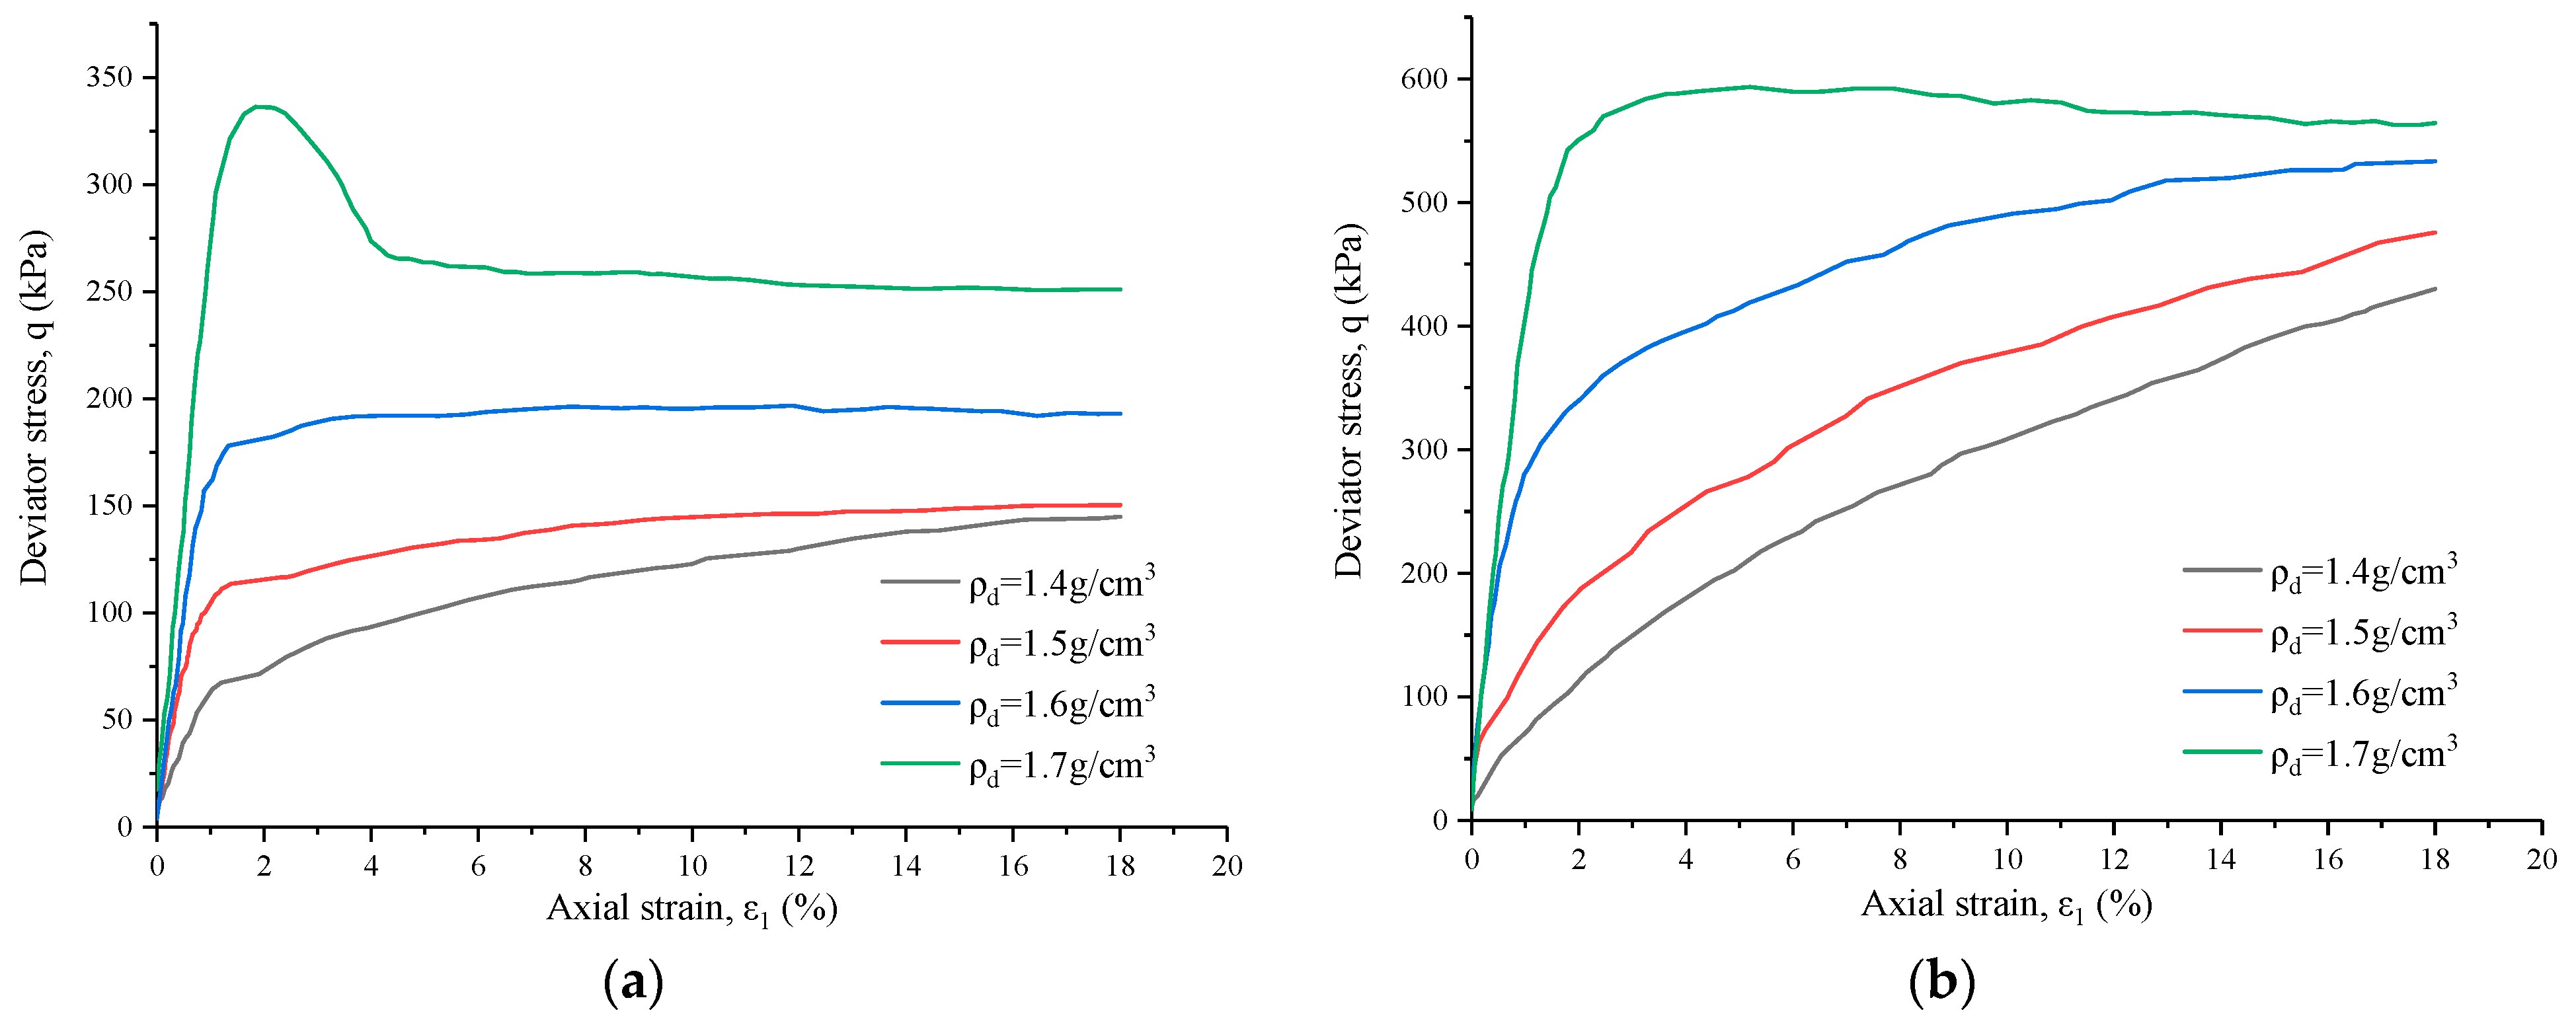
It can be seen from Figure 6a that the peak strength increases significantly with the increase in dry density. At a low confining pressure, samples with a dry density of 1.7 g/cm3 showed strong strain softening, while other dry densities all showed strain hardening under high and low confining pressure conditions, and when confining pressure remained unchanged, the strain-hardening degree gradually weakened with the increase in dry density (Figure 6b). The arrangement of the skeleton element parts is tighter as the dry density is increased, the inter-particle bite force and the joint force are increased, and the number of overhead pores is reduced compared with the low density. The shape variable caused by the pores during the shearing process is small, and deformation is mainly caused by the damage that occurs after the particles contact with each other, so the strength is increased.
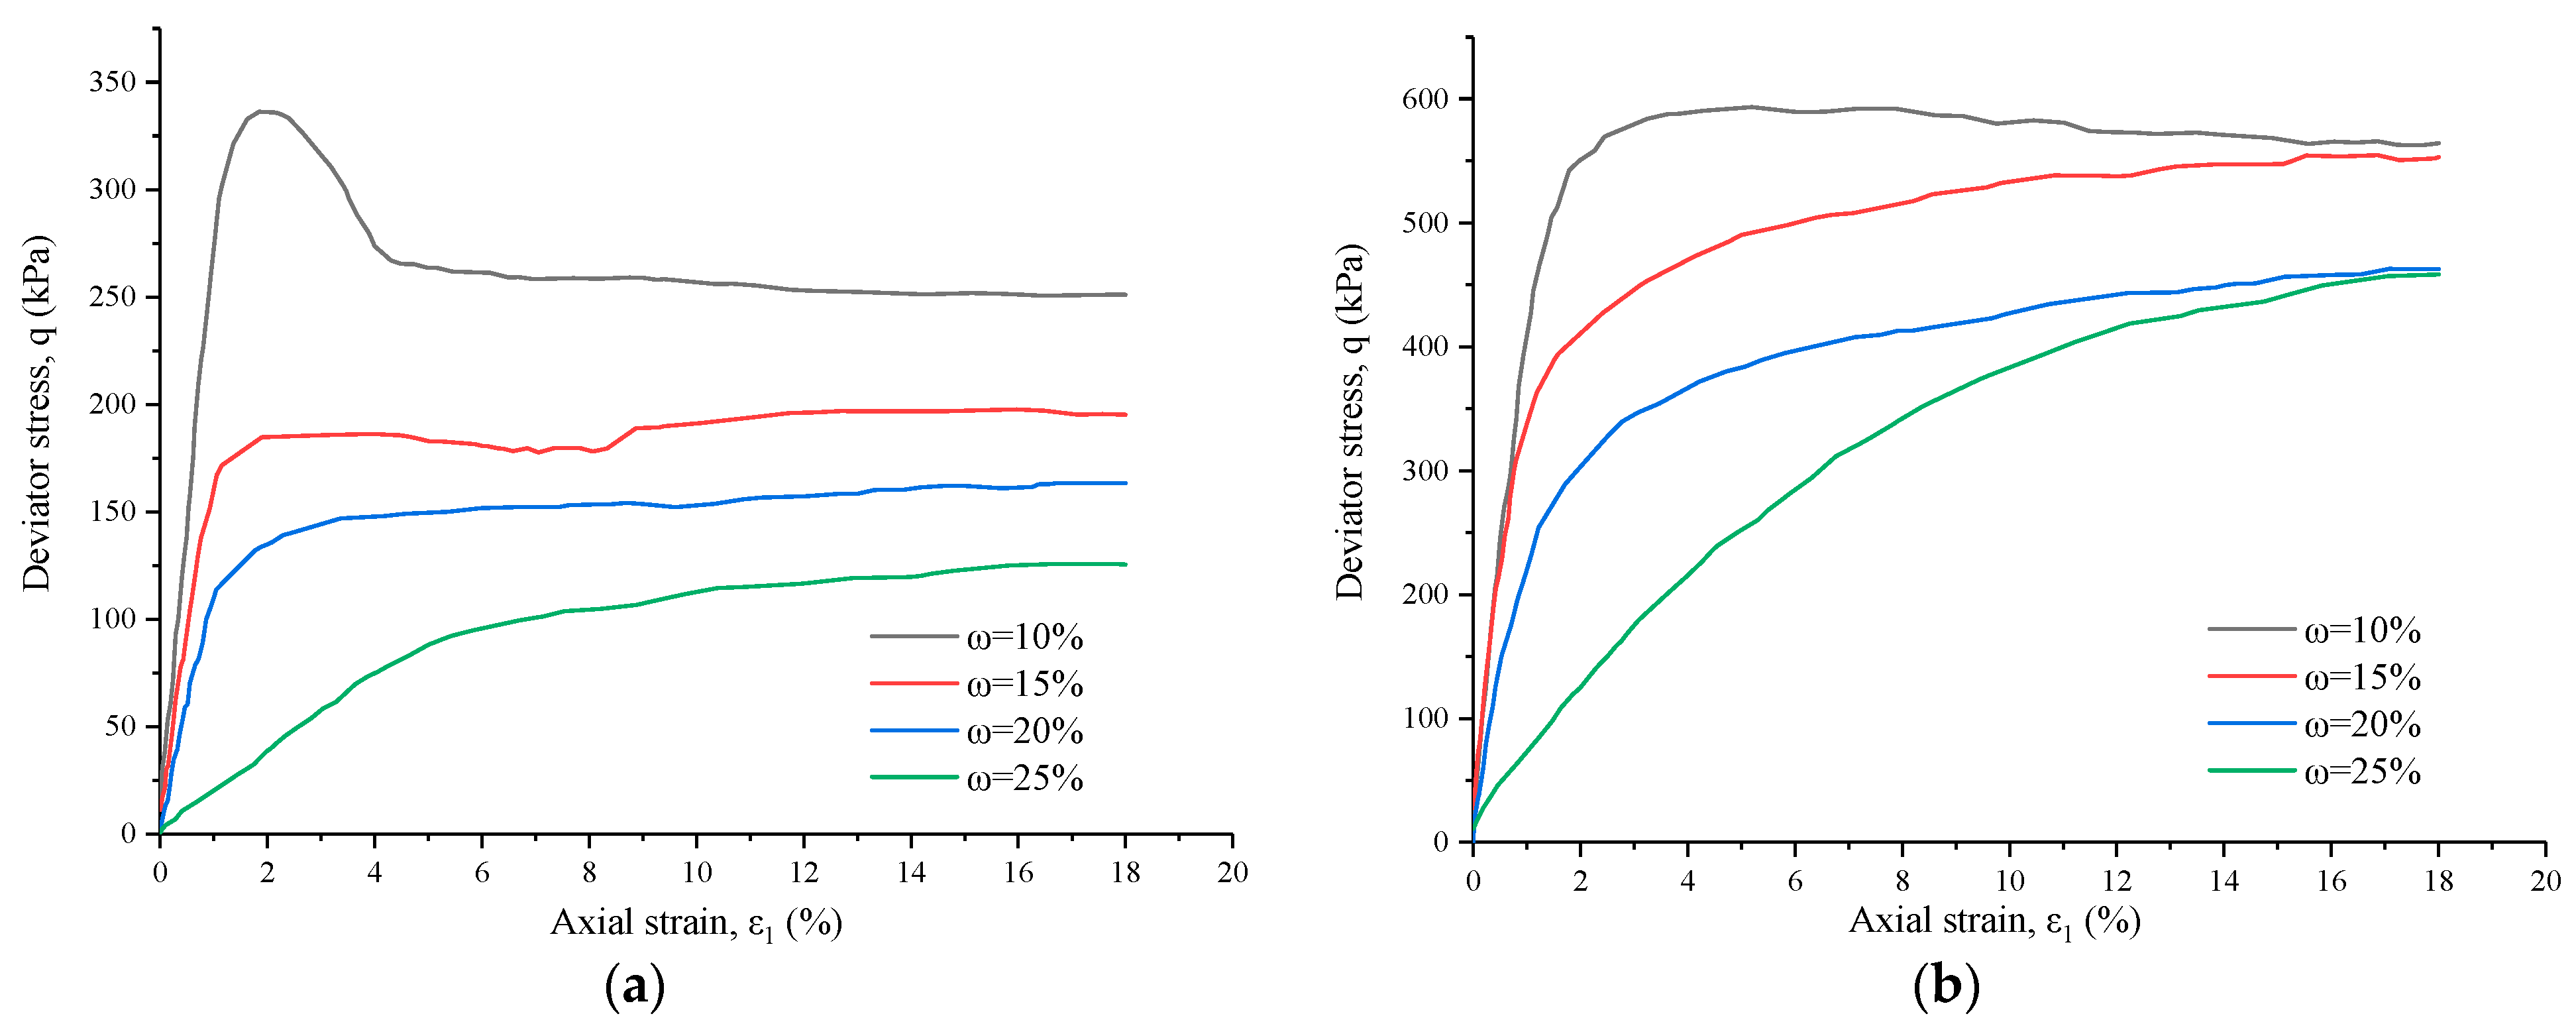
It can be seen from Figure 7 that the stress–strain curve changes significantly with the moisture content, and the peak stress of the sample decreases with the increase in the moisture content. When the dry density values were 1.4 g/cm3 and 1.5 g/cm3, the change in moisture content did not significantly change the failure type of the sample. When the dry density of the sample increases to 1.6 g/cm3 and 1.7 g/cm3, the sample changes from brittle failure to plastic failure as the water content increases, and the strain-softening type changes to the strain-hardening type. When the moisture content increases, water fills the intergranular pores in the loess framework, dissolves intergranular suffusion, thickens the water film on the surface of soil particles, decreases the intergranular bonding force and the occlusal friction force, and decreases the strength.
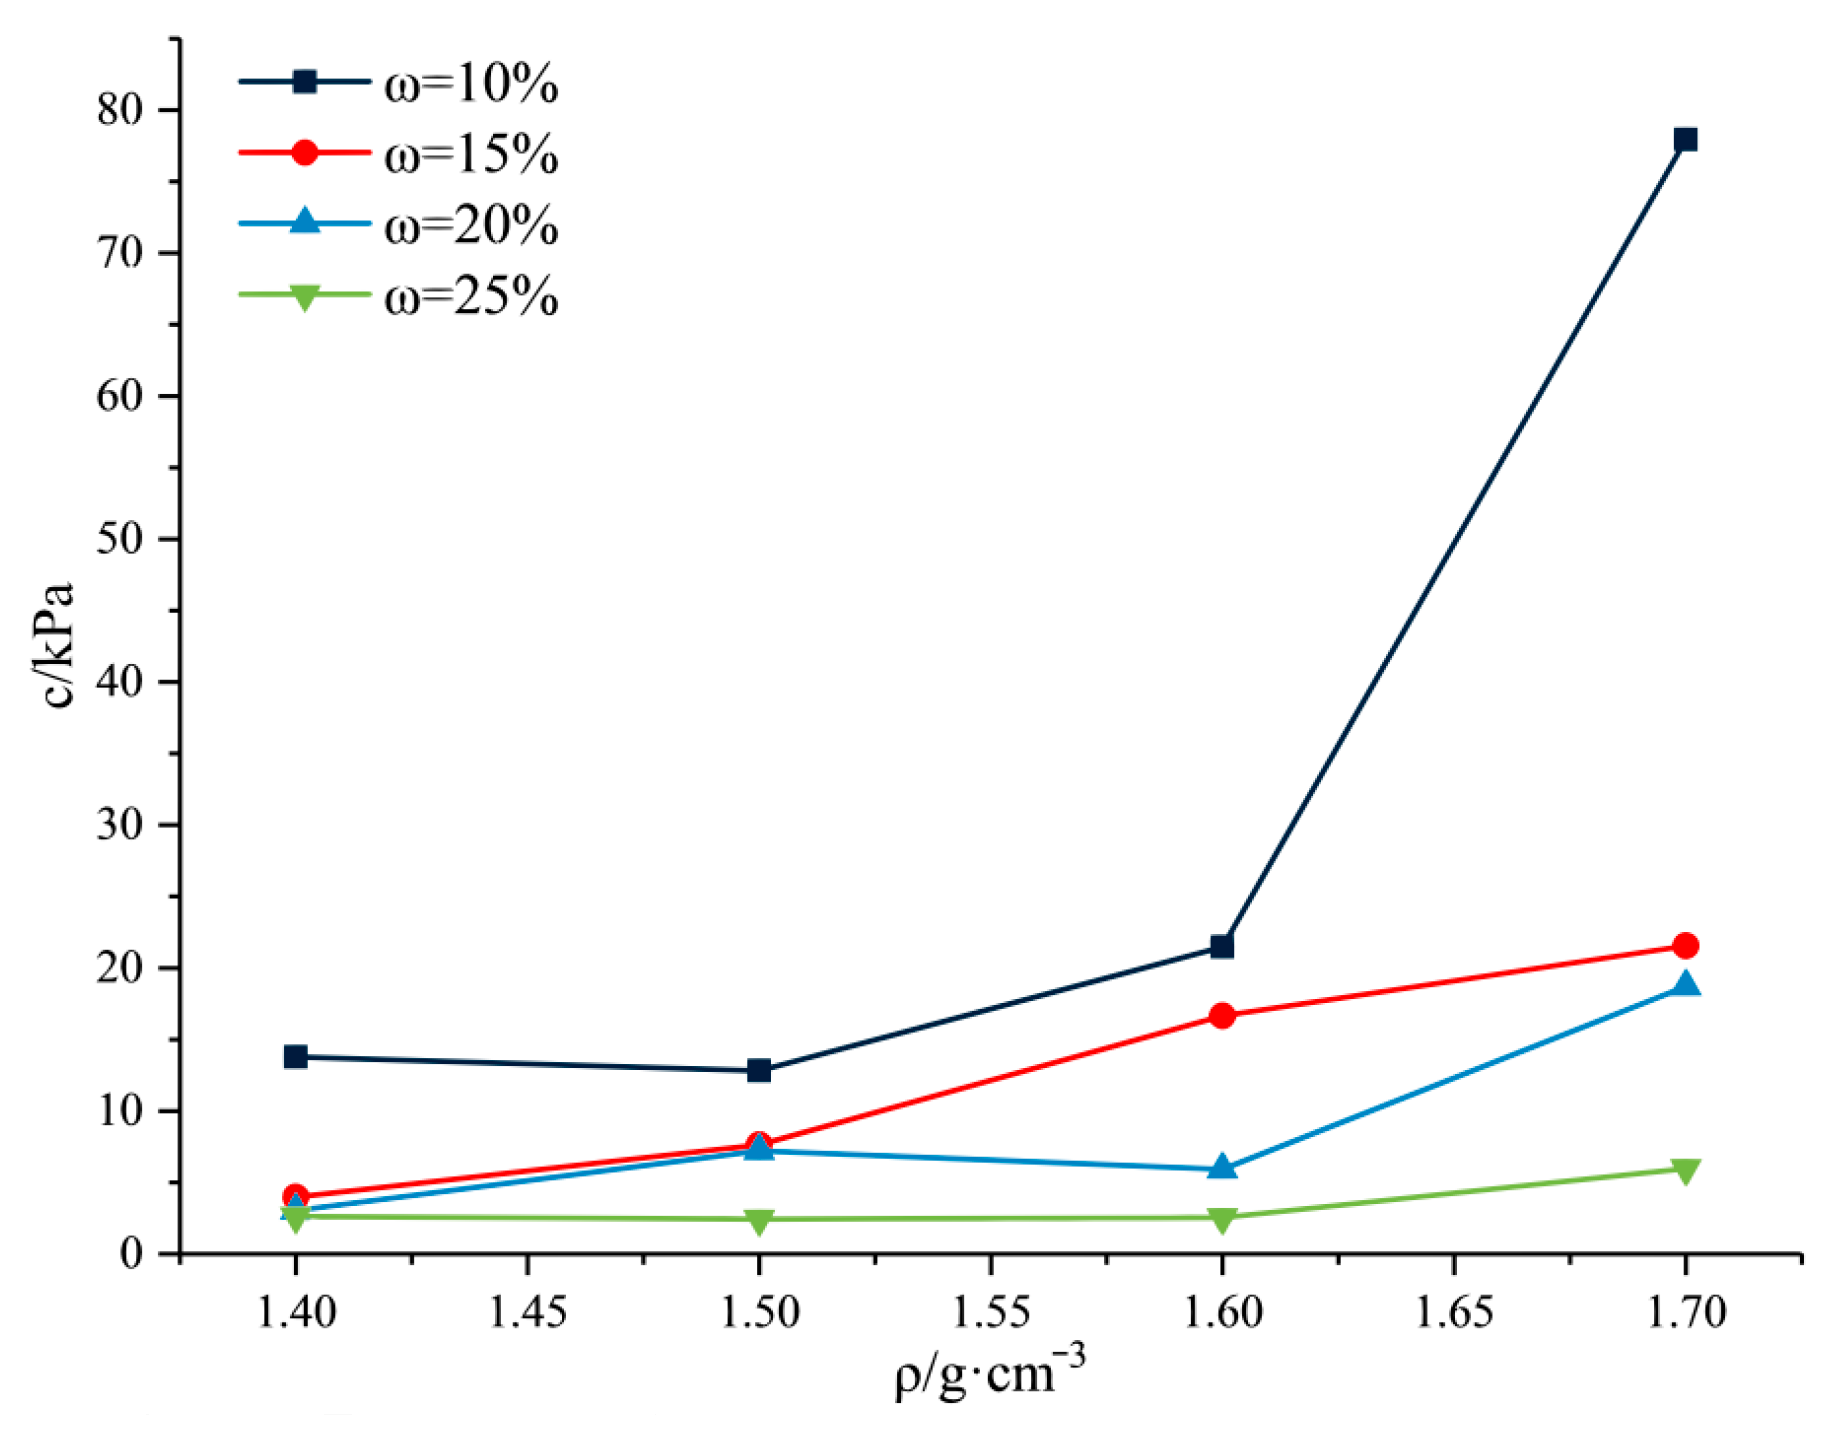
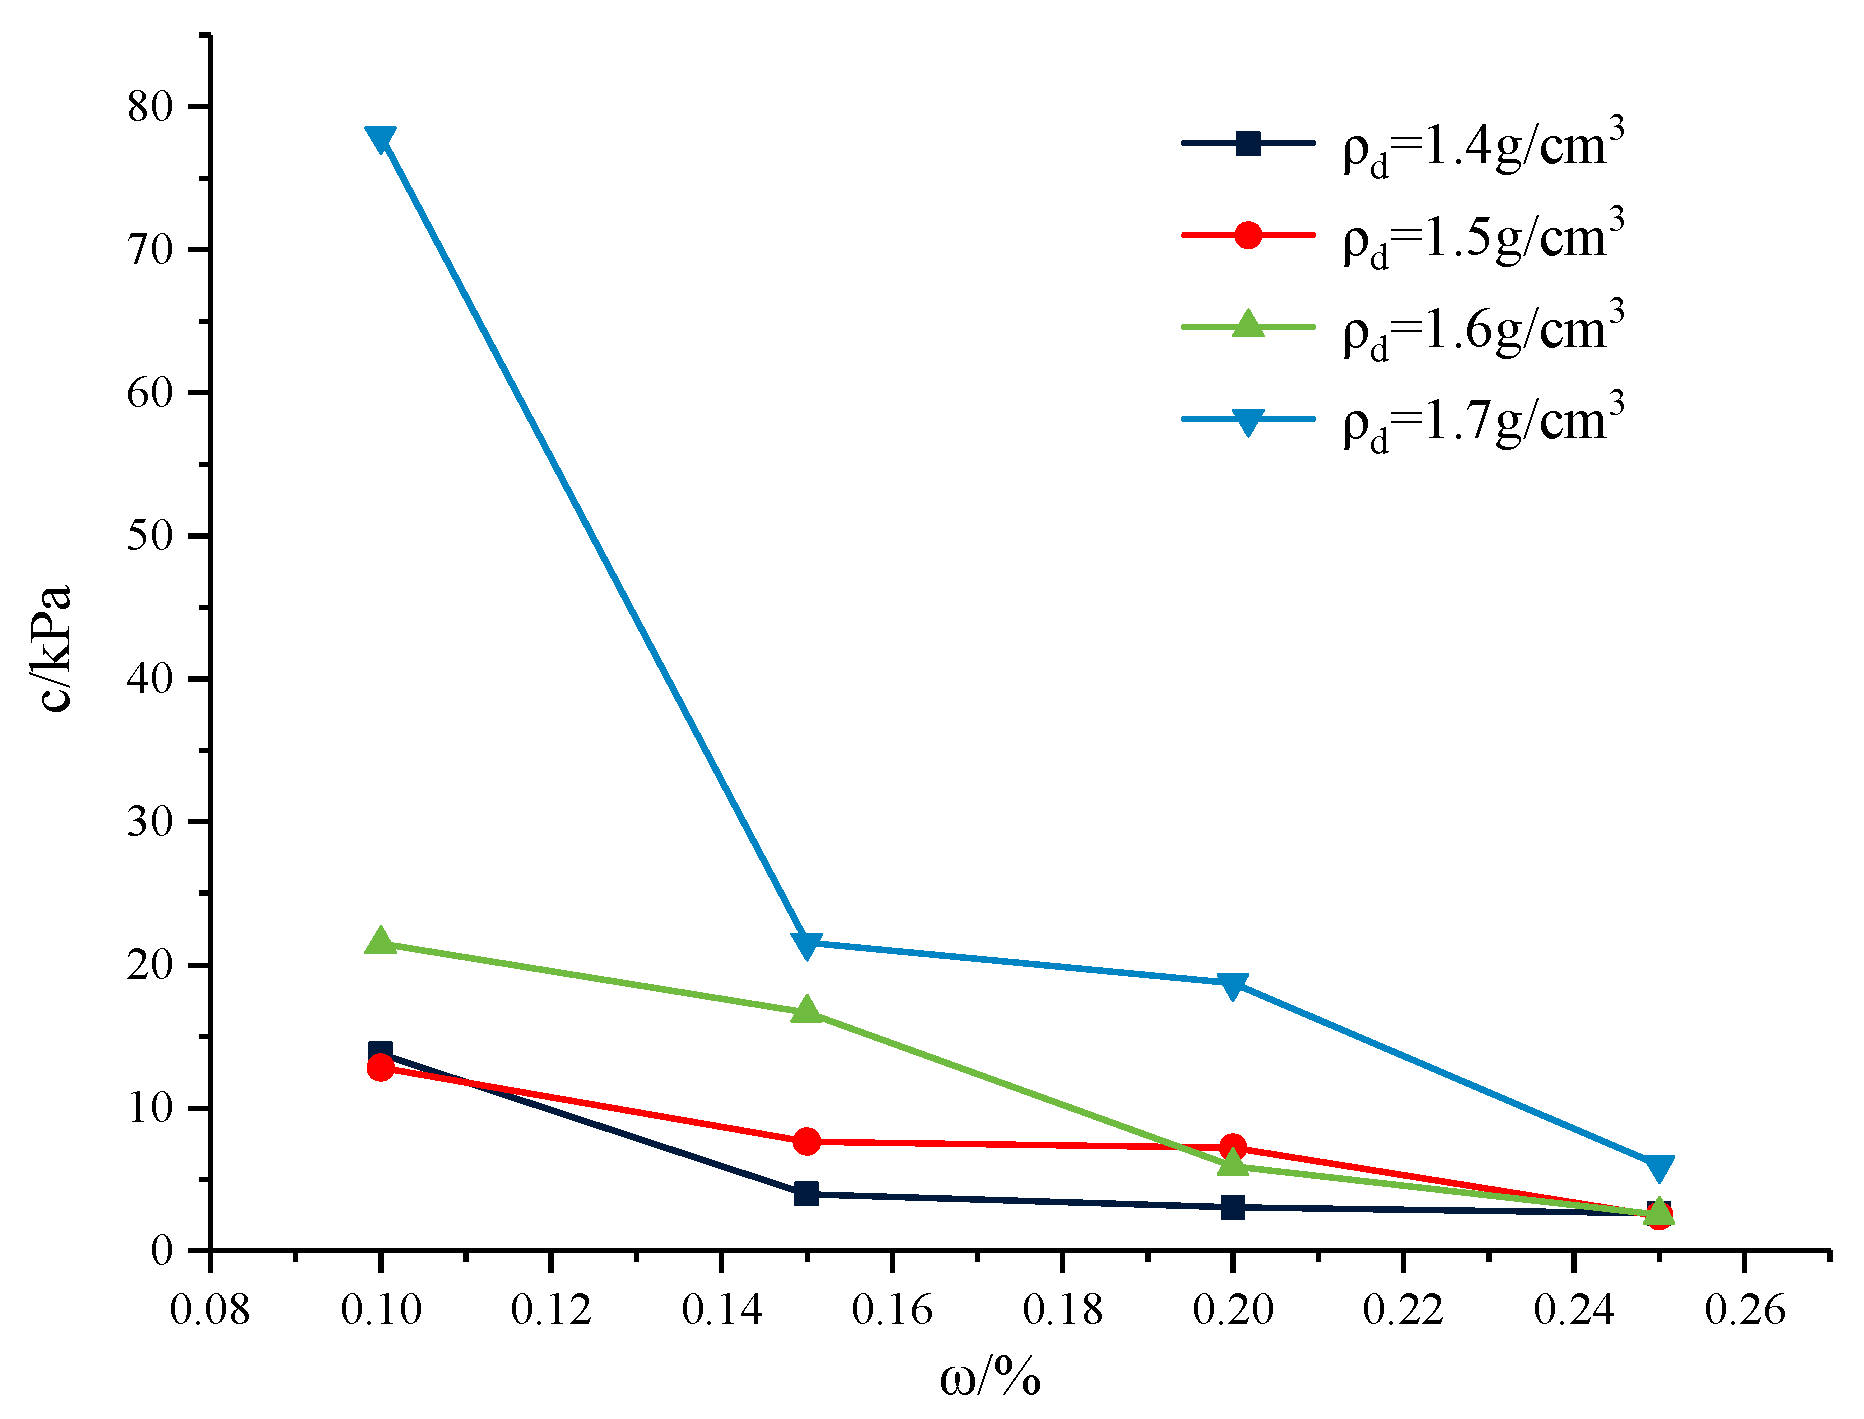
Figure 8, Figure 9, Figure 10 and Figure 11 shows the change rule of shear strength index and moisture content and dry density. The relationship curve between the shear strength index and moisture content and dry density is drawn by using cohesion and the internal friction angle as vertical coordinates and dry density and moisture content as horizontal coordinates, respectively. Scholars divided the cohesion into two parts: original cohesion and solidified cohesion (Li 2013). The original cohesive force comes from the electrostatic force and van der Waals force between particles. The closer the distance between particles is, the more contact points of soil particles per unit area, and the greater the original cohesive force will be. When the particles are separated from each other by a certain distance, the original cohesion is completely lost. Solidification cohesion depends on the suffusion substances present between particles, such as free chlorides, iron salts, carbonates, and organic matter in the soil. When water is filled in the intergranular pores of the soil, the suffusion substances between the soil particles are dissolved, and the strength of the intergranular connection is partially lost. When the moisture content increases, the salt substances between the particles are continuously dissolved, until the solidification cohesion is completely lost. Therefore, when the moisture content increases to 25%, the cohesion significantly decreases by 10%.
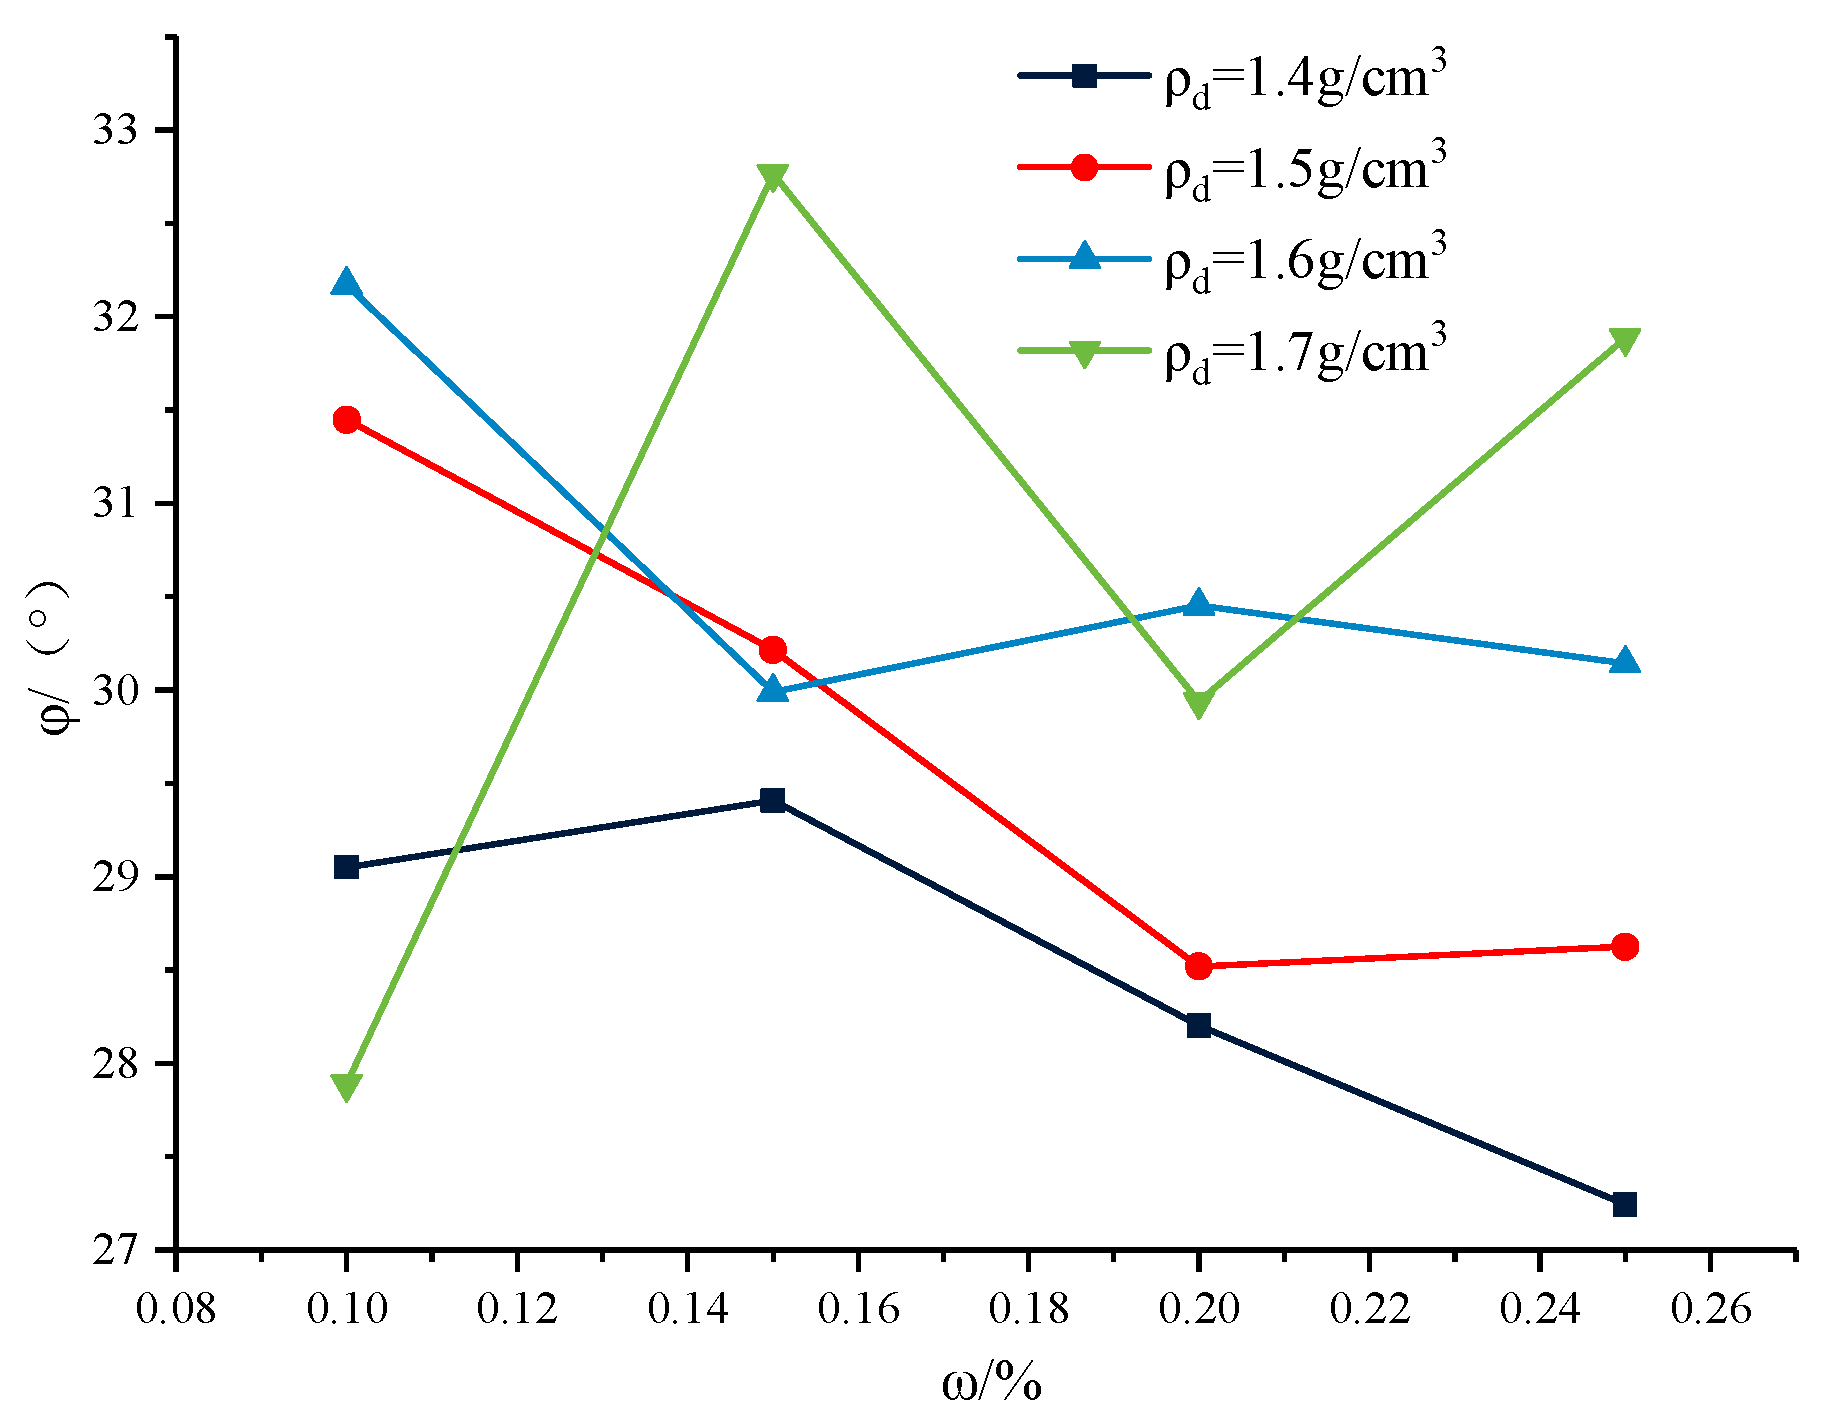
The strength of the internal friction angle is mainly derived from two parts: sliding friction and interlocking friction, while the former is mainly from the particle table. Surface dislocation depends on the size of the particle surface roughness. The interlocking friction comes from the mutual restraint between soil particles. As shown in Figure 9, when the dry density increases, under the condition of a low water content, although water is beneficial to the sliding between the particles, the internal particles are closely arranged and there are less pores. After the relative displacement between the particles, they fall into the pores and become closely linked with other soil particles again, so the internal friction angle increases. When the water content increases, the water film between the particles becomes thicker and the lubrication effect is significant, so the internal friction angle decreases. As shown in Figure 11, when the water content increases to 25%, the water film dissolves a large amount of cementing material compared with the low water content, the properties change, the lubrication effect decreases, and the internal friction angle increases. Therefore, the internal friction angle of the dry density of 1.7 g/cm3 has a serrated change trend, and the change range is large. When the moisture content is constant, when the dry density increases, and the distance between soil particles is close. The electrostatic force, van der Waals force, and the original cohesion all increase.
The strength of the internal friction angle mainly comes from two parts: sliding friction and occlusal friction. The former is mainly due to the rough contact surface of minerals and the occlusal friction comes from the mutual restraint between soil particles. When the moisture content increases, a water film forms between soil particles, and the particles move between each other. When the dry density is small, more pores are experience the effects of external force. The particles fall into big pores after relative sliding due to the internal porous sample, despite the pore filling effect, because the strength of growth is very limited, so there is an overall declining trend. When the dry density increases, under the condition of low moisture content, although water is favorable for sliding between particles, the internal particles are closely arranged with fewer pores. After the relative displacement between particles, they fall into the pores and occlude closely with other soil particles again, so the angle of internal friction rises. When the moisture content increases to 20%, the water film between particles thickens and the lubrication effect is significant, so the angle of internal friction decreases. When the water content is 25%, the water film dissolves a large number of suffusion substances. Its properties change, the lubrication effect decreases, and the internal friction angle increases.

3.2. Numerical Modeling and Field Data of Dam Progressive Failure

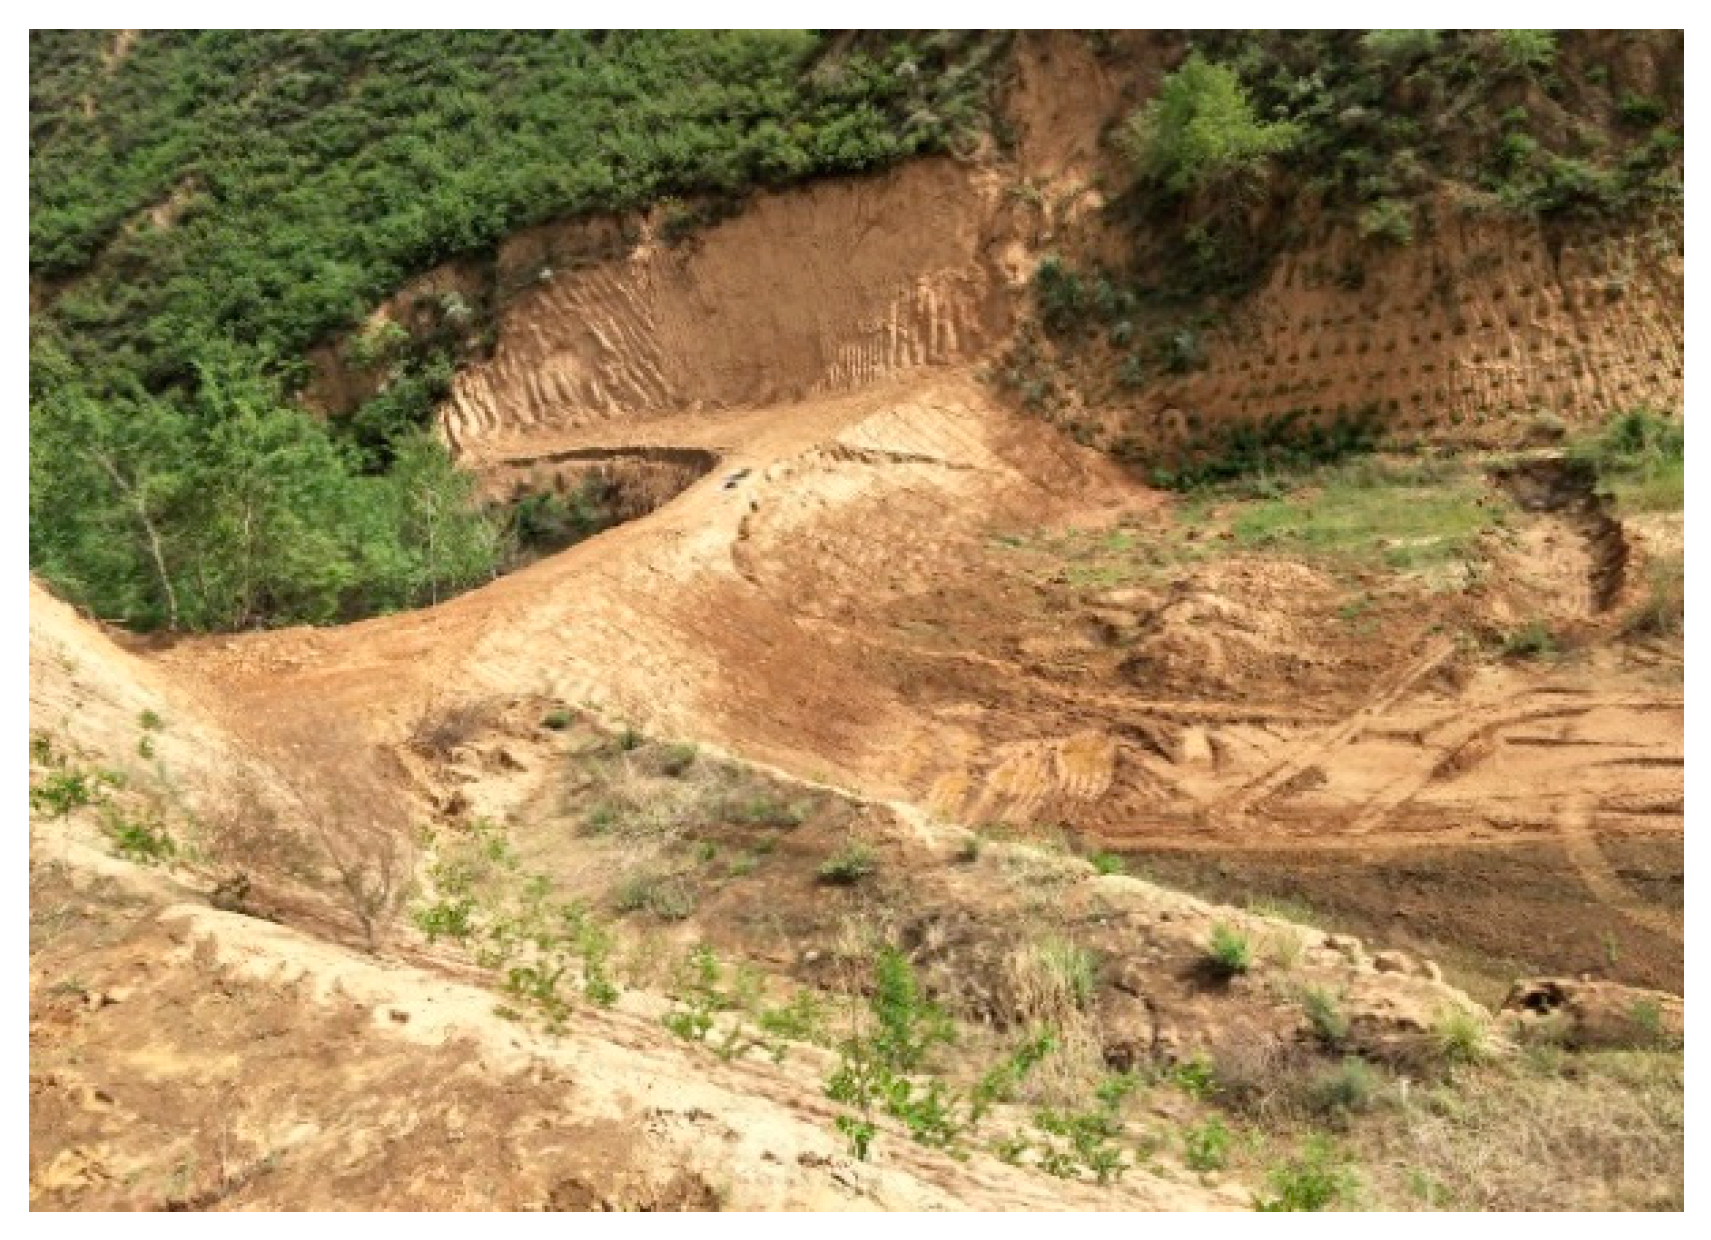
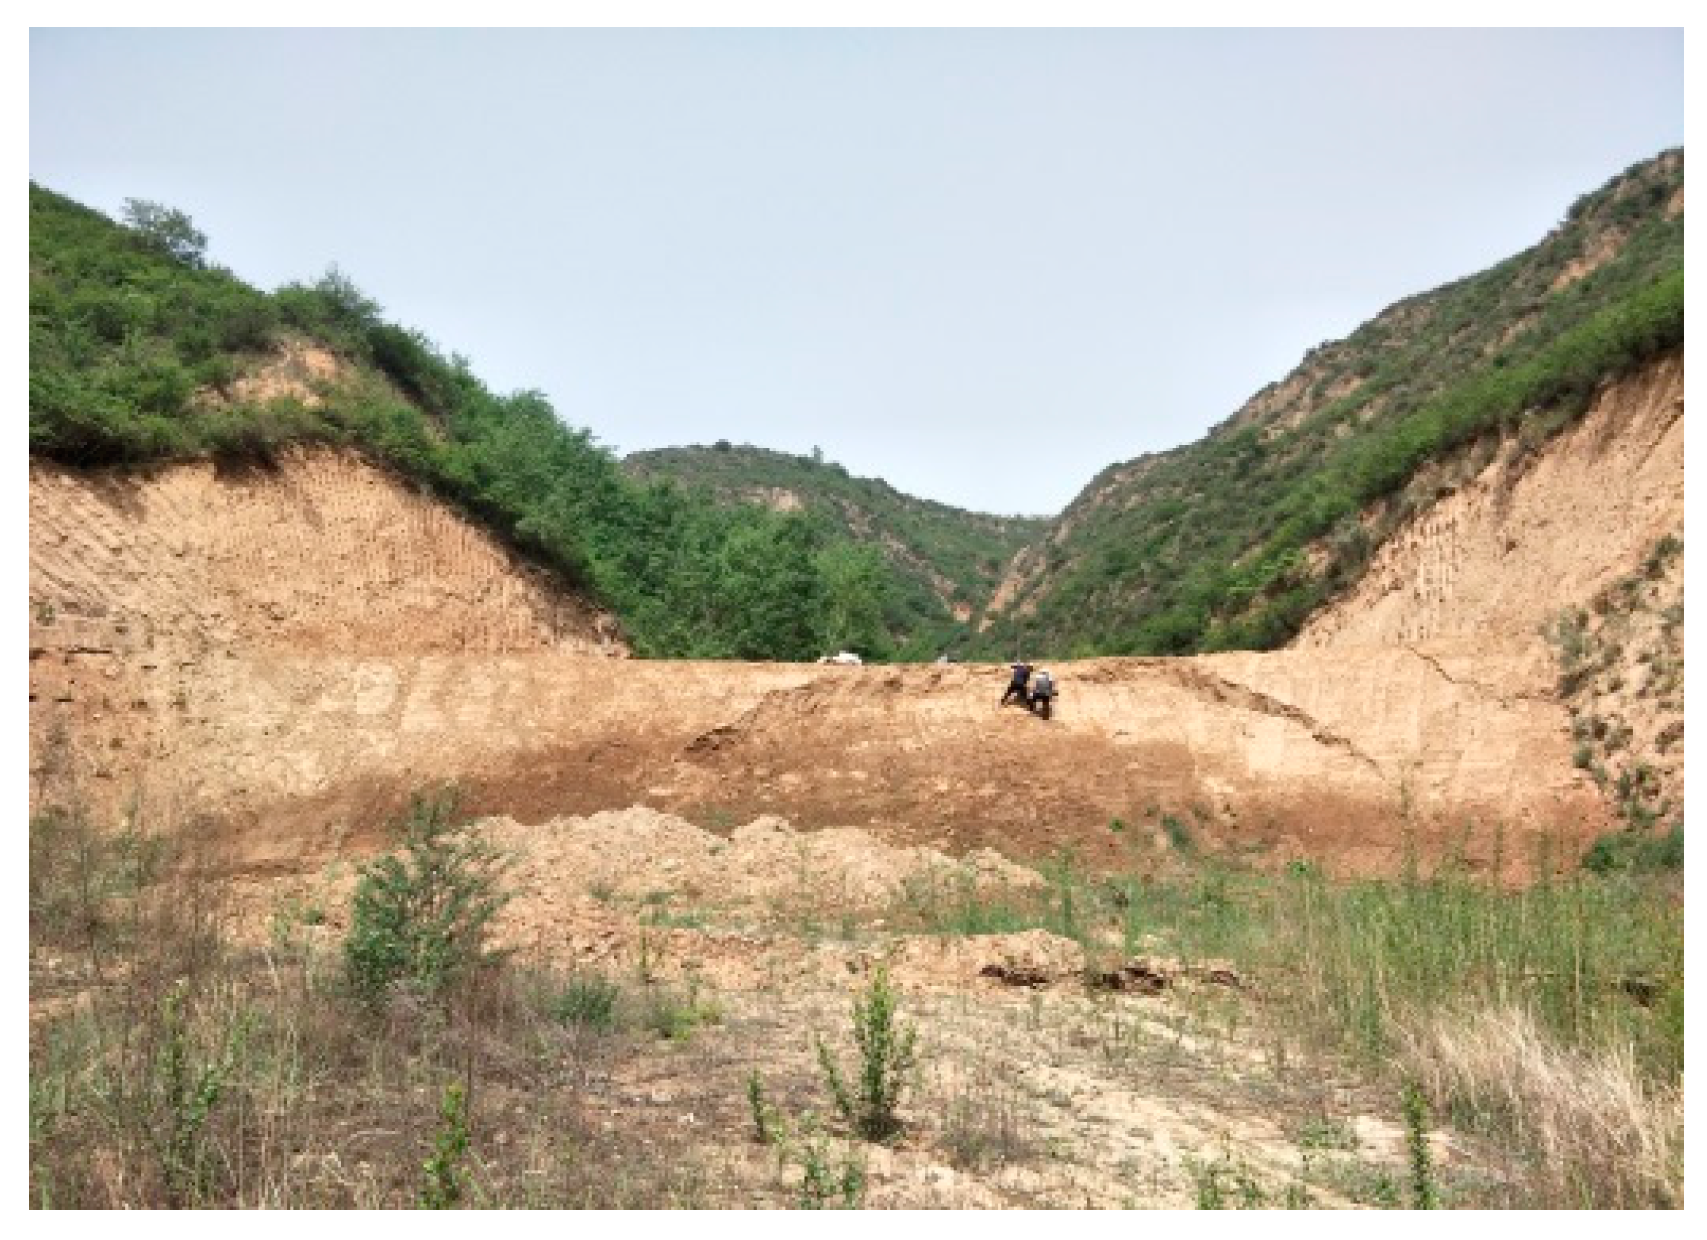
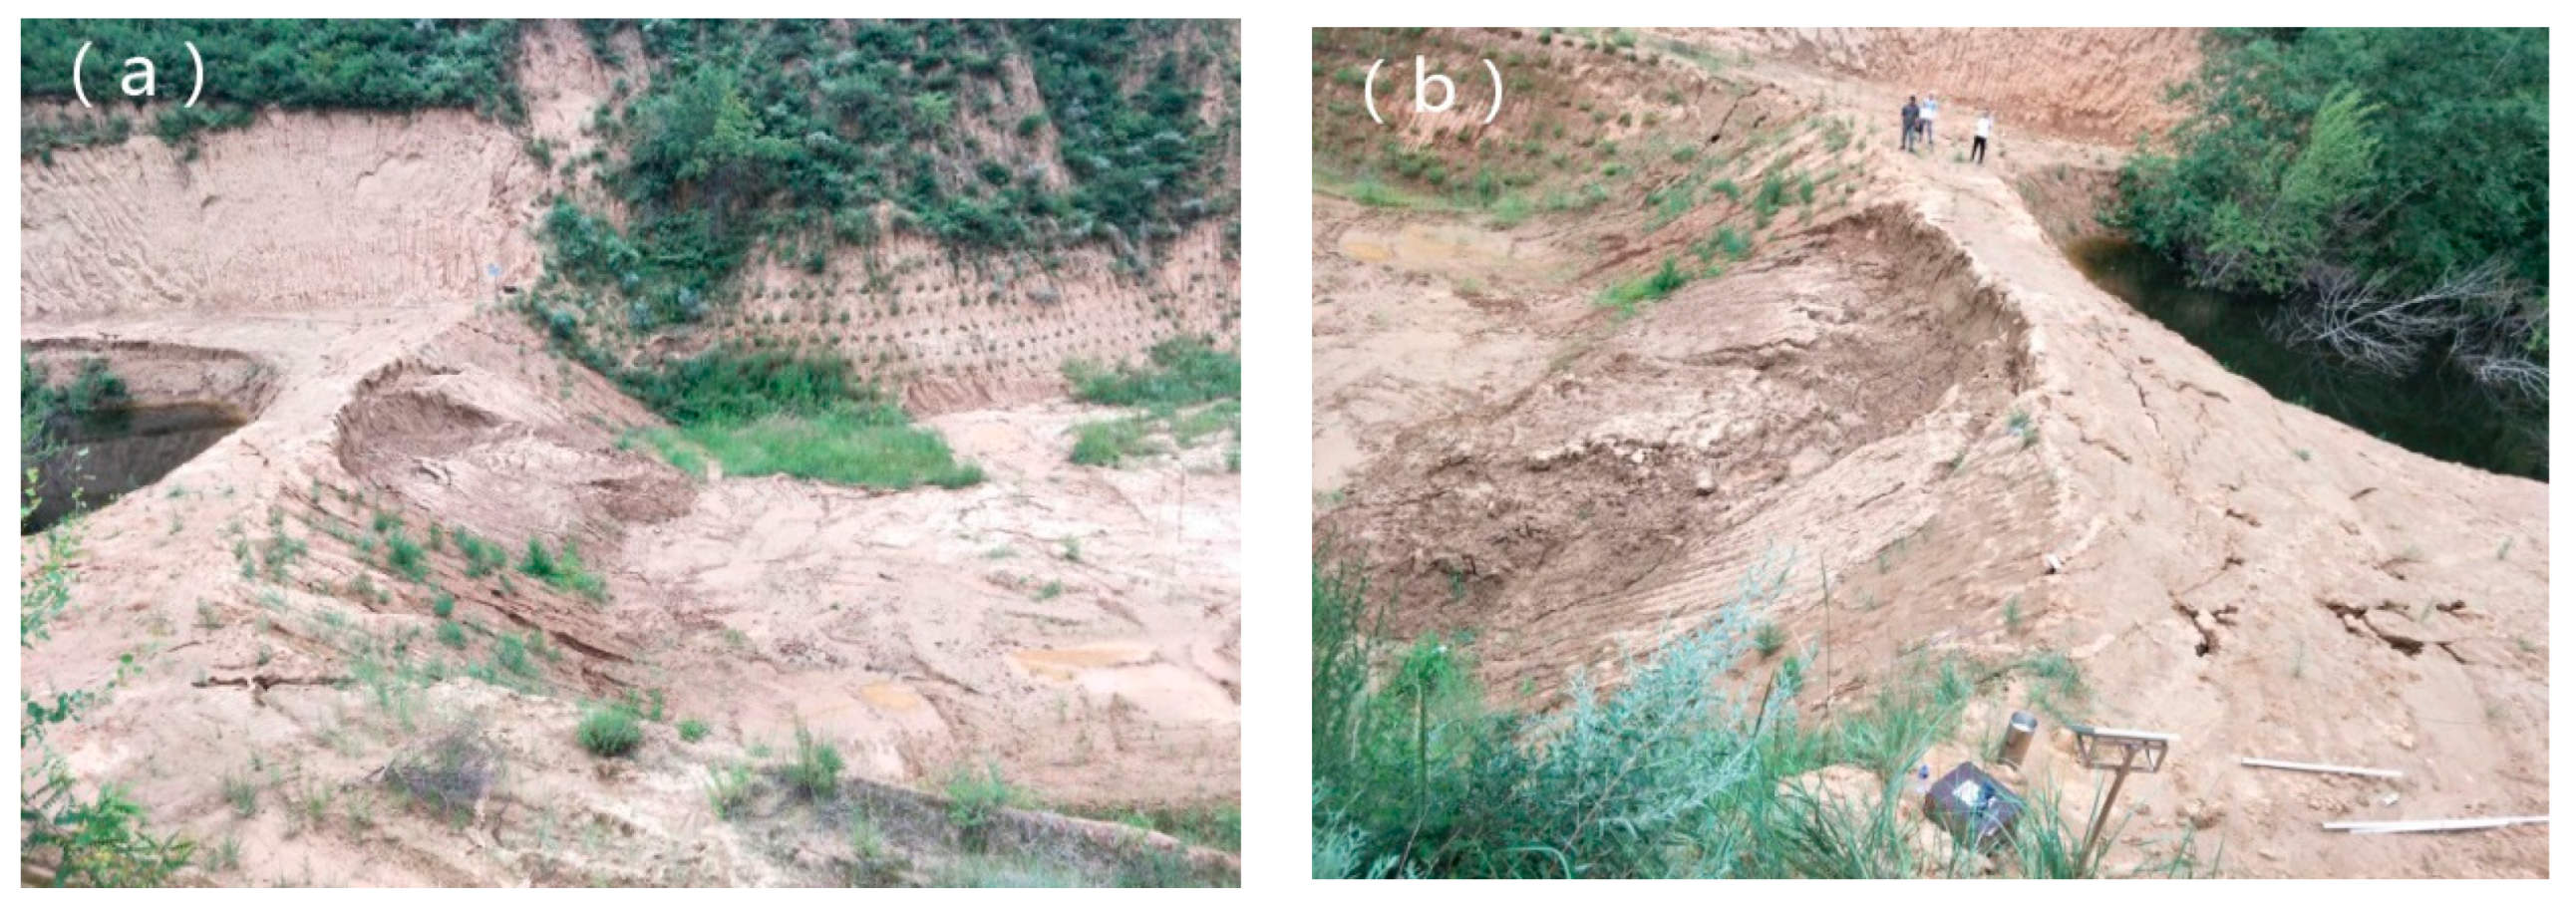
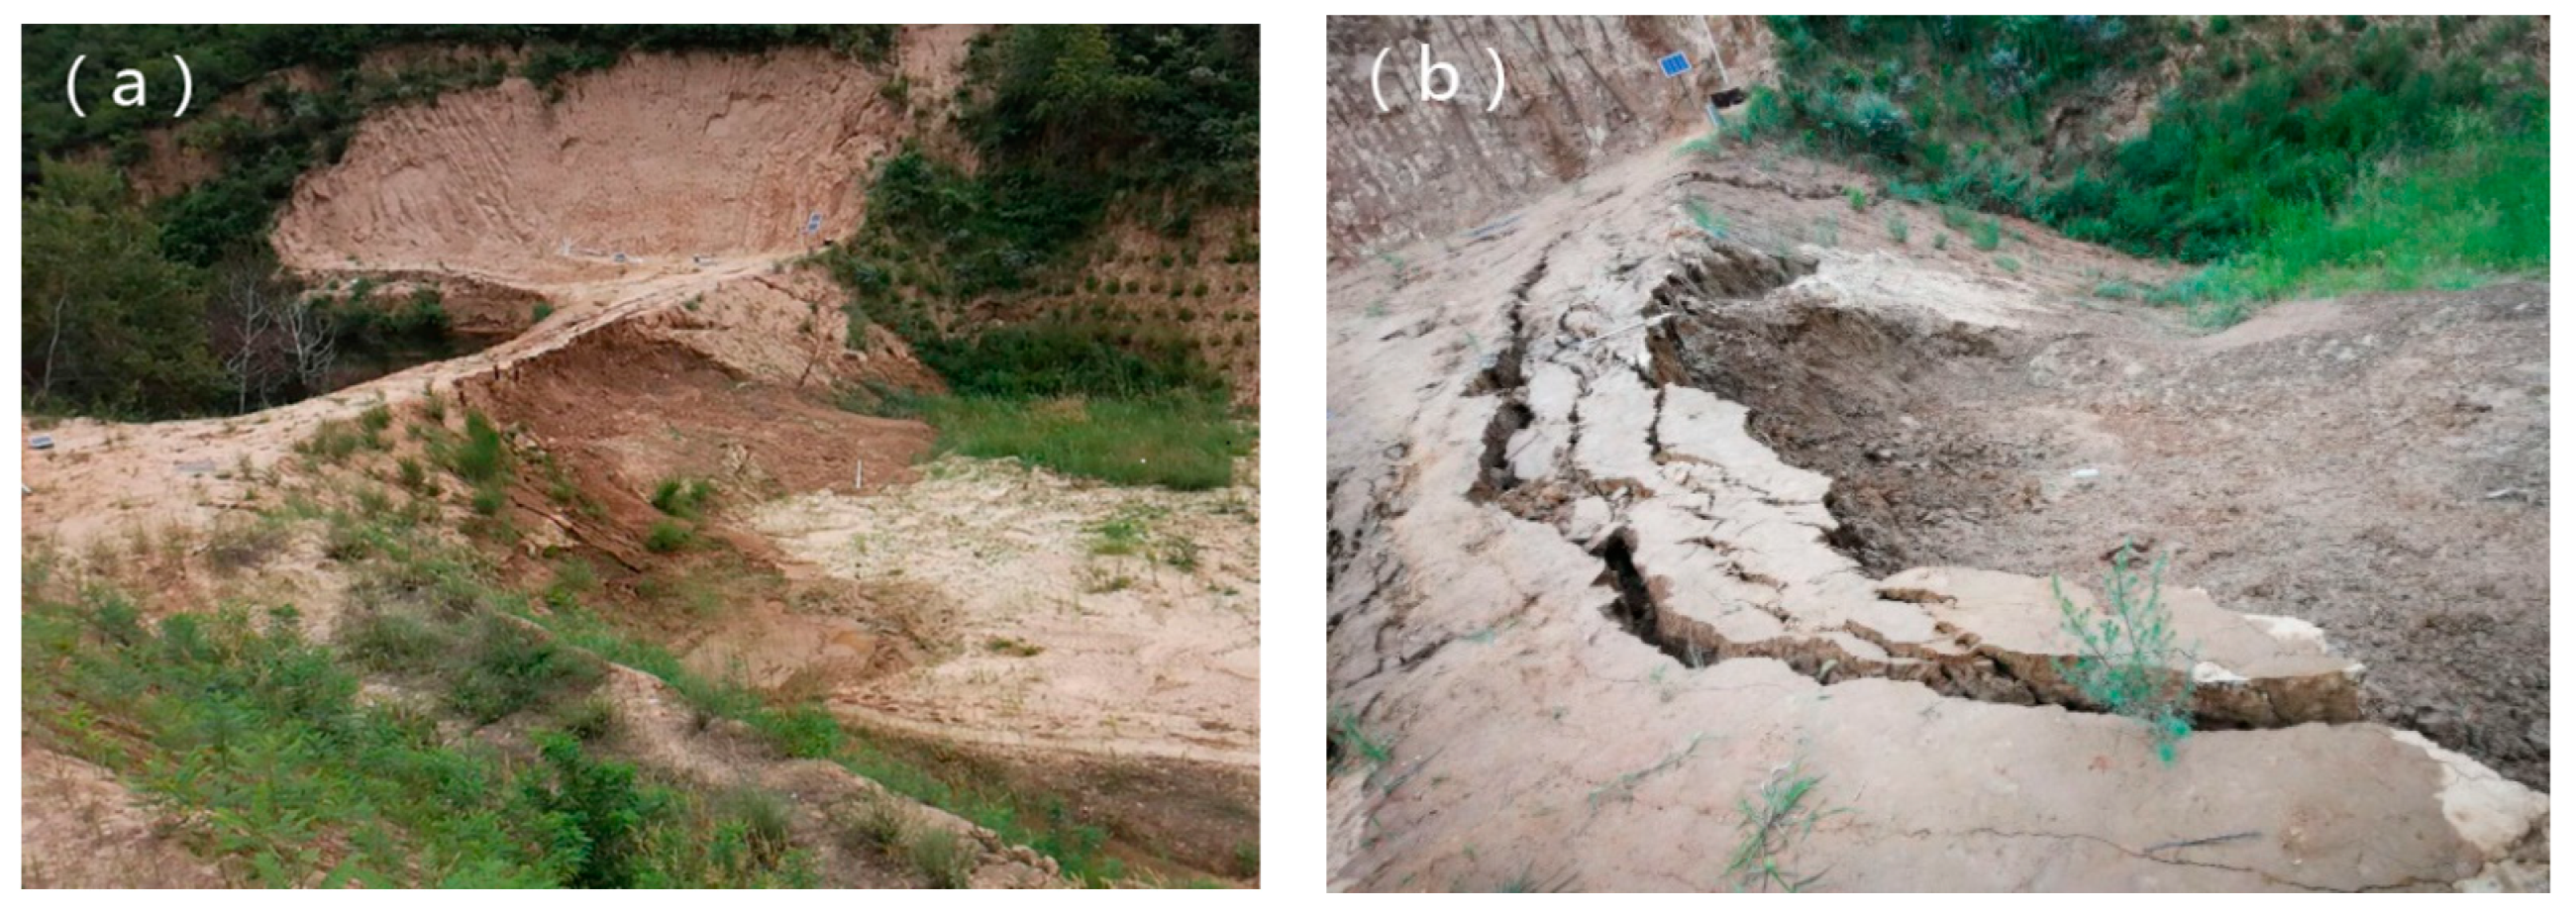
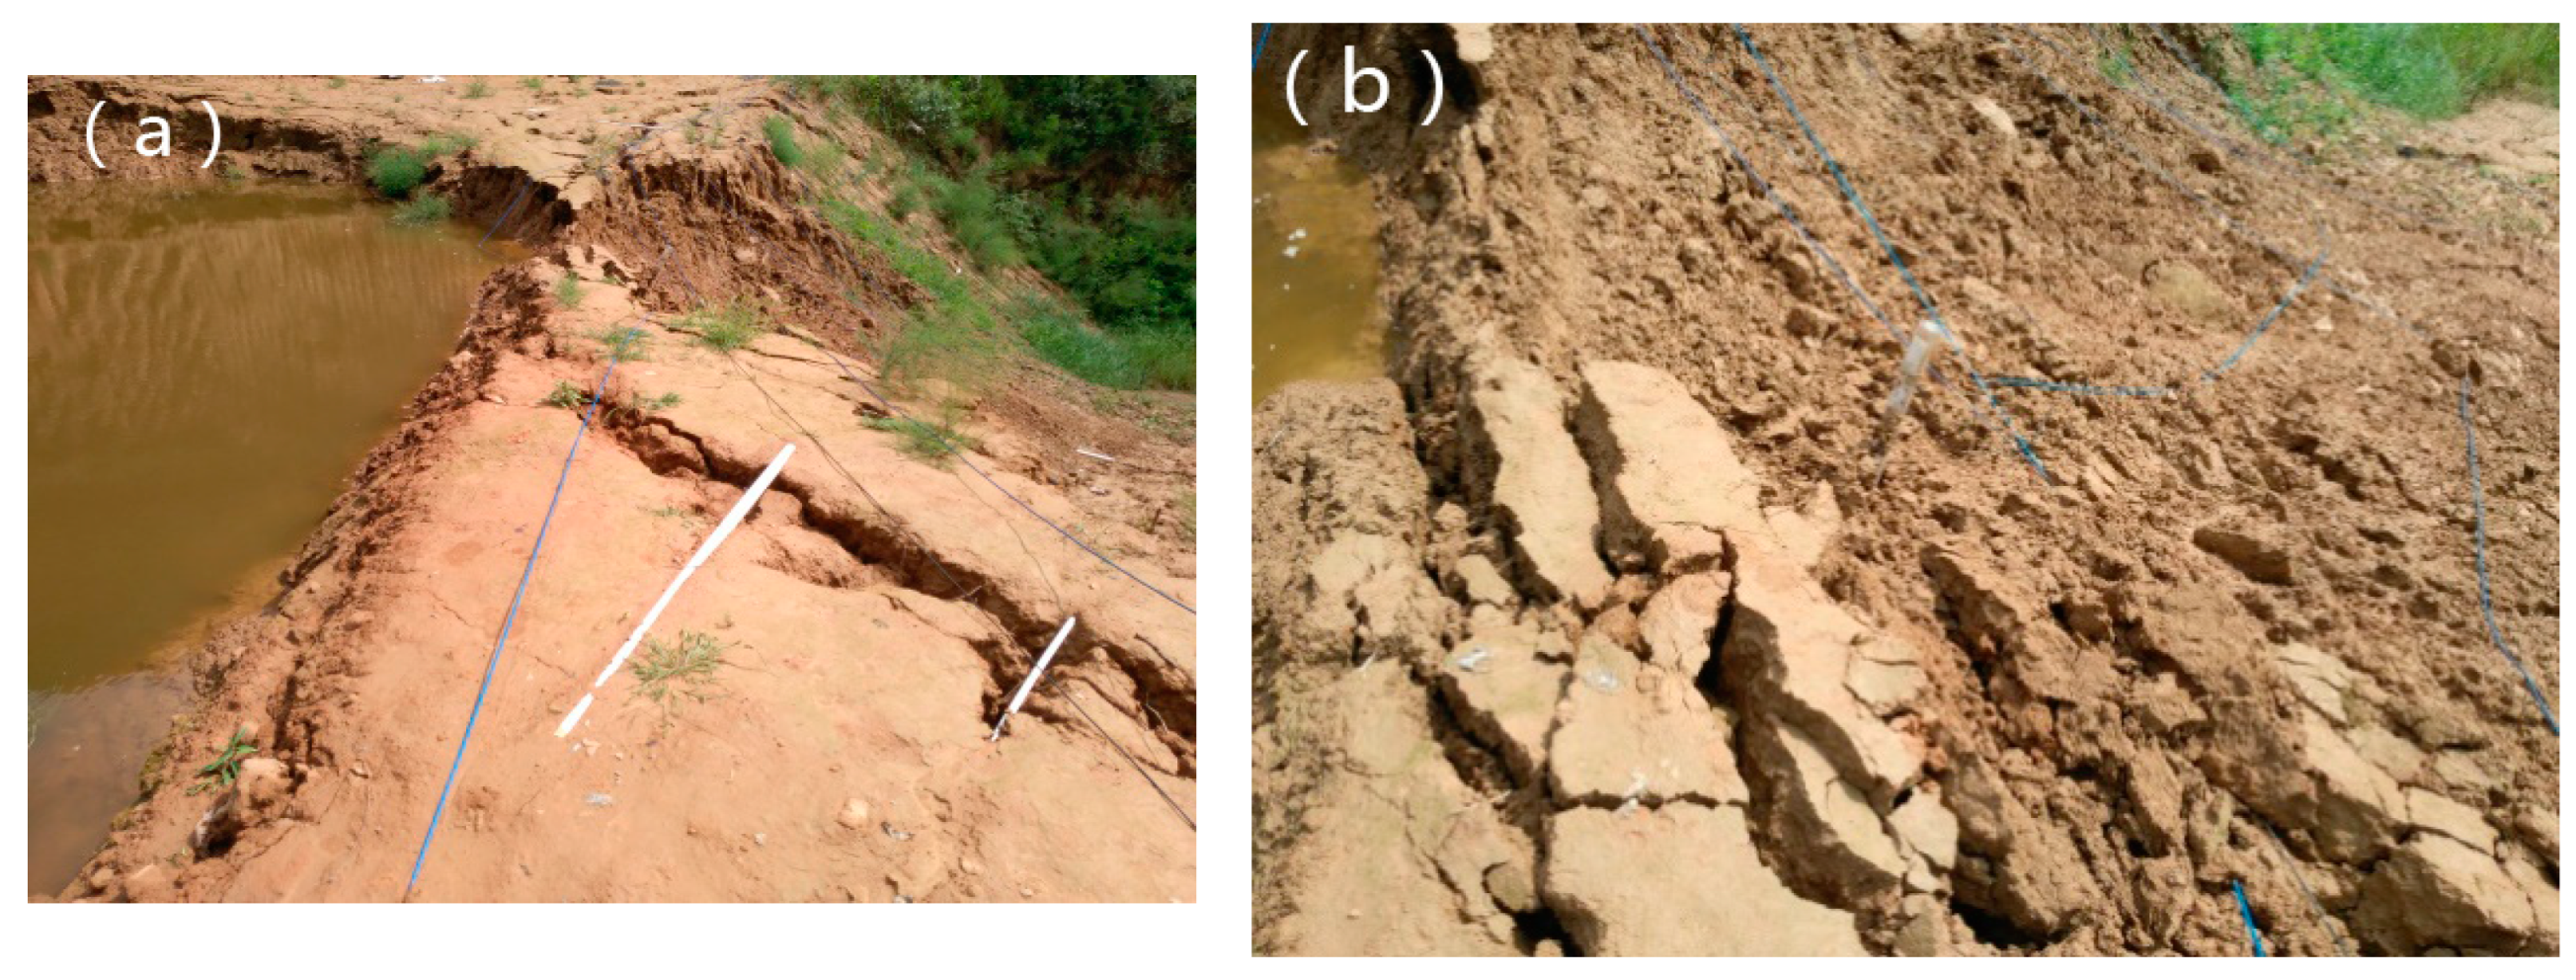
The study object is located in Ansai District, Yan‘an city, Shaanxi Province. Figure 12 and Figure 13 show the initial state of the dam. In the above indoor triaxial test, we explored the shear strength characteristics of loess accumulation dam filler, which provided a basis for the subsequent analysis of the progressive failure law of the dam. Figure 14, Figure 15 and Figure 16 show the situation of failure at three different time points and describe the progressive failure process of the loess accumulation dam during its whole life cycle.
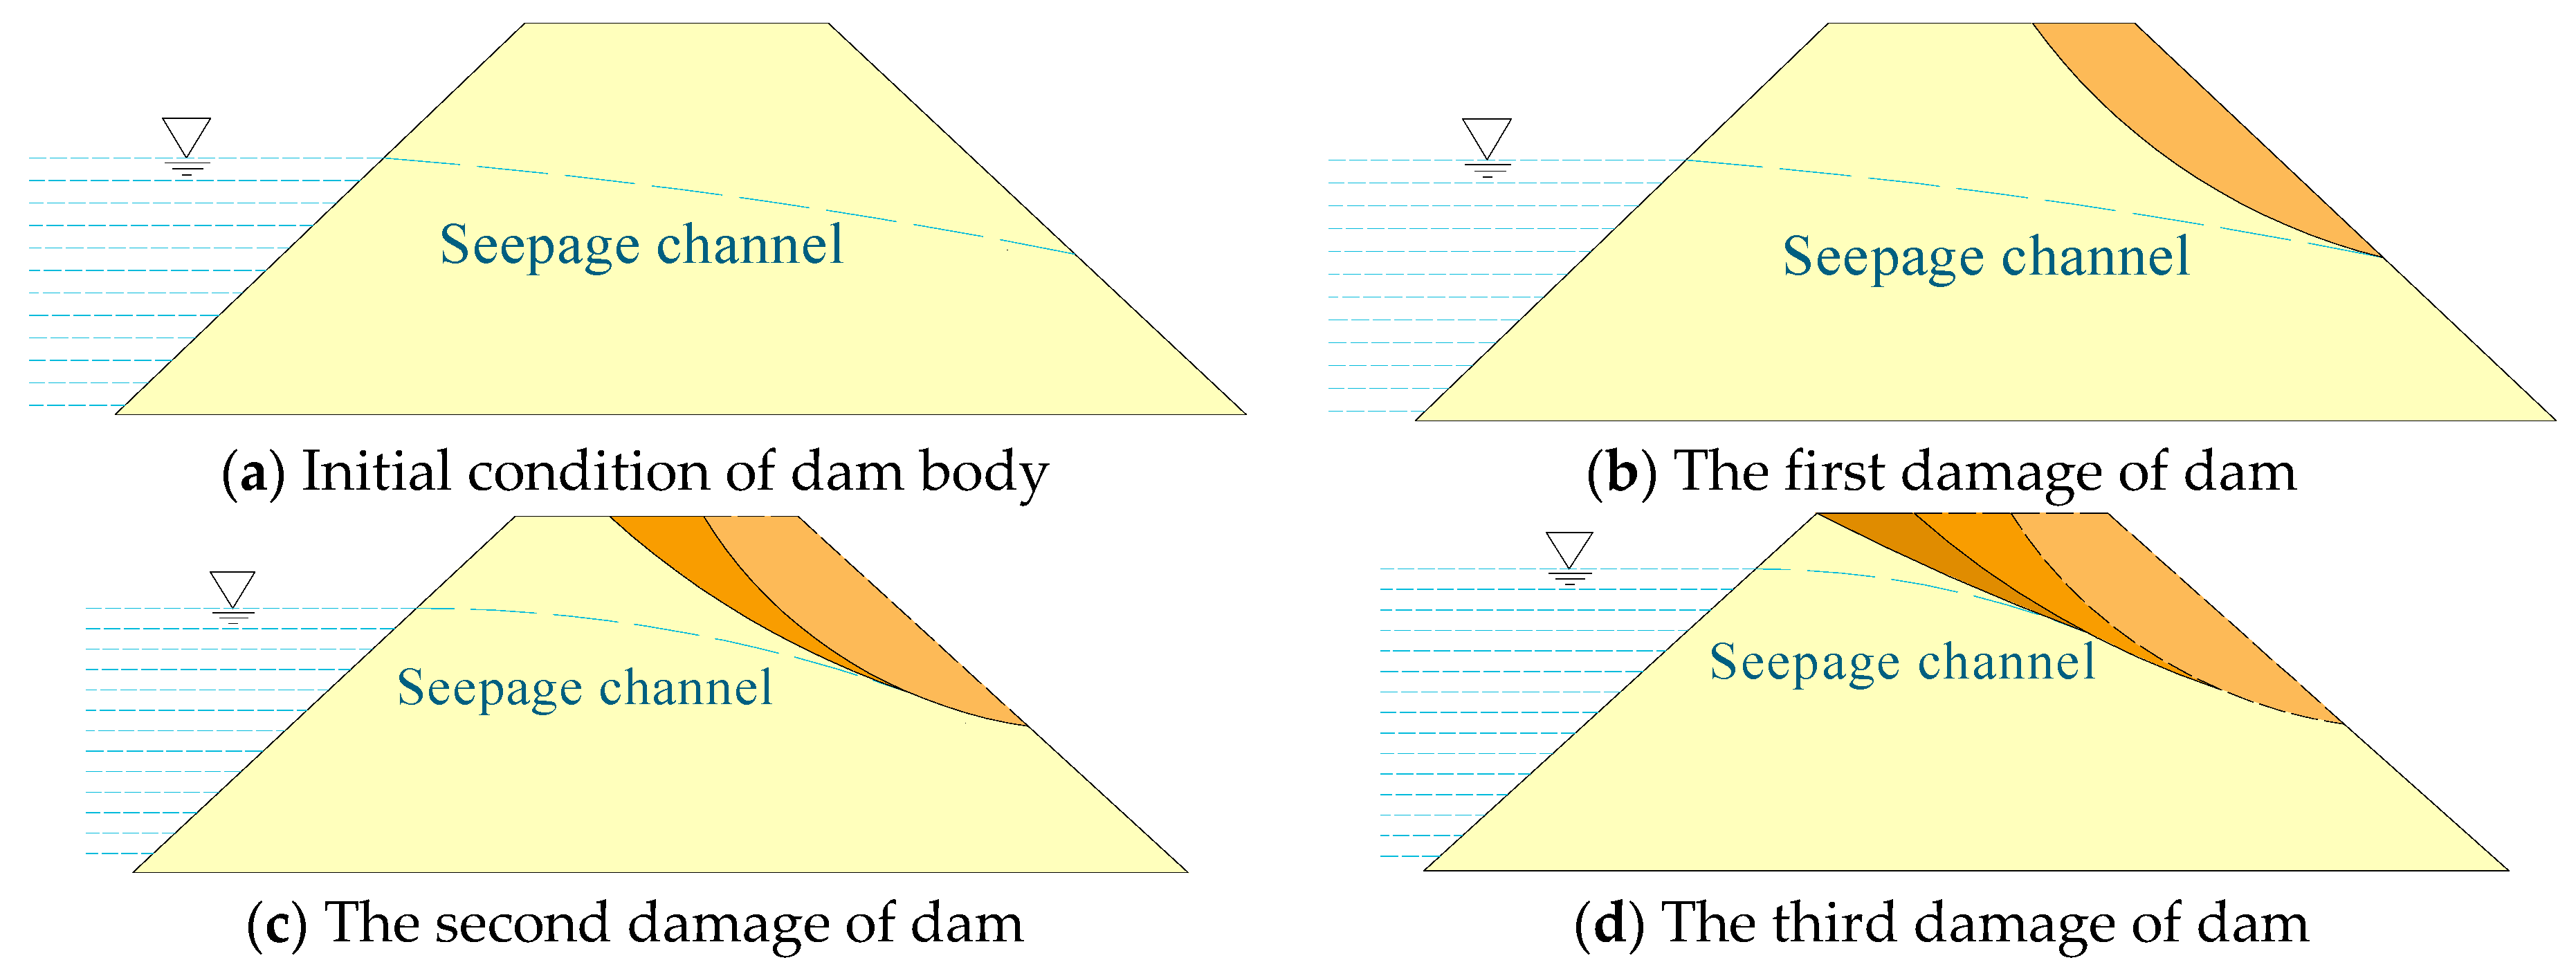
The first damage is caused by the rising water level behind the dam. Under the action of hydrodynamic force, the water forms a seepage channel in the dam body, which flows to the slope side of the airside. The shear strength of the slope foot is reduced by water soaking, so the first damage occurs. Since a large amount of rainwater infiltrates into the cracks in the top of the dam before the second damage, the pore pressure inside the dam crest increases, the effective stress decreases, the shear strength weakens, and the dam crest soil slides along the first damage surface; meanwhile, the rising water level of the reservoir causes the slope surface overflow point to move up, and the soil at the overflow outlet continues to soak and soften, the shear strength decreases, and the second damage occurs. Under the continuous erosion of rainwater, the topsoil of the dam is continuously slipping down along the rupture surface, and this is the third instance of damage. After this, the width of the dam roof gradually decreases and almost disappears completely.
Figure 17 shows the morphological changes in the three instances of damage on the dam slope. The different colors in the figure represent three instances of damage of the dam slope sliding along the sliding surface. The number of accumulated objects produced by the three instances of damage is gradually reduced, the shearing outlet gradually moves upward, the angle between the shearing surface and the horizontal plane (an acute angle) is gradually reduced, and the length of the shearing surface is gradually increased. This result seems different from the laboratory test and can be attributed to the uneven distribution of water inside the dam and unilateral infiltration. The infiltration of water leads to the continuous erosion of the internal structural plane of the dam, resulting in this phenomenon, which is consistent with the actual situation. The author has described the analysis of dam site monitoring and failure characteristics in detail in another paper (Xu, 2020), so no more elaboration is necessary.
Under the condition of rainfall, the continuous rise in the water level of the reservoir leads to a gradual rise in the saturation line, which leads to an increase in the soil moisture content inside the dam, leading to damage. Therefore, FlAC3D is used to perform a numerical inversion for the three instances of damage to the loess stacked dam to observe the damage patterns of the dam slope and the change in external displacement and internal pore pressure.
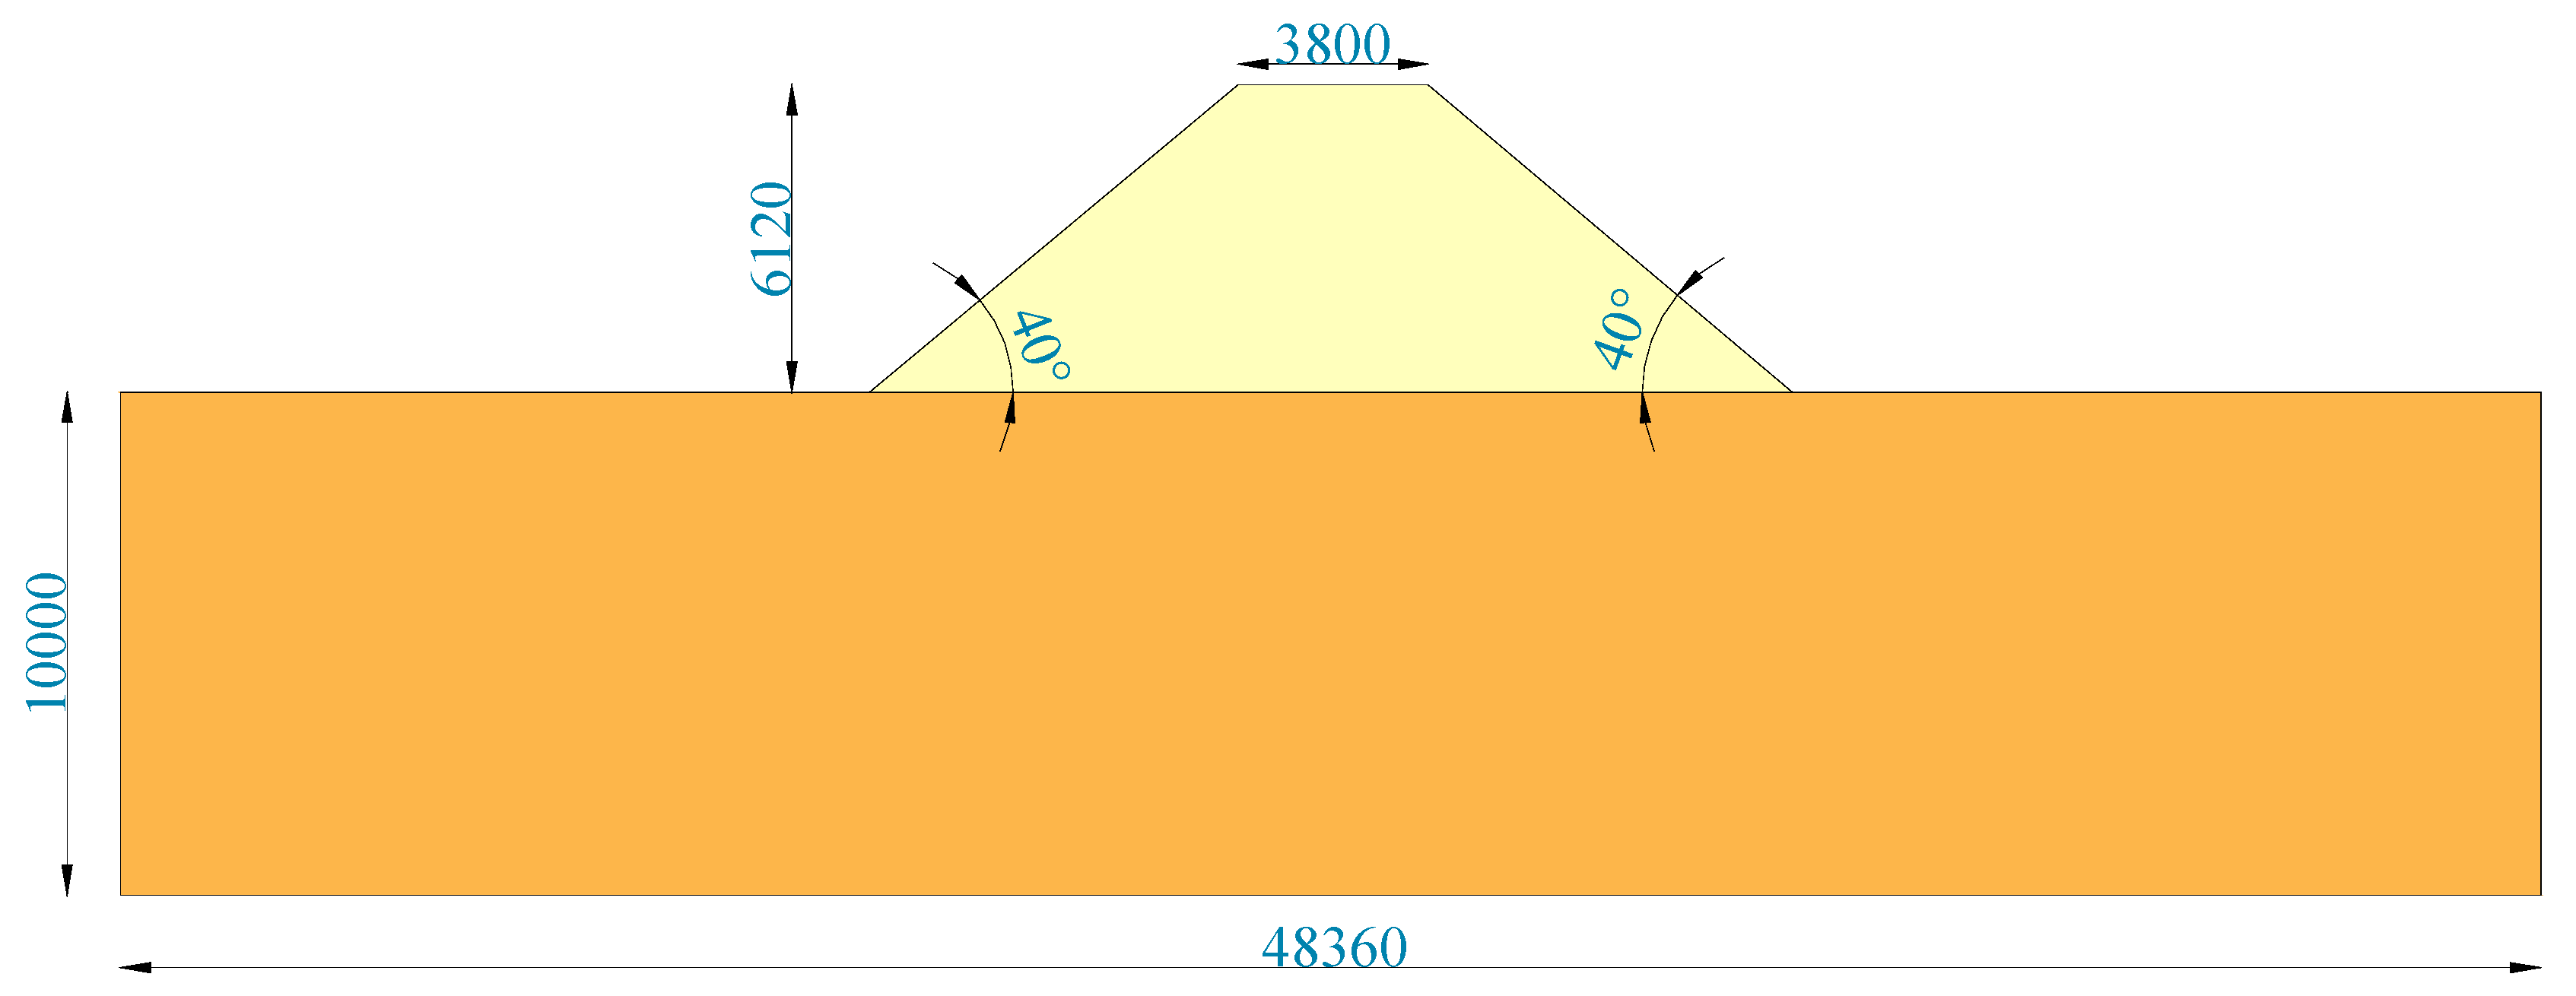
The numerical model is shown in Figure 18 and is divided into two parts. The upper part is the loess accumulation dam body. The seepage model is isotropic seepage, the lower part is the dam foundation, and the non-seepage model is selected. At the same time, through experimental research and analysis, it can be found that loess in the dam body is a typical elastic–plastic material, so the Mohr–Coulomb elastic–plastic model is used for calculations in this simulation. The foundation length of the model is 48.36 m, and the height is 10 m. The dam crest width of the loess stacked dam is 3.8 m, the slope angle of both sides is 40°, and the dam height is 6.12 m. According to the laboratory test results, the parameters of each model are selected and assigned, as shown in Table 2.
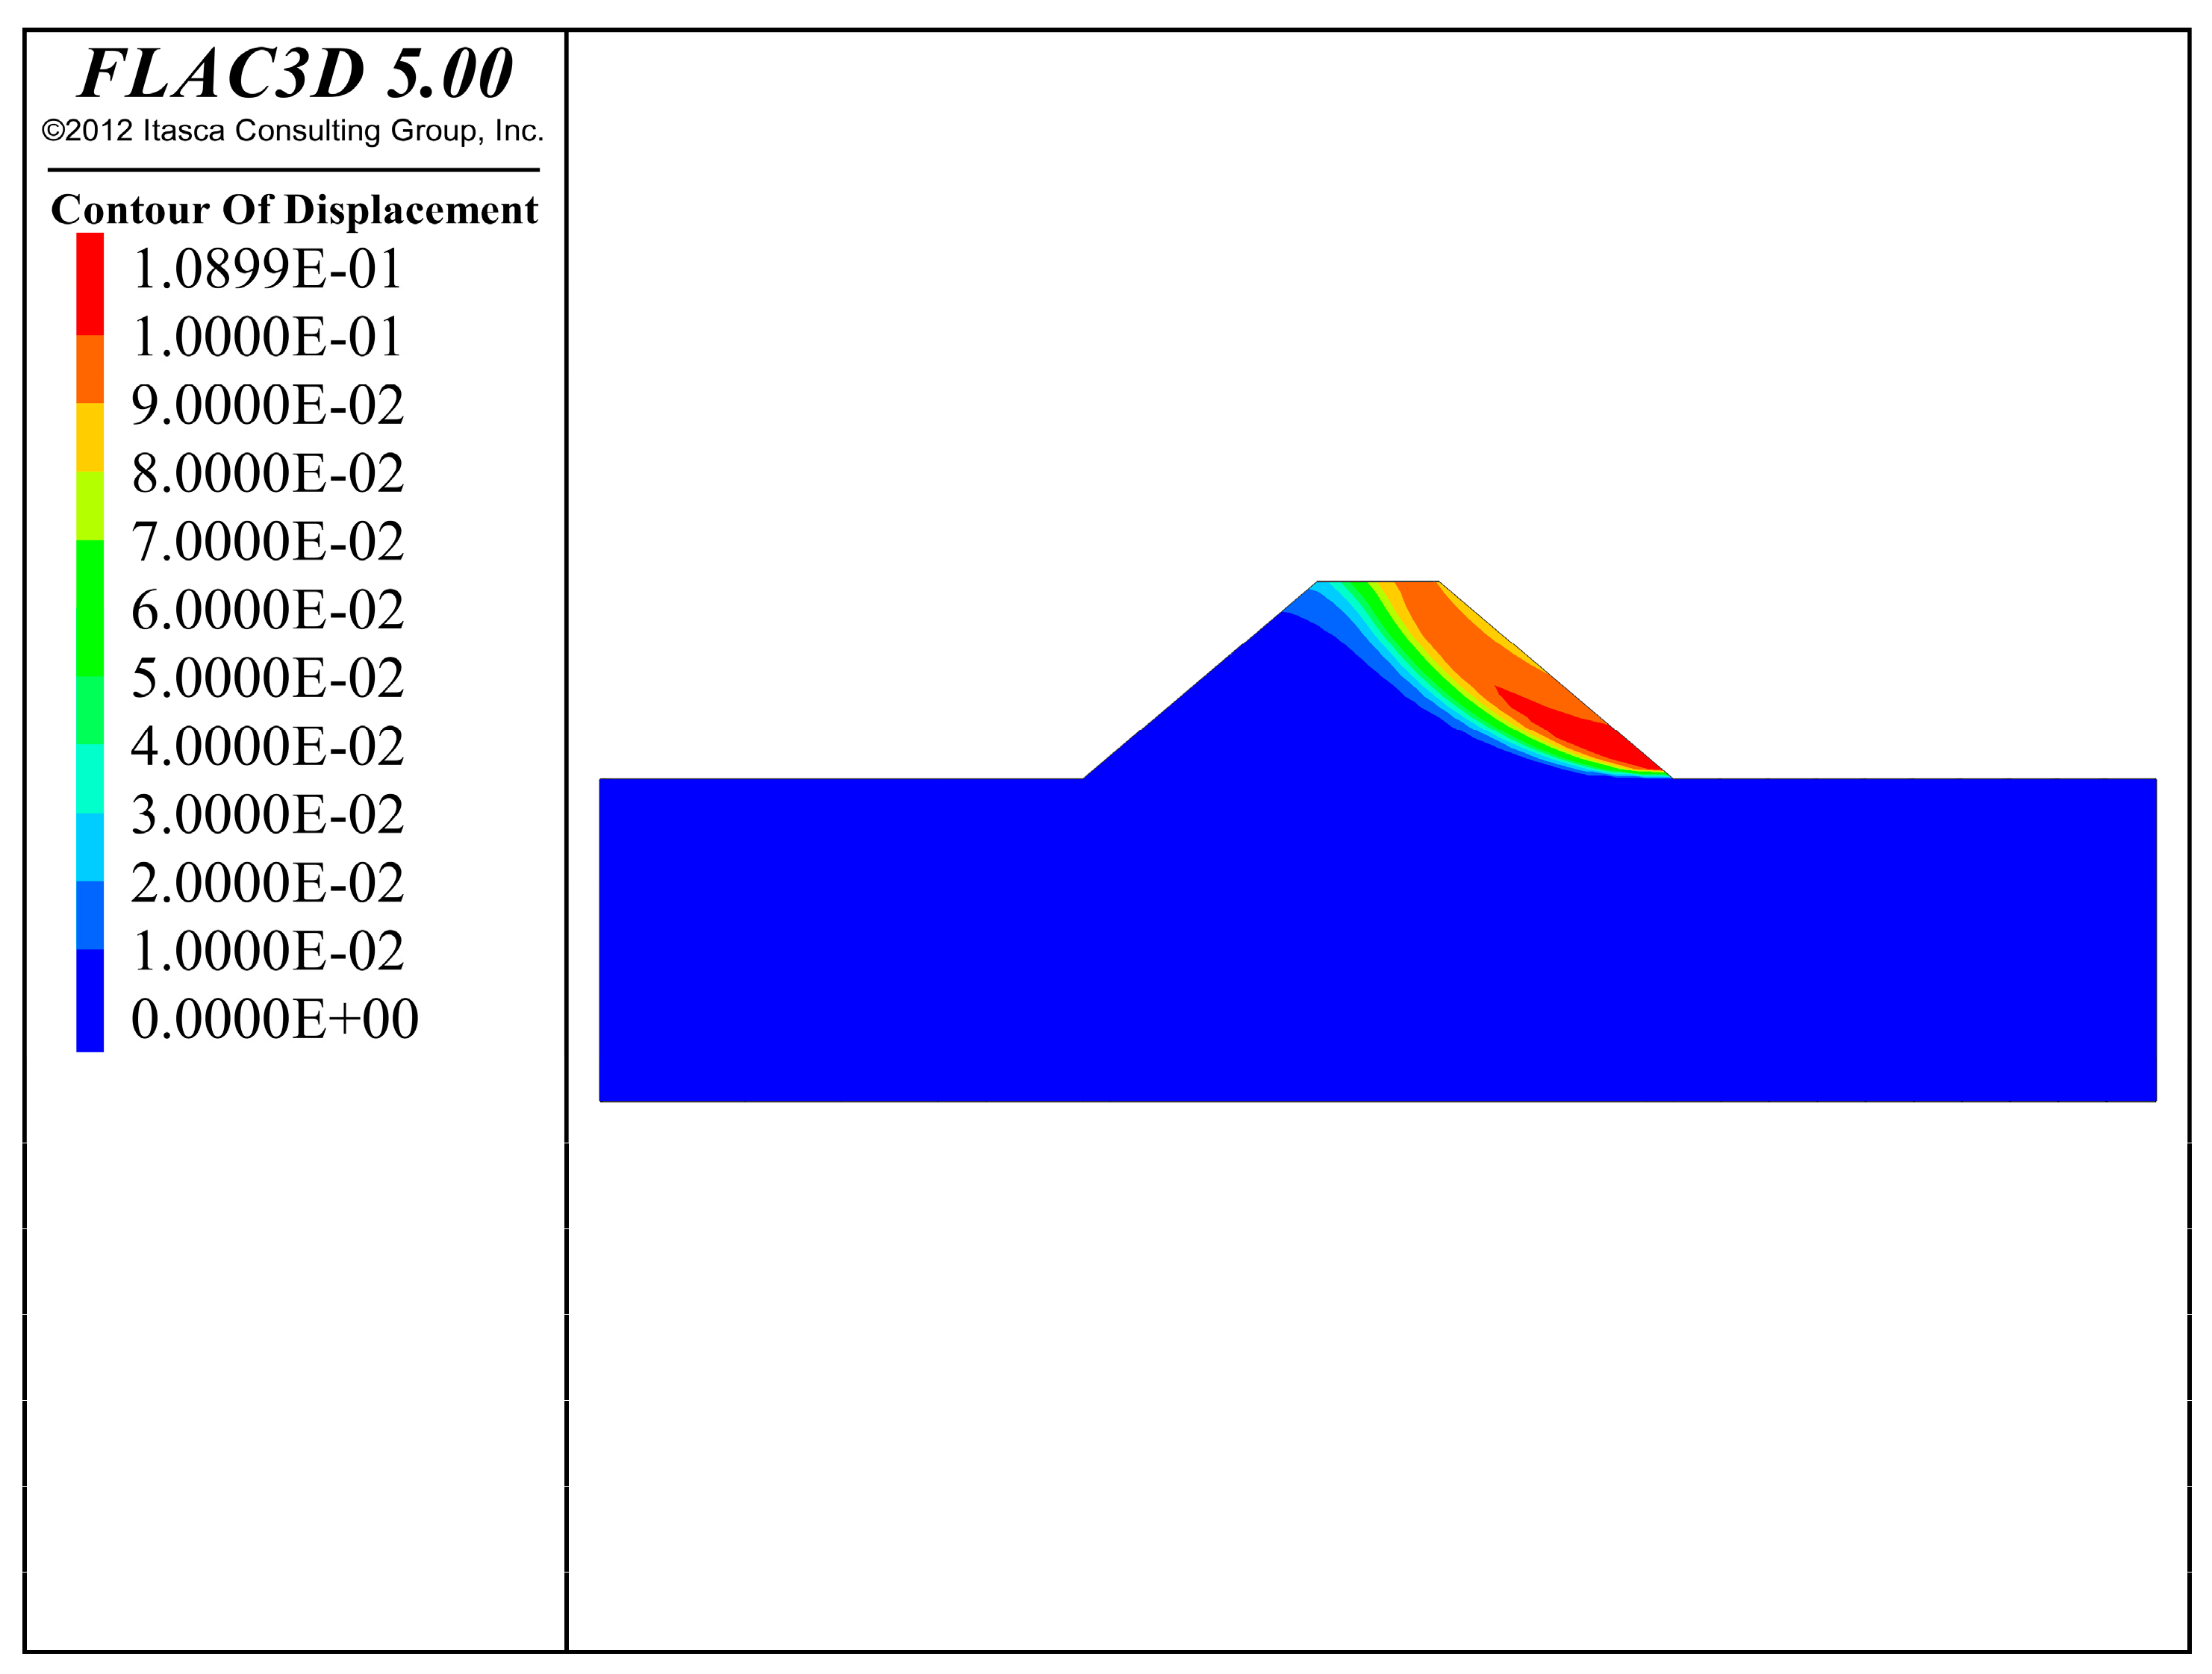
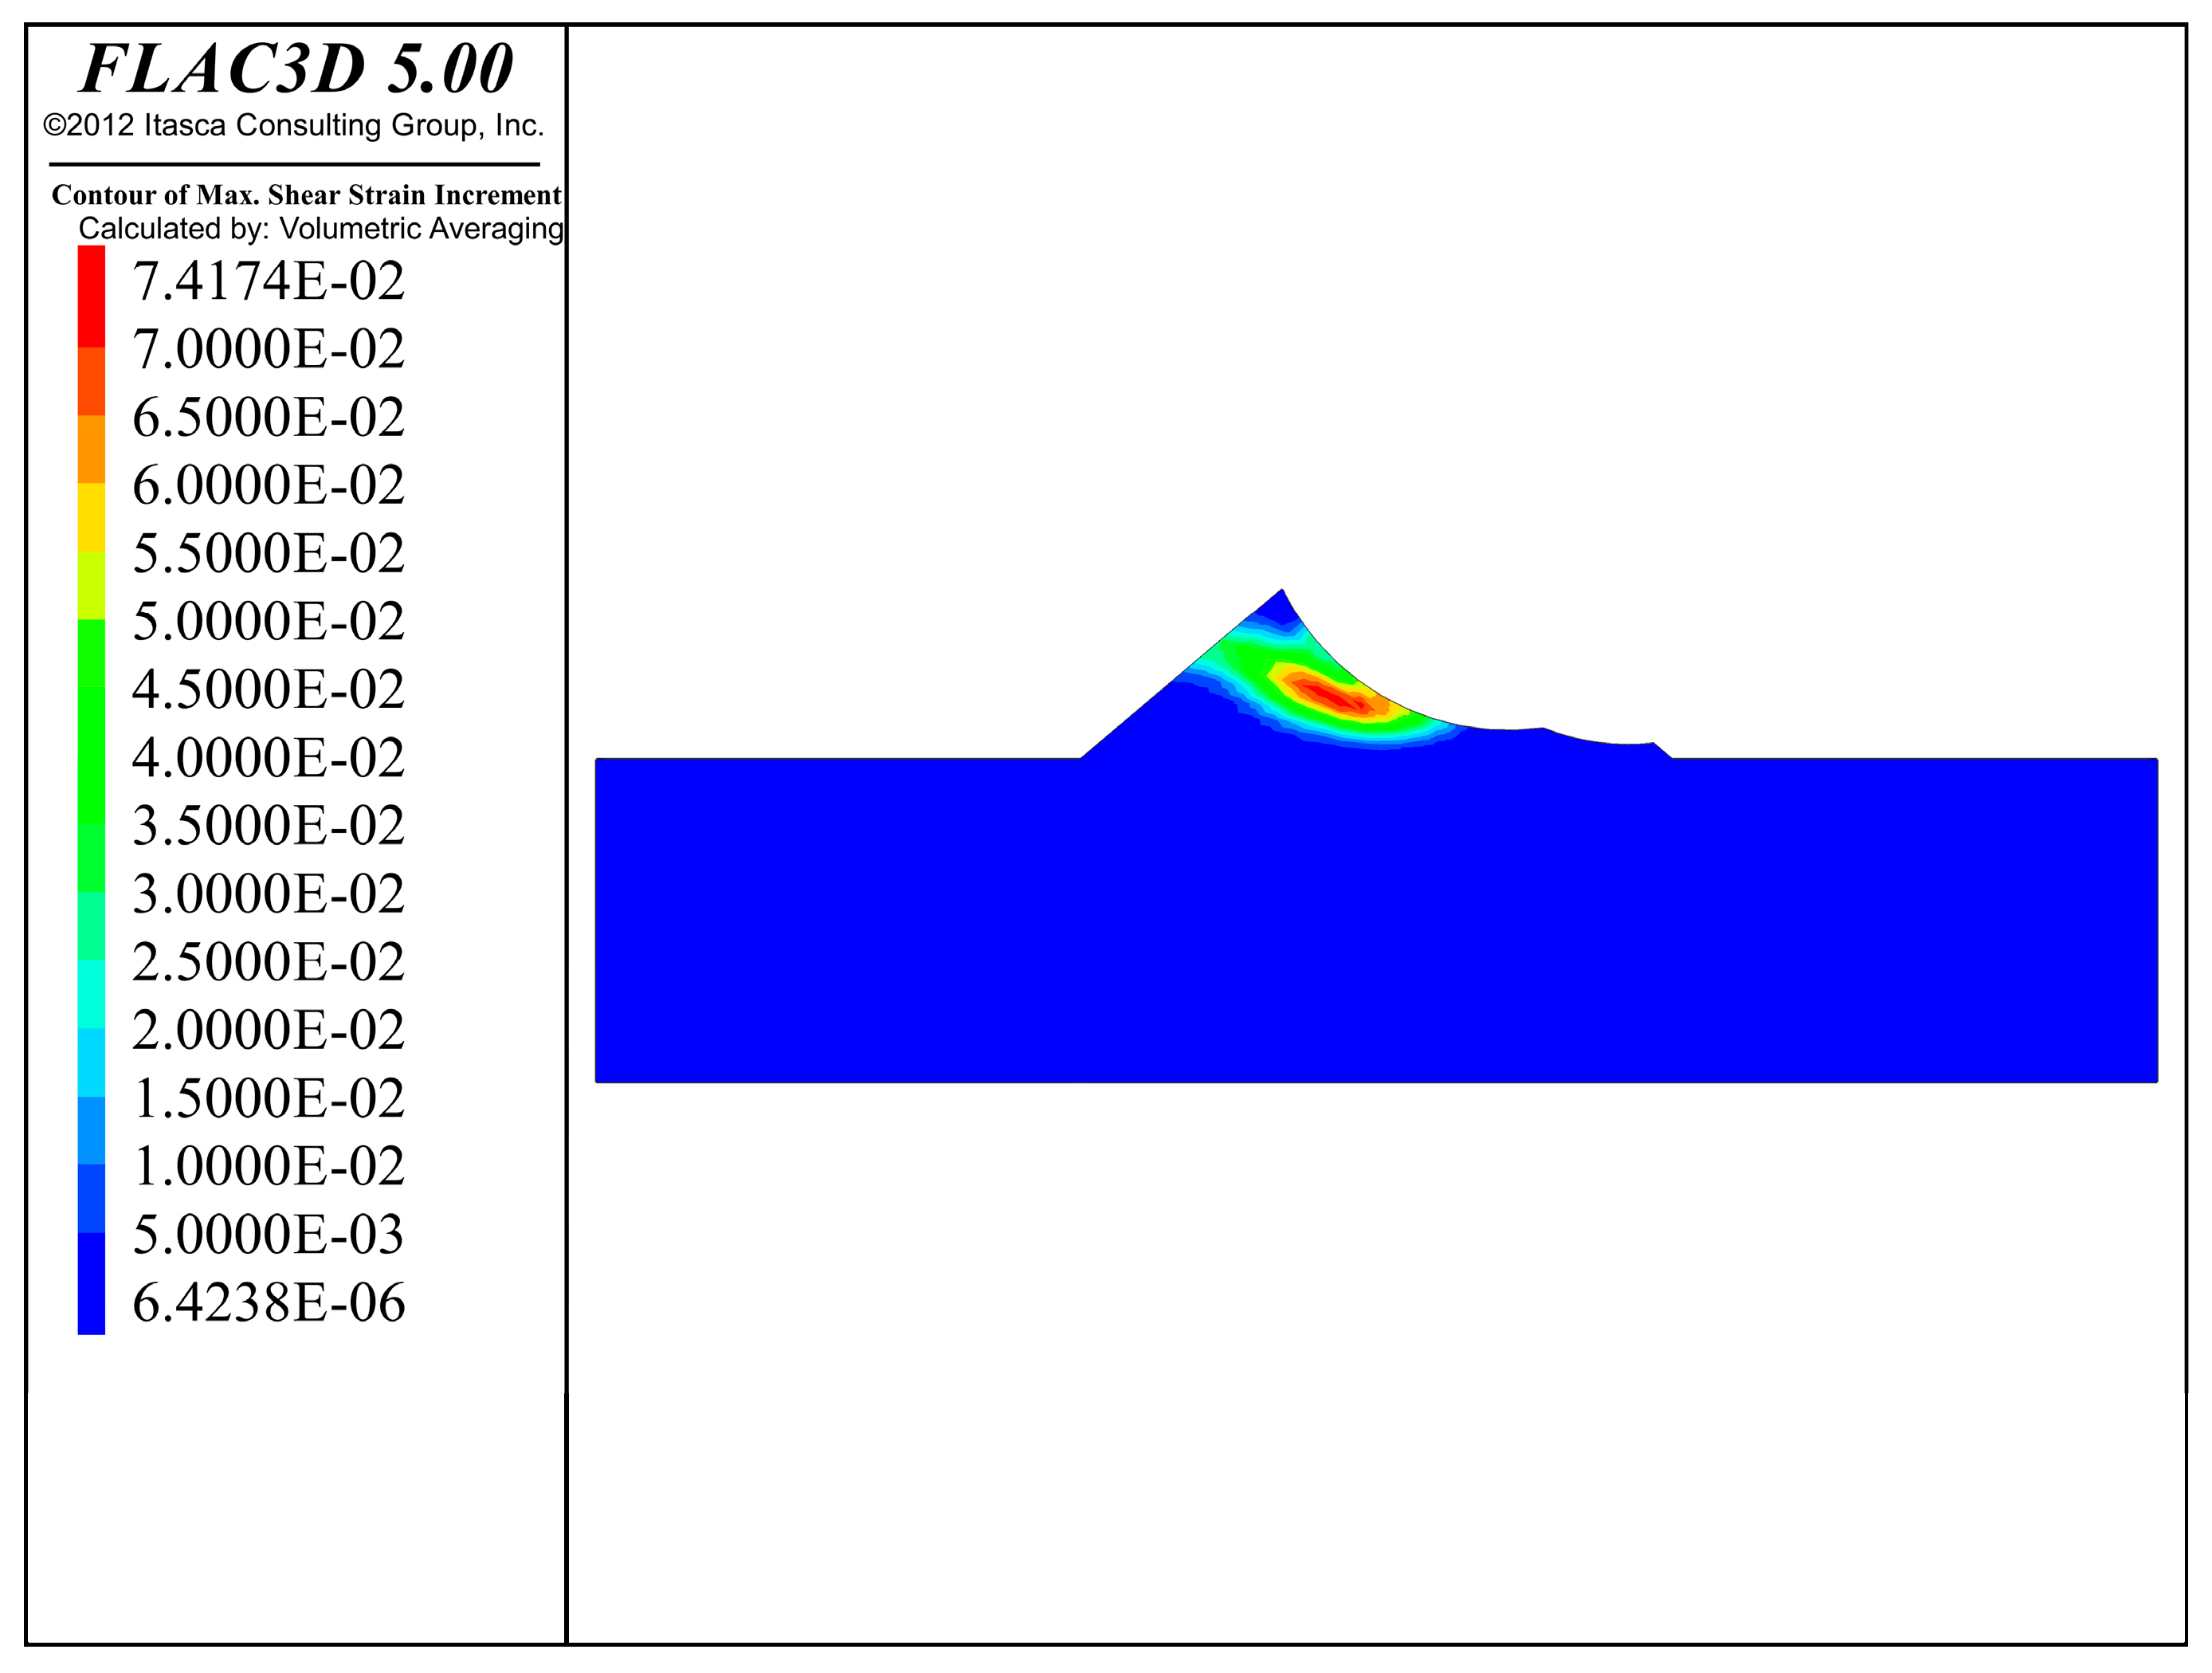
When the first damage occurs, the water level is 4.85 m, and there is an significant water level difference on both sides. Water moves through the dam body toward the surface, the pore water pressure field is formed inside the dam body, and the seepage force along the free face direction is formed at the foot of the slope. At the same time, due to gravity, a significant concentration of stress occurs at the foot of the slope, causing plastic deformation in the soil. In the process of seepage, the plastic zone extends in the direction of dam crest, eventually causing breakage. When the maximum displacement of the model reaches 100 mm (Figure 19), the dam body is considered to be damaged, and the calculation stops. In the first instance of damage, the position of the sliding surface can be determined by the maximum shear strain increment cloud map. Generally, the position with a large shear strain increment is prone to significant failure, while the position with a small shear strain increment is less likely to fail. As shown in Figure 20, there is an significant arc line in the shear strain increment program, which runs from the foot of the slope to the top of the dam, that is, the potential sliding surface of the dam body. In Figure 20, the maximum increment of shear strain at the foot of the slope is observed, which indicates that the foot of the slope is most prone to failure. Under the action of upper gravity, the dam slope slides along the failure surface, causing the first instance of damage.
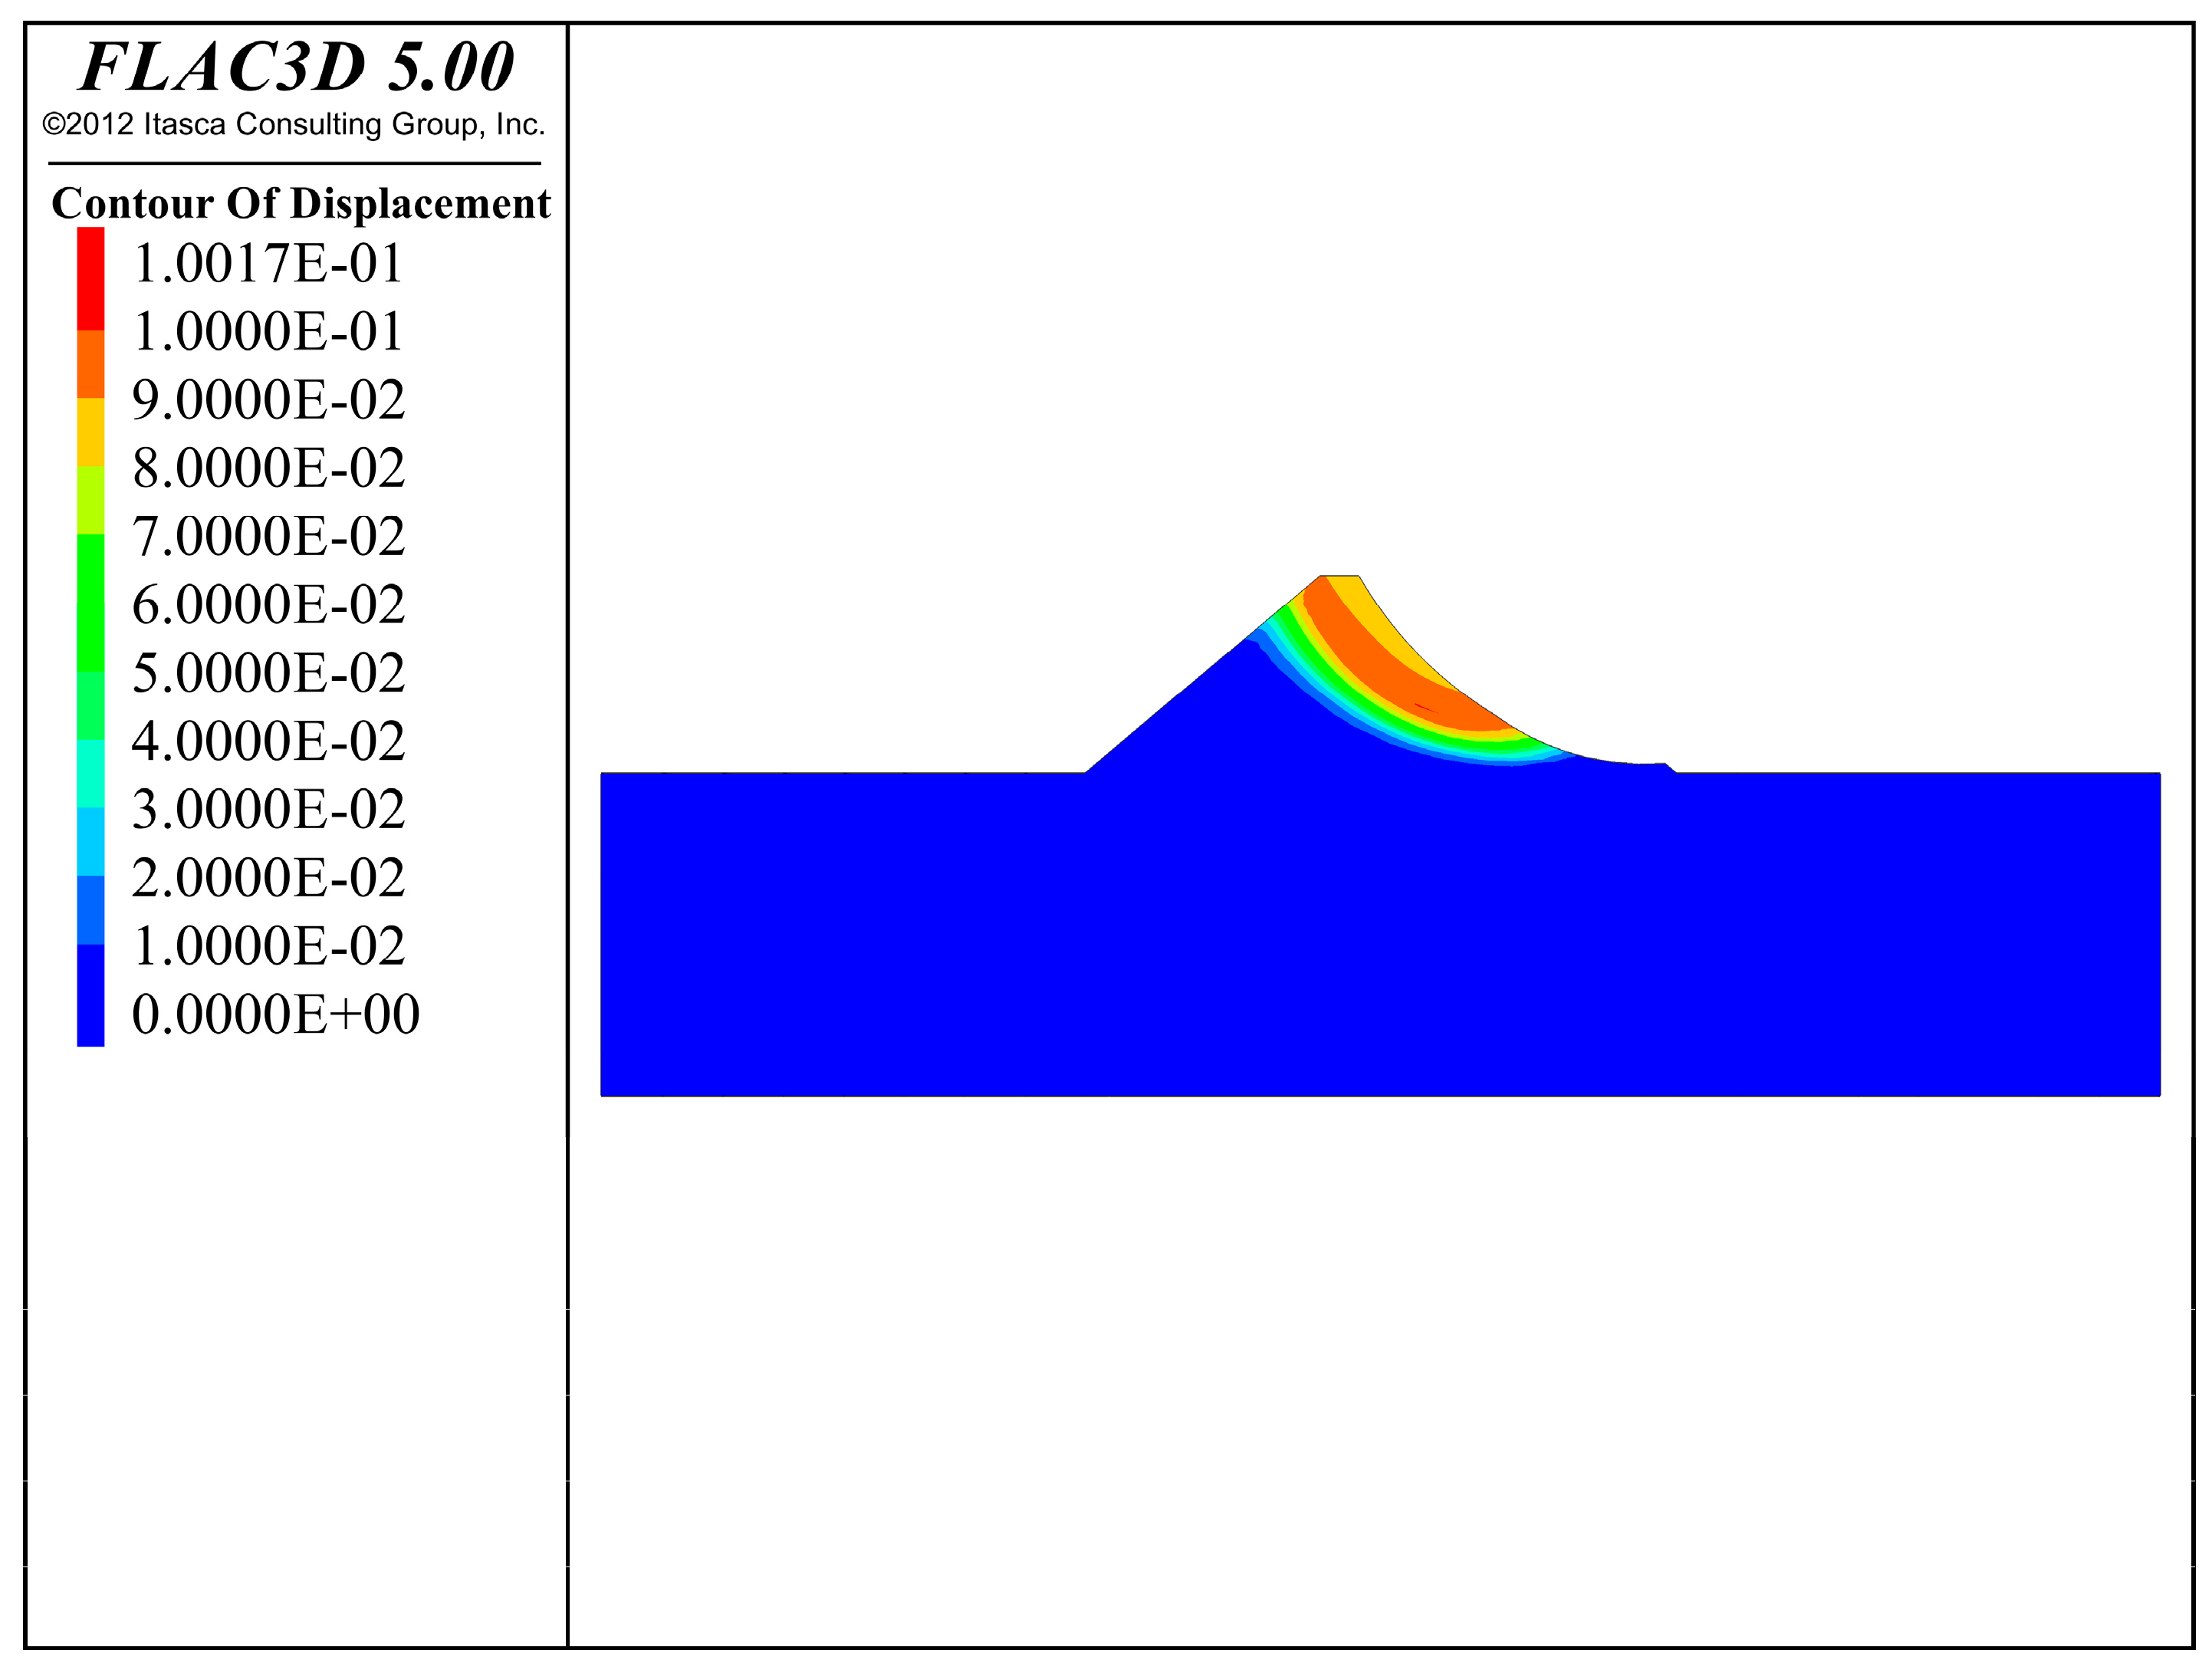
In the second model, the parameters of the model coincide with the second failure of the earth dam, and a part of the soil is washed away by water. The potential failure surface falls from the middle of the initial crest to the highest water level. According to the shear strain increment cloud map of the first failure, an arc was drawn along the shear plane during modeling to make it consistent with the shape of the sliding plane. The part above the sliding plane was removed, while the rest remained unchanged. In this calculation, the water level height of the set reservoir is 4.936 m. Other conditions remain unchanged. In the second instance of damage, The same as the displacement process (Figure 21), it can be seen from the shear strain increment program (Figure 22) that the crest will slide down along the failure surface, and the crest will disappear completely. Starting from the left side of the crest, the displacement along the orange-red area is the largest. The sliding situation of the loess dam in the field is similar to that of the model sliding in the simulation, both of which occur along the potential failure surface as a whole.
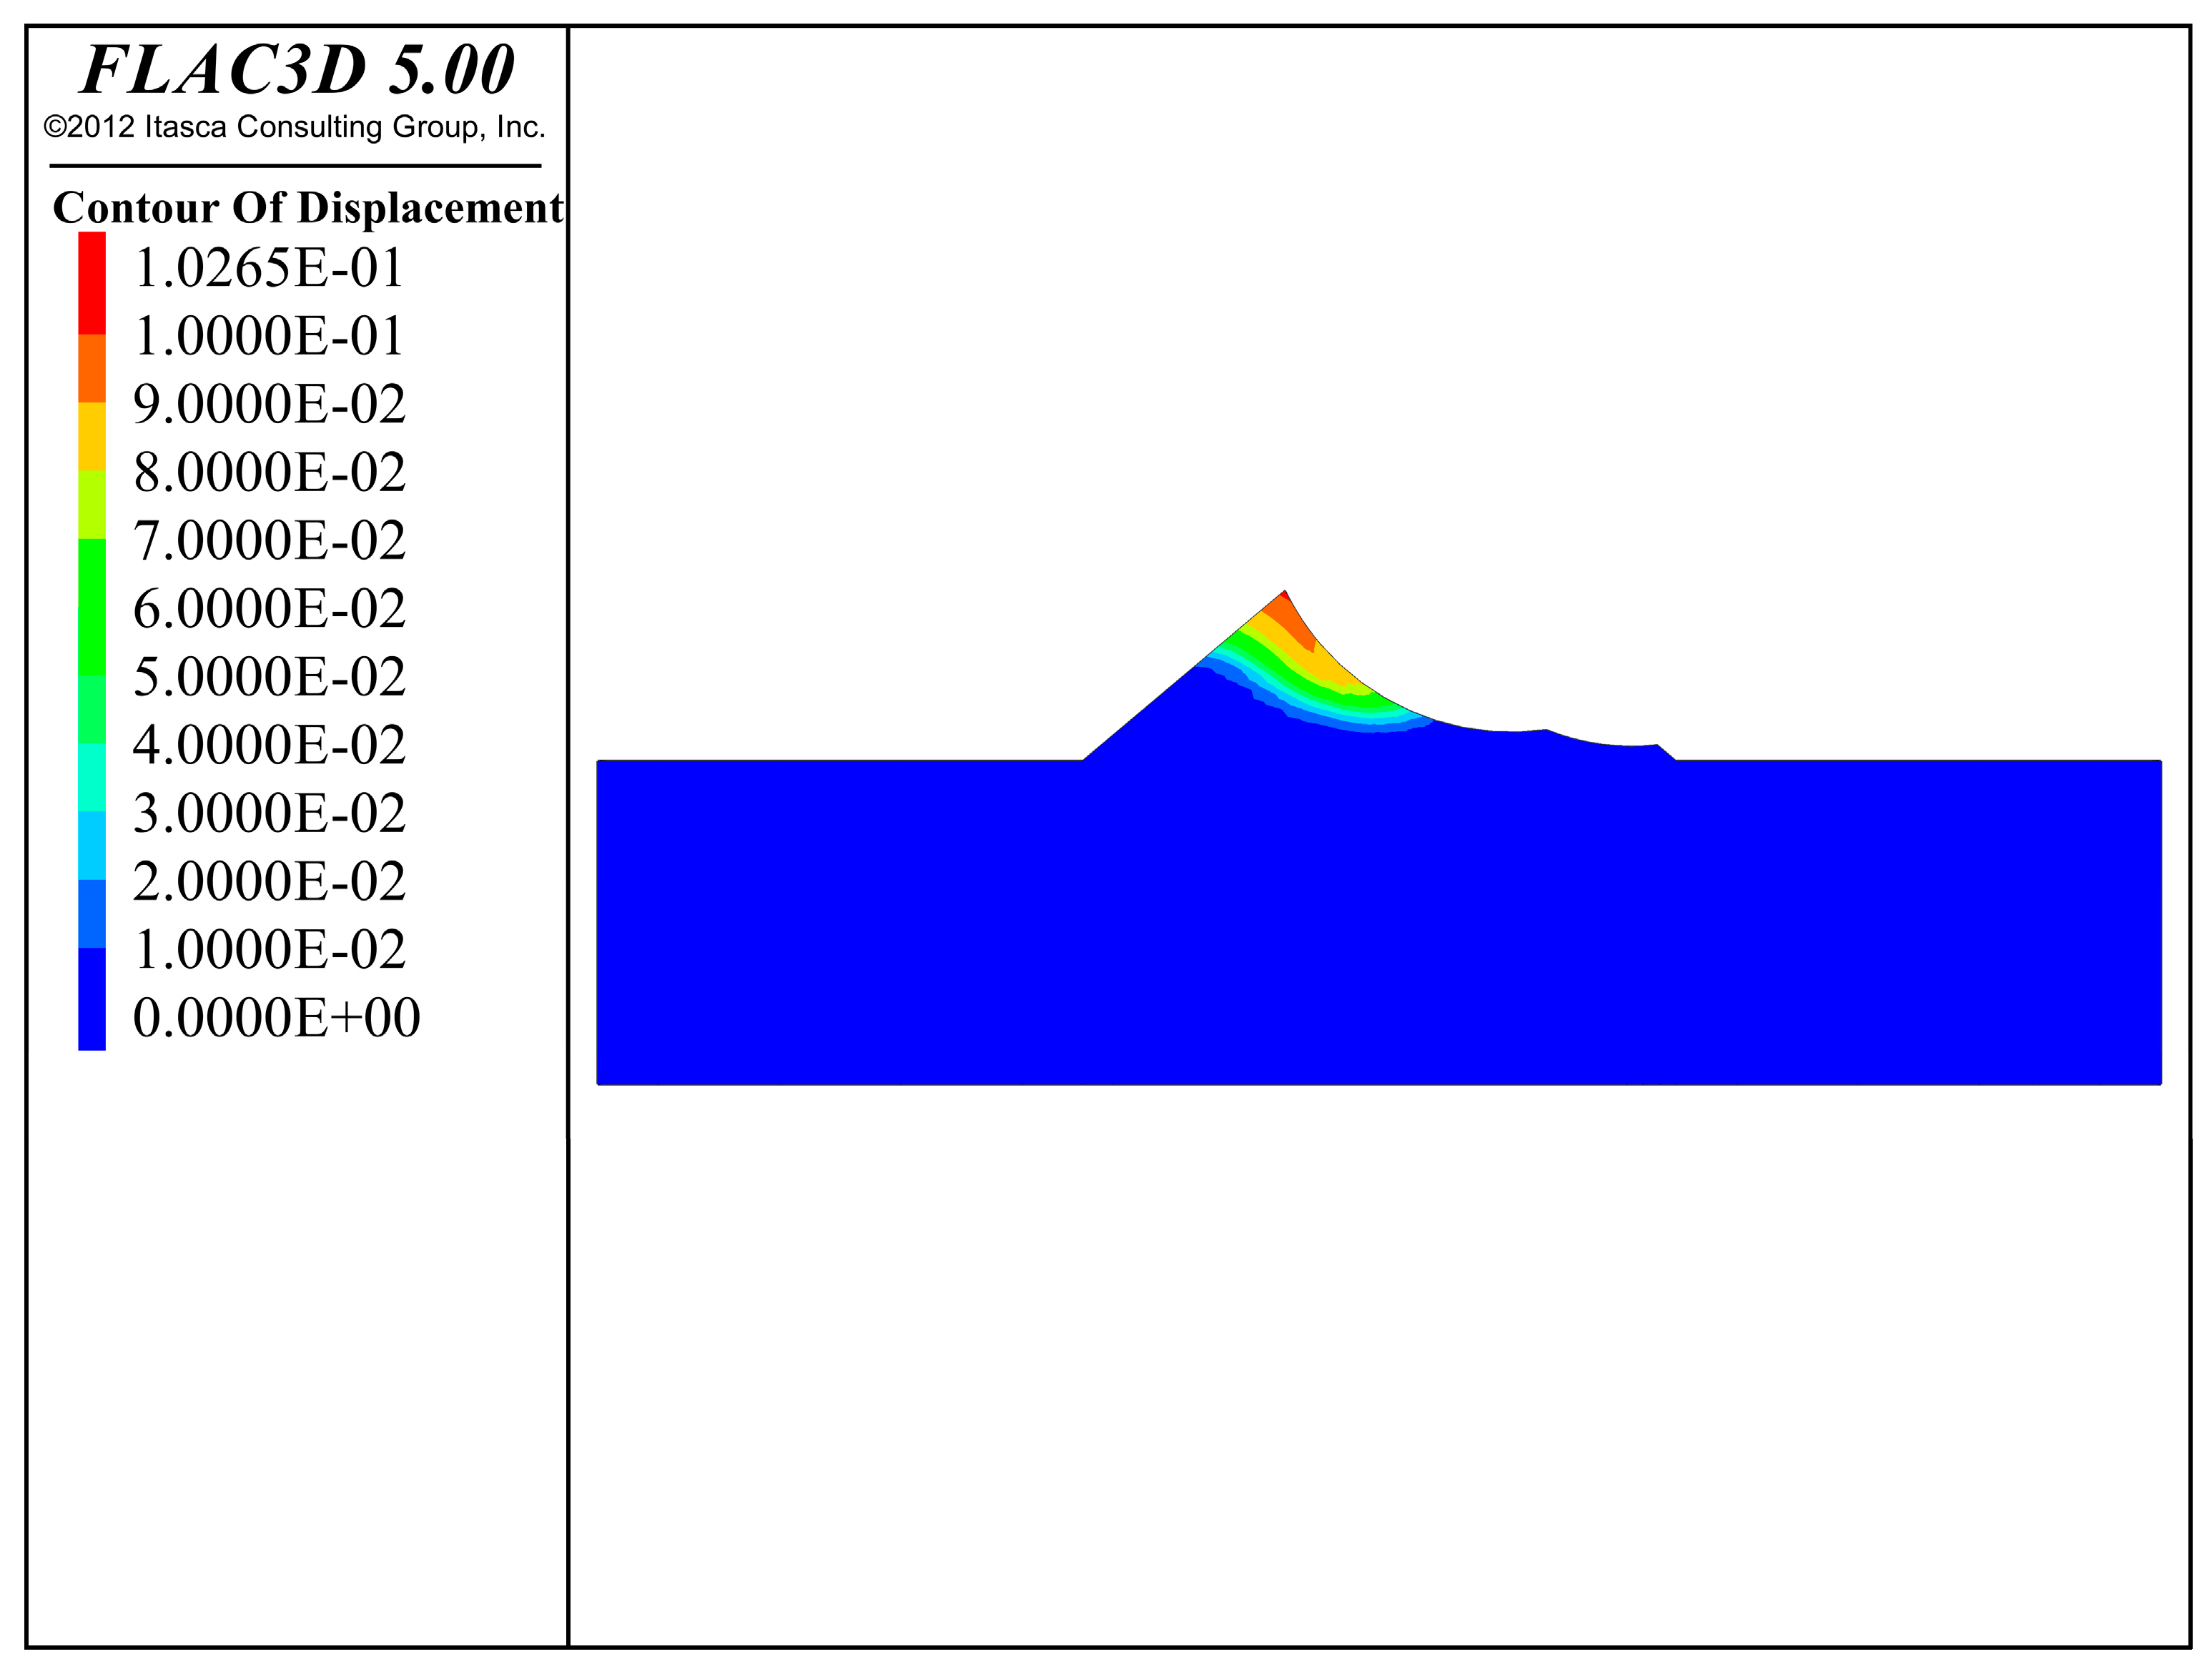
In the third model, the width of the dam crest is set to 0 m in order to simulate the internal stress of the loess dam site at the end of failure. At this time, one side of the loess dam is washed away by water and is in the state of breaking. According to the cloud map showing the shear strain increment of the first failure, an arc was drawn along the shear plane during modeling to make it consistent with the shape of the sliding plane. The part above the sliding plane was removed while the rest remained unchanged. In this calculation, the water level height of the set reservoir is 4.936 m. Other conditions remain unchanged. For the third instance of damage, The same as the displacement process (Figure 23), it can be clearly seen from the shear strain increment program (Figure 24) that the crest will slide down along the failure surface, and the crest will disappear completely. As part of the soil at the top of the loess dam is washed away, the upper part of the loess dam cannot bear the shear stress and osmotic pressure caused by water pressure, which is the same as the loading displacement result of the model. At the same time, the permeability effect is aggravated, the water content of the dam increases, and the maximum shear stress is gradually transferred to the interior of the dam.

4. Discussion

Studying the failure characteristics of loess dams and the mechanical properties of fillers is helpful for exploring the maintainability of water conservancy projects in loess areas and provides a theoretical basis for the maintenance of loess dams, which has important engineering significance. The results and limitations of the study are briefly discussed below:
(1)
The failure forms of remolded loess are affected by confining pressure, moisture content, and dry density. Under the conditions of low confining pressure, low moisture content, and high dry density, there is significant shear plane and shear dilatancy. Under the conditions of high confining pressure, high moisture content, and low dry density, the samples exhibited swelling failure, volume reduction, and shear shrinkage.
(2)
Water content and dry density will change the shear performance of loess, especially the internal friction angle. At a low dry density, the increase in water content causes the internal friction angle to decrease. However, when the dry density is 1.7 g/cm3, due to the small internal porosity, the movement of soil particles caused by external force will again make the soil particles tightly mesh. When the water content is 10% or 15%, the water film on the surface of the particles is thinner and does not play a significant role. When it is raised to 20%, the water film thickens and the lubricating effect is more significant. When the water content is 25%, the water film inside the sample dissolves a large amount of cemented material, no longer has a lubricating effect, and at the same time resists some external force, so the internal friction angle increases.
(3)
By conducting a horizontal orthogonal test of the remolded soil sample and a simulation of the progressive failure process of the loess dam, it was found that when the loess dam sheared, a shear failure surface formed. The shear failure surface gradually shifts to the water surface after the loess is washed, and finally, instability occurs. In the shear test, it is found that when the water content is low, it is also easy to form a shear failure surface similar to dam failure, which is in line with the law of the dam’s gradual water absorption failure.
(4)
In this work, the shear characteristics of unsaturated remolded loess are studied. However, in the actual loess accumulation dam project, the shear failure surface of the dam is affected by water pressure and pore water pressure, and the parameters of the undisturbed soil samples of the loess dam may change under the infiltration of water. Therefore, the data obtained in the test may be different from the actual loess dam materials in the case of failure. Moreover, the flow scouring effect of seepage water in the process of dam failure is not considered. Therefore, the conclusion of the test can only be used as a qualitative analysis, which can provide reference for the design, construction and reinforcement of the loess dam. We have studied the improvement of local loess, and a small amount of attapulgite and nano-montmorillonite can greatly improve the shear strength of loess. We also conducted a corresponding study on saturated remolded loess, and monitored the damage process on site. We found that the dam experienced three significant instances of damage during the monitoring period (XU 2020) [23], which was due to the gradual formation of loess via water infiltration. According to the results of the test, we improved the local loess. Adding a small amount of attapulgite and nano-montmorillonite can greatly improve the shear strength of loess (Cao 2021) [24].

Author Contributions

N.C.: Conceptualization, Methodology, Software, Investigation, Formal Analysis, Writing—Original Draft; Q.L.: Data Curation, Writing—Original Draft; W.W.: Investigation; D.Z.: Resources, Supervision; X.W.: Writing—Review and Editing; J.X.: Conceptualization, Funding Acquisition, Resources, Supervision, Writing—Review and Editing; Y.N.: Model Simulation. L.N.: Funding Acquisition, Resources. All authors have read and agreed to the published version of the manuscript.

Funding

This research was funded by the National Natural Science Foundation of China (Nos. 41790443 and 41927806); the National Key R&D Program of China (No. 2016YFC0802203); the Fundamental Research Funds for the Central Universities, CHD (300102219213); the Key R&D Program of Shaanxi Province (2018ZDXM-SF-024); the Zhejiang Collaborative Innovation Center for Prevention and Control of Mountain Geologic Hazards (PCMGH-2017-Z-01) and the Natural Science Foundation of Qinghai Province (2019-ZJ-7050).

Institutional Review Board Statement

Not applicable.

Informed Consent Statement

Informed consent was obtained from all subjects involved in the study.

Data Availability Statement

Data are available in a publicly accessible repository. The data presented in this study are openly available in Research Square at https://doi.org/10.21203/rs.3.rs-1222795/v1, reference number [25] (accessed on 5 April 2022).

Conflicts of Interest

The authors declare no conflict of interest.

References

  1. Zheng, H.; Lin, H.; Zhou, W.W.; Bao, H.; Zhu, X.J.; Jin, Z.; Song, Y.; Wang, Y.Q.; Liu, W.Z.; Tang, Y.K. Revegetation has increased ecosystem water-use efficiency during 2000–2014 in the Chinese Loess Plateau: Evidence from satellite data. Ecol. Indic. 2019, 102, 507–518. [Google Scholar] [CrossRef]
  2. Liu, D.S. The Loess Deposits in China; Science Press: Beijing, China, 1965; pp. 1–10. [Google Scholar]
  3. Lan, H.X.; Lee, C.F.; Zhou, C.H.; Martin, C.D. Dynamic characteristics analysis of shallow landslides in response to rainfall event using GIS. Environ. Geol. 2005, 47, 254–267. [Google Scholar] [CrossRef] [Green Version]
  4. Liu, X.; Zhang, N.; Lan, H.X. Effects of sand and water contents on the small-strain shear modulus of loess. Eng. Geol. 2019, 260, 105202. [Google Scholar] [CrossRef]
  5. Yan, C.G.; Wan, Q.; Xu, Y.; Xie, Y.; Yin, P. Experimental study of barrier effect on moisture movement and mechanical behaviors of loess soil. Eng. Geol. 2018, 240, 1–9. [Google Scholar] [CrossRef]
  6. Wang, J.D.; Zhang, D.F.; Wang, N.Q.; Gu, T.F. Mechanisms of wetting-induced loess slope failures. Landslides 2019, 16, 937–953. [Google Scholar] [CrossRef]
  7. Wen, B.P.; Yan, Y.J. Influence of structure on shear characteristics of the unsaturated loess in Lanzhou, China. Eng. Geol. 2014, 168, 46–58. [Google Scholar] [CrossRef]
  8. Xing, Y.C.; Gao, D.H.; Jin, S.L.; Zhang, A.J.; Guo, M.X. Study on Mechanical Behaviors of Unsaturated Loess in terms of Moistening Level. KSCE J. Civ. Eng. 2019, 23, 1055–1063. [Google Scholar] [CrossRef]
  9. Liang, C.Y.; Cao, C.; Wu, S. Hydraulic-mechanical properties of loess and its behavior when subjected to infiltration-induced wetting. Bull. Eng. Geol. Environ. 2016, 77, 385–397. [Google Scholar] [CrossRef]
  10. Gao, D.H.; Chen, Z.H.; Guo, N.; Zhu, Y.P.; Hu, S.X.; Yao, Z.H. The influence of dry density and matric suction on the deformation and the strength characteristics of the remolded unsaturated loess soils. Chin. J. Rock Mech. Eng. 2017, 36, 221–229. [Google Scholar] [CrossRef]
  11. Xing, X.L.; Li, T.L.; Fu, Y.K. Determination of the related strength parameters of unsaturated loess with conventional triaxial test. Environ. Earth Sci. 2016, 75, 82. [Google Scholar] [CrossRef]
  12. Ni, P.P.; Mei, G.X.; Zhao, Y.L. Influence of Raised Groundwater Level on the Stability of Unsaturated Soil Slopes. Int. J. Geomech. 2018, 18, 04018168. [Google Scholar] [CrossRef]
  13. Yang, X.H. Study on Strength Property of Unsaturated Remolded; Dissertation, Northwest A&F University: Yanglin, China, 2008. (In Chinese) [Google Scholar]
  14. Dang, J.Q.; Jiang, C.L.; Ji, Z.L. Effects of Shear Rate on Mechanical Behavior of Structured Loess. Chin. J. Undergr. Space Eng. 2009, 5, 459–462. [Google Scholar]
  15. Wang, J.J.; Hao, Y.Z.; Wang, T.H. Experimental study on structural characteristics of unsaturated compacted loess. Rock Soil Mech. 2019, 1351–1357. [Google Scholar] [CrossRef]
  16. Luo, A.Z. Debugging of a New True Triaxial Apparatus and Experiment Study on the Strength-Deformation Characteristic of Remolded Loess; Dissertation, Northwest A&F University: Yanglin, China, 2008. (In Chinese) [Google Scholar]
  17. Dijkstra, T.A.; Rogers, C.D.F.; Smalley, I.J.; Derbyshire, E.; Li, Y.J.; Meng, X.M. The loess of north-central China: Geotechnical properties and their relation to slope stability. Eng. Geol. 1994, 36, 153–171. [Google Scholar] [CrossRef]
  18. Patil, U.D. Characterization of Compacted Silty Sand Using a Double-Walled Triaxial Cell with Fully Automated Relative-Humidity Control. Geotech. Test. J. 2016, 39, 742–756. [Google Scholar] [CrossRef]
  19. Patil, U.D.; Puppala, A.J.; Hoyos, L.R.; Pedarla, A.J. Modeling critical-state shear strength behavior of compacted silty sand via suction-controlled triaxial testing. Eng. Geol. 2017, 231, 21–33. [Google Scholar] [CrossRef]
  20. Patil, U.D.; Hoyos, L.R.; Puppala, A.J.; Surya, S.C.C. Suction Stress Characteristic Curves of Cohesive-Frictional Soils from Multiple Suction-Controlled Testing Methods. Int. J. Geomech. 2020, 20, 0402077. [Google Scholar] [CrossRef]
  21. Du, C.; Liang, L.; Yi, F.; Niu, B. Effects of Geosynthetic Reinforcement on Tailings Accumulation Dams. Water 2021, 13, 2986. [Google Scholar] [CrossRef]
  22. Sainsbury, B.-A.; Gharehdash, S.; Sainsbury, D. Large-scale characterisation of cemented rock fill performance for exposure stability analysis. Constr. Build. Mater. 2021, 308, 124995. [Google Scholar] [CrossRef]
  23. Xu, J.B.; Wei, W.; Bao, H.; Zhang, K.K.; Lan, H.X.; Yan, C.G.; Sun, W.F.; Wu, F.Q. Study on shear strength characteristics of loess dam materials under saturated conditions. Environ. Earth Sci. 2020, 9, 346. [Google Scholar] [CrossRef]
  24. Cao, B.H.; Zhao, D.N.; Xu, J.B.; Sun, H.H.; Qi, Y.; Lai, J. Experiment study on mechanical properties of loess improved by nano clays. J. Archit. Civ. Eng. 2023, 40, 138–149. (In Chinese) [Google Scholar]
  25. Chen, N.Y.; Zhao, D.N.; Wu, X.; Xu, J.B.; Nan, Y.L.; Niu, L.G. Study on Filling Material Strength and Dam Failure Characteristics of Loess Dam, Preprint (Version 1). Available online: https://www.researchsquare.com/article/rs-1222795/v1 (accessed on 5 April 2022).
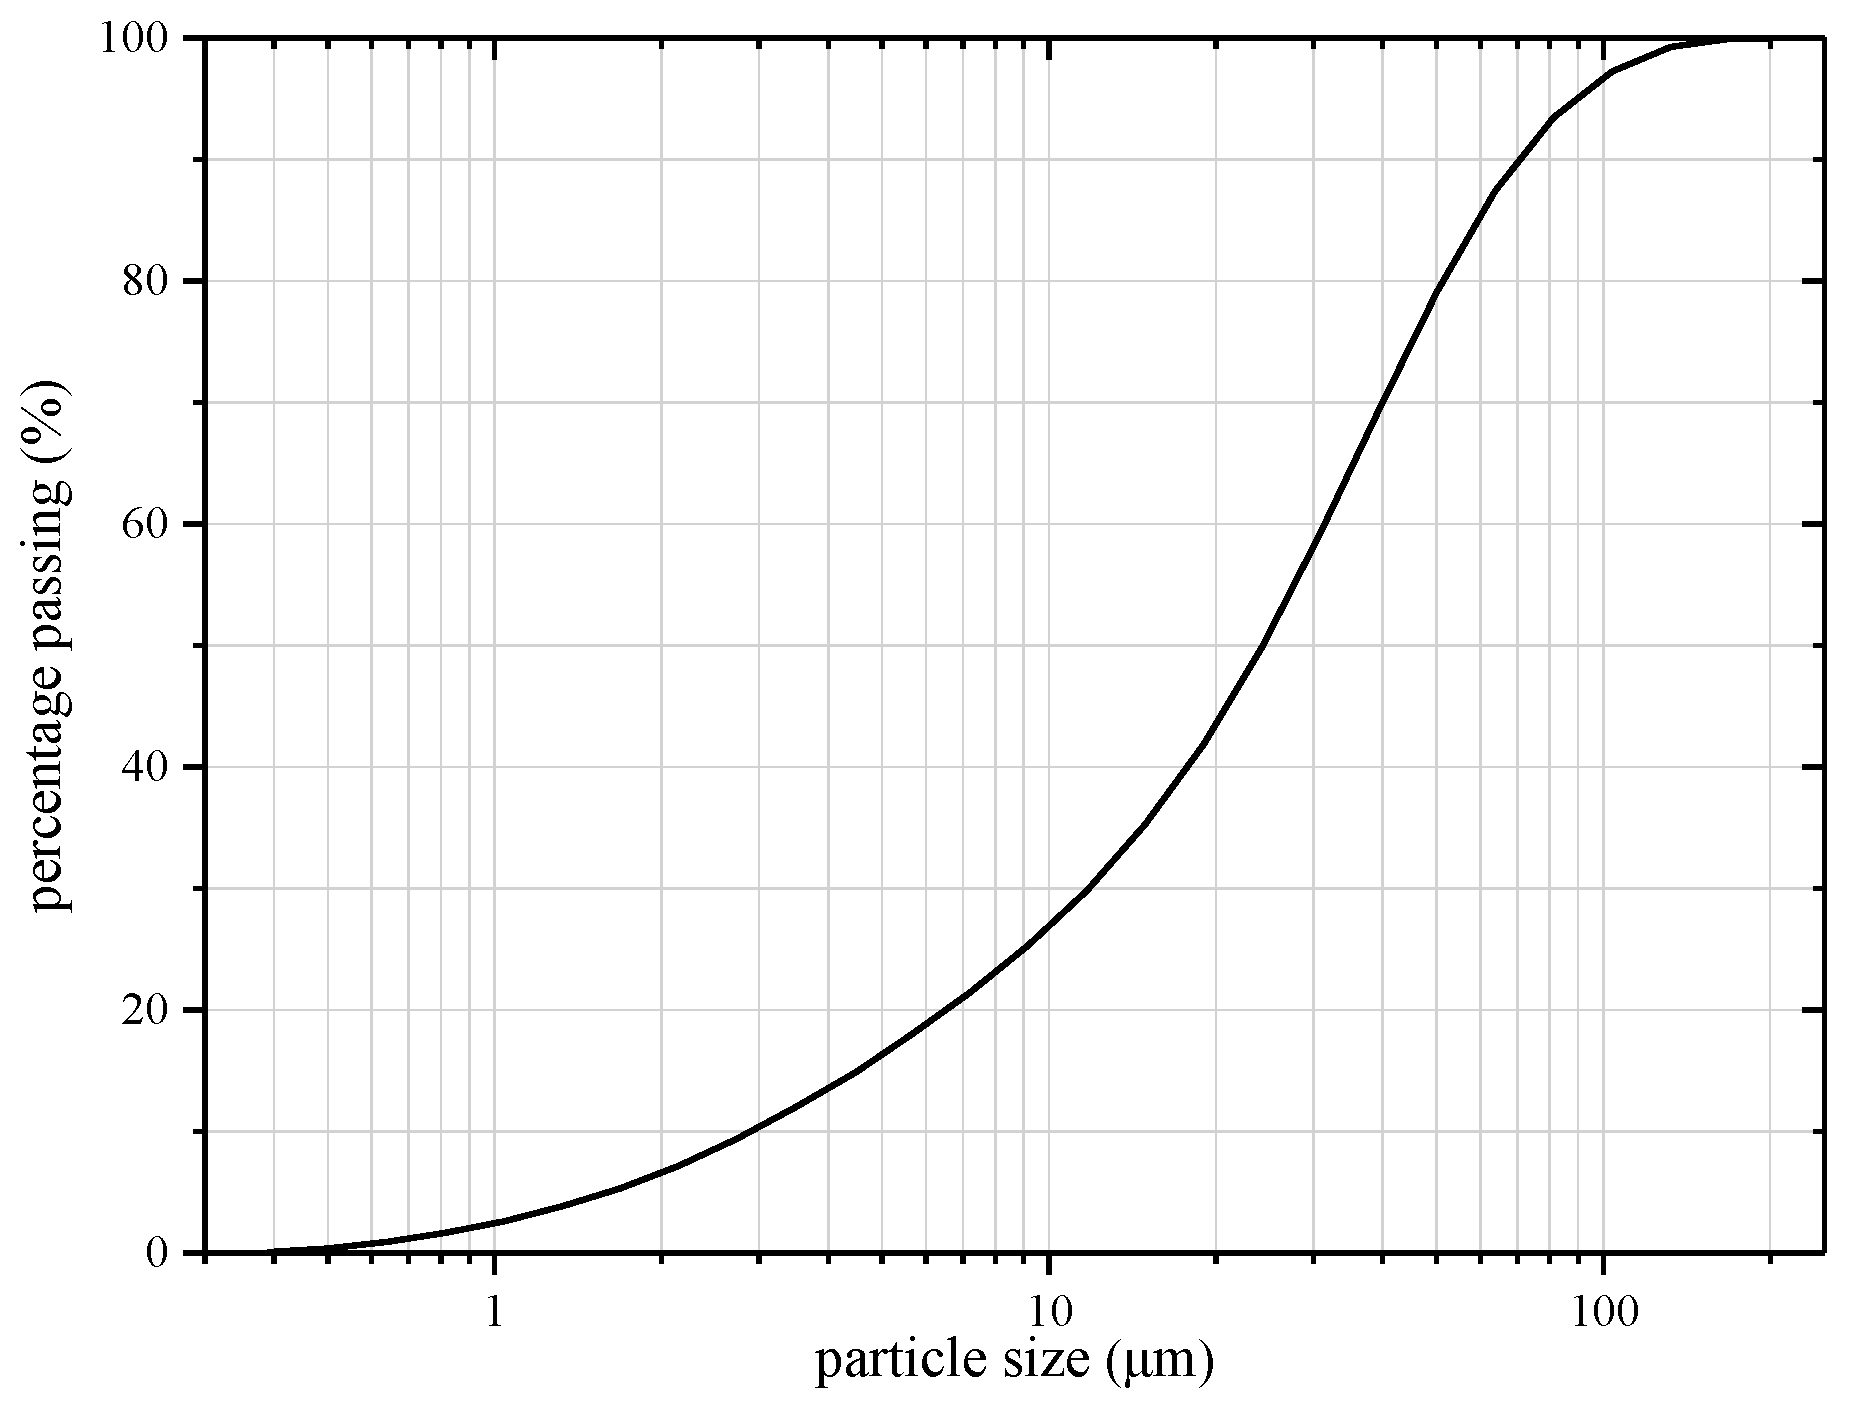
Figure 1. Particle size distribution in soil.
Applsci 13 08683 g001
Figure 2. Failure characteristics of soil samples under different confining pressures (ρd = 1.7 g/cm3, σ3 = 50 kPa, 100 kPa, 150 kPa, 200 kPa); on the far left is the untested sample.
Applsci 13 08683 g002
Figure 3. Failure characteristics of soil samples at different dry densities (ω = 10%,ρd = 1.4 g/cm3, 1.5 g/cm3, 1.6 g/cm3, 1.7 g/cm3).
Applsci 13 08683 g003
Figure 4. Failure characteristics of soil samples with different water contents (σ3 = 50 kPa, ω = 10%, 15%, 20%, 25%).
Applsci 13 08683 g004
Figure 5. Stress–strain curves under different confining pressures: (a) ρd = 1.4 g/cm3, ω = 10%; (b) ρd = 1.5 g/cm3, ω = 10%; (c) ρd = 1.6 g/cm3, ω = 10%; (d) ρd = 1.7 g/cm3, ω = 10%.
Applsci 13 08683 g005
Figure 6. Stress–strain curves under different dry densities: (a) σ3 = 50 kPa, ω = 10%; (b) σ3 = 200 kPa, ω = 10%.
Applsci 13 08683 g006
Figure 7. Stress–strain curve under different moisture contents: (a) σ3 = 50 kPa, ρd = 1.7 g/cm3; (b) σ3 = 200 kPa, ρd = 1.7 g/cm3.
Applsci 13 08683 g007
Figure 8. The variation rule of cohesion under a different water content.
Applsci 13 08683 g008
Figure 9. The variation law of internal friction angle under a different water content.
Applsci 13 08683 g009
Figure 10. The variation rule of cohesion under a different dry density.
Applsci 13 08683 g010
Figure 11. The variation law of internal friction under a different dry density.
Applsci 13 08683 g011
Figure 12. Loess stacking dam.
Applsci 13 08683 g012
Figure 13. Photograph of front damage.
Applsci 13 08683 g013
Figure 14. First instance of dam damage: (a) Panorama of the first dam damage; (b) Dam first damage crack expansion diagram.
Applsci 13 08683 g014
Figure 15. Second instance of dam damage: (a) Panorama of the second failure of dam body; (b) Dam second damage crack expansion diagram.
Applsci 13 08683 g015
Figure 16. Third instance of dam damage: (a) Panorama of the third failure of dam body; (b) Dam third damage crack expansion diagram.
Applsci 13 08683 g016
Figure 17. Seepage progressive failure process of loess stacking dam.
Applsci 13 08683 g017
Figure 18. Calculation model.
Applsci 13 08683 g018
Figure 19. Cloud chart showing the displacement for the first instance of damage.
Applsci 13 08683 g019
Figure 20. Cloud chart showing the maximum shear strain increment for the first instance of damage.
Applsci 13 08683 g020
Figure 21. Cloud chart showing the displacement for the second instance of damage.
Applsci 13 08683 g021
Figure 22. Cloud chart showing the maximum shear strain increment for the second instance of damage.
Applsci 13 08683 g022
Figure 23. Cloud chart showing the displacement for the third instance of damage.
Applsci 13 08683 g023
Figure 24. Cloud chart showing the maximum shear strain increment for the third instance of damage.
Applsci 13 08683 g024
Table 1. Physical properties of soil specimens.
Water Content/%Dry Density/(g·cm−3)Specific Gravity of SoilPercentage of Soil Particles at Different Particle Sizes
<0.002 mm0.002–0.075 mm0.075–0.25 mm0.25–0.5 mm0.5–2 mm
14.97%1.5572.715.7283.0111.2700
Table 2. Numerical calculation of model parameters.
Assignment ParametersDensity/(g·cm3)Bulk Modulus/MPaShear Modulus/MPaPermeability Coefficient/(cm/s)Dam Body Cohesion/(kPa)Internal Friction Angle of the Dam/(°)Foundation Cohesion /(kPa)Friction Angle within the Foundation/(°)
Parameter value1559239.462.09077 × 10−510252025
Disclaimer/Publisher’s Note: The statements, opinions and data contained in all publications are solely those of the individual author(s) and contributor(s) and not of MDPI and/or the editor(s). MDPI and/or the editor(s) disclaim responsibility for any injury to people or property resulting from any ideas, methods, instructions or products referred to in the content.