Article

Monitoring Ground Displacement in Mining Areas with Time-Series Interferometric Synthetic Aperture Radar by Integrating Persistent Scatterer/Slowly Decoherent Filtering Phase/Distributed Scatterer Approaches Based on Signal-to-Noise Ratio

1
School of Surveying and Geo-Infomatics, Shandong Jianzhu University, Jinan 250101, China
2
College of Geography and Environment, Shandong Normal University, Jinan 250358, China
3
State Key Laboratory of Geodesy and Earth’s Dynamics, Wuhan 430077, China
4
College of Geodesy and Geomatics, Shandong University of Science and Technology, Qingdao 266590, China
*
Authors to whom correspondence should be addressed.
Appl. Sci. 2023, 13(15), 8695; https://doi.org/10.3390/app13158695
Submission received: 5 May 2023 / Revised: 20 July 2023 / Accepted: 26 July 2023 / Published: 27 July 2023
(This article belongs to the Special Issue Land Subsidence: Monitoring, Prediction and Modeling - 2nd Edition)

Abstract

:
During the interferometric synthetic aperture radar (InSAR)-based ground displacement monitoring in mining areas, the overlying land is mainly covered by low vegetation and arable land, which makes interferograms acquired by InSAR techniques easily susceptible to decorrelation, resulting in the quantity and density of highly coherent points (CPs) are not enough to reflect the spatial location and spatio-temporal evolution process of ground displacement, which is hardly meeting requirements of high-precision ground displacement monitoring. In this study, we developed an approach for monitoring ground displacement in mining areas by integrating Persistent Scatterer (PS), Slowly Decoherent Filtering Phase (SDF), and Distributed Scatterer (DS) based on signal-to-noise ratio (SNR) to increase the spatial density of CPs. A case study based on a mining area in Heze was carried out to verify the reliability and feasibility of the proposed method in practical applications. Results showed that there were four significant displacement areas in the study area and the quantity of CPs acquired by the proposed method was maximum 6.7 times that of conventional PS-InSAR technique and maximum 2.3 times that of SBAS-InSAR technique. The density of CPs acquired by the proposed method increased significantly. The acquired ground displacement information of the study area was presented in more detail. Moreover, the monitoring results were highly consistent with ground displacement results extracted by PS-InSAR and SBAS-InSAR methods in terms of displacement trends and magnitudes.

1. Introduction

As the main fossil energy source in China, coal is known as the “food of industry” and provides the basis for energy consumption for the overall development and progress of the society in China. According to statistics from the National Bureau of Statistics, coal accounts for approximately 54.7% of total disposable energy production and consumption, with a trend of growth year by year [1]. However, due to the exploitation of coal resources, the equilibrium of the original stress field of the rock around the coal seam area is broken, causing a redistribution of stresses, which can lead to shifting, subsidence, and damage to the rock and ground surface around the coal seam during the process of reaching a new equilibrium with the coupling of the subsidence, seepage, and strain fields generated by the mining of the rock seam [2]. The total coal mining displacement area in China is already more than 20,000 km2 by 2020, and, thus, will destroy the natural terrain and cause serious damage to the ecological environment, such as land resources, water resources, and atmosphere in the mining area, as well as houses, railways, roads, bridges, and other structures around the displacement area [3,4]. Hence, accurate monitoring of surface deformation in mining areas and adopting control measures are essential to prevent mining subsidence disasters in the coal mines [5,6].
Traditional ground displacement monitoring techniques in coal mining areas include level measurement, trigonometric leveling, and global navigation satellite system (GNSS) measurement [7]. Although the accuracy of those monitoring methods is relatively high, their spatial resolution is limited by the quantity and distribution of the monitoring points. This makes them more suitable for high-precision ground displacement monitoring than for reflecting the overall characteristics of the ground displacement in large-scale, large-span coal mining areas [8,9]. Synthetic Aperture Radar Interferometry (InSAR) can effectively offset the shortcomings of traditional ground displacement monitoring techniques by extracting the phase difference between two SAR images taken from the same area at different times, is a powerful technique for monitoring ground displacement in coal mining areas with wide coverage and high precision in all weather conditions [10,11]. The time series InSAR technologies represented by Persistent Scatterer (PS)-InSAR and Small Baseline Subsets (SBAS)-InSAR use the phase values of high coherence pixel points which are influenced slightly by space–time decoherence and show relatively stable scattering properties in synthetic aperture radar (SAR) images as the time series analysis object, can be used for long-term ground displacement monitoring in mining areas [12,13]. Nevertheless, it is difficult for the conventional time series InSAR technique to obtain enough uniformly distributed high CPs in the mining areas and surrounding surfaces which are usually covered by vegetation or bare lands [14].
The recently developed distributed scatterer (DS)-InSAR technologies [15] expand research keys from high coherence point targets with relatively stable scattering properties to distributed targets with moderate scattering properties and related scholars around the world began to shift their research focus to distributed targets with relatively weak backscatter to maximize the spatial sampling of the InSAR-based displacement results [16]. Previous research have shown that the integration of the high coherence point targets and distributed targets can be used to not only increase the point target density in the monitoring area significantly but also overcome shortcomings of conventional time series technique that it cannot acquire detailed ground displacement monitoring results in areas where have low image coherence caused by high vegetation coverage [15,17,18,19,20,21]. In this paper, an approach for monitoring ground displacement in mining areas was proposed by integrating PS point, slowly decoherent filtering phase (SDF) point and DS point based on signal-to-noise ratio (SNR). This method first acquired the PS point, SDF point, and DS point by using PS-InSAR, SBAS-InSAR, and DS-InSAR technologies. Second, the phase-value of the CPs can be obtained by integrating the PS point, SDF point, and DS point based on their SNRs. Finally, the deformation model was solved by a three-dimensional unwinding and least-squares algorithm to acquire the results of ground displacement in coal mining areas. A case study based on a coal mine in Heze, Shandong Province was carried out. Based on the 25 Sentinel-1A satellite SAR images, the ground displacement monitoring results of the study area were acquired by the proposed method and a cross-verification was conducted with monitoring results of conventional PS-InSAR and SBAS-InSAR technologies. The proposed method proved effective to monitor ground displacement in the mining area.

2. Methodology

2.1. Selection of PS/SDF/DS Target Points

The time series difference interferometric phase diagram was acquired according to the interference pair combination principle of PS-InSAR technique and SBAS-InSAR technique. A set of high-coherence candidates (PS and SDF points) were chosen preliminarily based on the amplitude deviation threshold method [17]. The main process of the method includes obtaining the amplitude deviation value D A of the image pixel and setting a threshold value T A of the amplitude deviation index. If D A < T A , the pixel was determined as the high coherence candidate. Otherwise, it was a non-high CPs. The calculation formula of D A can be expressed as
D A = σ A m A
where σ A and m A are the mean and variance of amplitude.
The phase information of these candidates was calculated. Moreover, a phase stability index was calculated according to phase error statistical characteristics. The candidates were screened for the second time to determine the ultimate high CPs.
γ x = 1 N i = 1 N exp 1 ϕ x , i ϕ ¯ x , i ϕ ^ t o p o , x , i
where N is the quantity of interference images, ϕ ¯ x , i is the spatial correlation phase in interference phase, and ϕ ^ t o p o , x , i is the estimated value of topographic phase.
The selection of DS points is composed of homogeneous pixel recognition and phase optimization [19,20]. The former process is to recognize the distributed target pixels which have similar scattering properties with the sample data as the homogeneous pixel set based on the hypothesis testing. Similar to the comment above mentioned selection process of high CPs, after acquisition of the differential interferograms from a single master image interferometric combination or a multiple master image interferometric combination, the homogeneous pixel points were recognized by the FaSHPS algorithm [22]. The fundamental of the FaSHPS algorithm is to solve the confidence interval from the hypothesis test problem that arises during homogeneous pixel recognition. This can be expressed as follows
P { μ ( p ) z 1 a / 2 0.52 μ ( p ) / N L < A ¯ < μ ( p ) + z 1 a / 2 0.52 μ ( p ) / N L } = 1 a
where μ ( p ) is the expectation of time series strength of the pixel p . P . refers to probability and z 1 a / 2 is the 1 α / 2 quantile of standard normal distribution.
The pixels in the adjacent region with average strength in the interval were recognized as homogeneous pixels of the reference point P. Additionally, homogeneous pixels of each pixel in the SAR images were recognized. Homogeneous pixels with a quantity higher than the given threshold were chosen as the initial DS candidate. Furthermore, phases of DS points were optimized by the covariance matrix eigenvalue decomposition algorithm. The DS points with good coherence and high SNR were screened by setting a threshold for the degree of fitting among interferometric phases before and after phase optimization [23].

2.2. Integration of PS/SDF/DS Based on SNR

For joint treatment of the above CPs, the SNR of each pixel was calculated by time coherence coefficient to obtain the weighted average phase value of coincident coherence point targets. Specifically, temporal coherence ( γ ) can be used to reflect the interferometric phase noises and phase stability of a pixel. SNR is a universal evaluation index to describe noise and phase stability of interferometric phases of pixels. Therefore, the PS points, SDF points, and DS points with relatively low SNR were removed according to the SNR of pixels. The phases of CPs were further optimized to ensure that they had a relatively high SNR. where γ x is the coherence value. The calculation formula of SNR is presented as [17]:
χ S N R = 1 γ 1
The φ P S x , y and φ S B A S x , y were considered as the wrapped phases of the point ( x , y ) from the permanent scattering method and small baseline subset method. φ P S / S B A S x , y was the wrapped phase value of point ( x , y ) after integration of weighted average based on the SNR of point ( x , y ) [17]. The interferometric combination of the permanent scatterer method is first restructured according to the small baseline subsets interferometric combination, and the equivalent interferometric phase of the PS point is calculated from the obtained recombined small baseline subsets combined interferometric phase. It should be noted that the equivalent interferometric phase of the PS point is different from that extracted directly from the small baseline set interferogram, as no spectral filtering was performed. Then, the DS points can then be integrated with the PS/SDFP points in the same way. It is worth noting that these integrated phase values are wrapped phase and the integration process described above can improve the spatial resolution of the interferograms while reducing the aliasing in phase unwrapping [24].

2.3. Time Series Ground Displacement Solution

The integrated phase values obtained according to the description in Section 2.2 are based on the interferograms obtained from combination of multiple master images. According to the SBAS-InSAR technique interferometric combination of multiple master images method, the following model can be obtained [25]
A ϕ = δ ϕ
where each row of the matrix A M × N is corresponding to an interference pattern and each column is corresponding to one SAR image. ϕ is composed of displacement phases of SAR images at N moments of the CPs, where phase at the first moment is used as the reference phase, recording as 0. δ ϕ is the vector composed of phases of M unwrapping interference pattern. When the interferograms are combined to form only one small baseline subset, the rank of the matrix A is N , the least squares (LS) method can be used to solve for the estimated cumulative displacement phase value:
ϕ ^ = ( A T A ) 1 A T δ ϕ
When the interferograms are combined to form multiple ( > 1 ) small baseline subsets, Equation (6) rank defect, the singular value decomposition (SVD) of the coefficient matrix A is performed for the purpose to calculate the cumulative LS sense with minimum norm solution of displacement phase value. Then, the time series of LOS (Light of Sight) displacement can be obtained.
For the wrapped phase of the final CPs obtained after the above integration, the residual phase (orbital error phase, atmospheric phase, elevation residual phase, and noise phase) was separated using spatio-temporal filtering. The 3D unwrapping phase method can usually be used to unwrap the fused phases. The method uses the principle of the nearest-neighbor to connecting CPs in the spatial domain into a Delaunay irregular triangular network and the phase is unwrapped along the network edges to obtain the differential wrapped phase value, then obtain the unwrapped phase of the CPs. Then, the spatially relevant displacement phase was separated by the spatio-temporal filtering (high pass filtering of the unwrapped phase in the spatial domain and low pass filtering in the temporal domain) to obtain the final displacement phase. The model was solved based on the LS method while obtaining time series LOS displacement information. The data processing procedures are shown in Figure 1.

3. Study Area and Data Processing

3.1. Study Area

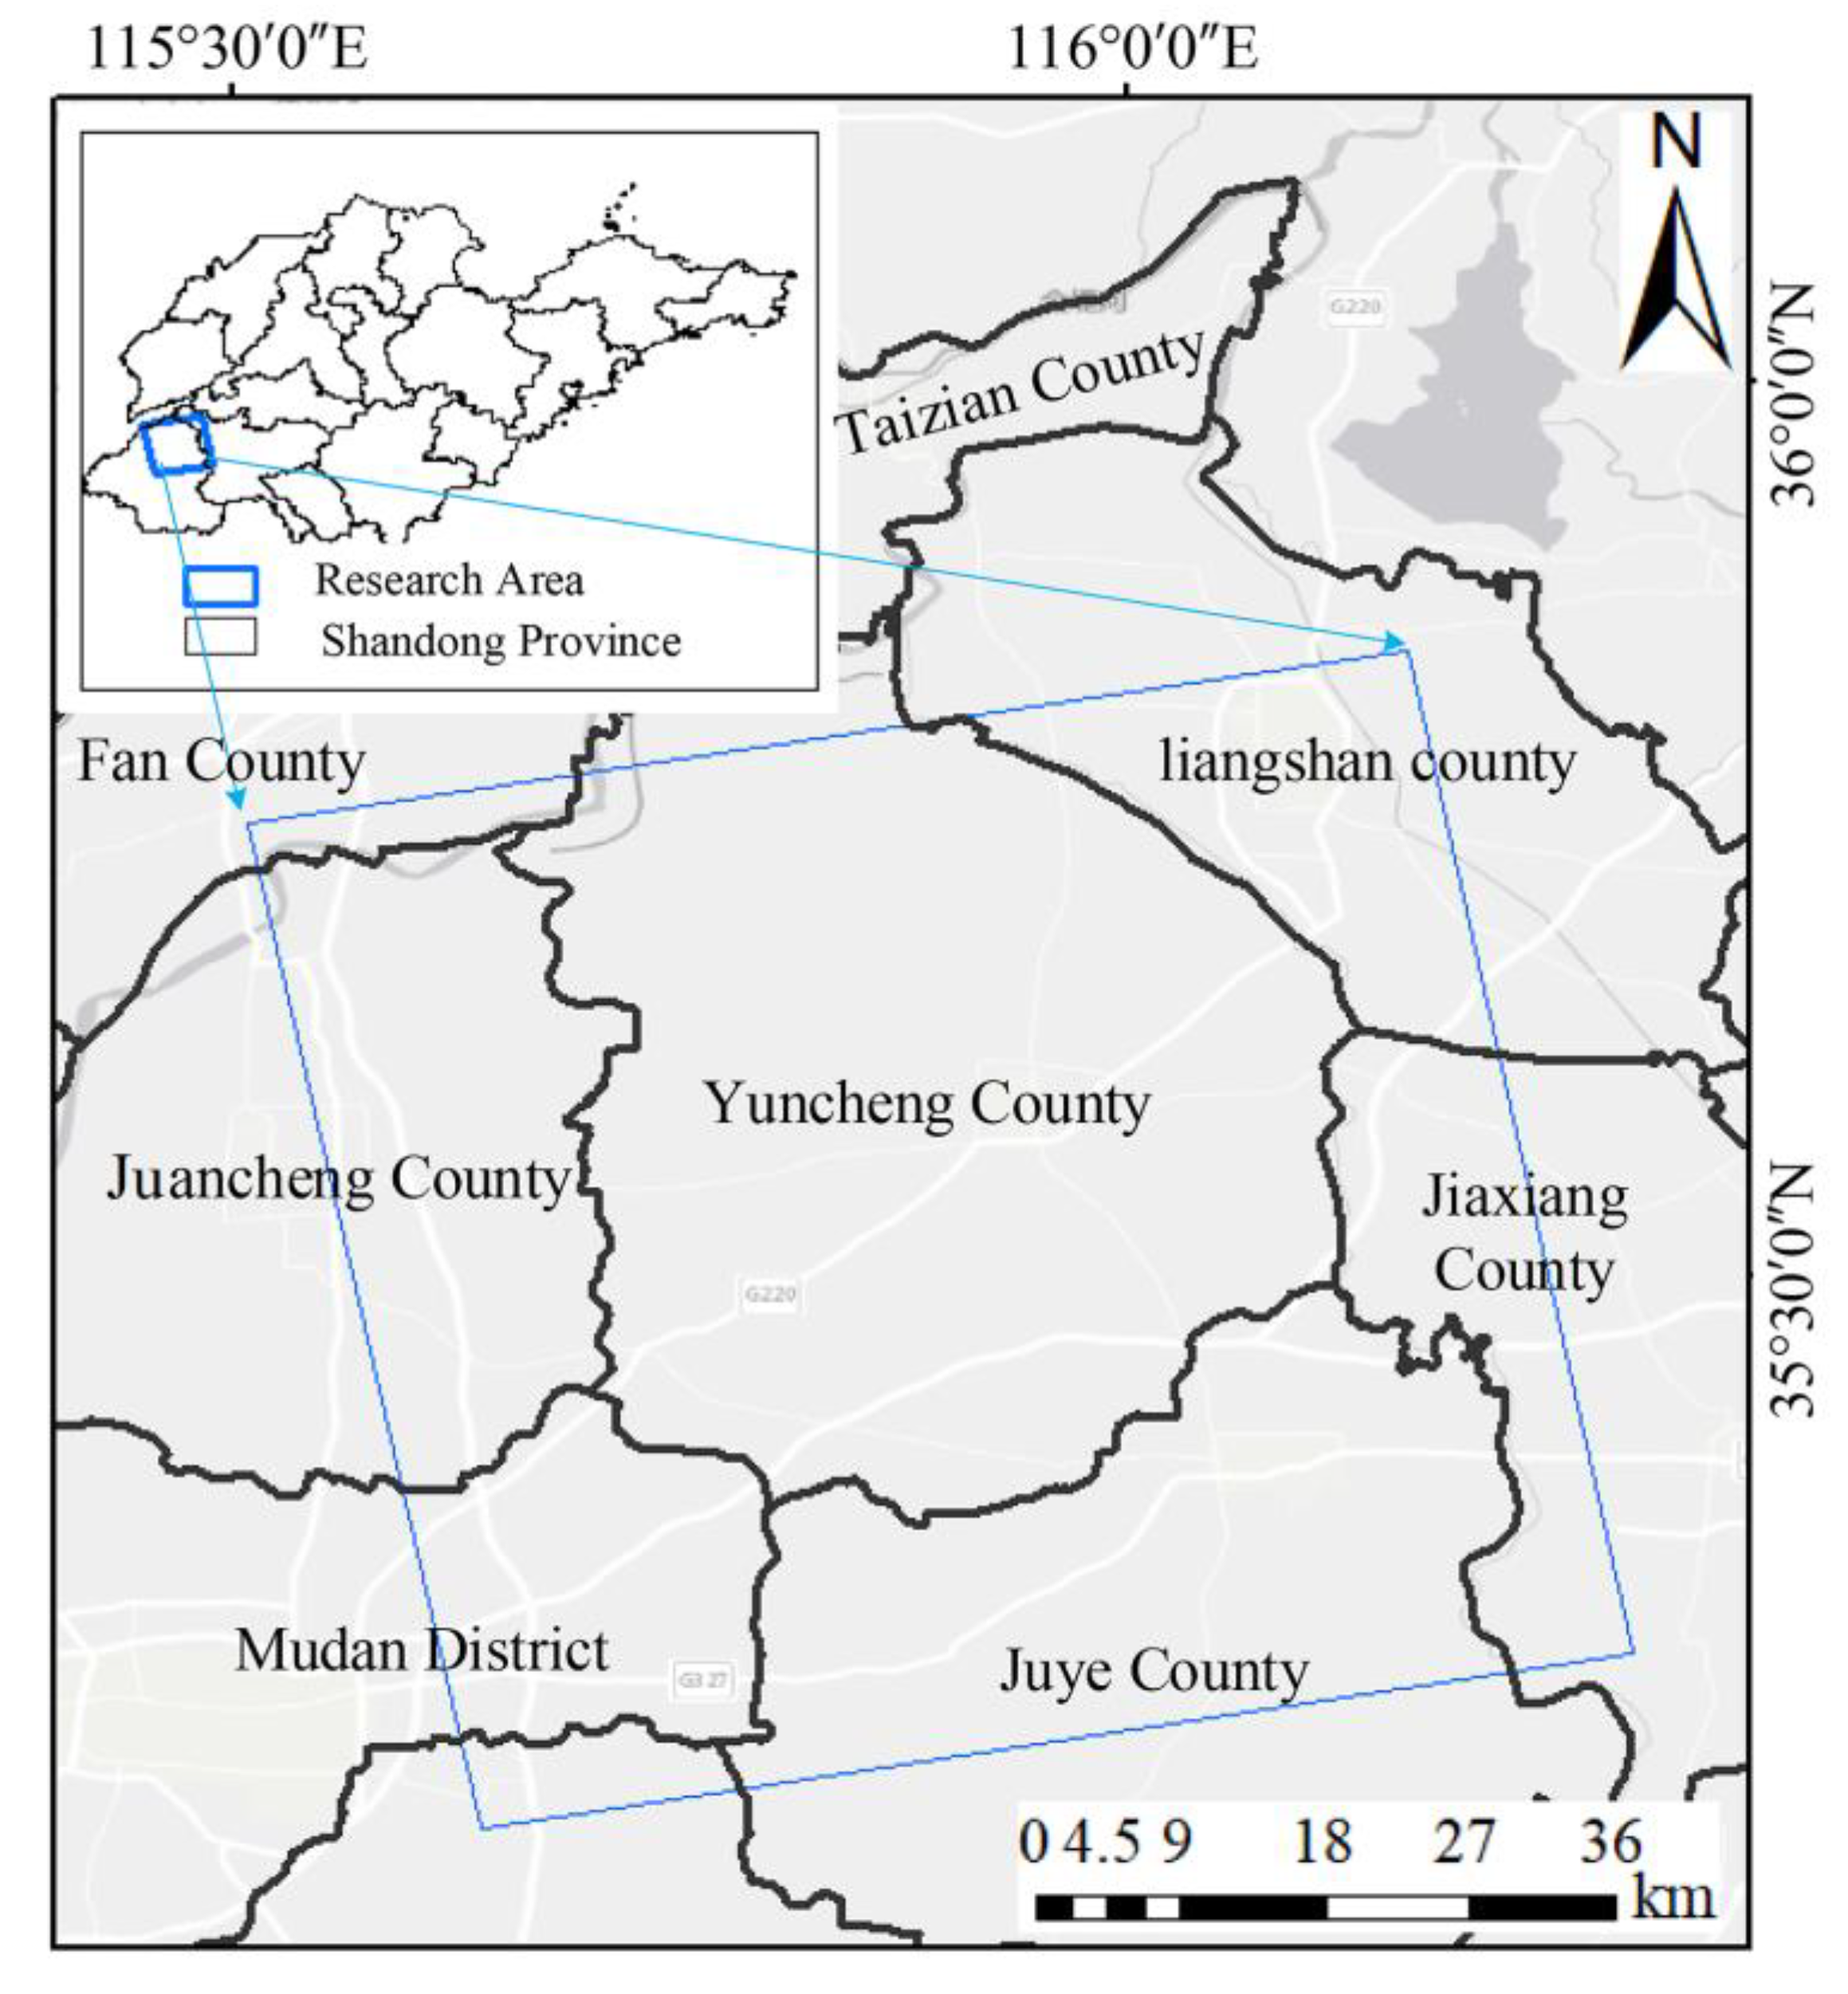
The study area was located in northern Yuncheng County, Shandong Province (35°19′~35°52′ N, 115°40′~116°08′ E) (Figure 2). As a major storage place in northern China, Yuncheng County is rich in coal reserves and contains four major coal mines, namely Lilou Coal Mine, Pengzhuang Coal Mine, Guotun Coal Mine, and Zhaolou Coal Mine, which show severe ground displacement due to extensive coal mining. The area of displacement in the ZhaoLou coal mine is approximately 11.68 km2, the area of displacement in the Guotun coal mine is approximately 13.97 km2, the area of displacement in the PengZhuang coal mine is approximately 9.15 km2 and the area of displacement in the Yuncheng coal mine is 5.68 km2. As coal mines continue to be mined in 2017–2018, the area of the mining area is expected to further expand [26]. The geotectonic in the study area belonged to the southeast marginal hollow zone of the Shandong anteklise of the China–Korea continental shelf. The surface was fully covered by Cenozoic without outcropping of bedrock [27]. Surface coverage mainly had cultivated land, urban industries, mines, and water conservancy facilities. Mining displacement in the study area had caused some damage to cultivated lands and infrastructures like traffic and water conservation projects. Moreover, it brought serious threats to the life and property safety of local people. Hence, it is crucial to provide fast and high-efficiency monitoring of ground displacement in the study area.

3.2. Datasets

Sentinel-1 is an environmental monitoring satellite launched by ESA in 2014 as part of the Copernicus program. Sentinel-1A SAR imagery can be used to provide monitoring data on land, sea, and atmosphere, providing Strip Map (SM), Interferometric Wide Swath (IW), Extra Wide Swath (EW), and Wave Mode (WD) imaging modes. The IW mode uses terrain observation with progressive scans SAR (TOPSAR) to acquire 3 sub-bands, control the beam range and obtain uniform quality images, achieving a wide (250 km) coverage area while maintaining a high distance and directional resolution. Sentinel_1A SAR image can be obtained from the ESA website. In this study, 25 SAR images of Yuncheng County, Heze City under Sentinel-1A satellite IW mode and VV polarization mode were collected from 20 May 2017 to 17 December 2018, and their specific parameters are shown in Table 1.

3.3. Data Processing

To illustrate the reliability of the method in this paper for ground displacement monitoring, the paper uses the conventional time-series InSAR techniques (PS-InSAR technique and SBAS-InSAR technique) and the method proposed in this paper to process the SAR images covering the study area. The data are processed mainly using GAMMA_2021 software for the interferogram generation, DSIpro_v2.0 software for the homogeneous selection and phase optimization, and StaMPS_4.1b1 software for the CPs selection and integration.
Firstly, the GAMMA_2021 software was used to obtain the differential interferograms after the Sentinel 1A single look complex SAR images have been acquired, including data import, registration, and interferometry. During the PS-InSAR data processing, the SAR image of 28 March 2018 was selected as the master image and the other images as slave images while being aligned with the master image. The maximum value of the time baseline was 312 days. The longest spatial baseline was 120 m and the shortest was 9.5 m, generating a total of 24 pairs of interference pairs. The spatiotemporal baseline connection map is presented in Figure 3a. During the SBAS-InSAR data processing, the temporal baseline threshold was set to 80 d and the spatial baseline threshold was set to 80 m. Each image was limited to a maximum of 5 sets of interferograms with other images, resulting in the acquisition of 48 sets of differential interferometric pairs. The spatiotemporal baseline connection map is presented in Figure 3b. Based on this relationship, the coordinate transformation and resampling between the master and slave images were carried out to increase the registration precision to 1/8 pixels [28]. The precision orbital data provided by European Space Agency (ESA) was used for precise orbital estimation and flat earth effect removal in interference avoidance [29]. Additionally, the 30-resolution SRTM DEM data were used for geocoding and topographic phase compensation [30].
Secondly, the StaMPS_4.1b1 software [31] was used to obtain to select PS points and SDF points from the single master and multi-reference interferograms, and the amplitude departure threshold was set to 0.4 and 0.6, respectively. Furthermore, the integrated PS/SBAS phases can be obtained by using the ps_sb_merge function after selection of PS and SDF points.
Thirdly, the FaSHPS algorithm based on the SHP_SelPoint function from DSIpro_v2.0 software [32,33] was used to select homogeneous points from the differential interferogram obtained based on a single master interferograms, and the significance level was 5% for a 11 ×11 experimental window. After homogeneous selection, the covariance matrix estimation algorithm based on the AdpCohEst function was used for homogeneous phase optimization and to obtain the phase-optimized differential interferograms, reducing phase noise and improving coherence values. Then, the DS points with good coherence and high SNR were selected after the phase-optimized differential interferograms were introduced into StaMPS_4.1b1 software. Afterwards the DS points and PS/SDF points were integrated in the same way as the integration of the PS points and SDF points.

4. Results

4.1. Ground Displacement Monitoring Result

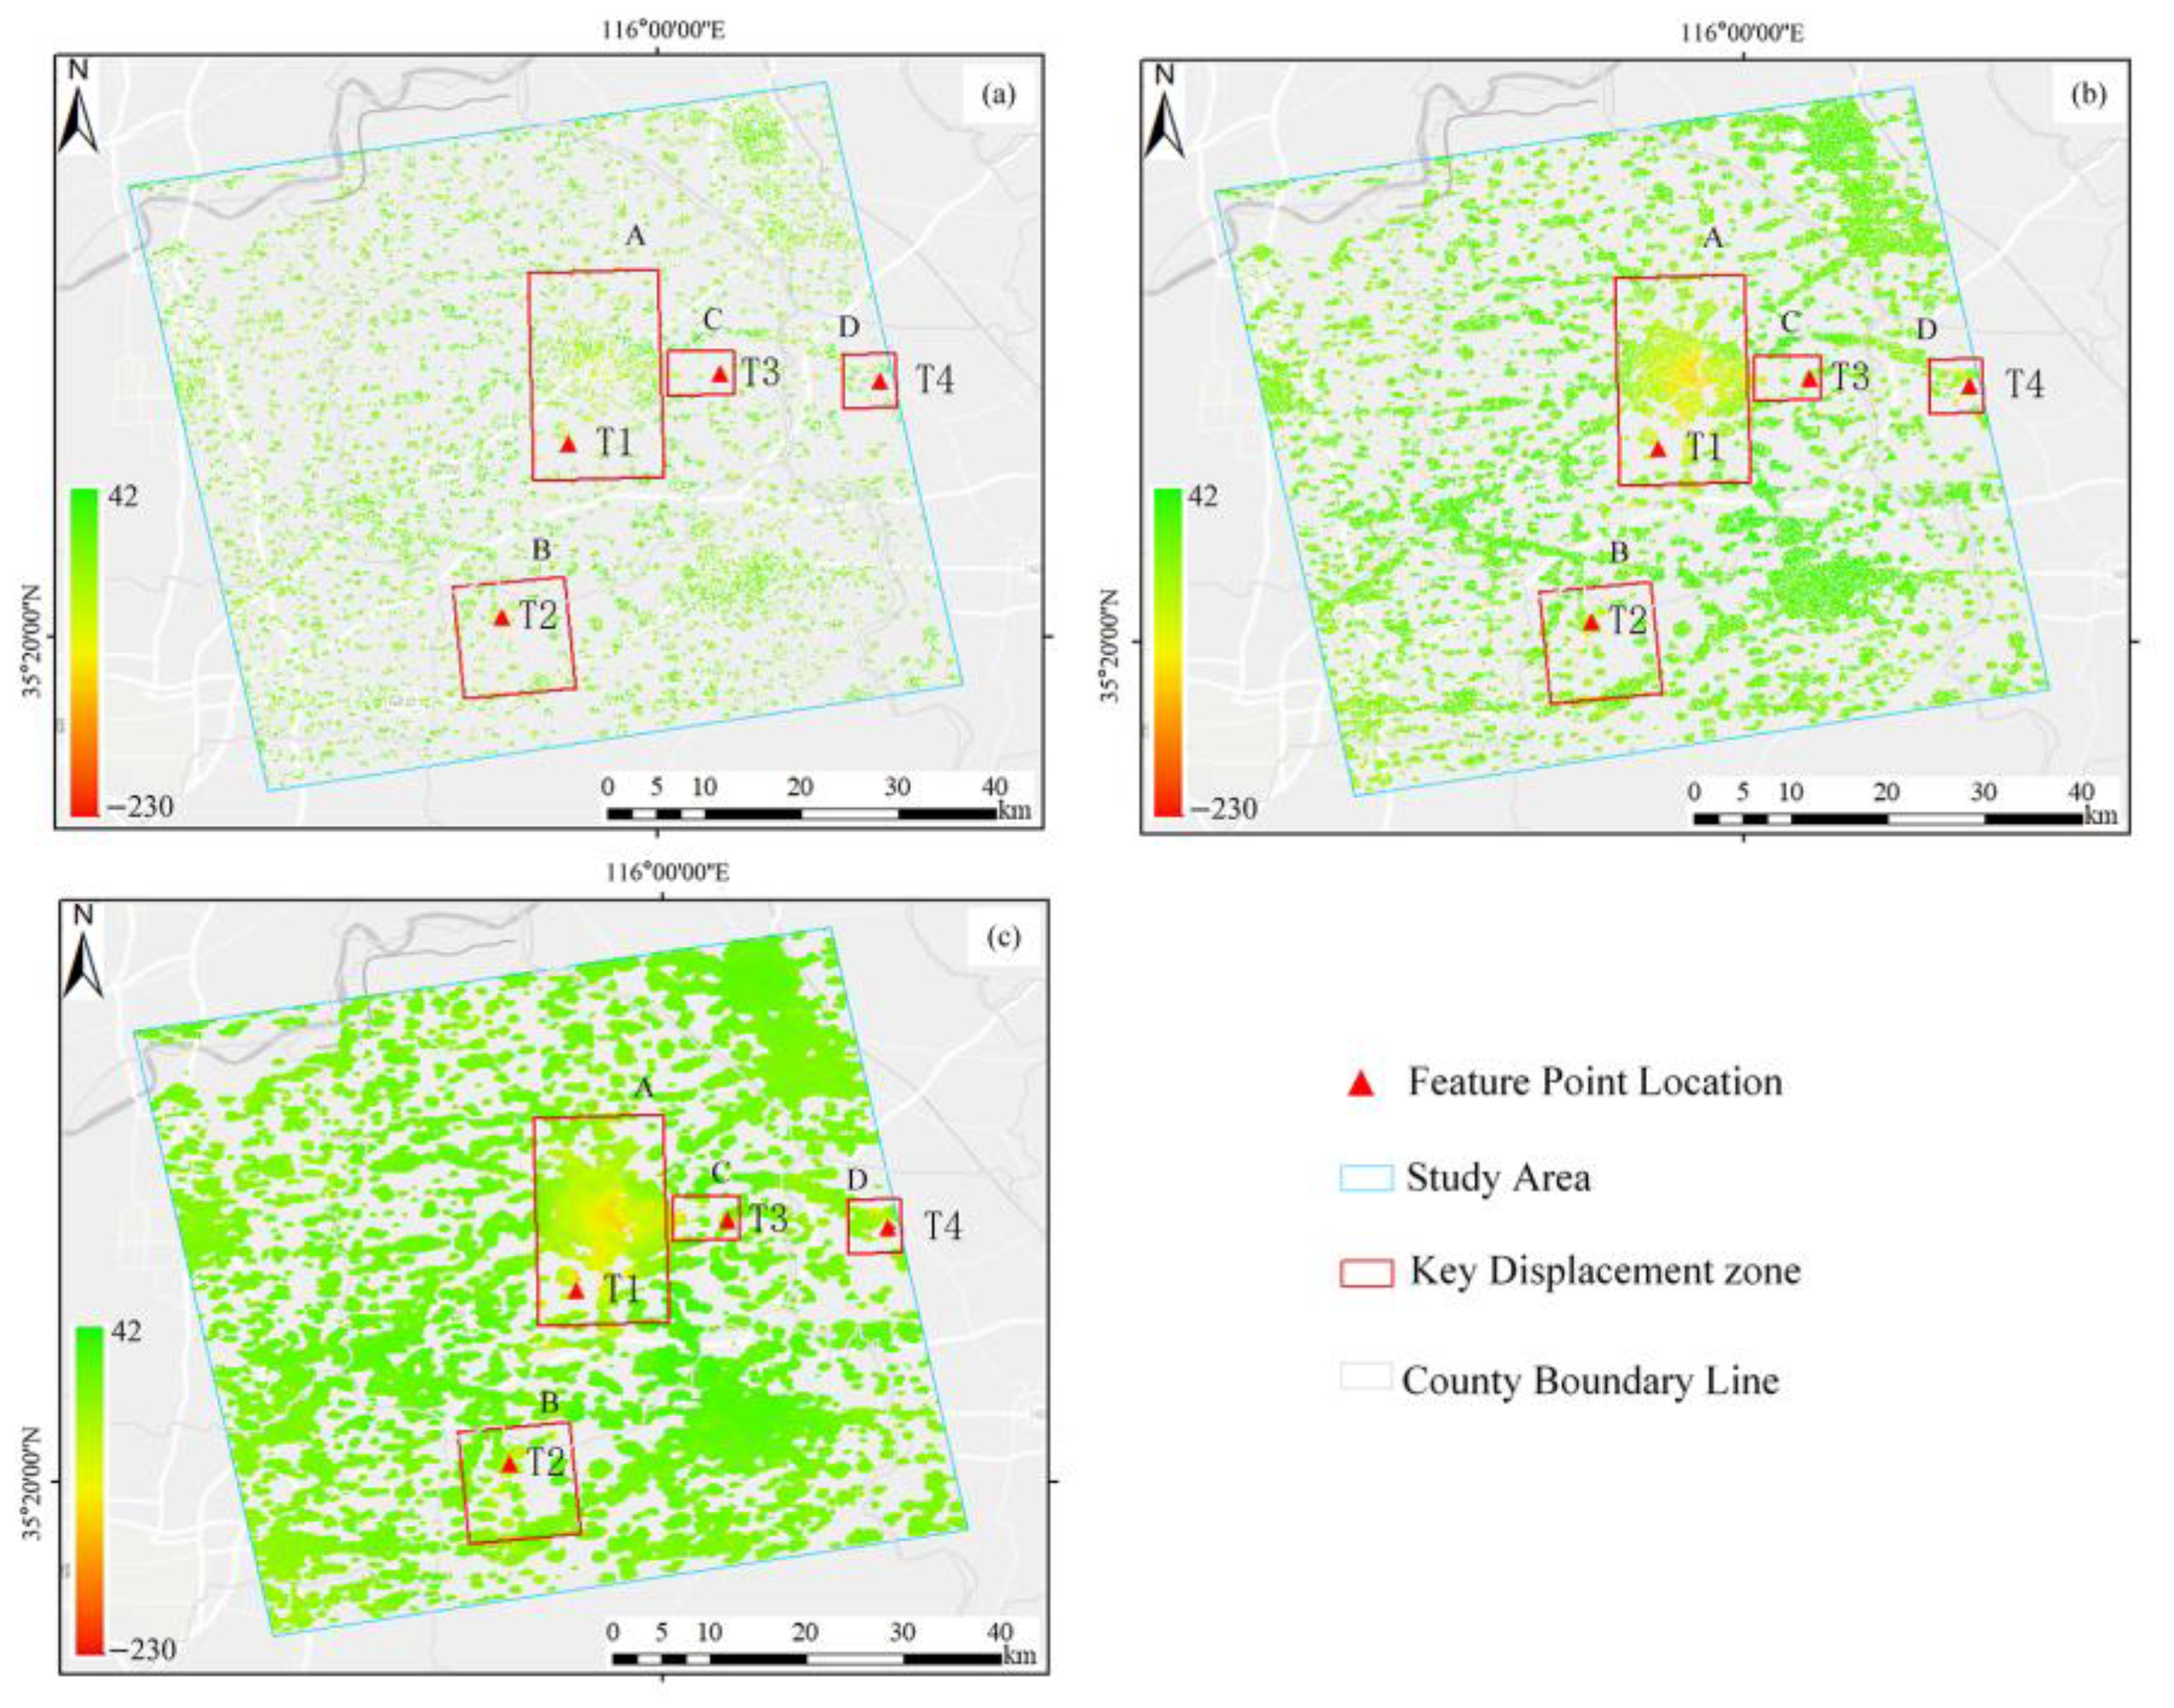
After processing the data as described above, the average velocity of ground displacement of the methods (PS-InSAR, SBAS-InSAR, and the proposed method) in the study area were obtained and the results are shown in Figure 4. The average velocity of ground displacement from May 2017 to December 2018 was −186 mm/year–41 mm/year, −206 mm/year–31 mm/year, and −230 mm/year–28 mm/year, determined by the PS-InSAR method, the SBAS-InSAR method, and the proposed method, respectively. All four methods could acquire positions of ground displacement in the study area effectively and there were four subsidence areas (shown as red wireframes in Figure 4) of A, B, C, and D in the study area. The ground displacement monitoring results in the four areas are shown in Figure 5. The A subsidence zone mainly covers the southern side of the Li Lou coal mine and the northern area of the Guo Tun coal mine, the two coal mines are connected to form a subsidence area, which mainly includes Che Lou village, Wang Lou village and Guo Tun town. As the Guotun mine continued to be mined, the extent of ground displacement gradually presented a south-westerly trend. The B subsidence zone is located in the Zhao Lou coal mine, and the area covers Tangmiao town. During the study period, the coal mines in the area were at the beginning of their mining, showing a certain distribution of displacement and the velocity of displacement was relatively small. The C subsidence zone is located in Pengzhuang coal mine, within the villages of Chenhekou and Zhangguantun. There are two working faces where mining started in early 2018; as coal mining continues, the ground displacement is gradually increasing; the area has a large ground displacement velocity. The D subsidence zone is the Liangbaosi Mine, located in the town of Liangbaosi, which presents a small area of ground displacement. As shown in Figure 4 and Figure 5, the results of the ground displacement monitoring are becoming more and more evident as the density of CPs increases by integrating DS InSAR techniques and conventional time series InSAR techniques. The results show that different methods will obtain different densities of CPs, which will have an impact on the ground displacement monitoring results, where the higher density the better ability to identify the ground displacement monitoring results.

4.2. Time Series Analysis of Ground Displacement

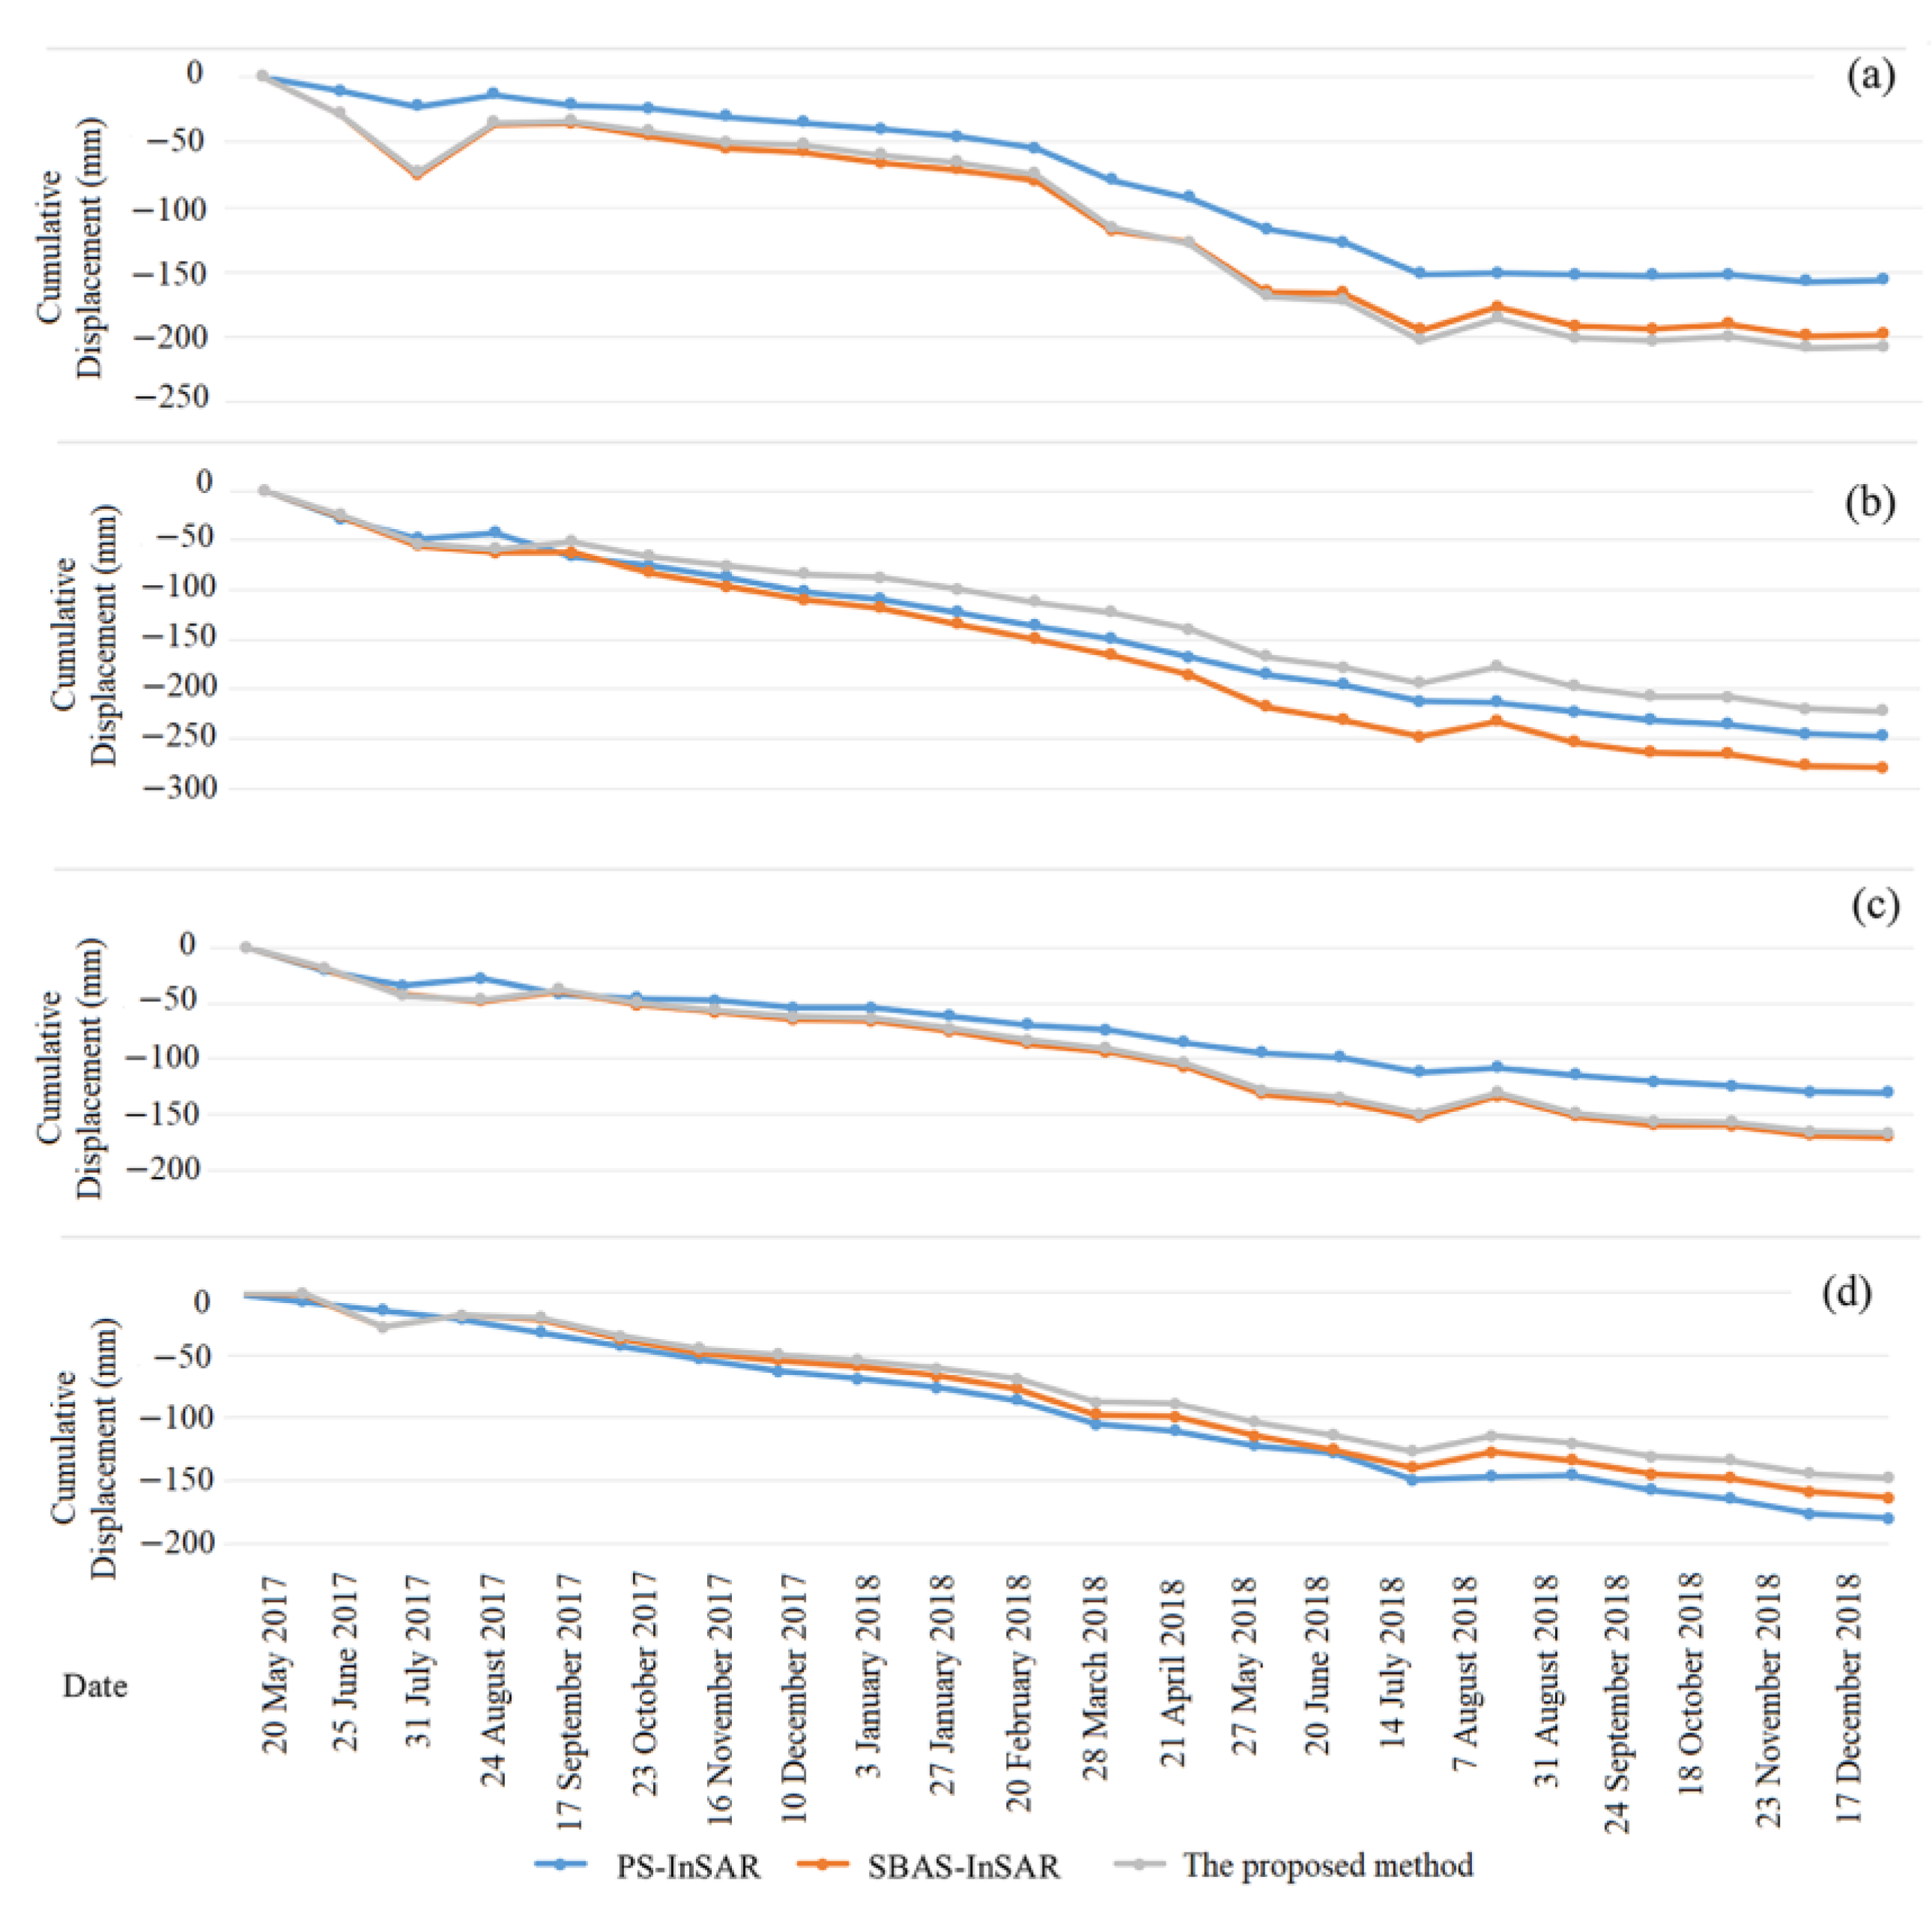
The center points (as the red triangles shown in Figure 4) of four subsidence zones were chosen from the results of three methods, as the characteristic points for time series analysis of ground cumulative displacement volume. The details at four characteristic points are shown in Figure 6. The maximum cumulative displacement values from three methods are variable at four characteristic points and the time series trends are not identical. As shown in Figure 6, T1 presented an approximately linear variation trend with passing time and the initial displacement was relatively small. With the increase in exploitation quantity of the mining at the beginning of 2018, the displacement volume increased gradually, which presented continuous displacement. After August 2018, T1 became stable. For T2, until August 2018, the trend of the displacement was almost identical to that of T1, with the difference that thereafter and T2 increased gradually, which presented continuous displacement. The displacement state from T3 was followed by an uplift of foundation at the beginning and then presented in the continuous displacement state. The velocity of ground displacement at T4 was high before August 2018 and then decreased. In general, the overall trends of four characteristic points in the three methods were consistent. This indicates that the proposed method is able to obtain results consistent with the conventional time-series InSAR technique in terms of time series trends of ground displacement.

5. Discussion

5.1. Comparative Analysis in the Quantity of CPs

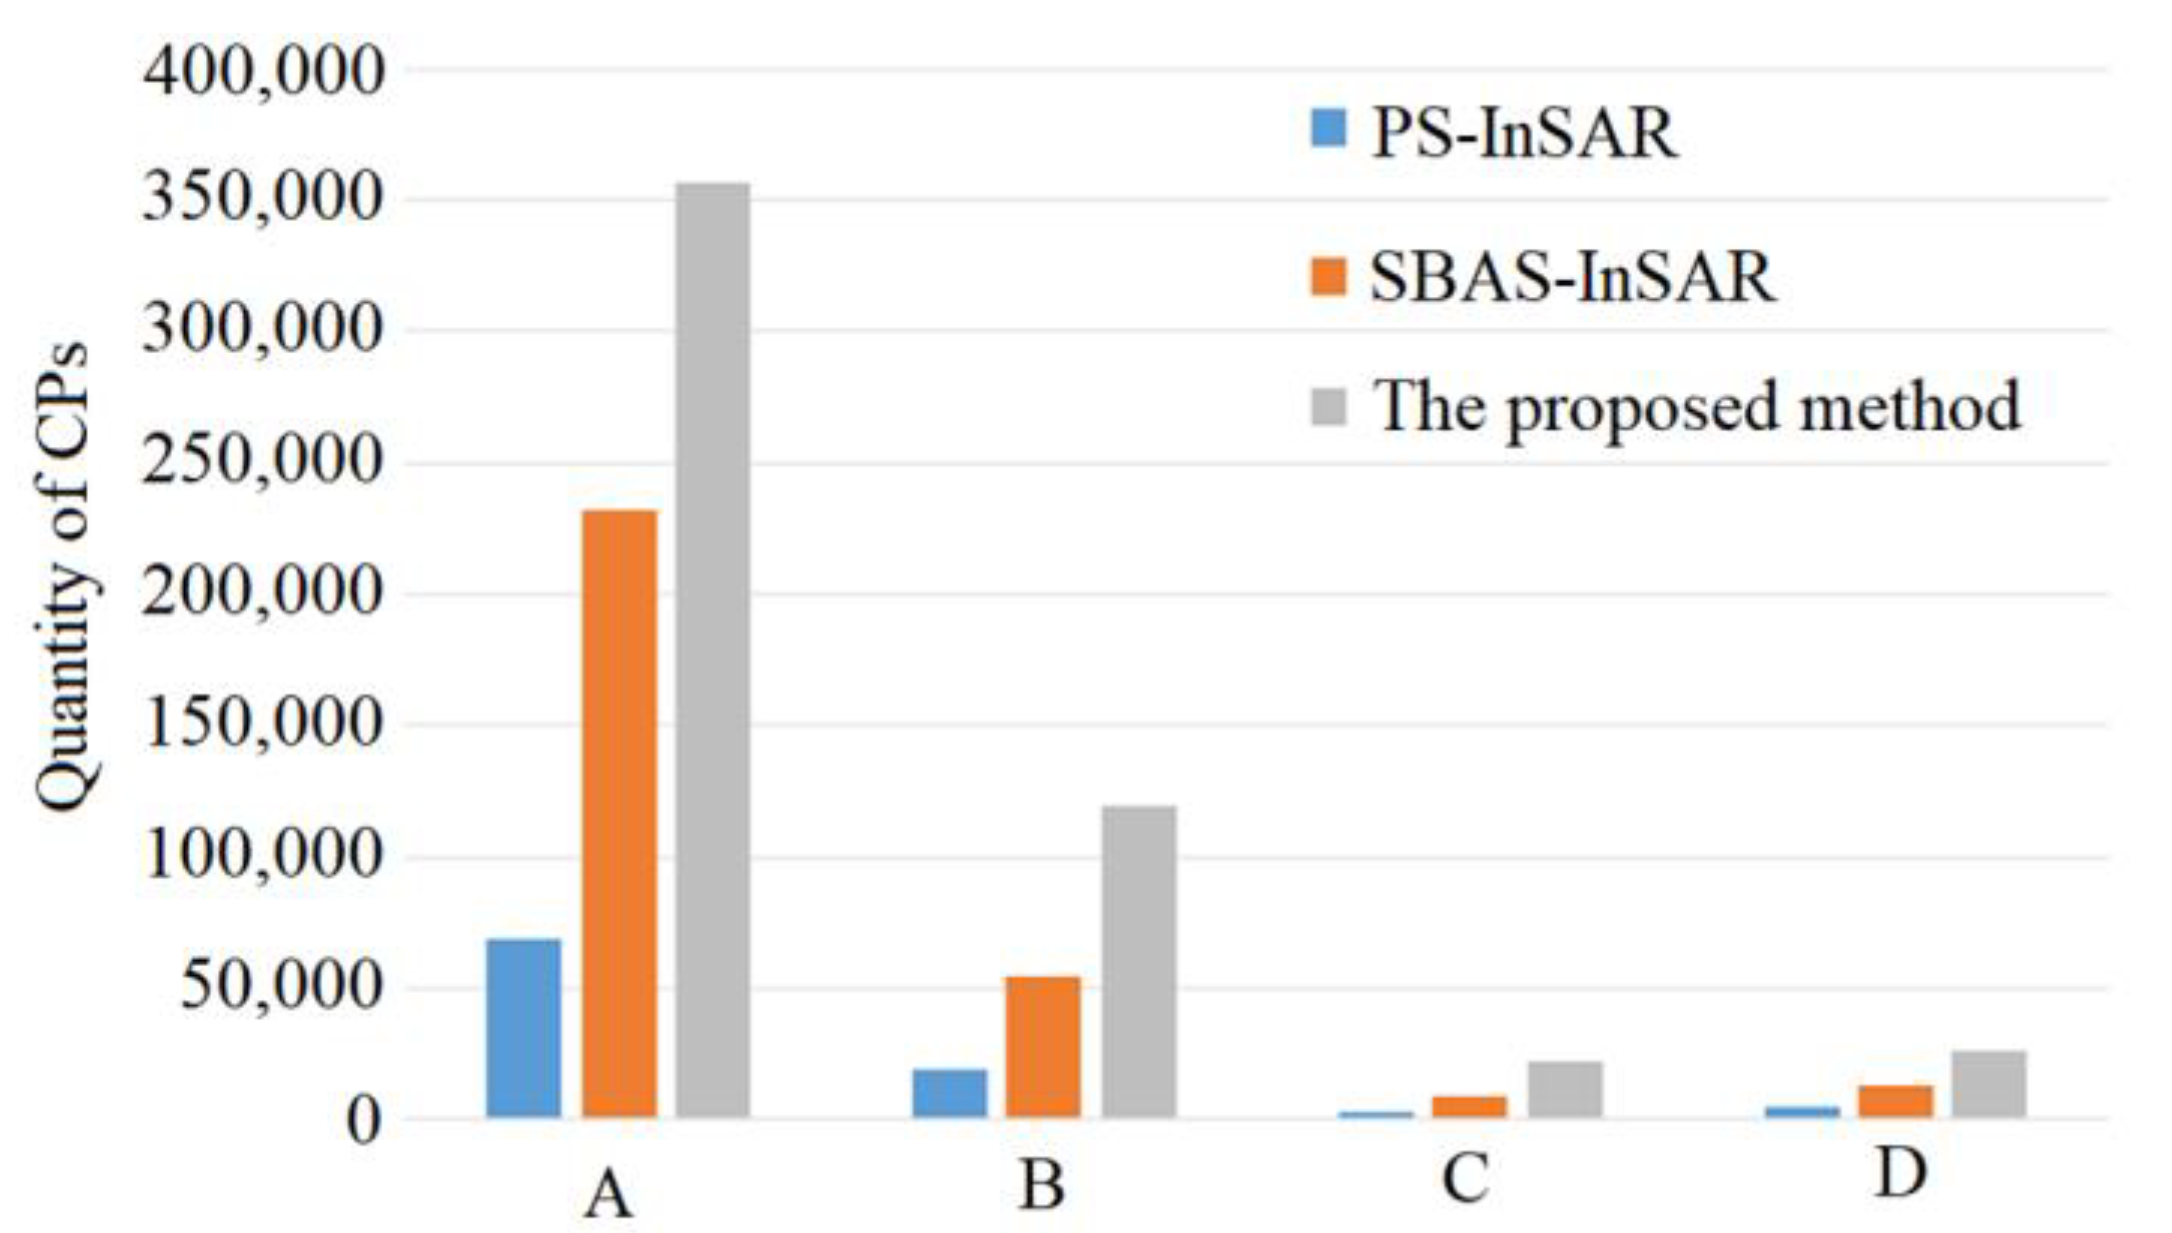
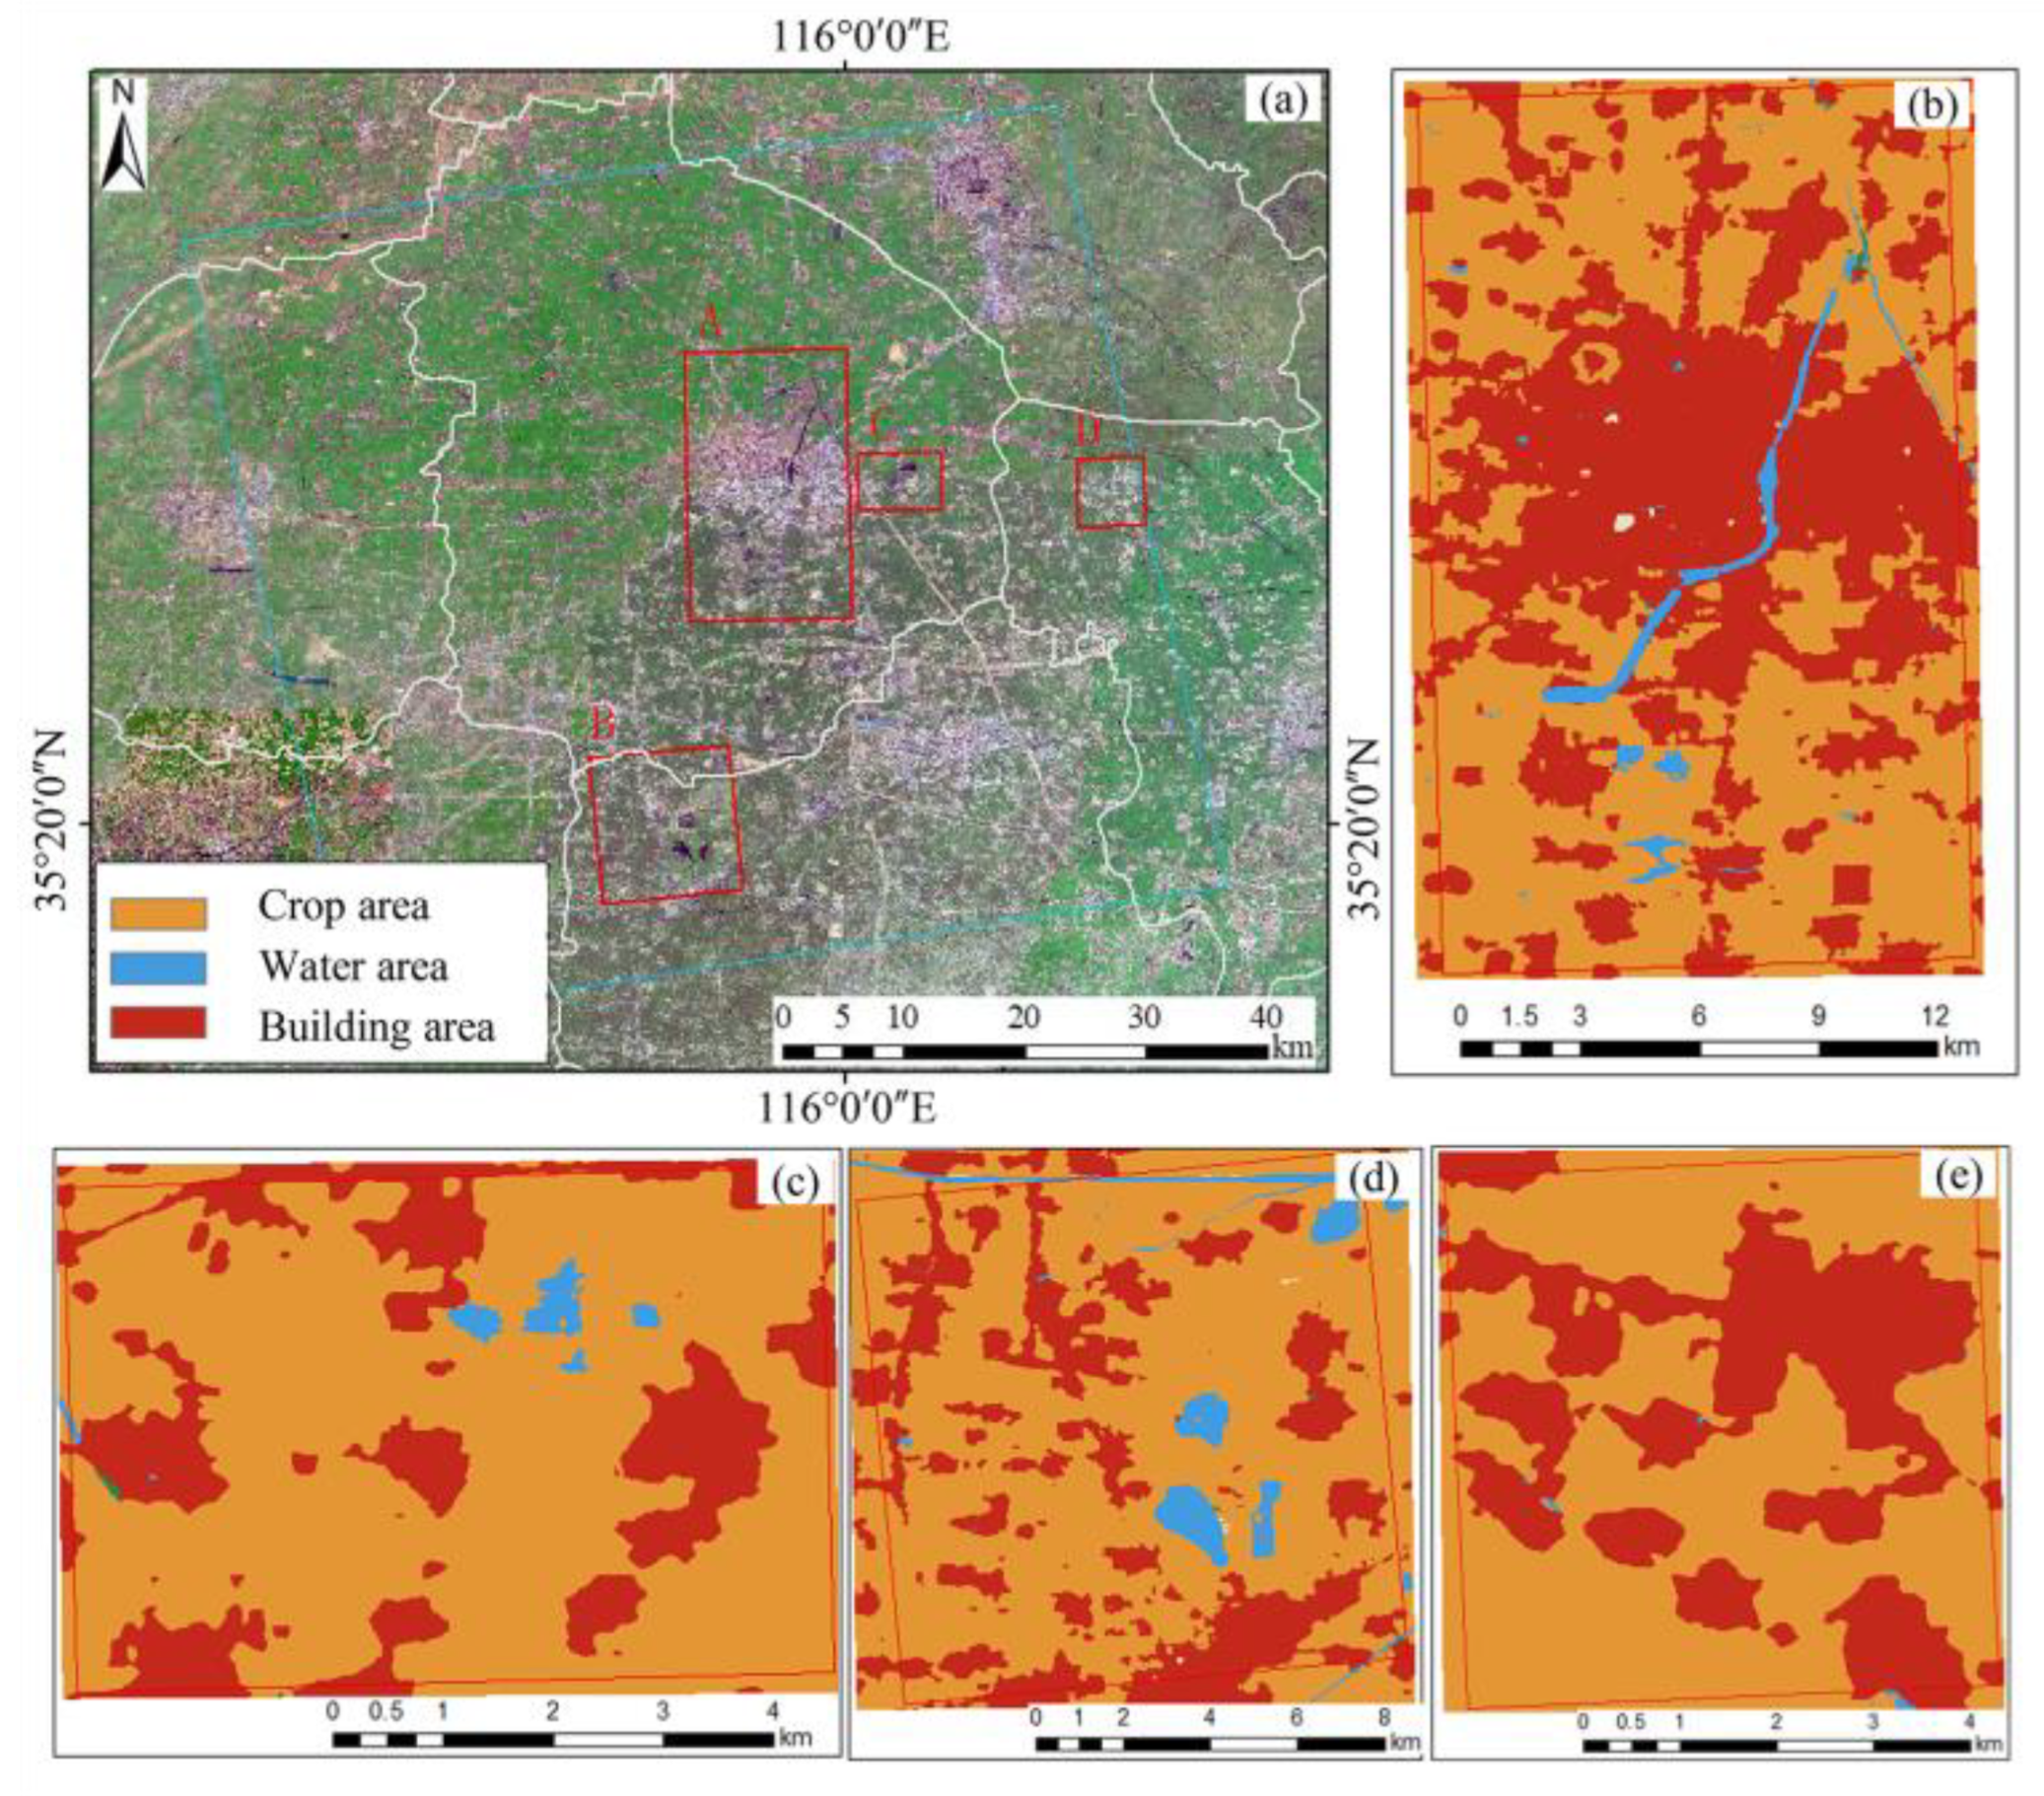
In order to further explore the capability of the proposed methods for monitoring ground displacement in mining areas, a comparative analysis was conducted for the results in four key subsidence zones obtained by the three methods shown in Figure 6. The quantity of CPs in four key subsidence zones were statistically counted, as shown in Figure 7 and Table 2. It can be seen that the quantity of CPs obtained by the proposed method is significantly more than the conventional time-series InSAR method. Furthermore, combined with the land use and feature classification dataset [34,35], the points distribution in the four zone was analyzed. According to the dataset of the study area, the land use within the study area is mainly divided into three categories, crops, water bodies, and buildings, as shown in Figure 8. The displacement distribution results obtained by the PS-InSAR technique in four zones are mainly concentrated in the building distribution area, while the mining area is mainly dominated by low vegetation (crops) [36], making the image low coherence and, therefore, the quantity of points selected by the PS-InSAR technique is low. SBAS-InSAR technique maintains SAR image coherence with short spatial and temporal baselines [37], covers a range of non-building areas in addition to the building areas where the PS points are distributed, with an increased point density compared to PS-InSAR. And the proposed method, in addition to the points obtained by the first two methods, includes DS points with low coherence requirements [16], resulting in the highest density of points obtained by the proposed method among the three methods. Therefore, the method proposed in this paper is able to acquire more CPs for mining areas where low vegetation is the dominant feature, contributing to more detailed accompanying results in the displacement and more obvious displacement range.

5.2. Comparative Analysis on the Average Velocity of Ground Displacement

To thoroughly analyze the capacity for ground displacement monitoring of the three methods, statistical analyses on monitoring results of the PS-InSAR, SBAS-InSAR, and the proposed method in A, B, C, and D zones were carried out as shown in Figure 9 and Table 3. In the first place, as shown in Figure 9, the range of average velocity of ground displacement obtained by the three methods is variable. According to the previous analysis, the quantity of CPs obtained by different methods is different, indicating that the quantity of CPs affects the range of values for ground displacement monitoring [38]. Furthermore, according to the “Ground Subsidence Preventive Plan of Shandong Province 2012–2020” and the “Ground Subsidence Interferometric Radar Data Processing Technical Regulations”, the displacement value lower than −20 mm/year was determined as the displacement state (shown as red wireframes vertical line in Figure 9) and the increase in the quantity of CPs with the average velocity of ground displacement less than 20 mm from the proposed method compared to conventional method was estimated, as shown in Table 3. The results show that the proposed method has improved the quantity of CPs in areas with large displacement (<−20 mm/year), indicating that the proposed method provide a more comprehensive displacement and also in areas with large displacement, which is very evident in A and D zones relative to PS-InSAR technique (the increase in the total CPs relative to PS-InSAR is 5.1 and 5.3 as shown in Table 2, while the increase in the CPs < −20 mm/year is 15.1 and 17.47 as shown in Table 3). Consequently, the proposed method is able to acquire more CPs in areas with large displacements, providing more informative information about the ground displacement.

5.3. Correlation Analysis

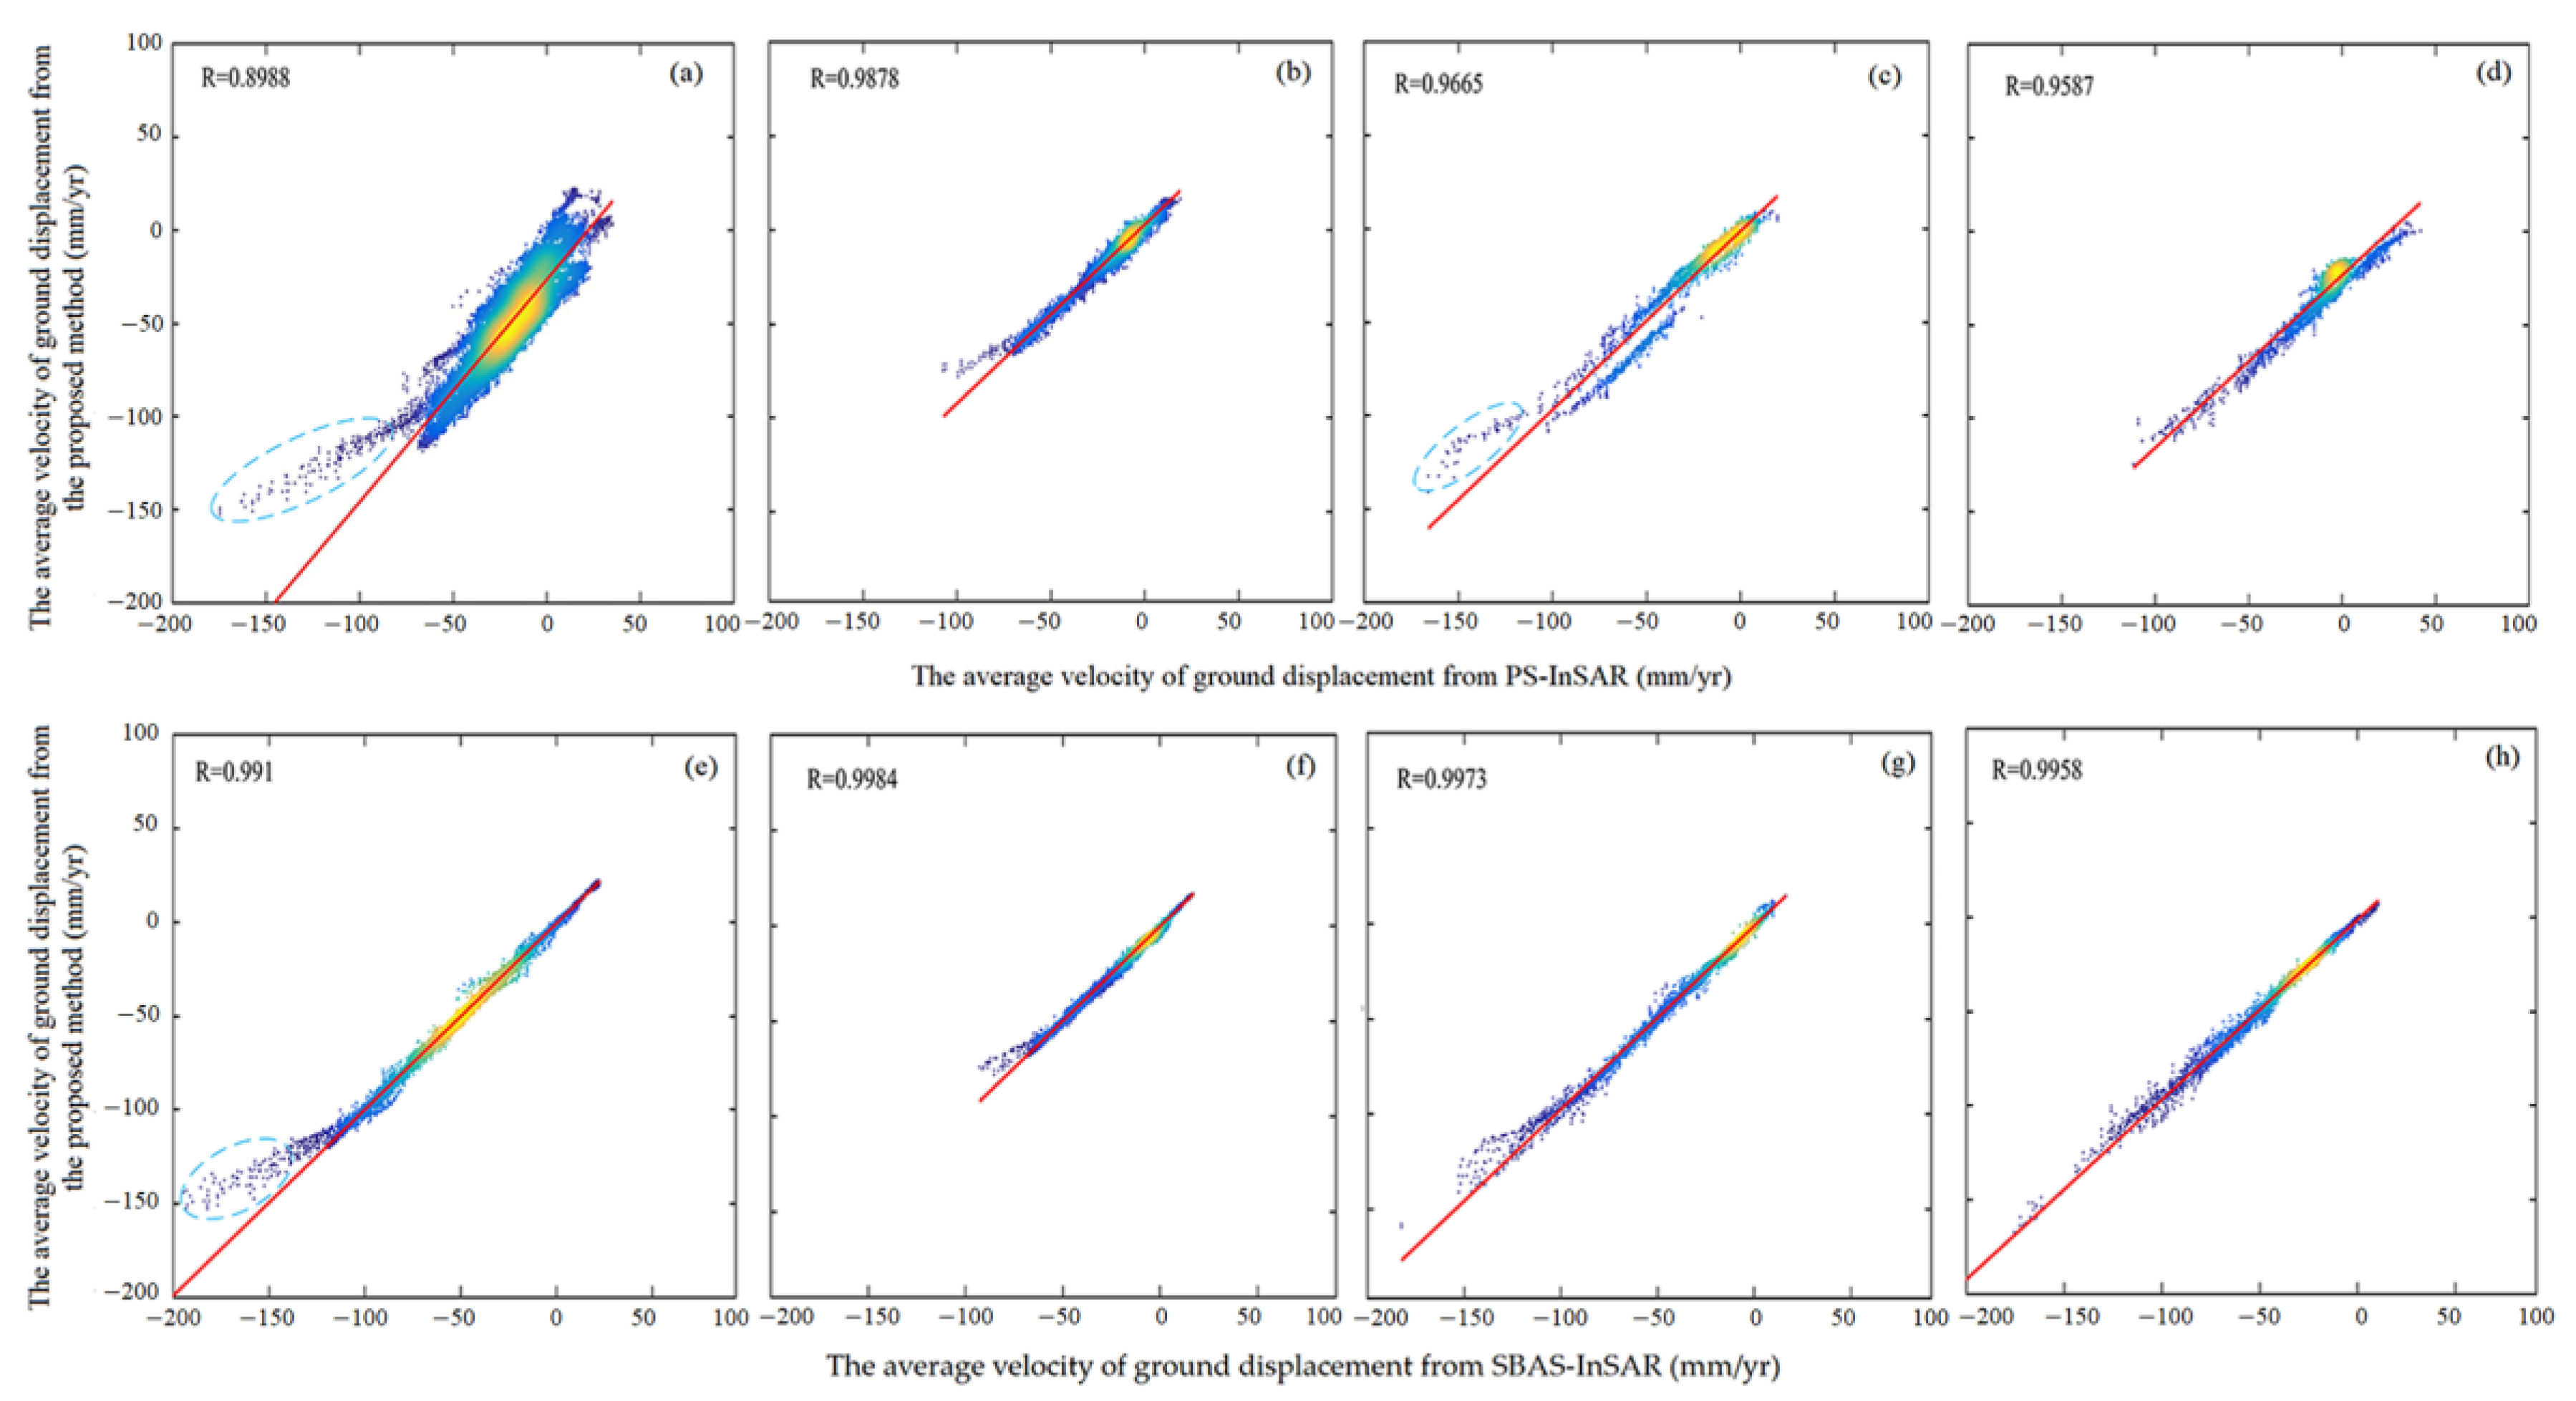
By acquiring corresponding points of three methods in the four zones, a comparative analysis of the correlation between the proposed method and conventional methods were carried out, as shown in Figure 10. According to the comparative results from PS-InSAR and the proposed method shown in Figure 10a–d, the correlation was poor in the blue curved circles in Figure 10a,c. The mainly reason is that the PS-InSAR technique is a single-master-based interferometric method, there are some interferograms with a large spatio-temporal baseline in this method relative to the multi-master-based interferometric method (the interferometric method in this paper that combined multiple techniques), which consequently affects the coherence [39]. Additionally, the long-time scale contains a much larger displacement, resulting in poor coherence of the interferogram. In contrast, the proposed method in this paper can obtain a sufficient quantity of CPs including regions with large displacement, which leads to a certain degree of difference in the correlation between the two methods in regions with large displacement. Considering the results of the correlation analysis with SBAS shown in Figure 10e–h, the overall correlation was higher in all four zones compared with that from PS-InSAR (as the correlation coefficient R from SBAS-InSAR is 0.991, 0.9984, 0.9973, and 0.9958 for A, B, C, and D zones shown in (e–h), respectively, greater than 0.8988, 0.9878, 0.9665, and 0.9587 for A, B, C, and D zones shown in (a–d) from PS-InSAR). The main reason is that SBAS sets a spatio-temporal baseline threshold to ensure the coherence of the interferometric pair while avoiding the inclusion of large-magnitude displacement due to the wide time span of the interferometric pair. It can eliminate the errors caused by spatio-temporal decoherence to a certain extent and can obtain higher CPs in large displacement regions. The proposed method is also able to obtain sufficient CPs for large shape variables. Therefore, the correlation between the two methods can be consistent. However, there is a poor correlation for some points with large displacements in A zone (blue curve circles in Figure 10e). The region mainly covering the town area, where a large quantity of PS points with stable scattering characteristics can be obtained with high coherence (high coherence of PS points in dense building areas), and this can lead to high proportion of PS point phase values in the integrated phase values, resulting in an underestimation of large displacement. In general, the displacement monitoring accuracy obtained by the proposed method was comparable to that of the PS-InSAR and SBAS-InSAR in the region with small displacement values, whereas the proposed method was able to achieve comparable accuracy with SBAS in the large displacement region. In terms of displacement magnitude monitoring capability, this method is able to obtain results that are closer to those of SBAS-InSAR technique.

6. Conclusions

The integration of PS/SDF/DS based on SNR time-series InSAR was applied to monitor ground displacement in a coal mine in Heze City from 20 May 2017 to 17 December 2018. The experimental results showed that there were four significant areas of subsidence in the study area. Furthermore, the monitoring results of the proposed method were compared to conventional PS-InSAR and SBAS-InSAR methods for verification. Some major conclusions could be drawn as below:
(1)
Different InSAR techniques are used for ground displacement monitoring and different quantity of CPs are acquired, the different quantity of CPs lead to different displacement monitoring results (different ranges of displacement values), and the abundance of ground displacement information contained in different displacement value ranges varies.
(2)
Compared with the conventional time-series InSAR technique, the ground displacement monitoring results obtained by the proposed method have a wider range of values and provide a more comprehensive and refined presentation of ground displacement monitoring results.
(3)
The quantity of CPs and the density of spatial distribution obtained by the method proposed in this paper are significantly improved compared to the conventional time-series InSAR technique.
(4)
The displacement monitoring results from the proposed method is consistent with conventional time-series InSAR techniques in terms of displacement trends and distribution and more comparable to SBAS-InSAR in terms of displacement magnitude.

Author Contributions

Z.W., W.L. (Wenhui Li) and Y.Z. performed the experiments and produced the results. Z.W., W.L. (Wenhui Li) and A.J. drafted the manuscript. T.Z., Q.G., W.L. (Wanqiu Li), Y.C. and X.R. contributed to the discussion of the results. All authors have read and agreed to the published version of the manuscript.

Funding

This work is supported by the Shandong Provincial Natural Science Foundation (ZR2020QD049, ZR2022QD025 and ZR2021QD155), State Key Laboratory of Geodesy and Earth’s Dynamics, Innovation Academy for Precision Measurement Science and Technology, CAS, Wuhan 430077, China (SKLGED2023-1-1), the Doctoral Scientific Research Foundation of Shandong Jianzhu University (X18097Z).

Institutional Review Board Statement

Not applicable.

Data Availability Statement

The SAR image data used in this paper can be freely accessed at: https://scihub.copernicus.eu/ (accessed on 3 April 2014). The land use classification data can be freely accessed at: https://livingatlas.arcgis.com/landcover/(accessed on 10 February 2022).

Acknowledgments

The authors would like to express their gratitude to the European Space Agency (ESA) and Environmental Systems Research Institute (ESRI) for providing the data for this study. The provisions of GAMMA by GAMMA Remote Sensing AG, StaMPS by Stanford University and DSIpro by Sun Yat-sen University are also gratefully acknowledged.

Conflicts of Interest

The authors declare no conflict of interest.

References

  1. Wu, Q.; Tu, K.; Zeng, Y. Research on China’s energy strategic situation under the carbon peaking and carbon neutrality goals. Chin. Sci. Bull. 2023, 68, 1884–1898. [Google Scholar]
  2. Cuenca, M.C.; Hooper, A.J.; Hanssen, R.F. Surface deformation induced by water influx in the abandoned coal mines in Limburg, The Netherlands observed by satellite radar interferometry. J. Appl. Geophys. 2013, 88, 1–11. [Google Scholar] [CrossRef]
  3. Zheng, M.; Deng, K.; Fan, H.; Du, S. Monitoring and Analysis of Surface Deformation in Mining Area Based on InSAR and GRACE. Remote Sens. 2018, 10, 1392. [Google Scholar] [CrossRef] [Green Version]
  4. Wang, L.; Deng, K.; Zheng, M. Research on ground deformation monitoring method in mining areas using the probability integral model fusion D-InSAR, sub-band InSAR and offset-tracking. Int. J. Appl. Earth Obs. Geoinf. 2020, 85, 101981. [Google Scholar] [CrossRef]
  5. Shi, M.; Yang, H.; Wang, B.; Peng, J.; Gao, Z.; Zhang, B. Improving Boundary Constraint of Probability Integral Method in SBAS-InSAR for Deformation Monitoring in Mining Areas. Remote Sens. 2021, 13, 1497. [Google Scholar] [CrossRef]
  6. Zhu, S.; Zuo, X.; Shi, K.; Li, Y.; Guo, S.; Li, C. Surface Subsidence Monitoring in Kunming City with Time-Series InSAR and GNSS. Appl. Sci. 2022, 12, 12752. [Google Scholar] [CrossRef]
  7. Vanicek, P.; Castle, R.O.; Balazs, E.I. Geodetic leveling and its applications. Rev. Geophys. 1980, 18, 505–524. [Google Scholar] [CrossRef]
  8. Zhang, W.; Shi, J.; Yi, H.; Zhu, Y.; Xu, B. Underground Goaf Parameters Estimation by Cross-Iteration with InSAR Measurements. Remote Sens. 2021, 13, 3204. [Google Scholar] [CrossRef]
  9. Tao, Q.; Wang, F.; Guo, Z.; Hu, L.; Yang, C.; Liu, T. Accuracy verification and evaluation of small baseline subset (SBAS) interferometric synthetic aperture radar (InSAR) for monitoring mining subsidence. Eur. J. Remote Sens. 2021, 54, 642–663. [Google Scholar] [CrossRef]
  10. Maghsoudi, Y.; van der Meer, F.; Hecker, C.; Perissin, D.; Saepuloh, A. Using PS-InSAR to detect surface deformation in geothermal areas of West Java in Indonesia. Int. J. Appl. Earth Obs. Geoinf. 2018, 64, 386–396. [Google Scholar] [CrossRef]
  11. Akcin, H.; Kutoglu, H.S.; Kemaldere, H.; Deguchi, T.; Koksal, E. Monitoring subsidence effects in the urban area of Zonguldak Hardcoal Basin of Turkey by InSAR-GIS integration. Nat. Hazards Earth Syst. Sci. 2010, 10, 1807–1814. [Google Scholar] [CrossRef]
  12. Dang, V.K.; Nguyen, T.D.; Dao, N.H.; Duong, T.L.; Dinh, X.V.; Weber, C. Land subsidence induced by underground coal mining at Quang Ninh, Vietnam: Persistent scatterer interferometric synthetic aperture radar observation using sentinel-1 data. Int. J. Remote Sens. 2021, 42, 3563–3582. [Google Scholar] [CrossRef]
  13. Przyłucka, M.; Herrera, G.; Graniczny, M.; Colombo, D.; Béjar-Pizarro, M. Combination of conventional and advanced DInSAR to monitor very fast mining subsidence with TerraSAR-X data: Bytom city (Poland). Remote Sens. 2015, 7, 5300–5328. [Google Scholar] [CrossRef] [Green Version]
  14. Zhang, Z.; Wang, C.; Tang, Y.; Fu, Q.; Zhang, H. Subsidence monitoring in coal area using time-series InSAR combining persistent scatterers and distributed scatterers. Int. J. Appl. Earth Obs. Geoinf. 2015, 39, 49–55. [Google Scholar] [CrossRef]
  15. Ferretti, A.; Fumagalli, A.; Novali, F.; Prati, C.; Rocca, F.; Rucci, A. A new algorithm for processing interferometric data-stacks: SqueeSAR. IEEE Trans. Geosci. Remote Sens. 2011, 49, 3460–3470. [Google Scholar] [CrossRef]
  16. Dong, J.; Zhang, L.; Tang, M.; Liao, M.; Xu, Q.; Gong, J.; Ao, M. Mapping landslide surface displacements with time series SAR interferometry by combining persistent and distributed scatterers: A case study of Jiaju landslide in Danba, China. Remote Sens. Environ. 2018, 205, 180–198. [Google Scholar] [CrossRef]
  17. Hooper, A. A multi-temporal InSAR method incorporating both persistent scatterer and small baseline approaches. Geophys. Res. Lett. 2008, 35, L16302. [Google Scholar] [CrossRef] [Green Version]
  18. Lv, X.; Yazıcı, B.; Zeghal, M.; Bennett, V.; Abdoun, T. Joint-scatterer processing for time-series InSAR. IEEE Trans. Geosci. Remote Sens. 2014, 52, 7205–7221. [Google Scholar]
  19. Fornaro, G.; Verde, S.; Reale, D.; Pauciullo, A. CAESAR: An approach based on covariance matrix decomposition to improve multibaseline–multitemporal interferometric SAR processing. IEEE Trans. Geosci. Remote Sens. 2015, 53, 2050–2065. [Google Scholar] [CrossRef]
  20. Cao, N.; Lee, H.; Jung, H.C. A phase-decomposition-based PSInSAR processing method. IEEE Trans. Geosci. Remote Sens. 2015, 54, 1074–1090. [Google Scholar] [CrossRef]
  21. Wang, Y.; Zhu, X.X.; Bamler, R. Retrieval of phase history parameters from distributed scatterers in urban areas using very high resolution SAR data. ISPRS J. Photogramm. Remote Sens. 2012, 73, 89–99. [Google Scholar] [CrossRef] [Green Version]
  22. Jiang, M.; Miao, Z.; Gamba, P.; Yong, B. Application of Multitemporal InSAR Covariance and Information Fusion to Robust Road Extraction. IEEE Trans. Geosci. Remote Sens. 2017, 55, 3611–3622. [Google Scholar] [CrossRef]
  23. Jiang, M.; Guarnieri, A.M. Distributed Scatterer Interferometry with the Refinement of Spatiotemporal Coherence. IEEE Trans. Geosci. Remote Sens. 2020, 58, 3977–3987. [Google Scholar] [CrossRef]
  24. Hooper, A.; Zebker, H.A. Phase unwrapping in three dimensions with application to InSAR time series. J. Opt. Soc. Am. A 2007, 24, 2737–2747. [Google Scholar] [CrossRef] [Green Version]
  25. Hooper, A.J. Persistent Scatter Radar Interferometry for Crustal Deformation Studies and Modeling of Volcanic Deformation. Ph.D. Thesis, Department of Geophysics, Stanford University, Stanford, CA, USA, 2006. [Google Scholar]
  26. Jia, C.; Yang, X.; Wu, J.; Ding, P.; Bian, C. Monitoring Analysis and Numerical Simulation of the Land Subsidence in Linear Engineering Areas. KSCE J. Civ. Eng. 2021, 25, 2674–2689. [Google Scholar] [CrossRef]
  27. Chen, Y.; Yu, S.; Tao, Q.; Liu, G.; Wang, L.; Wang, F. Accuracy Verification and Correction of D-InSAR and SBAS-InSAR in Monitoring Mining Surface Subsidence. Remote Sens. 2021, 13, 4365. [Google Scholar] [CrossRef]
  28. Zhang, T.X. Advanced Coregistration Methods of Sentinel-1 A/B Satelliates and Its Application in Tianjin Area. Ph.D. Thesis, School of Geodesy and Geomatics, Wuhan University, Wuhan, China, 2019. [Google Scholar]
  29. European Space Agency. Available online: https://scihub.copernicus.eu/gnss/#/home (accessed on 3 April 2014).
  30. Tao, Q.; Gao, T.; Liu, G.; Wang, Z. Effect of external digital elevation model on monitoring of mine subsidence by two-pass differential interferometric synthetic aperture radar. J. Appl. Remote Sens. 2017, 11, 026037. [Google Scholar] [CrossRef] [Green Version]
  31. Hooper, A.; Bekaert, D.; Spaans, K.; Arıkan, M. Recent advances in SAR interferometry time series analysis for measuring crustal deformation. Tectonophysics 2012, 514–517, 1–13. [Google Scholar] [CrossRef]
  32. Jiang, M.; Ding, X.; Tian, X.; Malhotra, R.; Kong, W. A hybrid method for optimization of the adaptive Goldstein filter. ISPRS J. Photogramm. Remote Sens. 2014, 98, 29–43. [Google Scholar] [CrossRef]
  33. Jiang, M.; Ding, X.; Li, Z. Homogeneous pixel selection algorithm for multitemporal InSAR. Chin. J. Geophys. 2018, 61, 4767–4776. [Google Scholar]
  34. Xing, H.; Chen, J.; Wu, H.; Hou, D. A web service-oriented geoprocessing system for supporting intelligent land cover change detection. ISPRS Int. J. Geo-Inf. 2019, 8, 50. [Google Scholar] [CrossRef] [Green Version]
  35. Karra, K.; Kontgis, C.; Statman-Weil, Z.; Mazzariello, J.C.; Mathis, M.; Brumby, S.P. Global land use/land cover with Sentinel-2 and deep learning. In Proceedings of the 2021 IEEE International Geoscience and Remote Sensing Symposium IGARSS, Brussels, Belgium, 11–16 July 2021. [Google Scholar]
  36. Liu, Y.; Fan, H.; Wang, L.; Zhuang, H. Monitoring of surface deformation in a low coherence area using distributed scatterers InSAR: Case study in the Xiaolangdi Basin of the Yellow River, China. Bull. Eng. Geol. Environ. 2021, 80, 25–39. [Google Scholar] [CrossRef]
  37. Zhang, L.; Liao, M.S.; Dong, J.; Xu, Q.; Gong, J.Y. Early detection of landslide hazards in mountainous areas of west China using time series SAR interferometry–A case study of Danba, Sichuan. Geomat. Inf. Sci. Wuhan Univ. 2018, 43, 2039–2049. [Google Scholar]
  38. Jiang, Z.; Yu, S.; Tao, Q. Application of StaMPS-MTI Technology in Monitoring Ground Subsidence. J. Southwest Jiaotong Univ. 2017, 52, 295–302. [Google Scholar]
  39. Crosetto, M.; Monserrat, O.; Cuevas-González, M.; Devanthéry, N.; Crippa, B. Persistent Scatterer Interferometry: A review. ISPRS J. Photogramm. Remote Sens. 2016, 115, 78–89. [Google Scholar] [CrossRef] [Green Version]
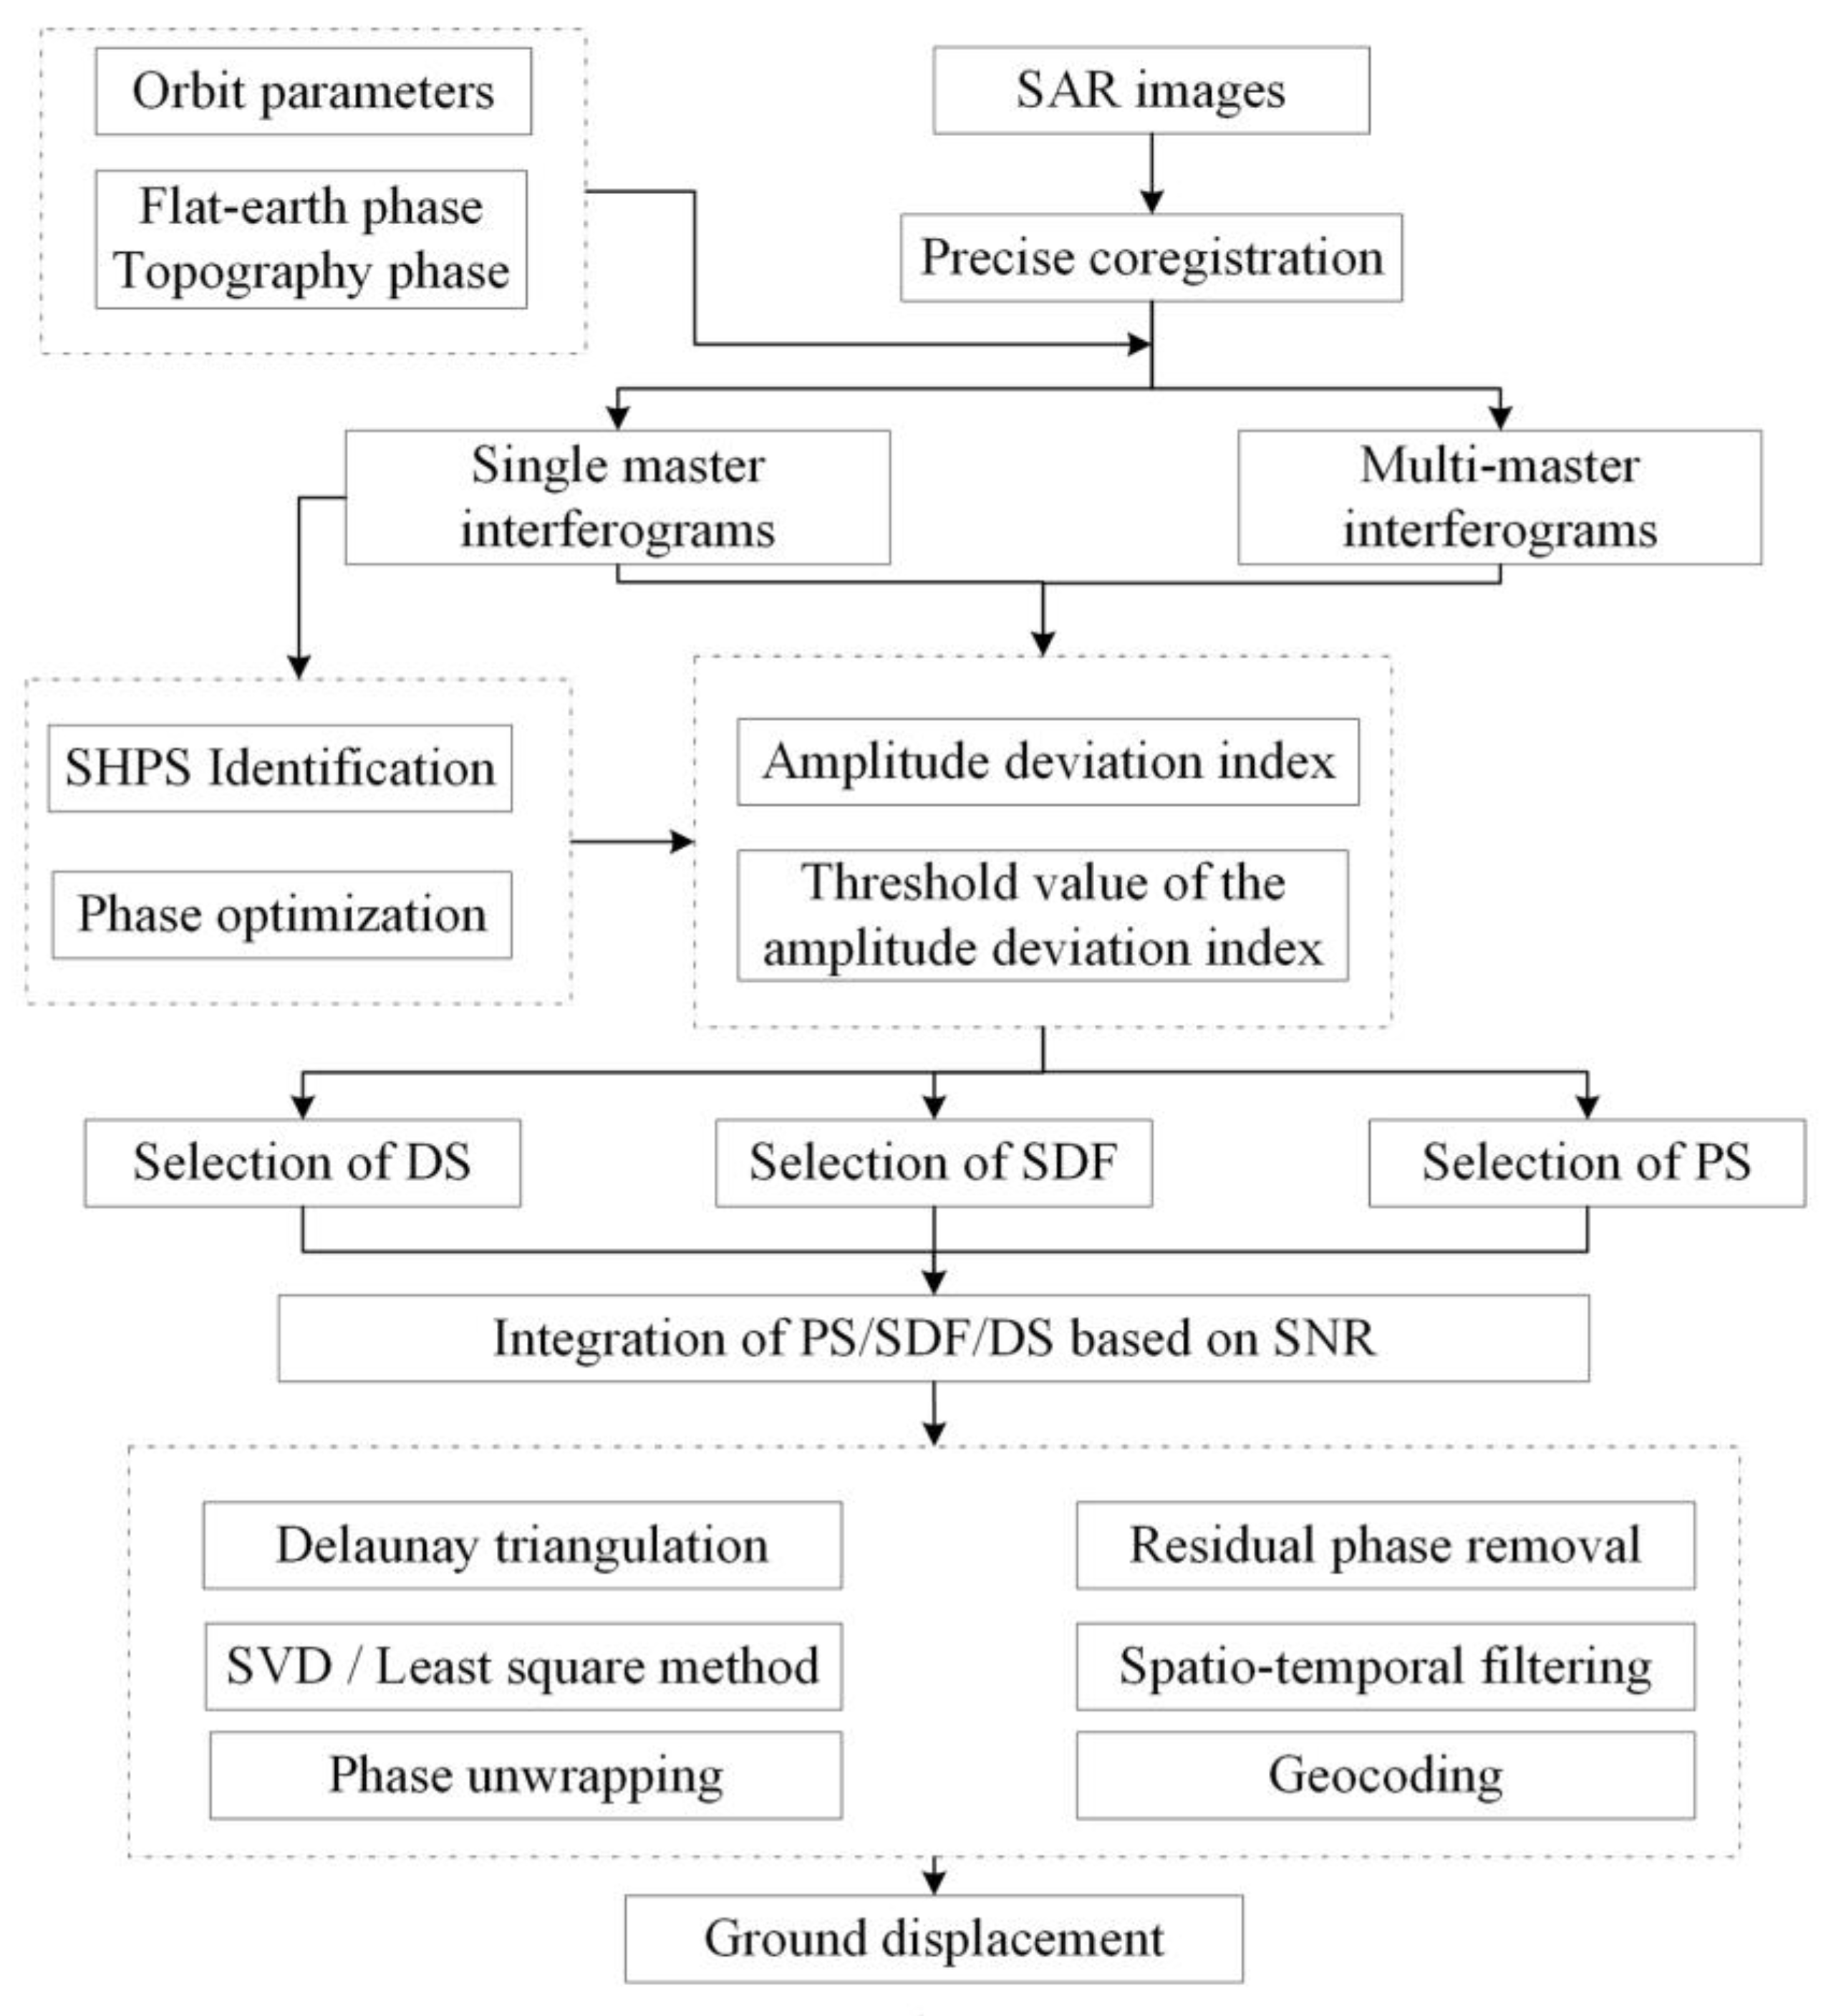
Figure 1. Data processing procedures of the proposed method.
Applsci 13 08695 g001
Figure 2. Locations of the study area.
Applsci 13 08695 g002
Figure 3. Spatial and temporal baselines of the interferometric pairs: (a) PS-InSAR and (b) SBAS-InSAR. The x-axis represents the temporal baseline, the y-axis represents the perpendicular baseline, black dots indicate SAR images, red dots indicate master SAR images and black lines denote interferograms.
Applsci 13 08695 g003
Figure 4. Average velocity of ground displacement in the study area obtained by different methods: (a) PS-InSAR; (b) SBAS-InSAR; and (c) the proposed method.
Applsci 13 08695 g004
Figure 5. Average velocity of ground displacement in A, B, C, and D zones: (ac) are results in A zone obtained by PS-InSAR, SBAS-InSAR, and the proposed method, respectively; (df) are results in B zone obtained by PS-InSAR, SBAS-InSAR, and the proposed method, respectively; (gi) are results in C zone obtained by PS-InSAR, SBAS-InSAR, and the proposed method, respectively; (jl), are results in D zone obtained by PS-InSAR, SBAS-InSAR, and the proposed method, respectively.
Applsci 13 08695 g005
Figure 6. Comparative analysis of ground cumulative displacement at characteristic points in different methods: (a) T1; (b) T2; (c) T3; and (d) T4, respectively.
Applsci 13 08695 g006
Figure 7. Comparison of quantity of CPs in different methods.
Applsci 13 08695 g007
Figure 8. Land use classification of the study area: (a) remote sensing image of the study area; (b) land use classification map in A zone; (c) land use classification map in B zone; (d) land use classification map in C zone; and (e) land use classification map in D zone.
Applsci 13 08695 g008
Figure 9. Average velocity of ground displacement distribution histogram in A, B, C, and D zones: (ac) are the results in A zone obtained by PS-InSAR, SBAS-InSAR, and the proposed method, respectively; (df) are the results in B zone obtained by PS-InSAR, SBAS-InSAR, and the proposed method, respectively; (gi) are the results distributions in C zone obtained by PS-InSAR, SBAS-InSAR, and the proposed method, respectively; (jl) are the results in D zone obtained by PS-InSAR, SBAS-InSAR, and the proposed method, respectively. The red line is the boundary line for the average velocity of ground displacement of −20mm/year.
Applsci 13 08695 g009
Figure 10. The average velocity of ground displacement correlation and difference distribution of homonymy points among conventional time-series InSAR techniques (PS-InSAR (ad) and SBAS-InSAR (eh)) and the proposed methods. The blue circles represent outliers, the red lines represent regression line and the colorful dots represent the corresponding CPs.
Applsci 13 08695 g010
Table 1. Details of the processed SAR data.
ItemsDescription
Strip modeIW
Orbital inclination98.18°
WavebandC
Incidence angle33.88°
Orbital height693 km
Orbit directionAscending
PolarizationVV
Path40
Frame112
ResolutionRange 2.3 m/Azimuth 13.9 m
Time spans20 May 2017–17 December 2018
Table 2. Statistics on the quantity of CPs in different methods.
MethodsParametersin Ain Bin Cin D
The proposed methodQuantity356,939119,60221,89026,333
PS-InSARQuantity68,81619,56032294895
Multiples of increase5.16.16.75.3
SBAS-InSARQuantity232,37354,701930613,114
Multiples of increase1.52.12.32.0
Table 3. Statistics on the increase in the quantity of CPs < 20 mm/year from the proposed method to the conventional time series InSAR techniques.
Methodsin Ain Bin Cin D
PS-InSAR15.16.25.9817.47
SBAS-InSAR1.652.443.882
Disclaimer/Publisher’s Note: The statements, opinions and data contained in all publications are solely those of the individual author(s) and contributor(s) and not of MDPI and/or the editor(s). MDPI and/or the editor(s) disclaim responsibility for any injury to people or property resulting from any ideas, methods, instructions or products referred to in the content.