
A Numerical Investigation of the Thermal Performance of a Gabion Building Envelope in Cold Regions with a Mountainous Climate


Abstract
:1. Introduction
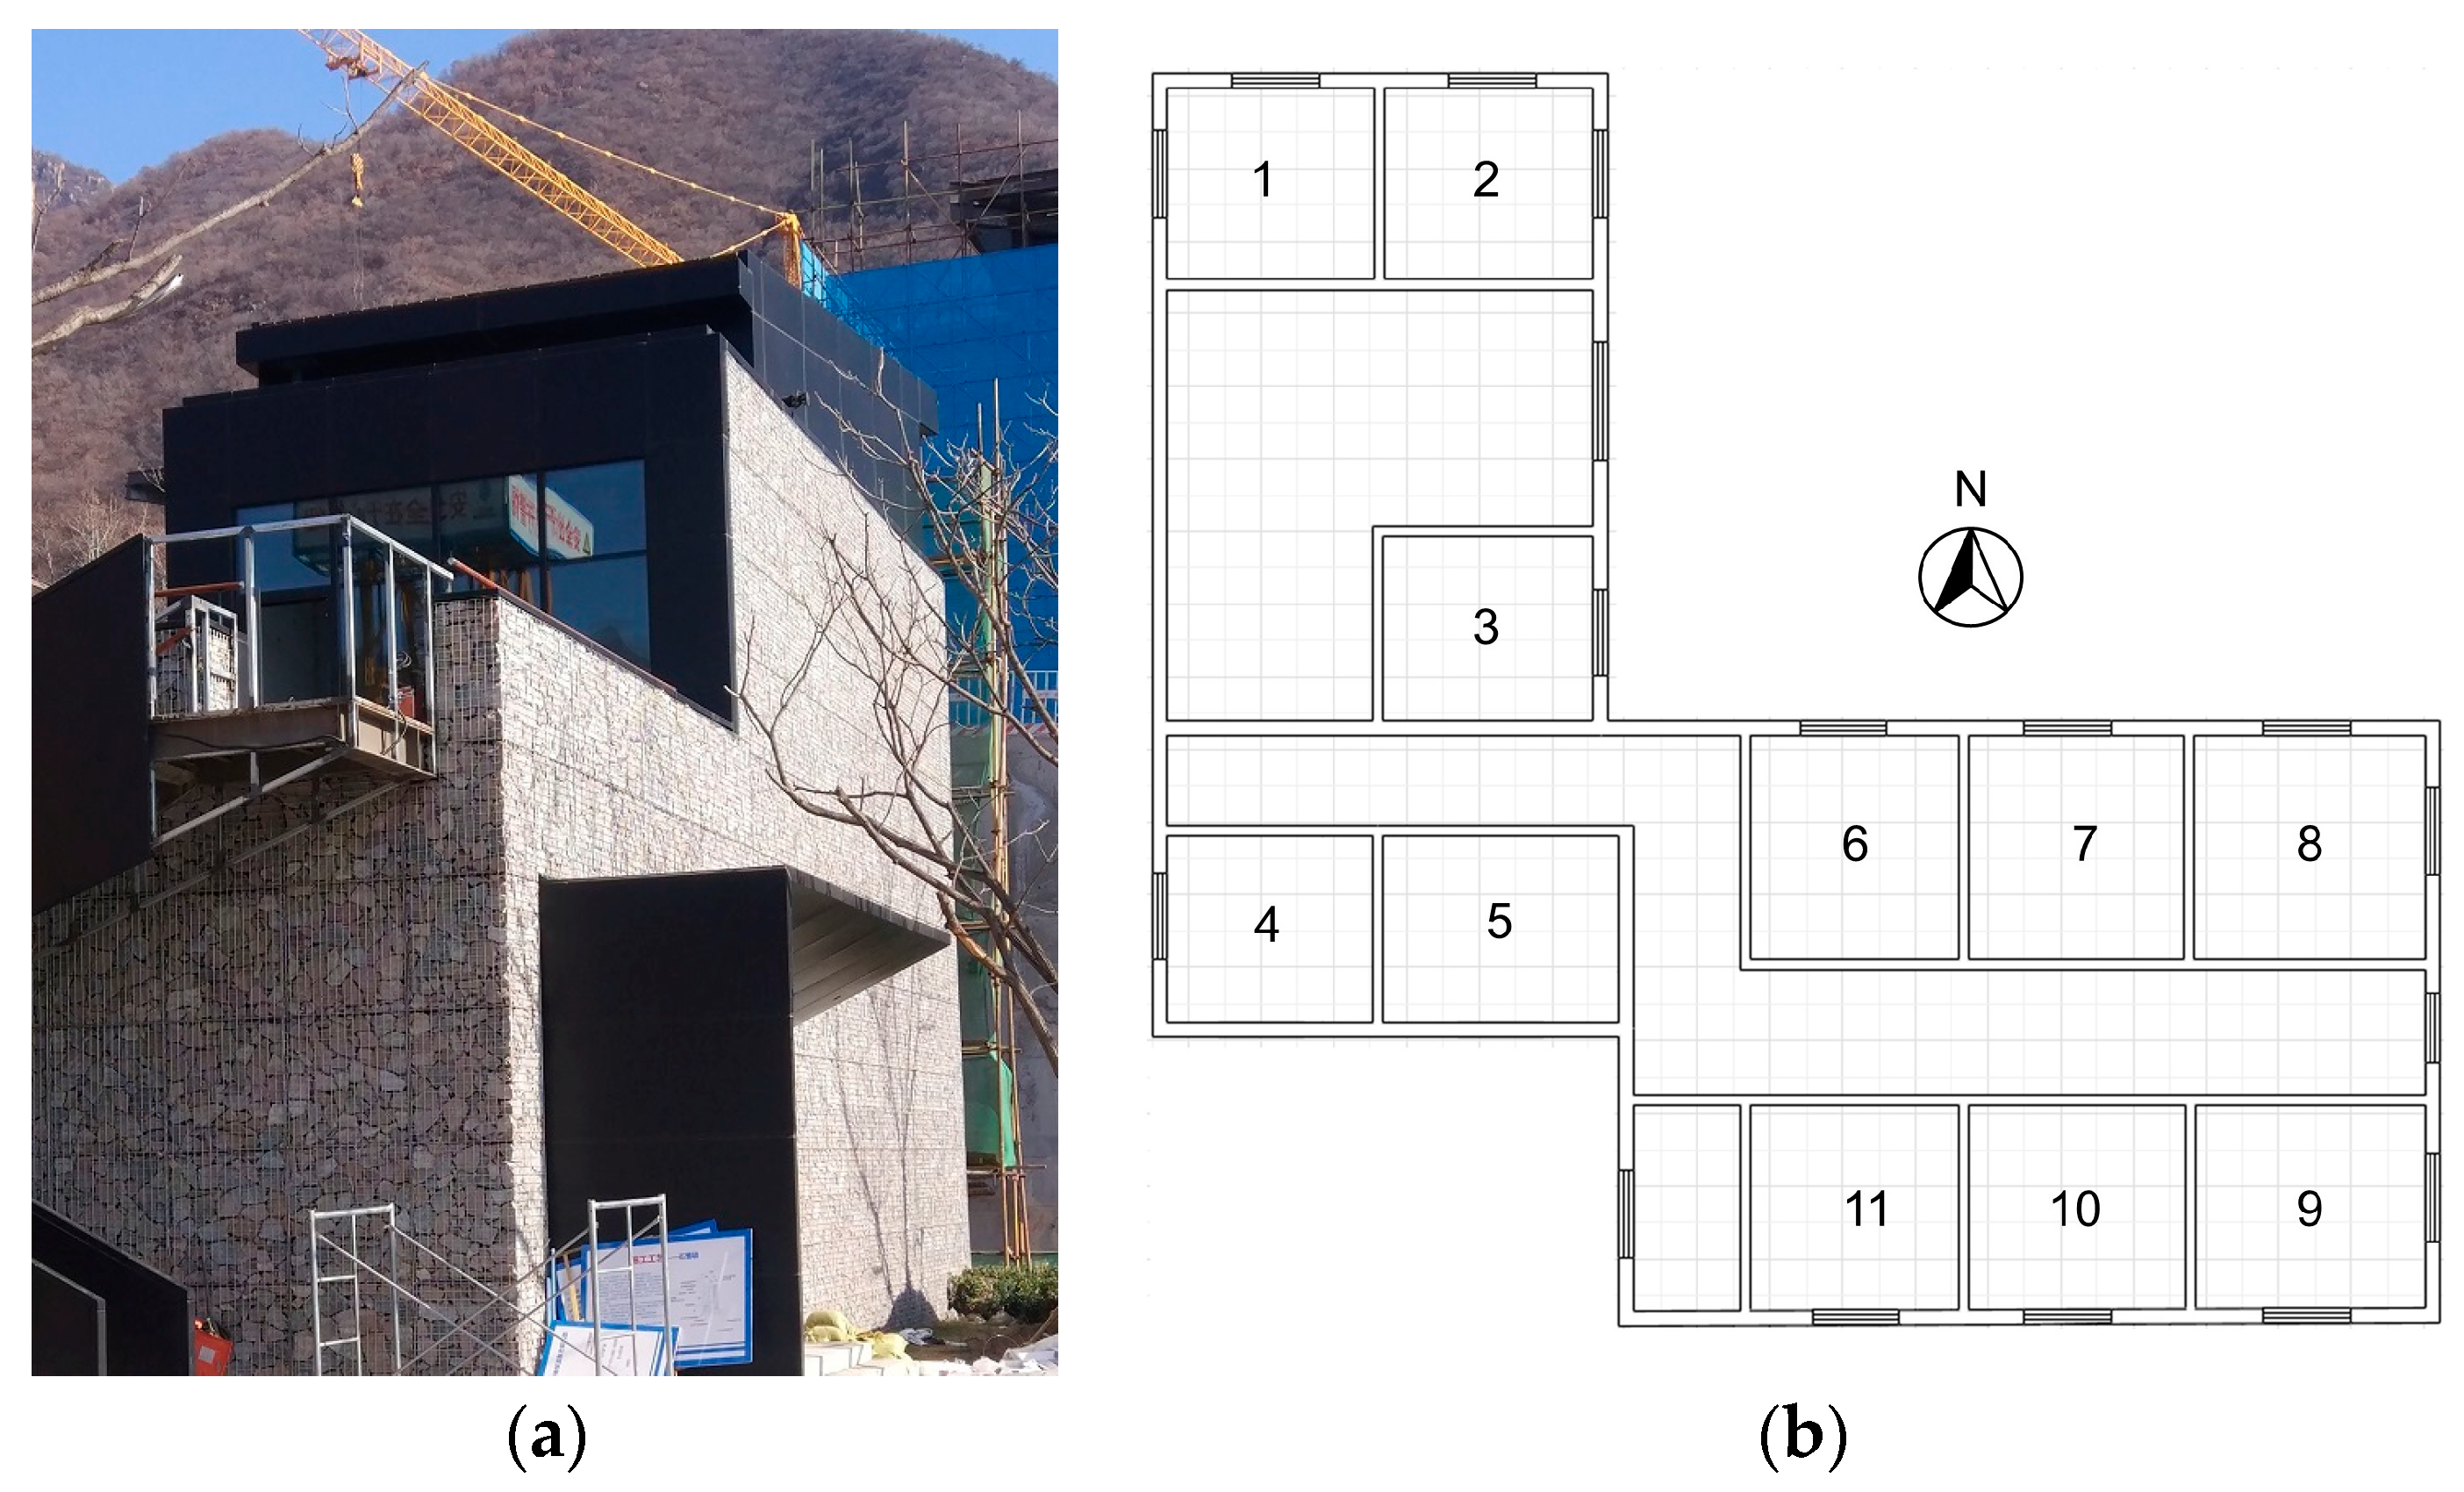
2. Physical Model
3. Mathematical Model
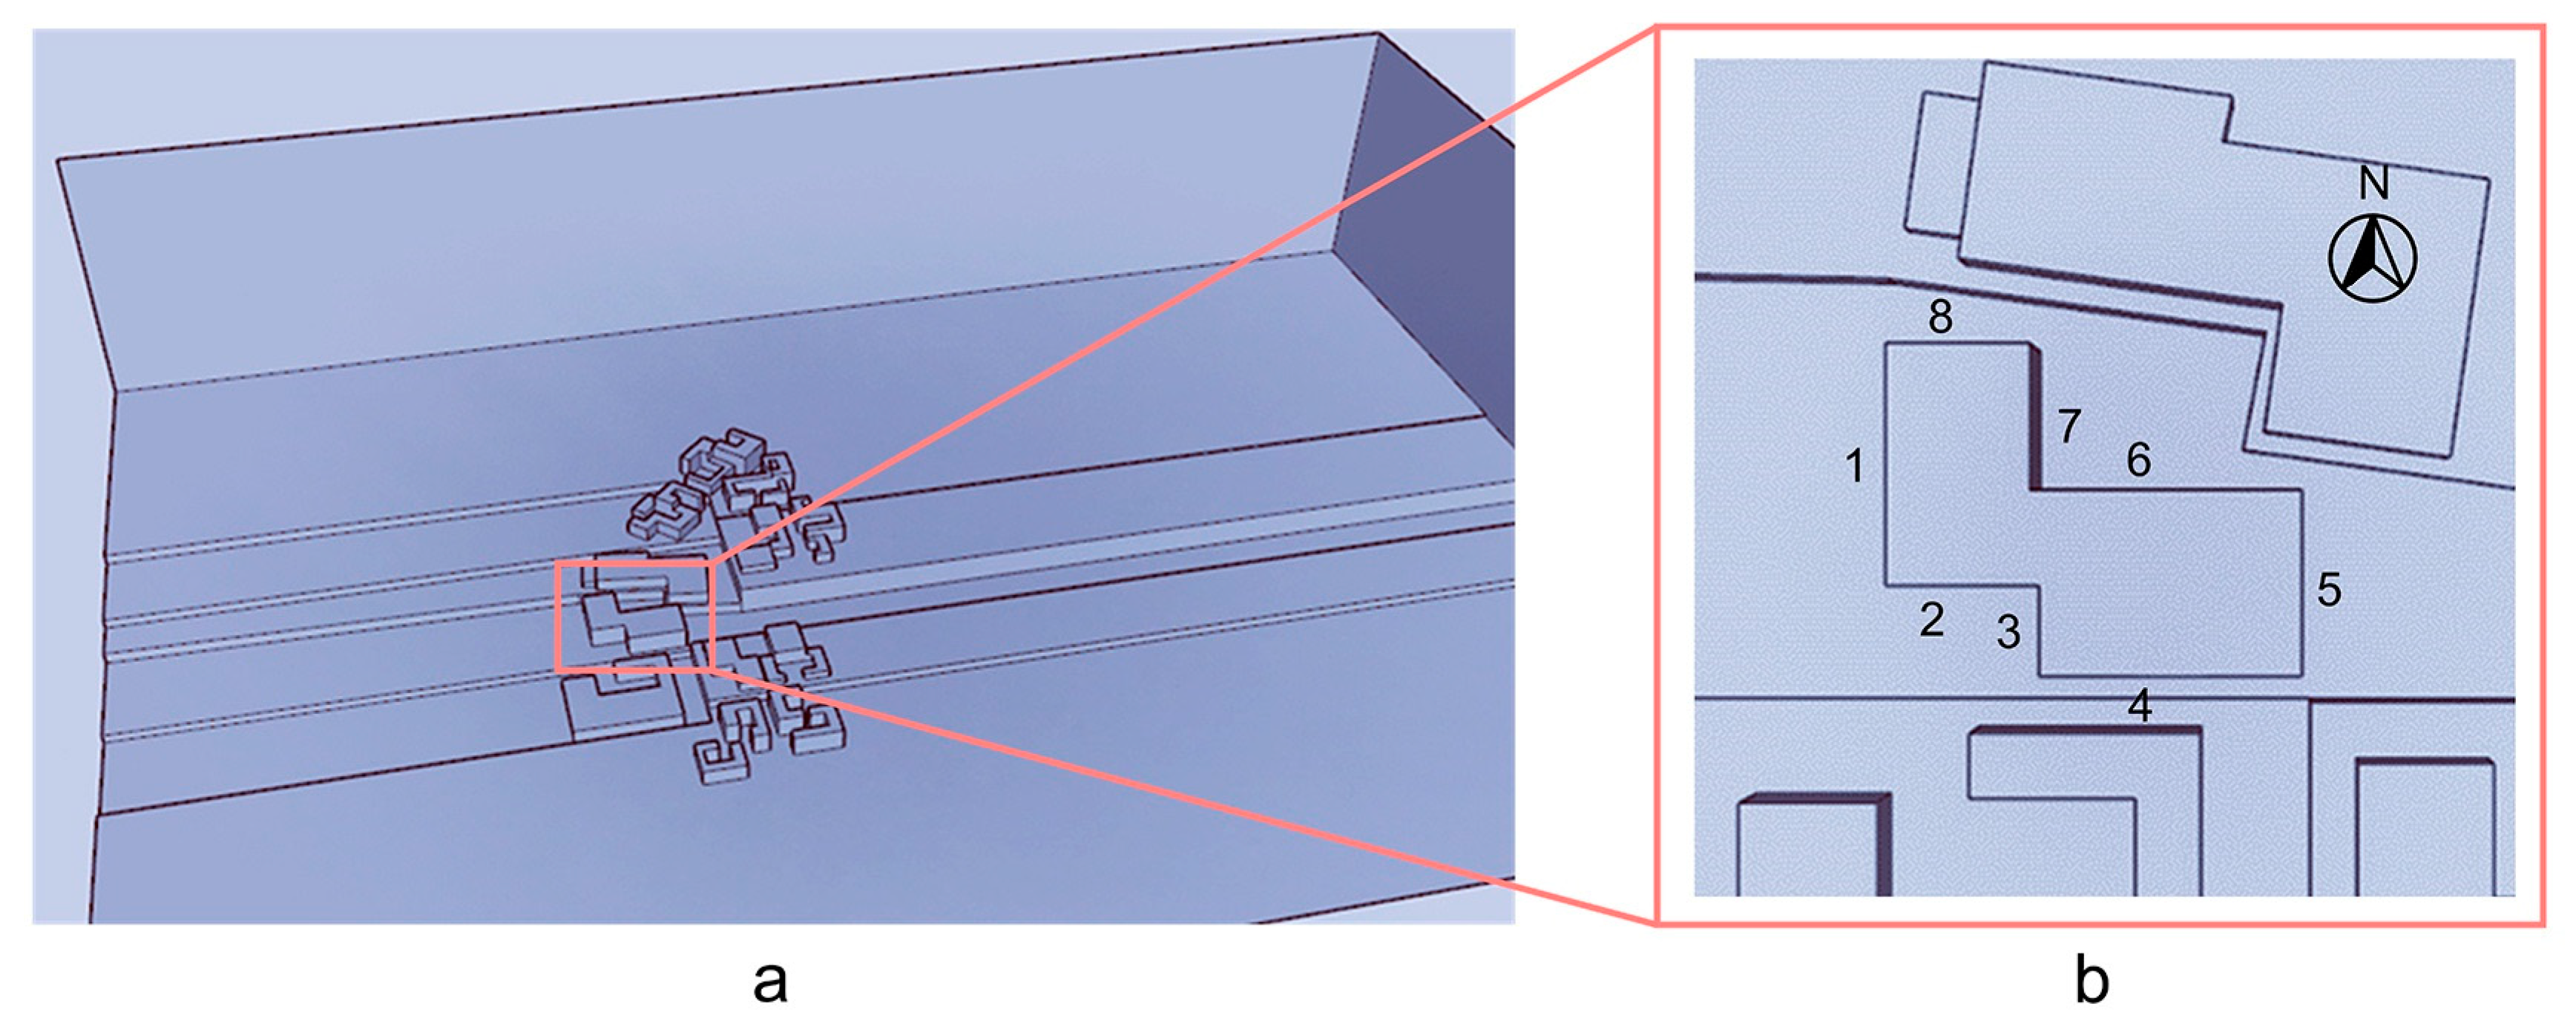
3.1. Computational Domain, Grid and Boundary Condition
3.2. Governing Equations
- The temperature of the exterior building surface is uniformly distributed;
- Indoor heat disturbance was ignored;
- The air is a Newton fluid that satisfies the boussinesq assumption;
- The thermal contact resistance between different layer of the exterior wall were ignored;
- The change in thermal conductivity with temperature was ignored, and the thermal conductivity was constant.
3.3. Working Conditions
3.4. Grid Independence Verification
3.5. Model Validation
4. Results and Discussion
4.1. Effect of Gabion on the Exterior CHTC
4.2. Effect of Gabion on Wind Pressure and Air Infiltration
4.3. Impact of Gabion on Room Base Temperature
4.4. Impact of Gabion on Building Load
5. Conclusions
- Regardless of the weather condition, gabion significantly reduces the CHTC on the exterior building surface by effectively reducing the wind speed on the external building surface, even that of a surface parallel to the incoming flow direction. These leads to a 69% decrease in the average CHTC value for the building under condition I, 67% under condition II, and 63% under condition III;
- The gabion can obviously change the wind pressure distribution on the exterior building surface, reduce the maximum wind pressure difference on external surfaces of the building envelope, and effectively weaken the impact of air infiltration on the building’s energy consumption. Compared to a building without gabions, the air infiltration rate of a building with gabions is also greatly reduced under three conditions;
- A gabion located on the outside of the exterior wall can improve the room base temperature throughout the heating season, and the average room base temperature is 2.02 °C higher than that of a building without gabions. Therefore, a gabion can have a significant impact on saving energy for building heating and enhancing the adaptability to the unfriendly external environment;
- The gabion structure has a non-negligible influence on the heating load while lowering the maximum heat load (up to 10.7%) and the cumulative heat load (up to 24.8%) during the heating season.
Author Contributions
Funding
Institutional Review Board Statement
Informed Consent Statement
Data Availability Statement
Conflicts of Interest
References
- Xu, X.; Dessel, S.V. Evaluation of an Active Building Envelope window-system. Build. Environ. 2008, 43, 1785–1791. [Google Scholar] [CrossRef]
- Lang, S.W. Current situation and progress of energy efficiency design standards in buildings in China. Refrig. Air Condition Elect. Power Mach. 2002, 24, 1–6. [Google Scholar]
- China association of building energy efficiency. 2022 research report of China building energy consumptionand carbon emission. Constru. Build. 2023, 2, 57–69. [Google Scholar]
- Wang, X.; Sun, X.; Yu, C.W.F. Building envelope with variable thermal performance: Opportunities and challenges. Indoor Built Environ. 2018, 27, 729–733. [Google Scholar] [CrossRef]
- Wang, X.; Cheng, R.; Zeng, R.; Zhang, Y. Ideal thermal physical properties of building wall in an active room. Indoor Built Environ. 2014, 23, 839–853. [Google Scholar] [CrossRef]
- Far, C.; Far, H. Improving energy efficiency of existing residential buildings using effective thermal retrofit of building envelope. Indoor Built Environ. 2019, 28, 744–760. [Google Scholar] [CrossRef]
- Xu, J.; Lu, Z.L.; Gao, W.J.; Yang, M.S.; Su, M.L. The comparative study on the climate adaptability based on indoor physical environment of traditional dwelling in QinBa mountainous areas, China. Energy Build. 2019, 197, 140–155. [Google Scholar]
- Chantrelle, P.F.; Lahmidi, H.; Keilholz, W.; Mankibi, M.E.; Michel, P. Development of a multicriteria tool for optimizing the renovation of building. Appl. Energy 2011, 88, 1386–1394. [Google Scholar] [CrossRef]
- 9. Shohan, AAA. Thermal Comfort and Energy Demand of Small and Large Mosque Buildings in Saudi Arabia. Ph.D. Thesis, University of Nottingham, Nottingham, UK, 2015.
- Philokyprou, M.; Michael, A.; Thravalou, S.; Ioannou, I. Thermal performance assessment of vernacular residential semi-open spaces in Mediterranean climate. Indoor Built Environ. 2018, 27, 1050–1068. [Google Scholar] [CrossRef]
- Alwetaishi, M.; Taki, A. Investigation into energy performance of a school building in a hot climate: Optimum of window-to-wall ratio. Indoor Built Environ. 2020, 29, 24–39. [Google Scholar] [CrossRef]
- Rubio-Bellido, C.; Pulido-Arcas, J.A.; Cabeza-Lainez, J.M. Understanding climatic traditions: A quantitative and qualitative analysis of historic dwellings of Cadiz. Indoor Built Environ. 2018, 27, 665–681. [Google Scholar] [CrossRef]
- Duan, M.F.; Sun, H.L.; Wu, Y.F.; Wu, X.Y.; Lin, B.R. Climate adaptive thermal characteristics of envelope of residential passive house in China. J. Cent. South Univ. 2022, 29, 2317–2329. [Google Scholar] [CrossRef]
- Mariani, S.; Rosso, F.; Ferrero, M. Building in Historical Areas: Identity Values and Energy Performance of Innovative Massive Stone Envelopes with Reference to Traditional Building Solutions. Buildings 2018, 8, 17. [Google Scholar] [CrossRef] [Green Version]
- Lydia, K.; Veronica, S. Limitations of building performance simulation: Modelling a building with gabion walls. In Proceedings of the Conference Proceedings Building Simulation 2015, Hyderabad, India, 7–9 December 2015; Mathur, J., Garg, V., Eds.; International Building Performance Simulation Association: Shanghai, China, 2015; pp. 1700–1707. [Google Scholar]
- Fu, B. Mountainous Region Climate; Science Press: Beijing, China, 1983. [Google Scholar]
- Quan, J.; Songyue, X.; Chang, L.; Meng, J.; He, L. The Strategy of Passive Ecological Building Design Based on Guangxi’s Climate Characteristics—A Case Study on the Garden Art Gallery of the 12th China (Nanning) International Garden Expo. IOP Conf. Ser. Earth Environ. Sci. 2021, 768, 012132. [Google Scholar] [CrossRef]
- Liu, J.; Heidarinejad, M.; Gracik, S.; Srebric, J. The impact of exterior surface convective heat transfer coefficients on the building energy consumption in urban neighborhoods with different plan area densities. Energy Build. 2015, 86, 449–463. [Google Scholar] [CrossRef]
- Emmel, M.G.; Abadie, M.O.; Mendes, N. New external convective heat transfer coefficient correlations for isolated low-rise buildings. Energy Build. 2007, 39, 335–342. [Google Scholar] [CrossRef]
- Montazeri, H.; Blocken, B. New generalized expressions for forced convective heat transfer coefficients at building facades and roofs. Build Environ. 2017, 119, 153–168. [Google Scholar] [CrossRef] [Green Version]
- Blocken, B.; Defraeye, T.; Derome, D.; Carmeliet, J. High-resolution CFD simulations for forced convective heat transfer coefficients at the façade of a low-rise building. Build Environ. 2009, 44, 2396–2412. [Google Scholar] [CrossRef]
- Iousef, S.; Montazeri, H.; Blocken, B.; van Wesemael, P. Impact of exterior convective heat transfer coefficient models on the energy demand prediction of buildings with different geometry. Build. Simul. 2019, 12, 797–816. [Google Scholar] [CrossRef] [Green Version]
- Kahsay, M.T.; Bitsuamlak, G.T.; Tariku, F. CFD simulation of external CHTC on a high-rise building with and without façade appurtenances. Build. Environ. 2019, 165, 106350. [Google Scholar] [CrossRef]
- Emmerich, S.J.; Persily, A.K.; McDowell, T.P. Impact of infiltration on heating and cooling loads in US office buildings. In Proceedings of the 26th AIVC Conference “Ventilation in Relation to the Energy Performance of Buildings”, Brussels, Belgium, 21–23 September 2005. [Google Scholar]
- Liu, W.; Zhao, X.W.; Chen, Q.Y. A novel method for measuring air infiltration rate in buildings. Energy Build. 2018, 168, 309–318. [Google Scholar] [CrossRef]
- NISTIR 7238; Investigation of the Impact of Commercial Building Envelope Airtightness on HVAC Energy Use. National Institute of Standards and Technology: Gaithersburg, MD, USA, 2005.
- Feijó-Muñoz, J.; Pardal, C.; Echarri, V. Energy impact of the air infiltration in residential buildings in the Mediterranean area of Spain and the Canary Islands. Energy Build. 2019, 188–189, 226–238. [Google Scholar] [CrossRef]
- Lu, Y.; Xiang, Y.; Chen, G.; Liu, J.; Wang, Y. On-site measurement and zonal simulation on winter indoor environment and air infiltration in an atrium in a severe cold region. Energy Build. 2020, 223, 110160. [Google Scholar] [CrossRef]
- Jian, Y.; Jiang, Y. Comparison of indoor temperatures between simulation results and field measurements. Hous. Sci. 2002, 23, 3–5. [Google Scholar]
- Da, Y.; Xie, X.; Song, F.; Jiang, Y. Building environment design simulation software DeST (1): An overview of developments and information of building simulation and DeST. J. HVAC. 2004, 34, 48–56. [Google Scholar]
- Jian, Y.; Neng, Z. Evaluation of indoor thermal environmental, energy and daylighting performance of thermotropic windows. Build. Environ. 2012, 49, 283–290. [Google Scholar]
- Albaji, M.; Ershadian, B.; Noori Nejad, A.; Mohammadi, E.; Ghorban Dashtaki, S. Determination of water erosion in Kowsar catchment area and evaluation of Gabion structures in its control. Environ. Earth Sci. 2020, 79, 505. [Google Scholar] [CrossRef]
- Su, Y.C.; Choi, C.E. Effects of particle shape on the cushioning mechanics of rock-filled gabions. Acta Geotech. 2021, 16, 1043–1052. [Google Scholar] [CrossRef]
- Lambert, S.; Bourrier, F.; Gotteland, P.; Nicot, F. An experimental investigation of the response of slender protective structures to rockfall impacts. Can. Geotech. J. 2020, 57, 1215–1231. [Google Scholar] [CrossRef]
- Zhang, X.H.; Liu, J.X.; Zhang, H.Z. Building external wall thermal insulation construction quality safety measures analysis. Appl. Mech. Mater. 2013, 253, 646–649. [Google Scholar] [CrossRef]
- Lu, J.; Xue, Y.; Wang, Z.; Fan, Y. Optimized mitigation of heat loss by avoiding wall-to-floor thermal bridges in reinforced concrete buildings. J. Build. Eng. 2020, 30, 101214. [Google Scholar] [CrossRef]
- Tominaga, Y.; Mochida, A.; Yoshie, R. AIJ guidelines for practical applications of CFD to pedestrian wind environment around buildings. J. Wind. Eng. Ind. Aerodyn. 2008, 96, 1749–1761. [Google Scholar] [CrossRef]
- Li, Z.; Yan, Z.; Tu, K. Changes in wind speed and extremes in Beijing during 1960–2008 based on homogenized observations. Adv. Atmos. Sci. 2011, 28, 408–420. [Google Scholar] [CrossRef]
- Li, L.; Qiao, Y.; Sun, X.Q. Spatial-temporal characteristics and change trend of wind chill temperature in winter in Yanqing of Beijing. J. Arid. Meteorol. 2018, 36, 936–943. [Google Scholar]
- Zhang, Z.G.; Cui, W.; Bai, X. Winter ground wind field characteristic in the Haituo Mountain division for the 24th Winter Olympic Games. J. Arid. Meteorol. 2017, 35, 433–438. [Google Scholar]
- Zhang, W.W. Field Measurement and Simulation Research on the Convective Heat Transfer Coefficient of Urban Waterproof Surface. Master’s Thesis, Harbin Institute of Technology, Harbin, China, 2008. [Google Scholar]
- Lu, Y. Practical Handbook for HVAC Design, 2nd ed.; China Architecture & Building Press: Beijing, China, 2008. [Google Scholar]
- Xu, Z.; Cao, G.; Zhang, M. Discussion about infiltration of contamination through doors and windows. Build. Sci. 2017, 33, 135–141. [Google Scholar]
- Mun, J.; Lee, J.; Kim, M. Estimation of Infiltration Rate (ACH Natural) Using Blower Door Test and Simulation. Energies 2021, 14, 912. [Google Scholar] [CrossRef]


| Material | Thermo-Physical Properties | ||
|---|---|---|---|
| Conductivity (W/(mK)) | Specific Heat (J/(kg⋅K)) | Density (kg/m3) | |
| Anti-cracking mortar [35] | 0.93 | 1050 | 1800 |
| Polystyrene sheet [35] | 0.042 | 1380 | 30 |
| Reinforced concrete [36] | 1.74 | 920 | 2500 |
| Lime gypsum mortar [35] | 0.76 | 1050 | 1500 |
| Stone [35] | 1.04 | 1000 | 2000 |
| Item | Boundary Type | Boundary Condition Setting |
|---|---|---|
| Inlet | Velocity inlet | Velocity: 3 m/s, 5 m/s and 10 m/s [38,39,40] |
| Temperature: −10 °C, −20 °C, −27 °C [38,39,40] | ||
| Outlet | Pressure outlet | |
| Exterior building surface/gabion | Wall | Temperature: Data from calculation |
| Non-slip | ||
| Lateral and top side of the domain | Symmetry | |
| Ground surface | Wall | Adiabatic |
| Type | Mathematical Model | Definition |
|---|---|---|
| Continuity equation | averaged velocity vector | |
| averaged pressure | ||
| Momentum equation | averaged temperature | |
| air density | ||
| Energy equation | air specific heat | |
| air thermal conductivity | ||
| The standard k-ε model | air dynamic viscosity | |
| Reynolds stress term, solved by the standard k-ε model | ||
| turbulent Prandtl numbers for | ||
| turbulent Prandtl numbers for | ||
| equals to 1.44 | ||
| equals to 1.92 | ||
| the turbulent viscosity, defined as | ||
| equals to 0.09 |
| Item Number | Weather | Wind Direction | Air Temperature (°C) | Wind Speed (m/s) | Air Density (kg/m3) | Air Thermal Conductivity ×10−2/(W/(m·K)) | Air Specific Heat (kJ/(kg·K)) | Air Kinematic Viscosity ×10−5/(m2/s) |
|---|---|---|---|---|---|---|---|---|
| I | Normal | West | −10 | 3 | 1.342 | 2.360 | 1.0090 | 1.243 |
| II | Snowy cold wave | West | −20 | 5 | 1.395 | 2.279 | 1.0090 | 1.161 |
| III | Windy cold wave | West | −27 | 10 | 1.436 | 2.255 | 1.0118 | 1.104 |
| Number of Cells | The CHTC Value (W⁄(m2·K)) | Relative Error (%) |
|---|---|---|
| 2,894,941 | 7.91 | 4.91 |
| 3,135,433 | 7.54 | - |
| 5,383,569 | 7.16 | 5.04 |
| 8,760,834 | 8.12 | 7.69 |
| Envelope | Thermal Transmittance (W/(m2·K)) |
|---|---|
| Normal exterior wall | 0.177 |
| Gabion building envelope | 0.171 |
| Roof | 0.393 |
| Window | 2.5 |
Disclaimer/Publisher’s Note: The statements, opinions and data contained in all publications are solely those of the individual author(s) and contributor(s) and not of MDPI and/or the editor(s). MDPI and/or the editor(s) disclaim responsibility for any injury to people or property resulting from any ideas, methods, instructions or products referred to in the content. |
© 2023 by the authors. Licensee MDPI, Basel, Switzerland. This article is an open access article distributed under the terms and conditions of the Creative Commons Attribution (CC BY) license (https://creativecommons.org/licenses/by/4.0/).
Share and Cite
Liu, F.; Li, Y.; Wang, Y.; Zhang, Q.; Gao, W.; Cao, Y. A Numerical Investigation of the Thermal Performance of a Gabion Building Envelope in Cold Regions with a Mountainous Climate. Appl. Sci. 2023, 13, 8809. https://doi.org/10.3390/app13158809
Liu F, Li Y, Wang Y, Zhang Q, Gao W, Cao Y. A Numerical Investigation of the Thermal Performance of a Gabion Building Envelope in Cold Regions with a Mountainous Climate. Applied Sciences. 2023; 13(15):8809. https://doi.org/10.3390/app13158809
Chicago/Turabian StyleLiu, Fang, Yafei Li, Yushi Wang, Qunli Zhang, Wei Gao, and Ying Cao. 2023. "A Numerical Investigation of the Thermal Performance of a Gabion Building Envelope in Cold Regions with a Mountainous Climate" Applied Sciences 13, no. 15: 8809. https://doi.org/10.3390/app13158809