Infrared Spectroscopy for the Analysis of Bioactive Analytes in Wheat: A Proof-of-Concept Study
Abstract
:1. Introduction
2. Materials and Methods
3. Results
3.1. Descriptive Statistics
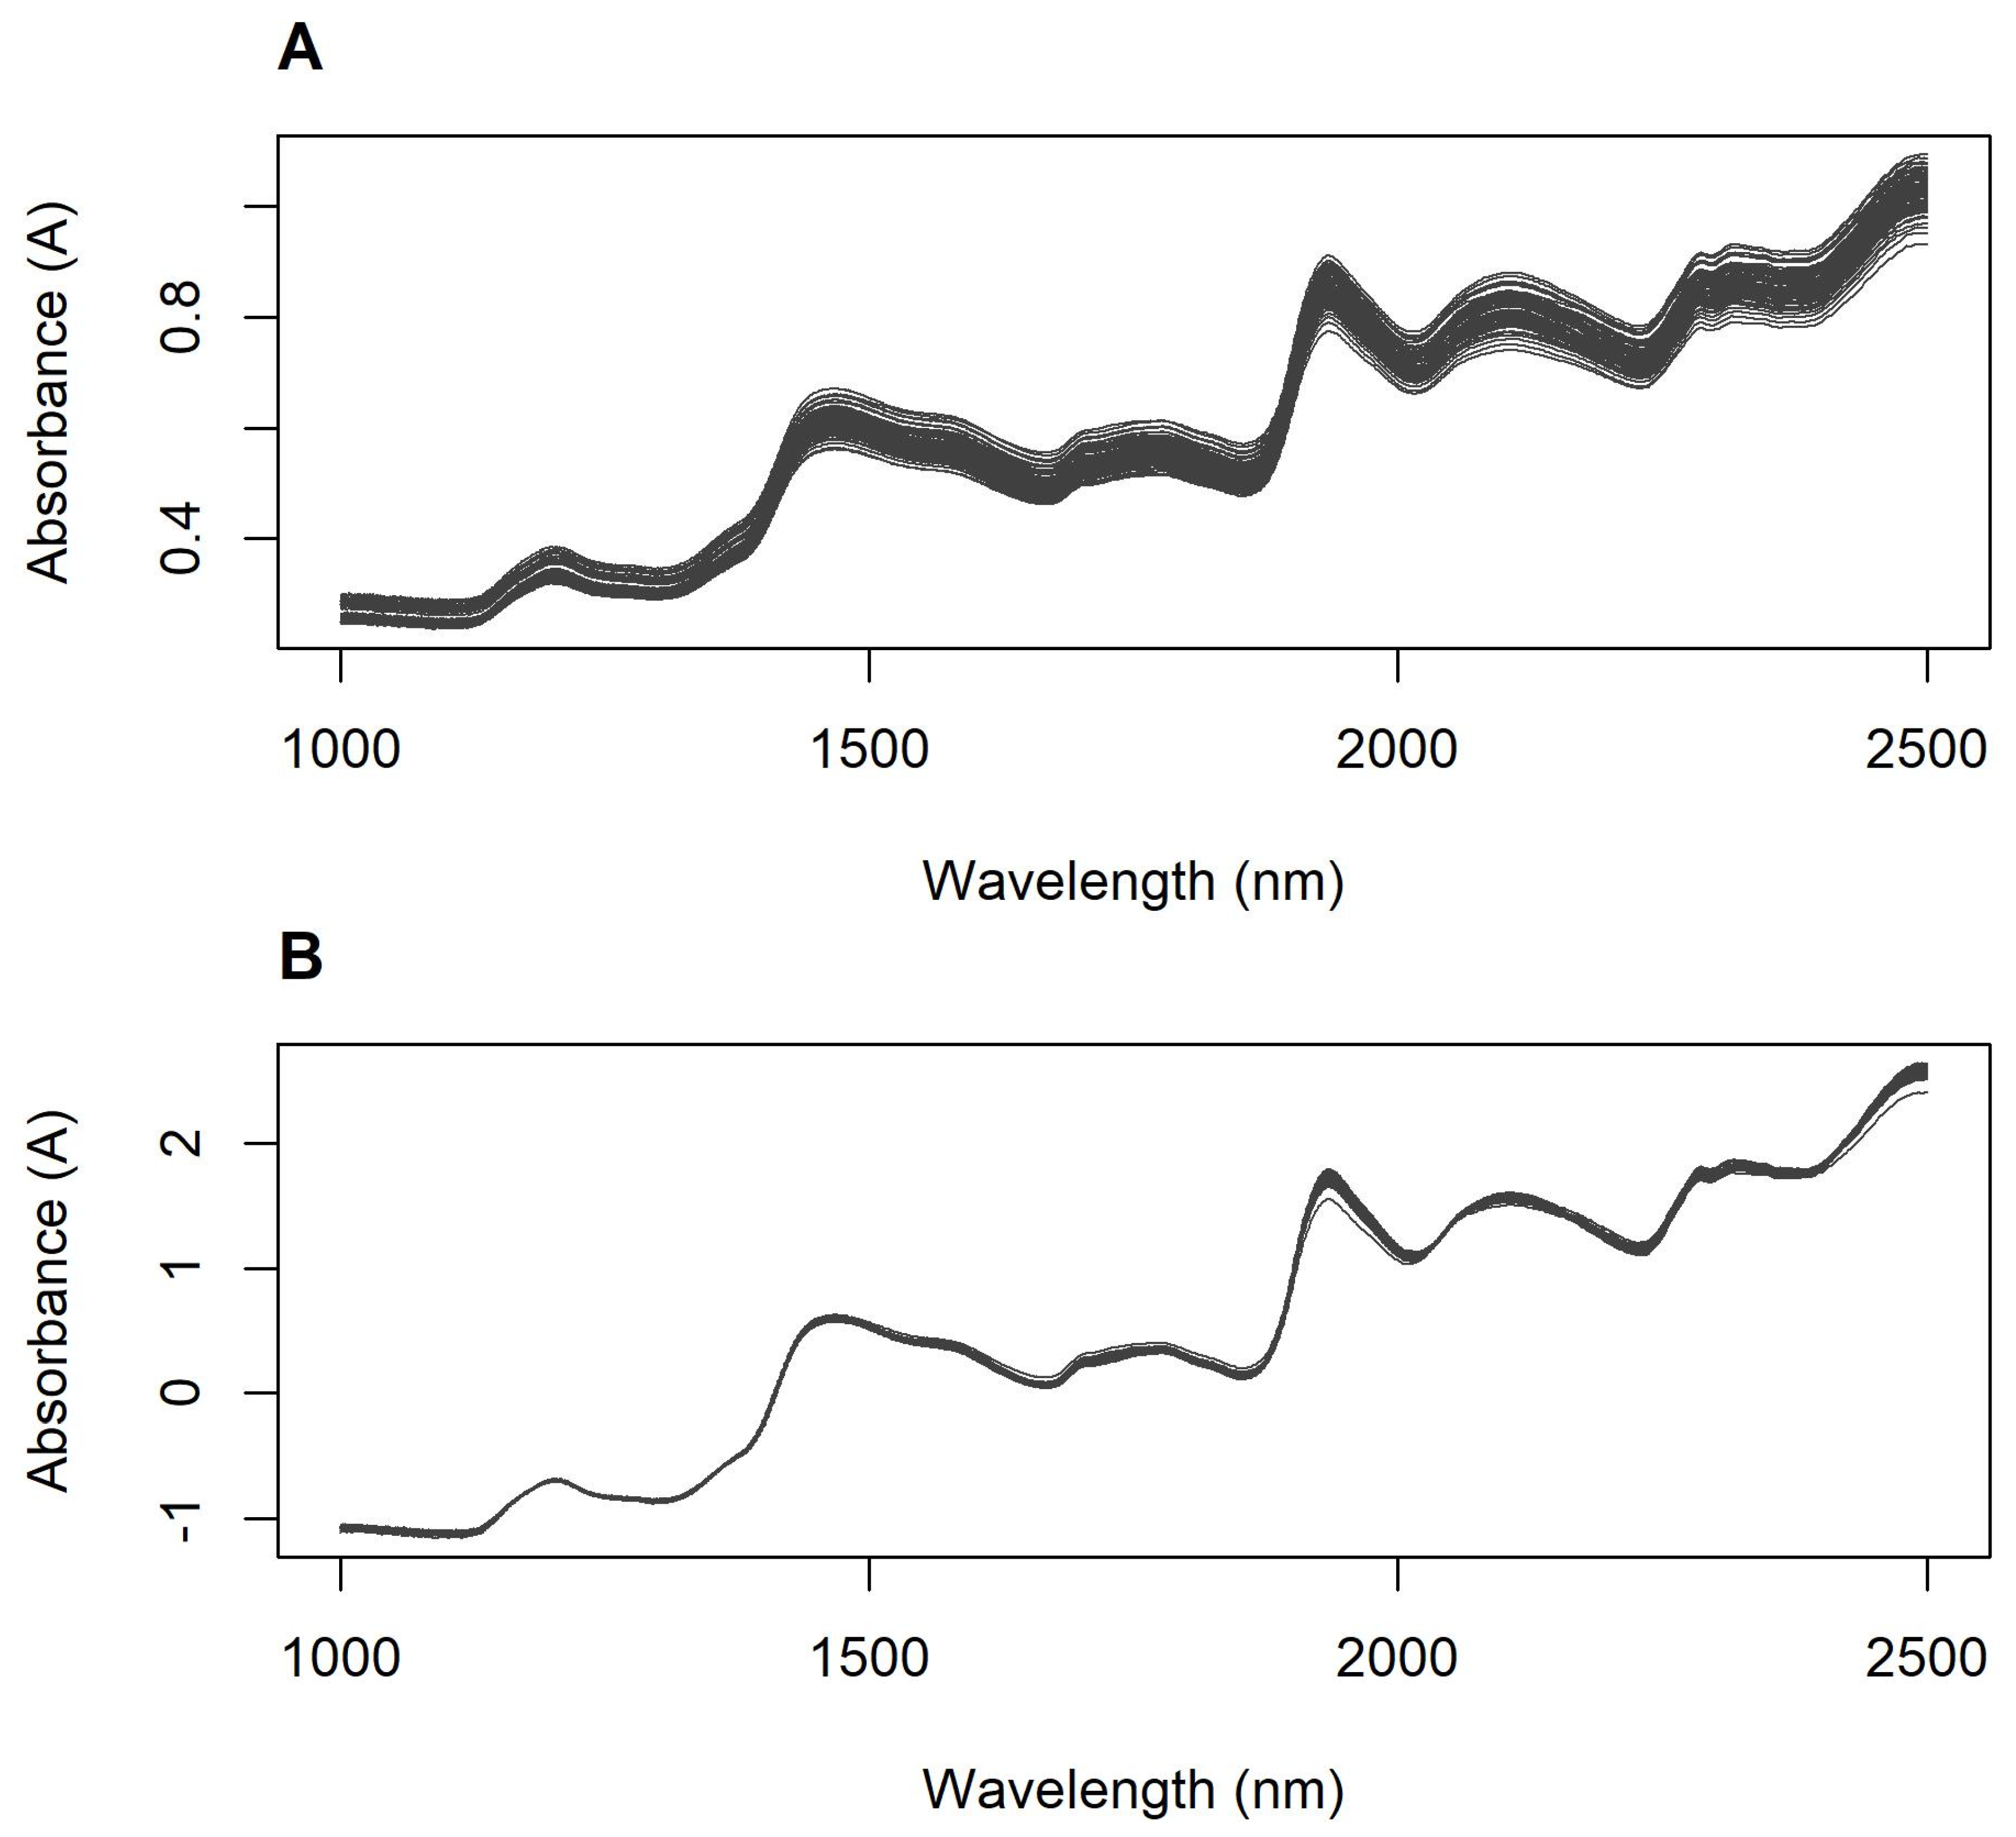
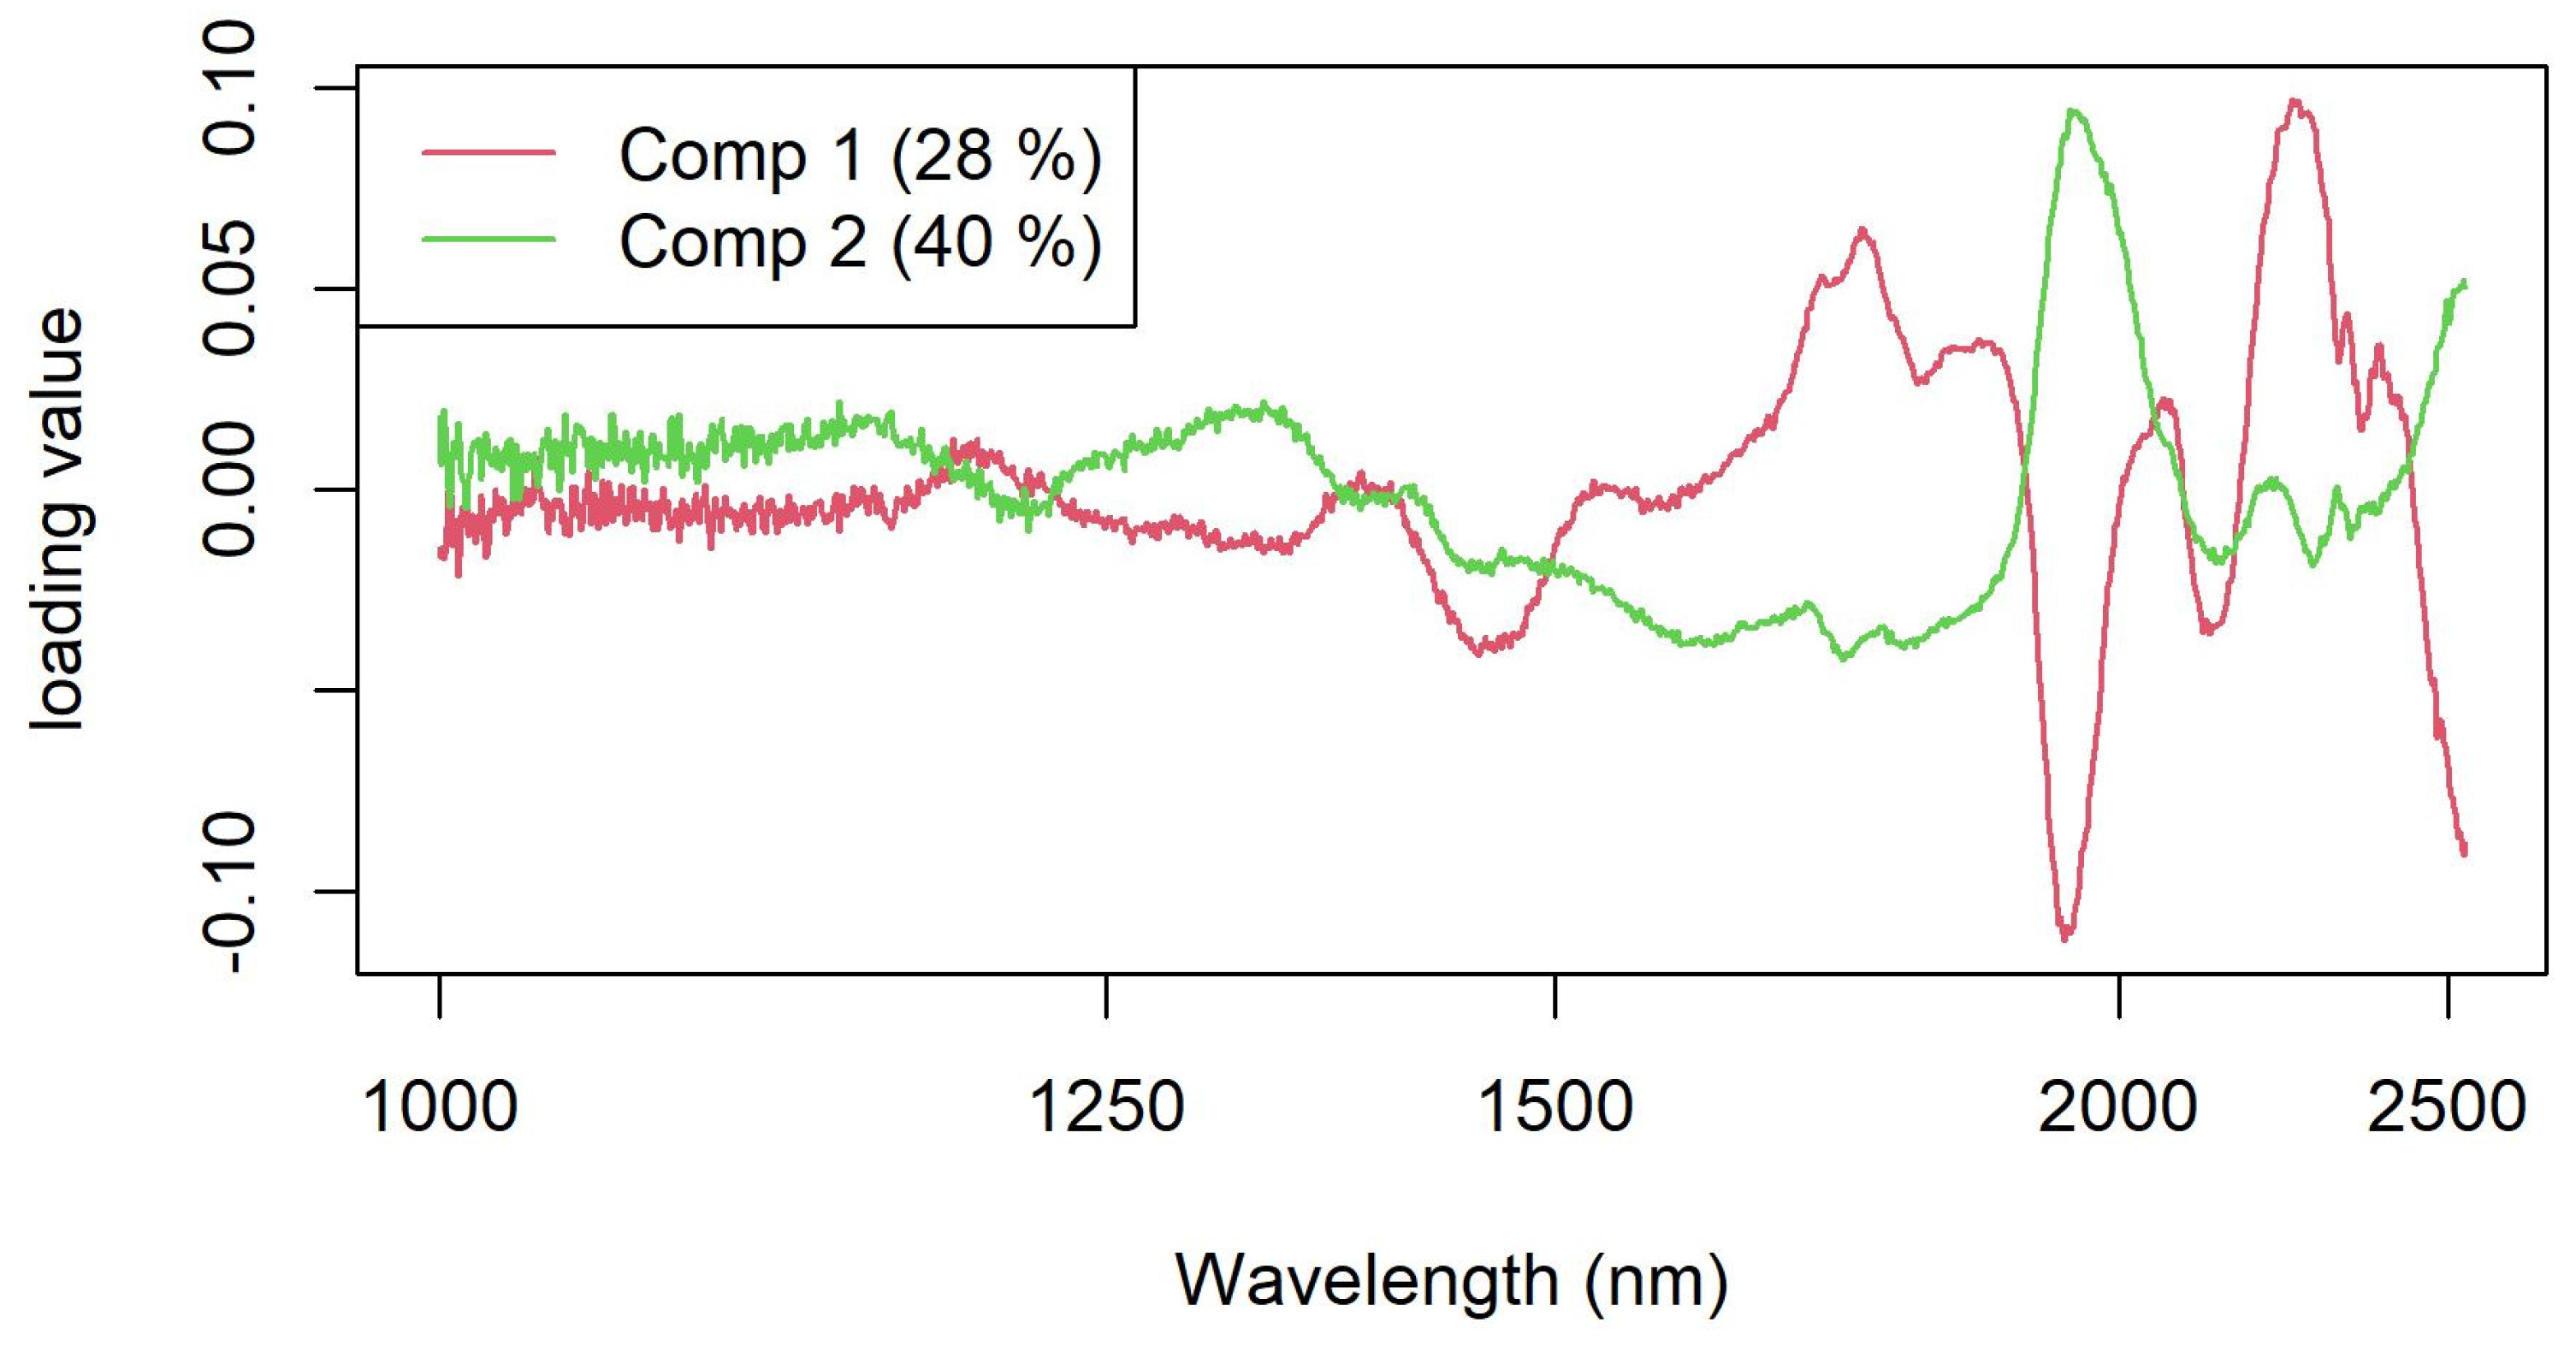
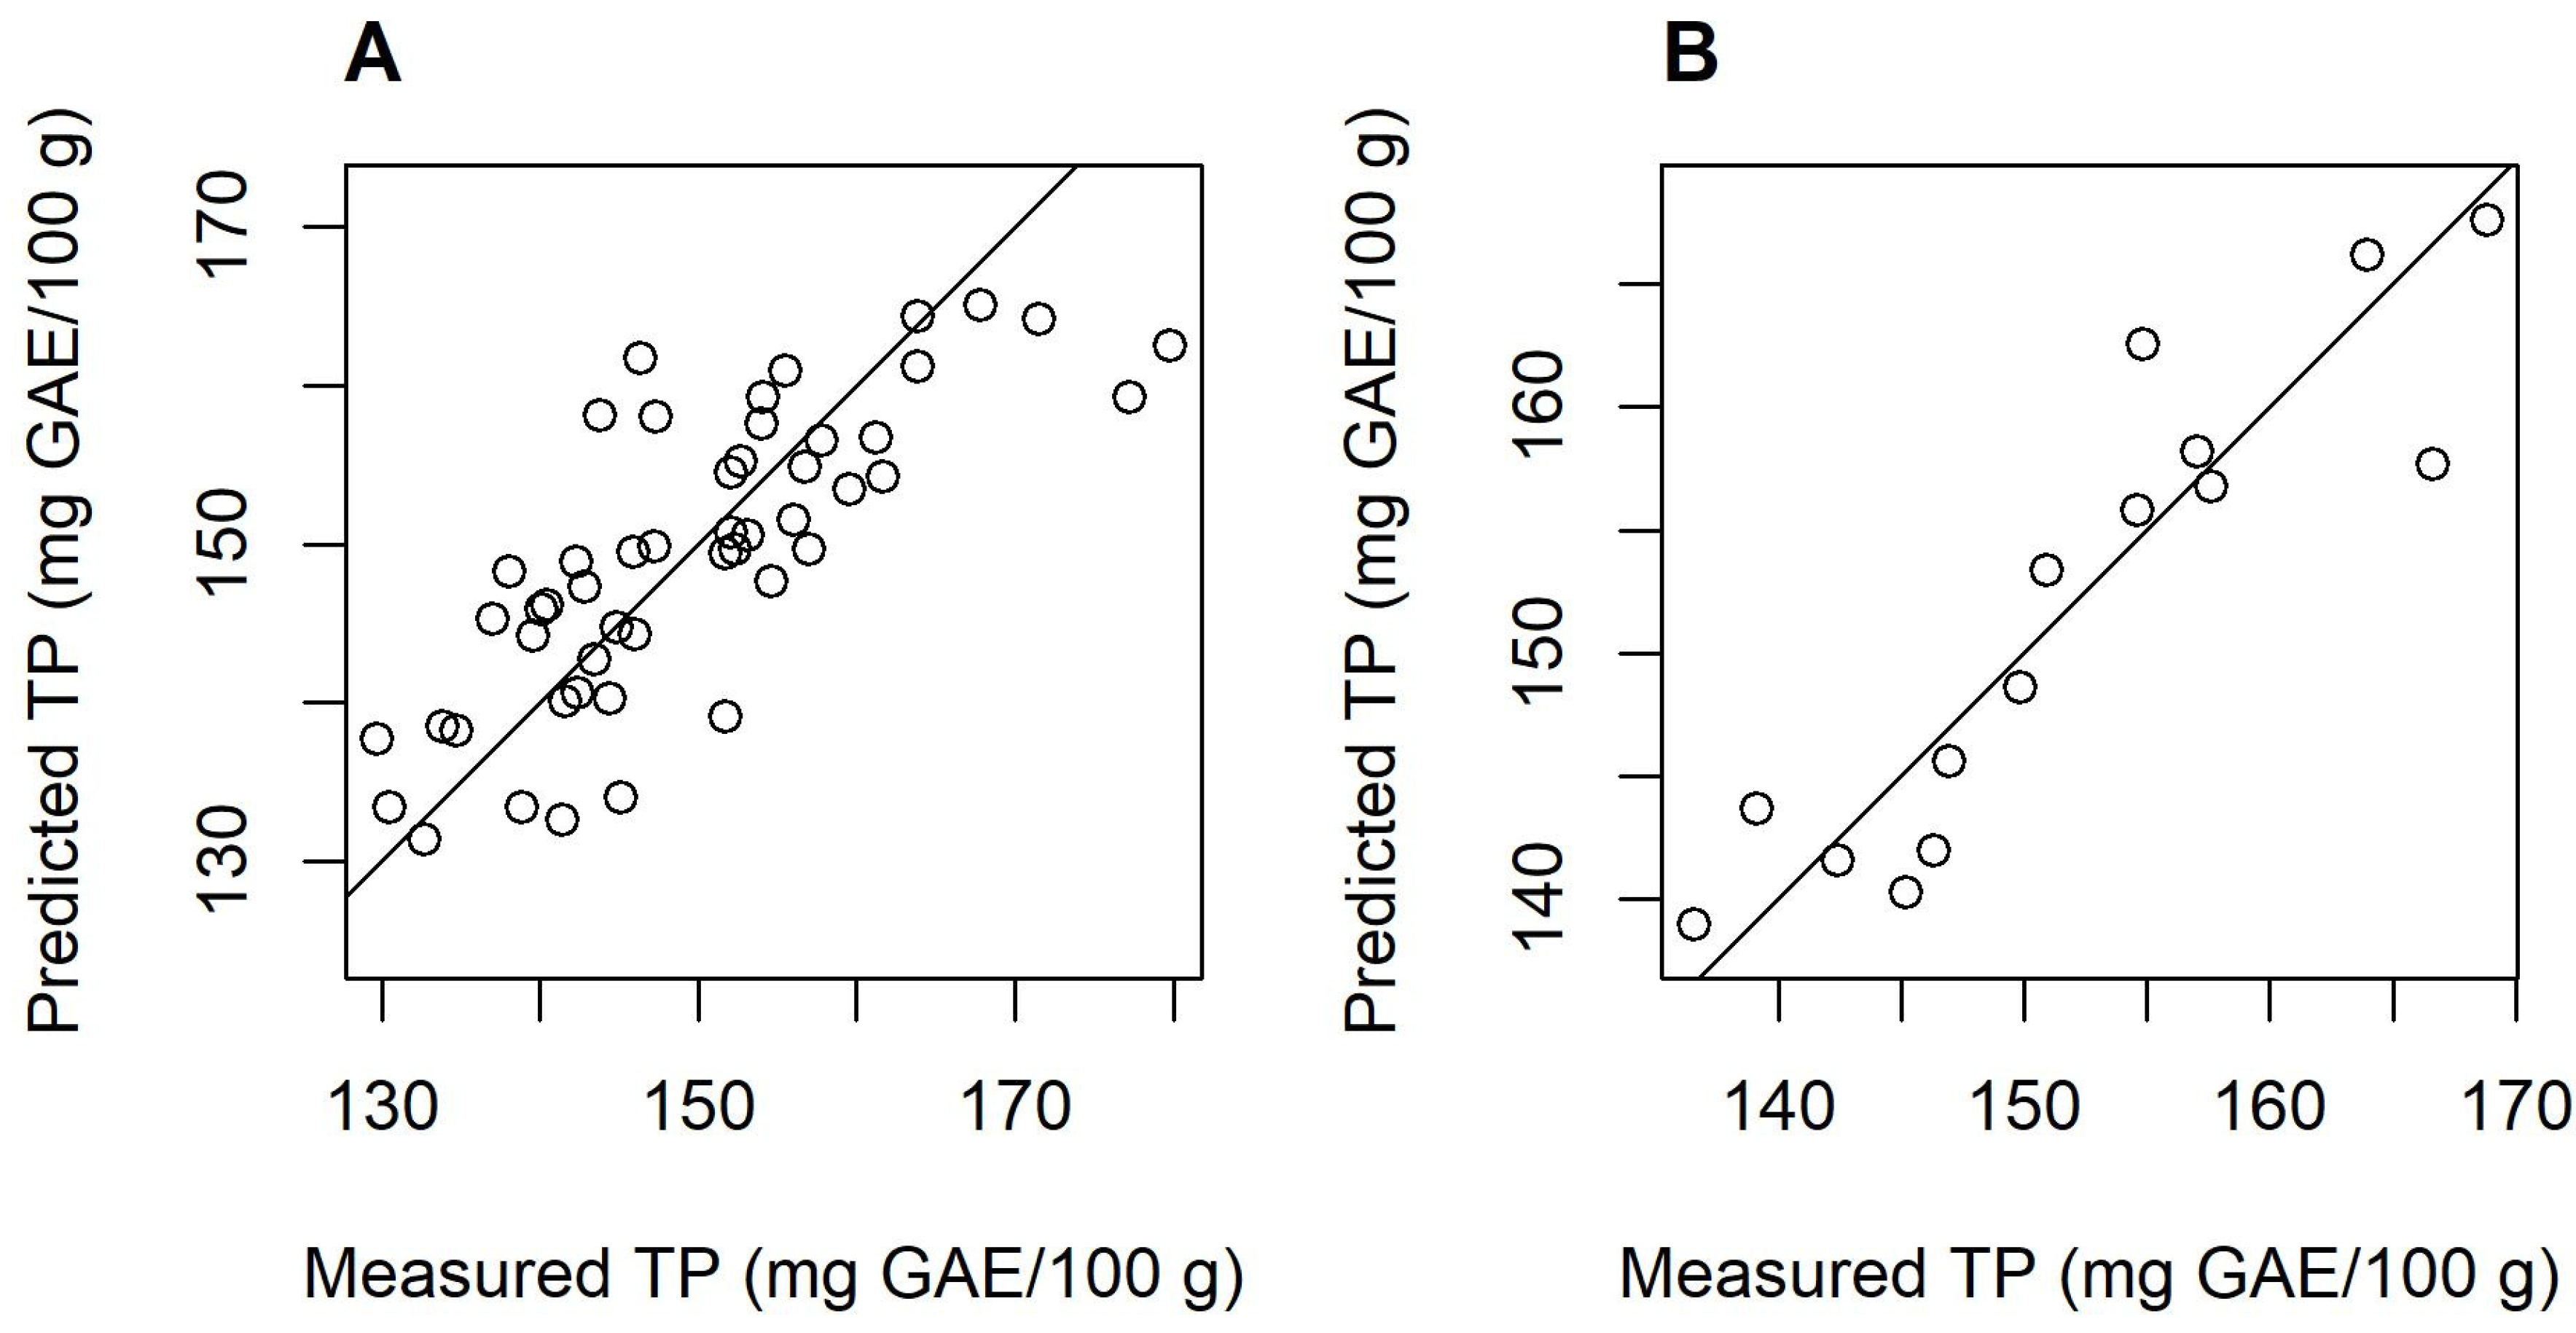
3.2. Near-Infrared Spectra
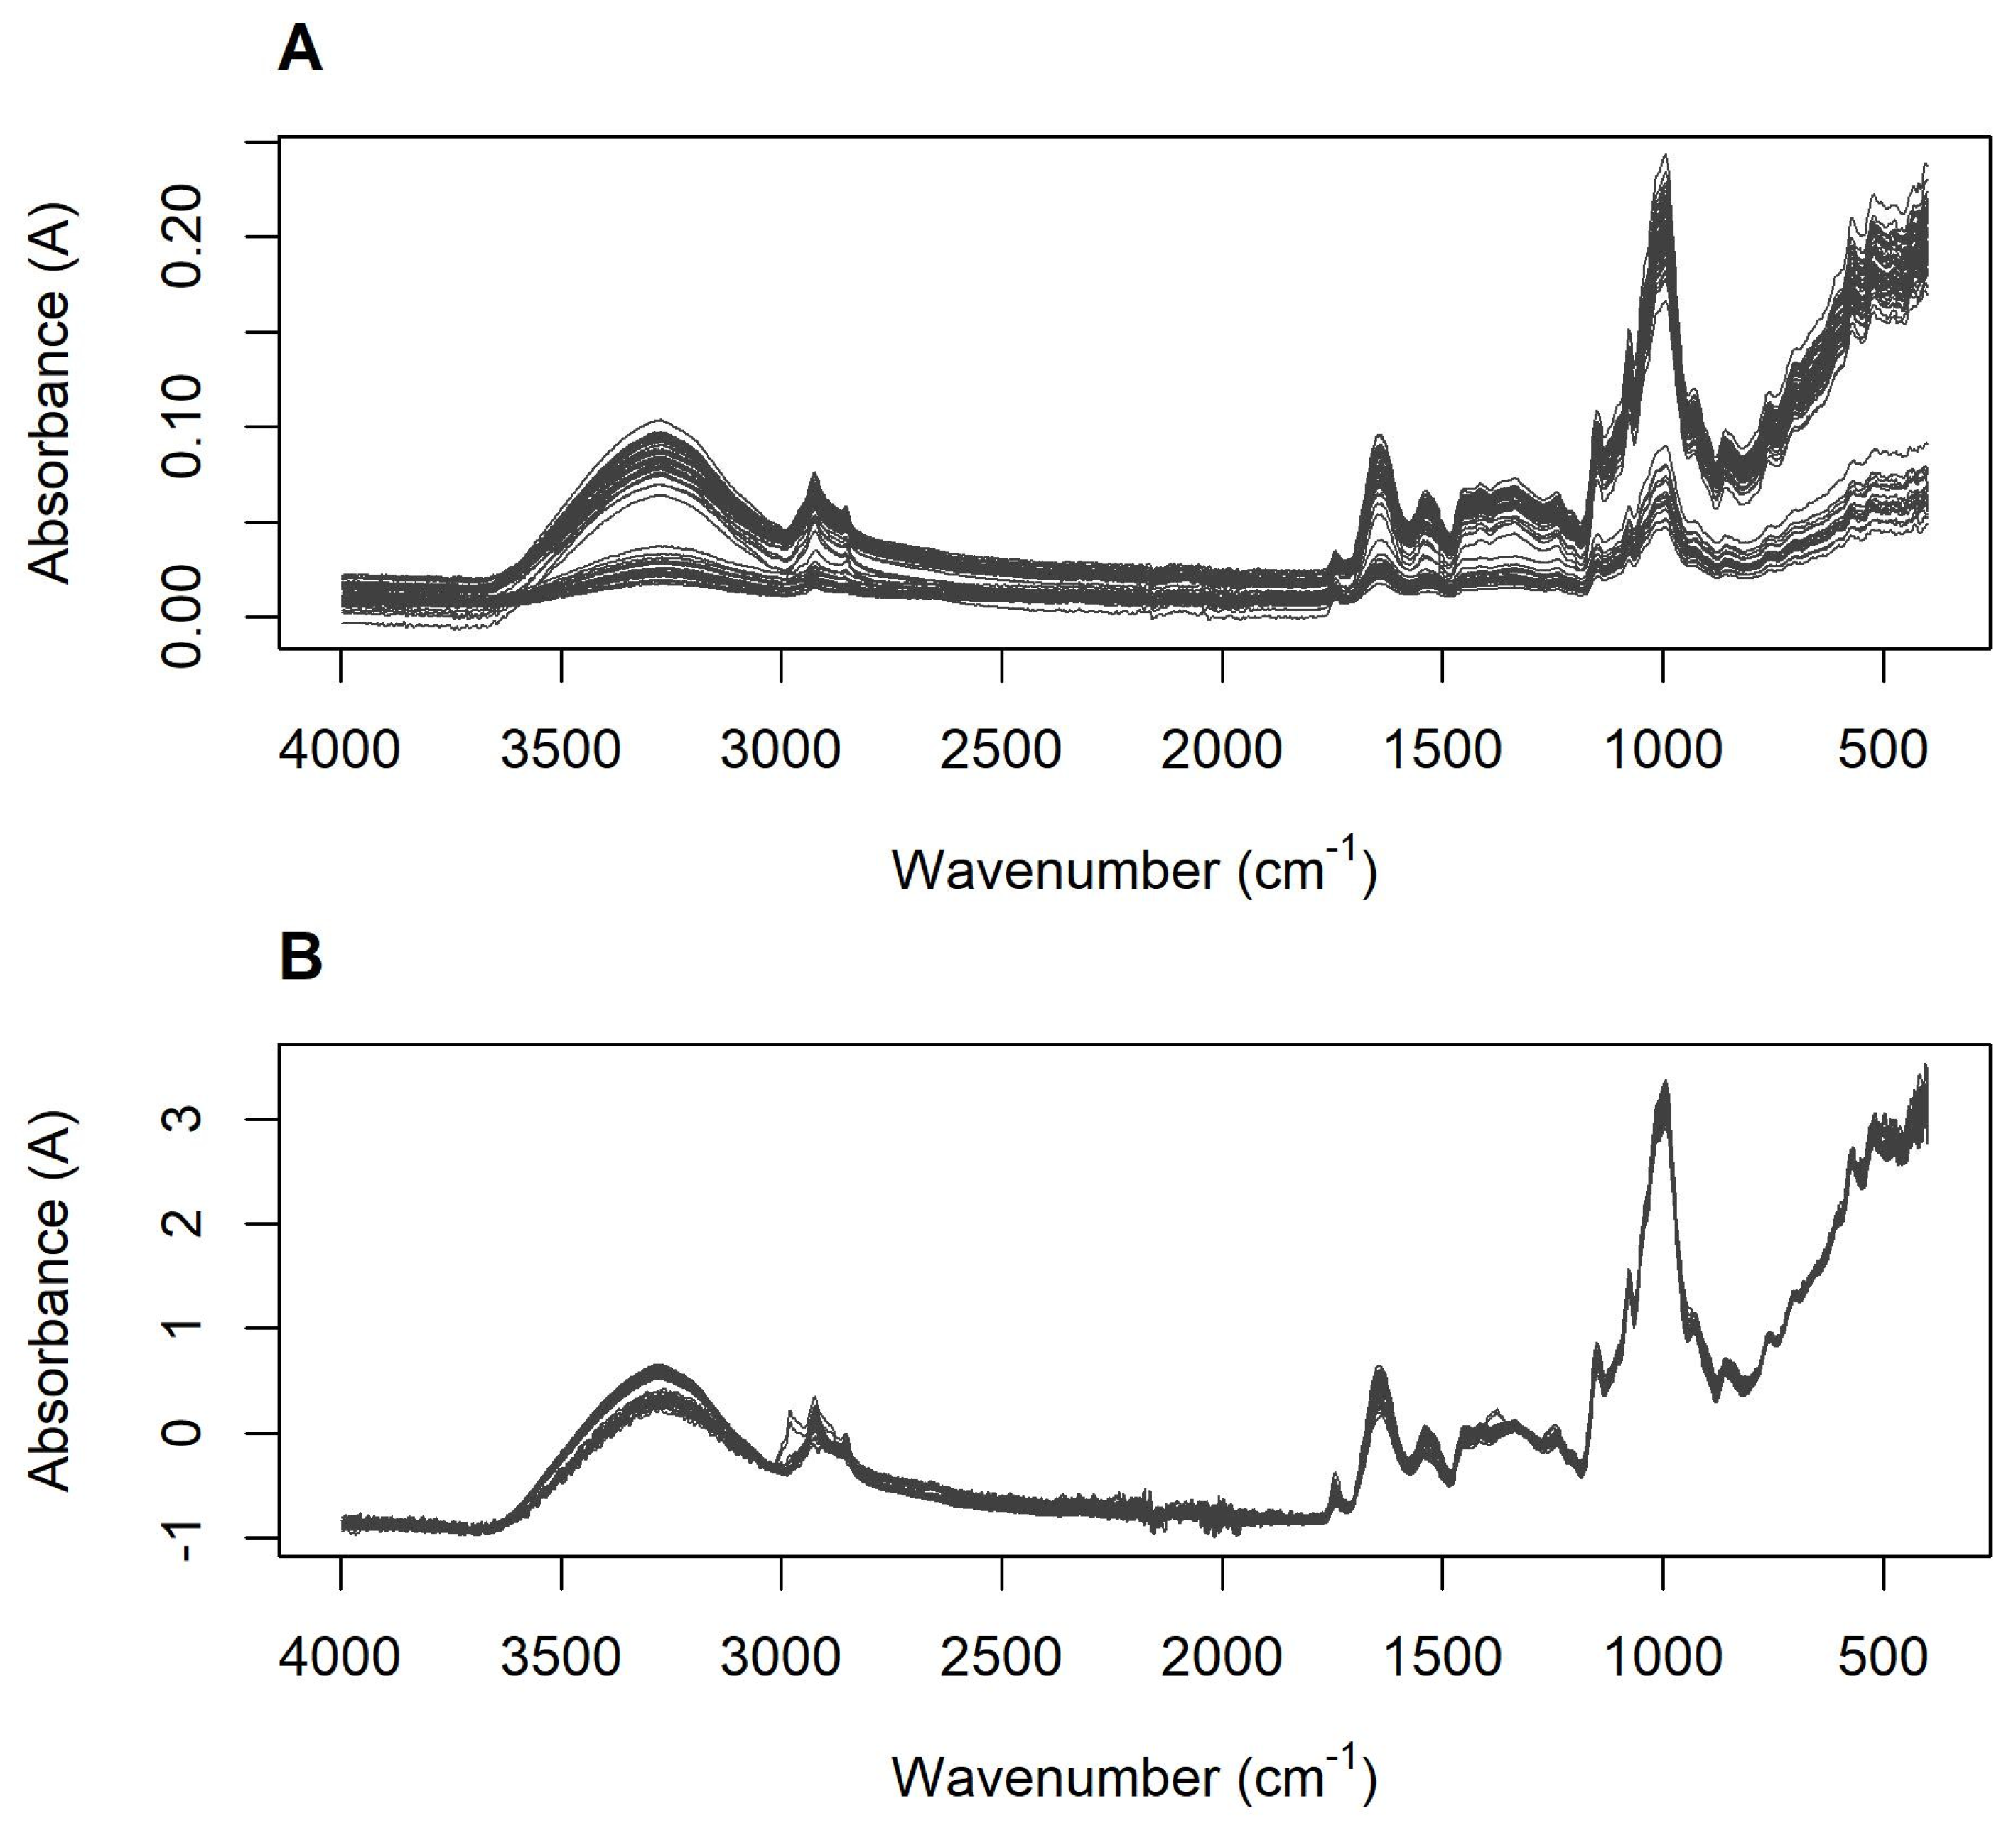
3.3. Mid-Infrared Spectra
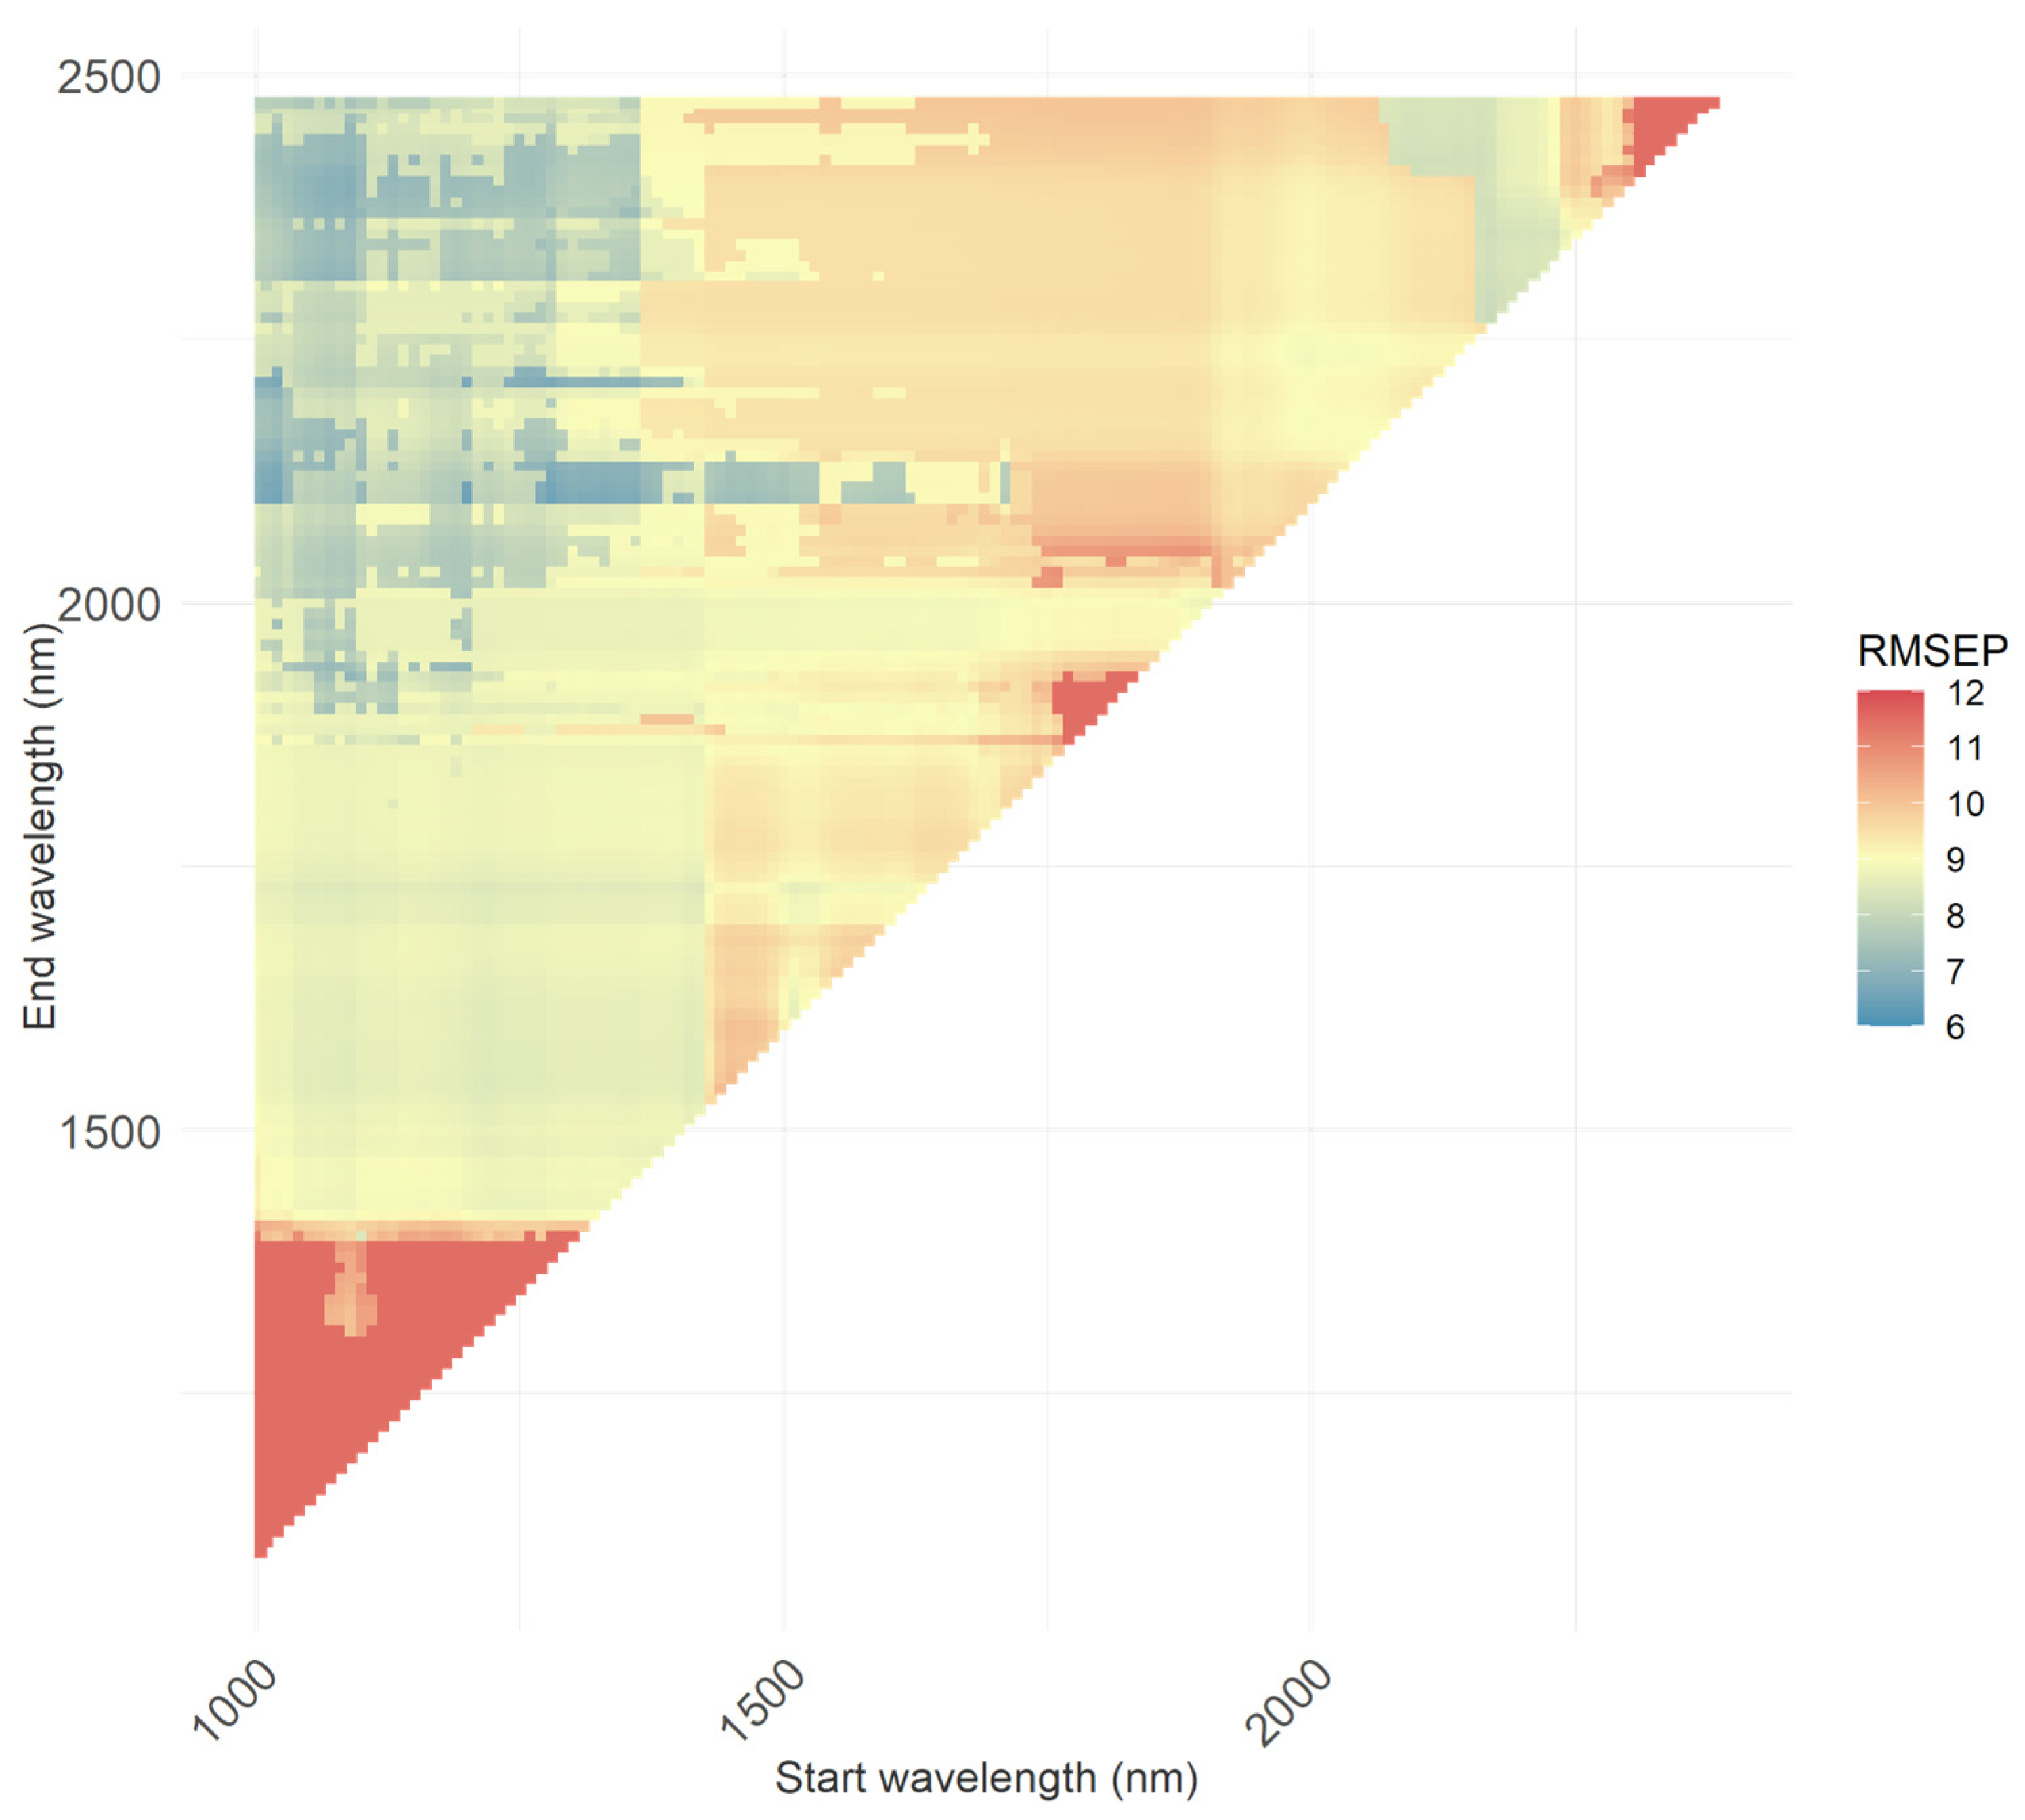
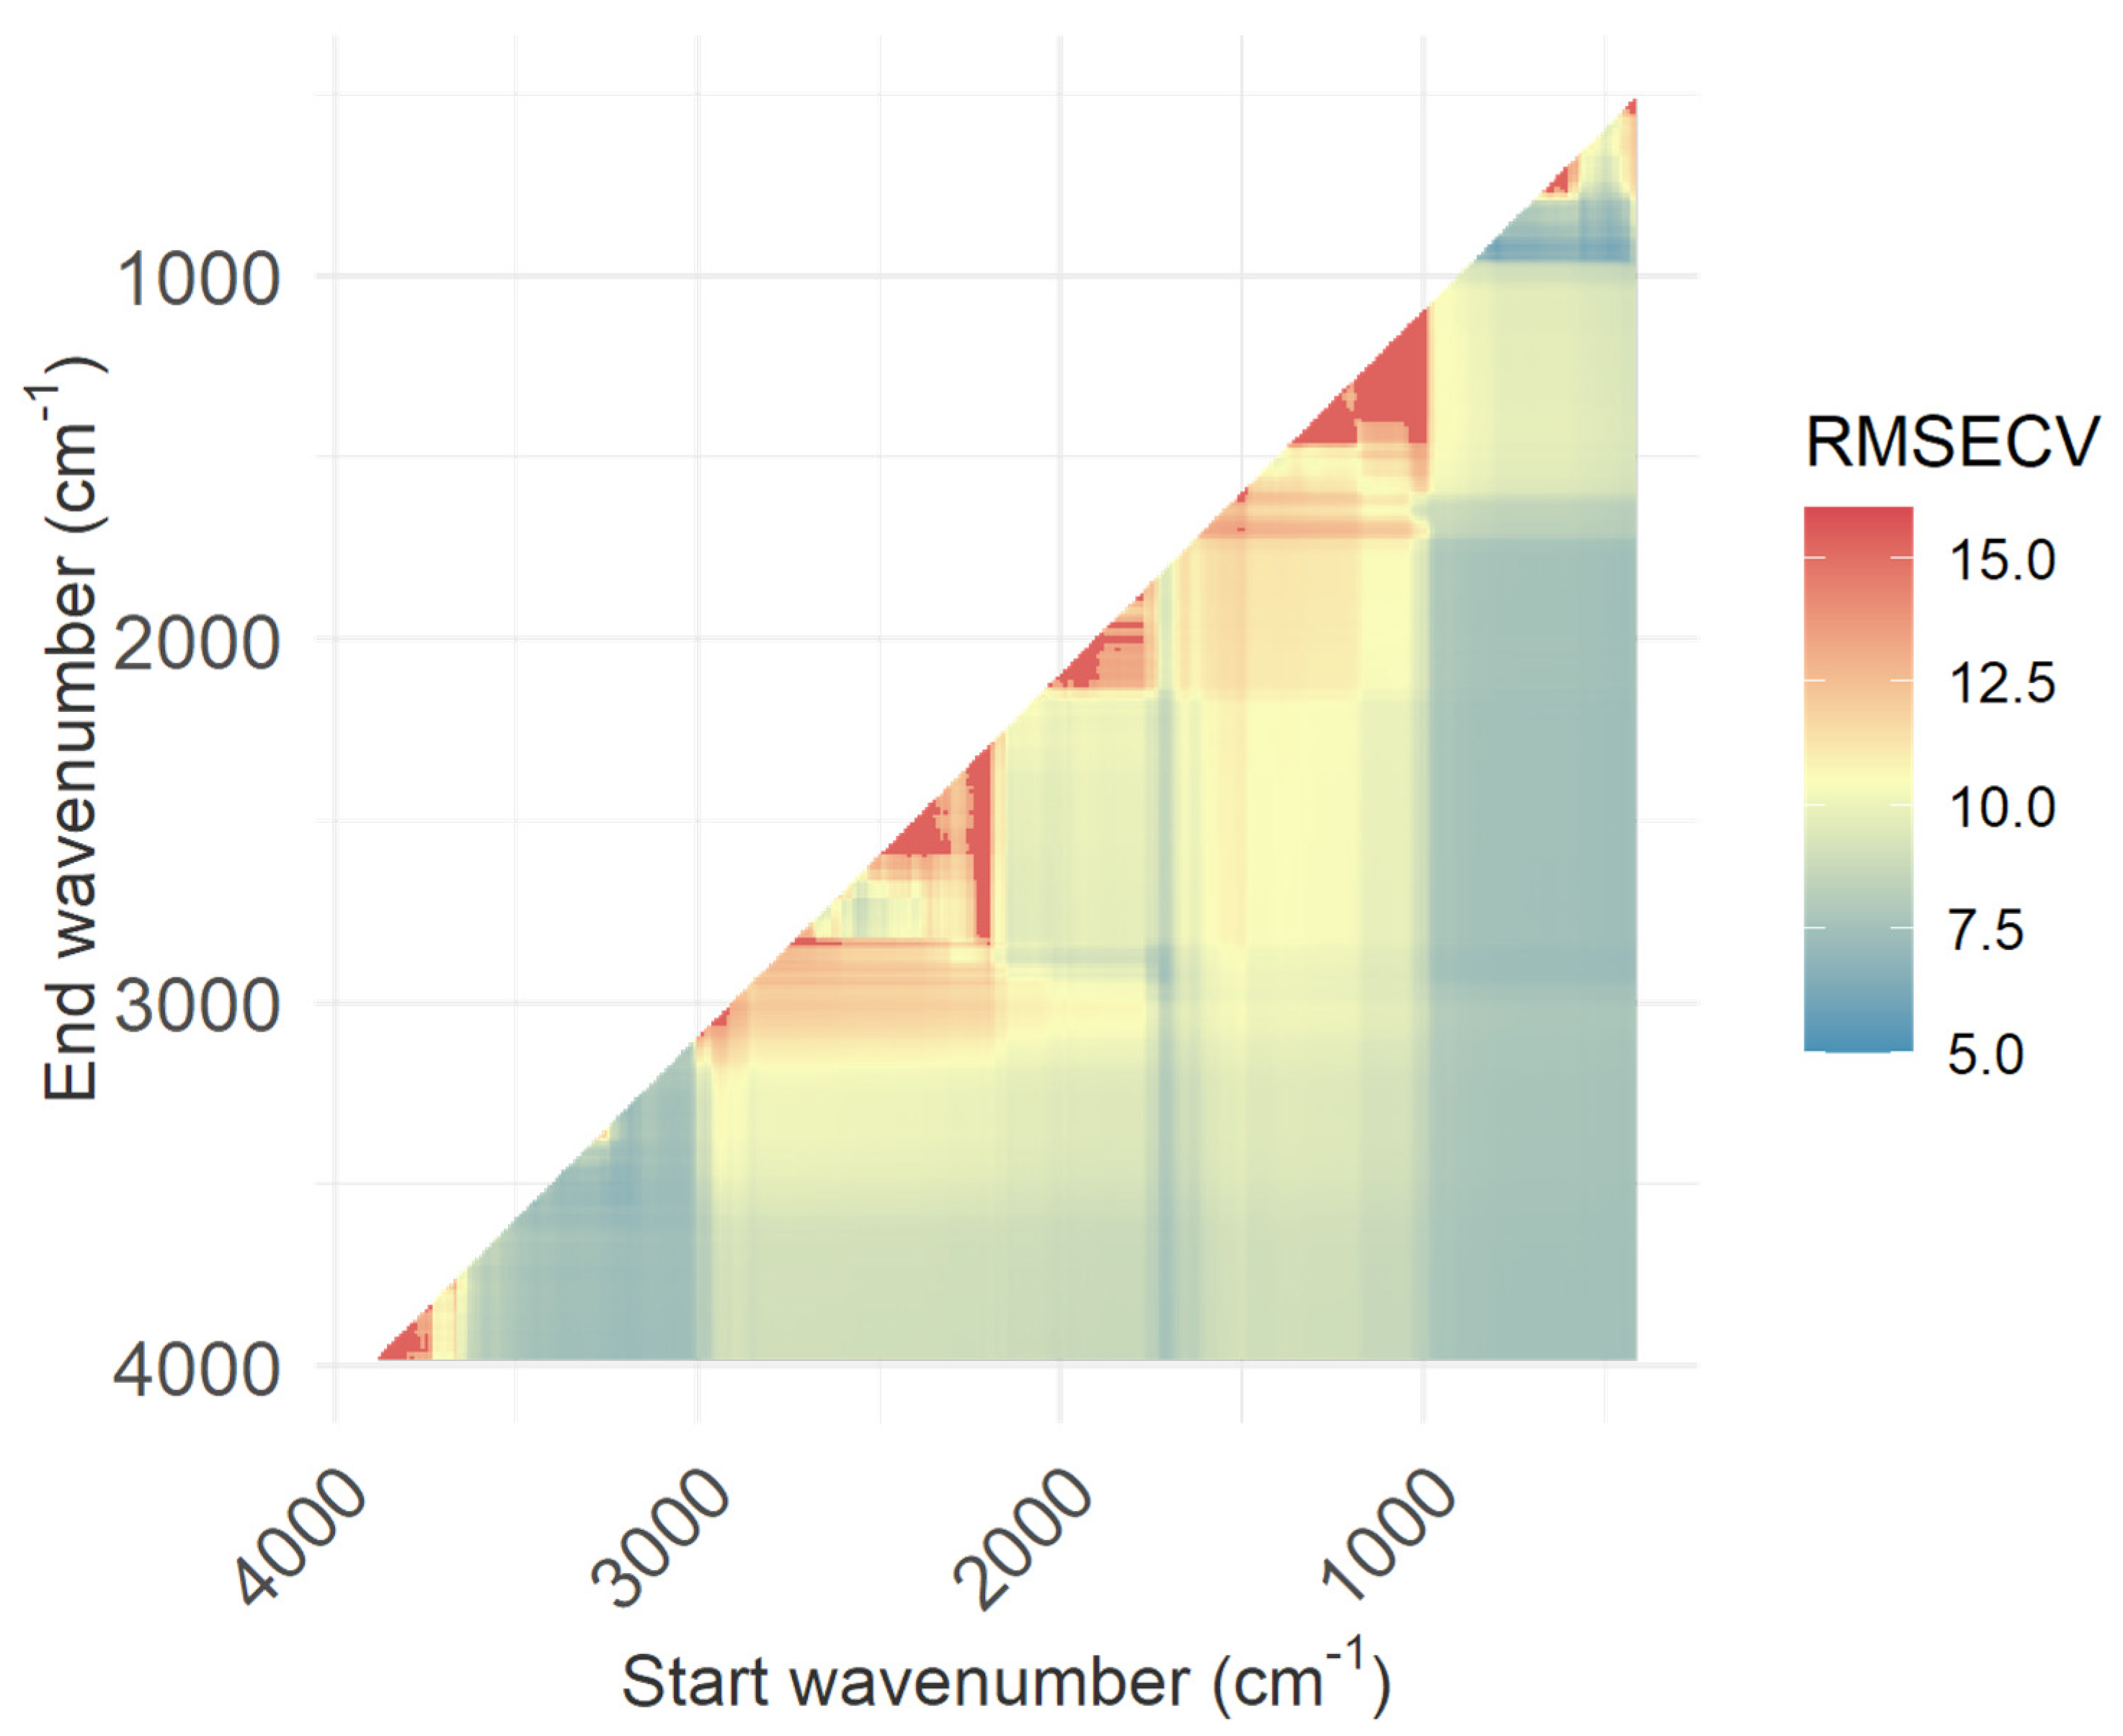
3.4. Moving Window Analysis
4. Discussion
5. Conclusions
Author Contributions
Funding
Institutional Review Board Statement
Informed Consent Statement
Data Availability Statement
Acknowledgments
Conflicts of Interest
References
- FAO. FAOSTAT. Available online: http://www.fao.org/faostat/en/#data/QC (accessed on 12 January 2023).
- Shiferaw, B.; Smale, M.; Braun, H.-J.; Duveiller, E.; Reynolds, M.; Muricho, G. Crops that feed the world 10. Past successes and future challenges to the role played by wheat in global food security. Food Secur. 2013, 5, 291–317. [Google Scholar] [CrossRef] [Green Version]
- Australian Bureau of Statistics. Agricultural Commodities, Australia. Available online: https://www.abs.gov.au/statistics/industry/agriculture/agricultural-commodities-australia/latest-release (accessed on 12 January 2023).
- Rebello, C.J.; Greenway, F.L.; Finley, J.W. Whole Grains and Pulses: A Comparison of the Nutritional and Health Benefits. J. Agric. Food Chem. 2014, 62, 7029–7049. [Google Scholar] [CrossRef]
- Curran, J. The nutritional value and health benefits of pulses in relation to obesity, diabetes, heart disease and cancer. Br. J. Nutr. 2012, 108, S1–S2. [Google Scholar] [CrossRef] [Green Version]
- Dalton, S.M.C.; Tapsell, L.C.; Probst, Y. Potential Health Benefits of Whole Grain Wheat Components. Nutr. Today 2012, 47, 163–174. [Google Scholar] [CrossRef]
- Baublis, A.J.; Lu, C.; Clydesdale, F.M.; Decker, E.A. Potential of Wheat-Based Breakfast Cereals as a Source of Dietary Antioxidants. J. Am. Coll. Nutr. 2000, 19, 308S–311S. [Google Scholar] [CrossRef]
- Lu, Y.; Luthria, D.; Fuerst, E.P.; Kiszonas, A.M.; Yu, L.; Morris, C.F. Effect of Processing on Phenolic Composition of Dough and Bread Fractions Made from Refined and Whole Wheat Flour of Three Wheat Varieties. J. Agric. Food Chem. 2014, 62, 10431–10436. [Google Scholar] [CrossRef]
- Kaur, N.; Singh, B.; Kaur, A.; Yadav, M.P.; Singh, N.; Ahlawat, A.K.; Singh, A.M. Effect of growing conditions on proximate, mineral, amino acid, phenolic composition and antioxidant properties of wheatgrass from different wheat (Triticum aestivum L.) varieties. Food Chem. 2021, 341, 128201. [Google Scholar] [CrossRef]
- Tian, W.; Chen, G.; Tilley, M.; Li, Y. Changes in phenolic profiles and antioxidant activities during the whole wheat bread-making process. Food Chem. 2021, 345, 128851. [Google Scholar] [CrossRef]
- Tian, W.; Chen, G.; Gui, Y.; Zhang, G.; Li, Y. Rapid quantification of total phenolics and ferulic acid in whole wheat using UV–Vis spectrophotometry. Food Control 2021, 123, 107691. [Google Scholar] [CrossRef]
- Li, L.; Shewry, P.R.; Ward, J.L. Phenolic acids in wheat varieties in the HEALTHGRAIN diversity screen. J. Agric. Food Chem. 2008, 56, 9732–9739. [Google Scholar] [CrossRef]
- Ye, D.; Sun, L.; Zou, B.; Zhang, Q.; Tan, W.; Che, W. Non-destructive prediction of protein content in wheat using NIRS. Spectrochim. Acta Part A Mol. Biomol. Spectrosc. 2018, 189, 463–472. [Google Scholar] [CrossRef]
- Stubbs, T.L.; Kennedy, A.C.; Fortuna, A.-M. Using NIRS to predict fiber and nutrient content of dryland cereal cultivars. J. Agric. Food Chem. 2010, 58, 398–403. [Google Scholar] [CrossRef]
- Peng, J.; Zhang, Z.-m. Rapid determination of starch and amylose content in whole wheat seeds by near infrared reflectance spectroscopy (NIRS). J. Triticeae Crops 2010, 30, 276–279. [Google Scholar]
- Williams, P.C. Application of chemometrics to prediction of some wheat quality factors by near-infrared spectroscopy. Cereal Chem. 2020, 97, 958–966. [Google Scholar] [CrossRef]
- Johnson, J.B.; Walsh, K.B.; Naiker, M.; Ameer, K. The Use of Infrared Spectroscopy for the Quantification of Bioactive Compounds in Food: A Review. Molecules 2023, 28, 3215. [Google Scholar] [CrossRef]
- Walsh, K.B.; Blasco, J.; Zude-Sasse, M.; Sun, X. Visible-NIR ‘point’ spectroscopy in postharvest fruit and vegetable assessment: The science behind three decades of commercial use. Postharvest Biol. Technol. 2020, 168, 111246. [Google Scholar] [CrossRef]
- Pasquini, C. Near infrared spectroscopy: A mature analytical technique with new perspectives–A review. Anal. Chim. Acta 2018, 1026, 8–36. [Google Scholar] [CrossRef]
- Zhang, C.; Shen, Y.; Chen, J.; Xiao, P.; Bao, J. Nondestructive prediction of total phenolics, flavonoid contents, and antioxidant capacity of rice grain using near-infrared spectroscopy. J. Agric. Food Chem. 2008, 56, 8268–8272. [Google Scholar] [CrossRef]
- Wiedemair, V.; Ramoner, R.; Huck, C.W. Investigations into the total antioxidant capacities of cultivars of gluten-free grains using near-infrared spectroscopy. Food Control 2019, 95, 189–195. [Google Scholar] [CrossRef]
- Johnson, J.; Collins, T.; Skylas, D.; Naiker, M. ATR-MIR: A valuable tool for the rapid assessment of biochemically active compounds in grains. In Proceedings of the 69th Australasian Grain Science Conference, Carlton, Melbourne, Australia, 27–29 August 2019; pp. 73–79. [Google Scholar]
- Tian, W.; Chen, G.; Zhang, G.; Wang, D.; Tilley, M.; Li, Y. Rapid determination of total phenolic content of whole wheat flour using near-infrared spectroscopy and chemometrics. Food Chem. 2021, 344, 128633. [Google Scholar] [CrossRef]
- Skylas, D.J.; Paull, J.G.; Hughes, D.G.; Gogel, B.; Long, H.; Williams, B.; Mundree, S.; Blanchard, C.L.; Quail, K.J. Nutritional and anti-nutritional seed-quality traits of faba bean (Vicia faba) grown in South Australia. Crop Pasture Sci. 2019, 70, 463–472. [Google Scholar] [CrossRef]
- Johnson, J.; Collins, T.; Skylas, D.; Quail, K.; Blanchard, C.; Naiker, M. Profiling the Varietal Antioxidative Content and Macrochemical Composition in Australian Faba Beans (Vicia faba L.). Legume Sci. 2020, 2, e28. [Google Scholar] [CrossRef] [Green Version]
- R Core Team. R: A Language and Environment for Statistical Computing, Version 4.2.3. R Foundation for Statistical Computing: Vienna, Austria, 2023.
- Savitzky, A.; Golay, M.J. Smoothing and differentiation of data by simplified least squares procedures. Anal. Chem. 1964, 36, 1627–1639. [Google Scholar] [CrossRef]
- Johnson, J.B.; Mani, J.S.; Walsh, K.B.; Naiker, M. Infrared spectroscopy for the quality assessment of Habanero chilli: A proof-of-concept study. J. Food Meas. Charact. 2023, 17, 1764–1774. [Google Scholar] [CrossRef]
- Ziegler, J.U.; Leitenberger, M.; Longin, C.F.H.; Würschum, T.; Carle, R.; Schweiggert, R.M. Near-infrared reflectance spectroscopy for the rapid discrimination of kernels and flours of different wheat species. J. Food Compos. Anal. 2016, 51, 30–36. [Google Scholar] [CrossRef]
- Rodríguez, S.D.; López-Fernández, M.P.; Maldonado, S.; Buera, M.P. Evidence on the discrimination of quinoa grains with a combination of FT-MIR and FT-NIR spectroscopy. J. Food Sci. Technol. 2019, 56, 4457–4464. [Google Scholar] [CrossRef]
- De Girolamo, A.; Cortese, M.; Cervellieri, S.; Lippolis, V.; Pascale, M.; Logrieco, A.F.; Suman, M. Tracing the Geographical Origin of Durum Wheat by FT-NIR Spectroscopy. Foods 2019, 8, 450. [Google Scholar] [CrossRef] [Green Version]
- Kays, S.E.; Barton, F.E.; Windham, W.R. Predicting Protein Content by near Infrared Reflectance Spectroscopy in Diverse Cereal Food Products. J. Near Infrared Spectrosc. 2000, 8, 35–43. [Google Scholar] [CrossRef]
- Ji, Y.; Yang, X.; Ji, Z.; Zhu, L.; Ma, N.; Chen, D.; Jia, X.; Tang, J.; Cao, Y. DFT-Calculated IR Spectrum Amide I, II, and III Band Contributions of N-Methylacetamide Fine Components. ACS Omega 2020, 5, 8572–8578. [Google Scholar] [CrossRef] [Green Version]
- Nicolaï, B.M.; Beullens, K.; Bobelyn, E.; Peirs, A.; Saeys, W.; Theron, K.I.; Lammertyn, J. Nondestructive measurement of fruit and vegetable quality by means of NIR spectroscopy: A review. Postharvest Biol. Technol. 2007, 46, 99–118. [Google Scholar] [CrossRef]
- Başlar, M.; Ertugay, M.F. Determination of protein and gluten quality-related parameters of wheat flour using near-infrared reflectance spectroscopy (NIRS). Turk. J. Agric. For. 2011, 35, 139–144. [Google Scholar] [CrossRef]
- Igne, B.; Gibson, L.R.; Rippke, G.R.; Schwarte, A.; Hurburgh, C.R., Jr. Triticale moisture and protein content prediction by near-infrared spectroscopy (NIRS). Cereal Chem. 2007, 84, 328–330. [Google Scholar] [CrossRef]
- Redaelli, R.; Alfieri, M.; Cabassi, G. Development of a NIRS calibration for total antioxidant capacity in maize germplasm. Talanta 2016, 154, 164–168. [Google Scholar] [CrossRef] [PubMed]
- Johnson, J. Investigation of the Phenolic and Antioxidant Content in Australian Grains Using Traditional and Non-Invasive Analytical Techniques. Master’s Thesis, CQ University, Rockhampton, Australia, 2022. [Google Scholar]
- Johnson, J.B. Phenolics in Australian Grain Crops. Master’s Thesis, Mendeley Data, London, UK, 2022. [Google Scholar] [CrossRef]










| Calibration Set (n = 50) | Test Set (n = 15) | |||
|---|---|---|---|---|
| Parameter | Range | Mean ± SD (Median) | Range | Mean ± SD (Median) |
| Moisture (%) | 10.1–14.5 | 11.90 ± 1.39 (11.40) | 8.7–14.0 | 11.70 ± 1.30 (11.30) |
| Protein (%) | 10.66–17.46 | 14.16 ± 1.98 (13.84) | 11.43–16.84 | 13.97 ± 2.25 (14.19) |
| FRAP (mg TE/100 g) | 14.4–64.0 | 32.8 ± 16.4 (24.6) | 19.4–53.5 | 25.3 ± 8.5 (23.4) |
| TPC (mg GAE/100 g) | 129.7–179.8 | 149.5 ± 11.3 (151.9) | 139.0–167.6 | 151.9 ± 9.7 (146.4) |
| TMA (mg cyd-3-glu/100 g) | 0.0–10.0 | 2.5 ± 2.2 (2.2) | 0.0–3.9 | 2.0 ± 1.1 (2.6) |
| Parameter | Spectral Pre-Processing | Components | R2cv | RMSECV | RPD | R2test | RMSEP | Bias | Slope | Intercept |
|---|---|---|---|---|---|---|---|---|---|---|
| Moisture | SNV + 1d15 | 6 | 0.84 | 0.56 | 2.49 | 0.76 | 0.62 | −0.04 | 0.966 | 0.35 |
| Protein | SNV | 5 | 0.974 | 0.32 | 6.25 | 0.991 | 0.22 | −0.06 | 0.998 | −0.03 |
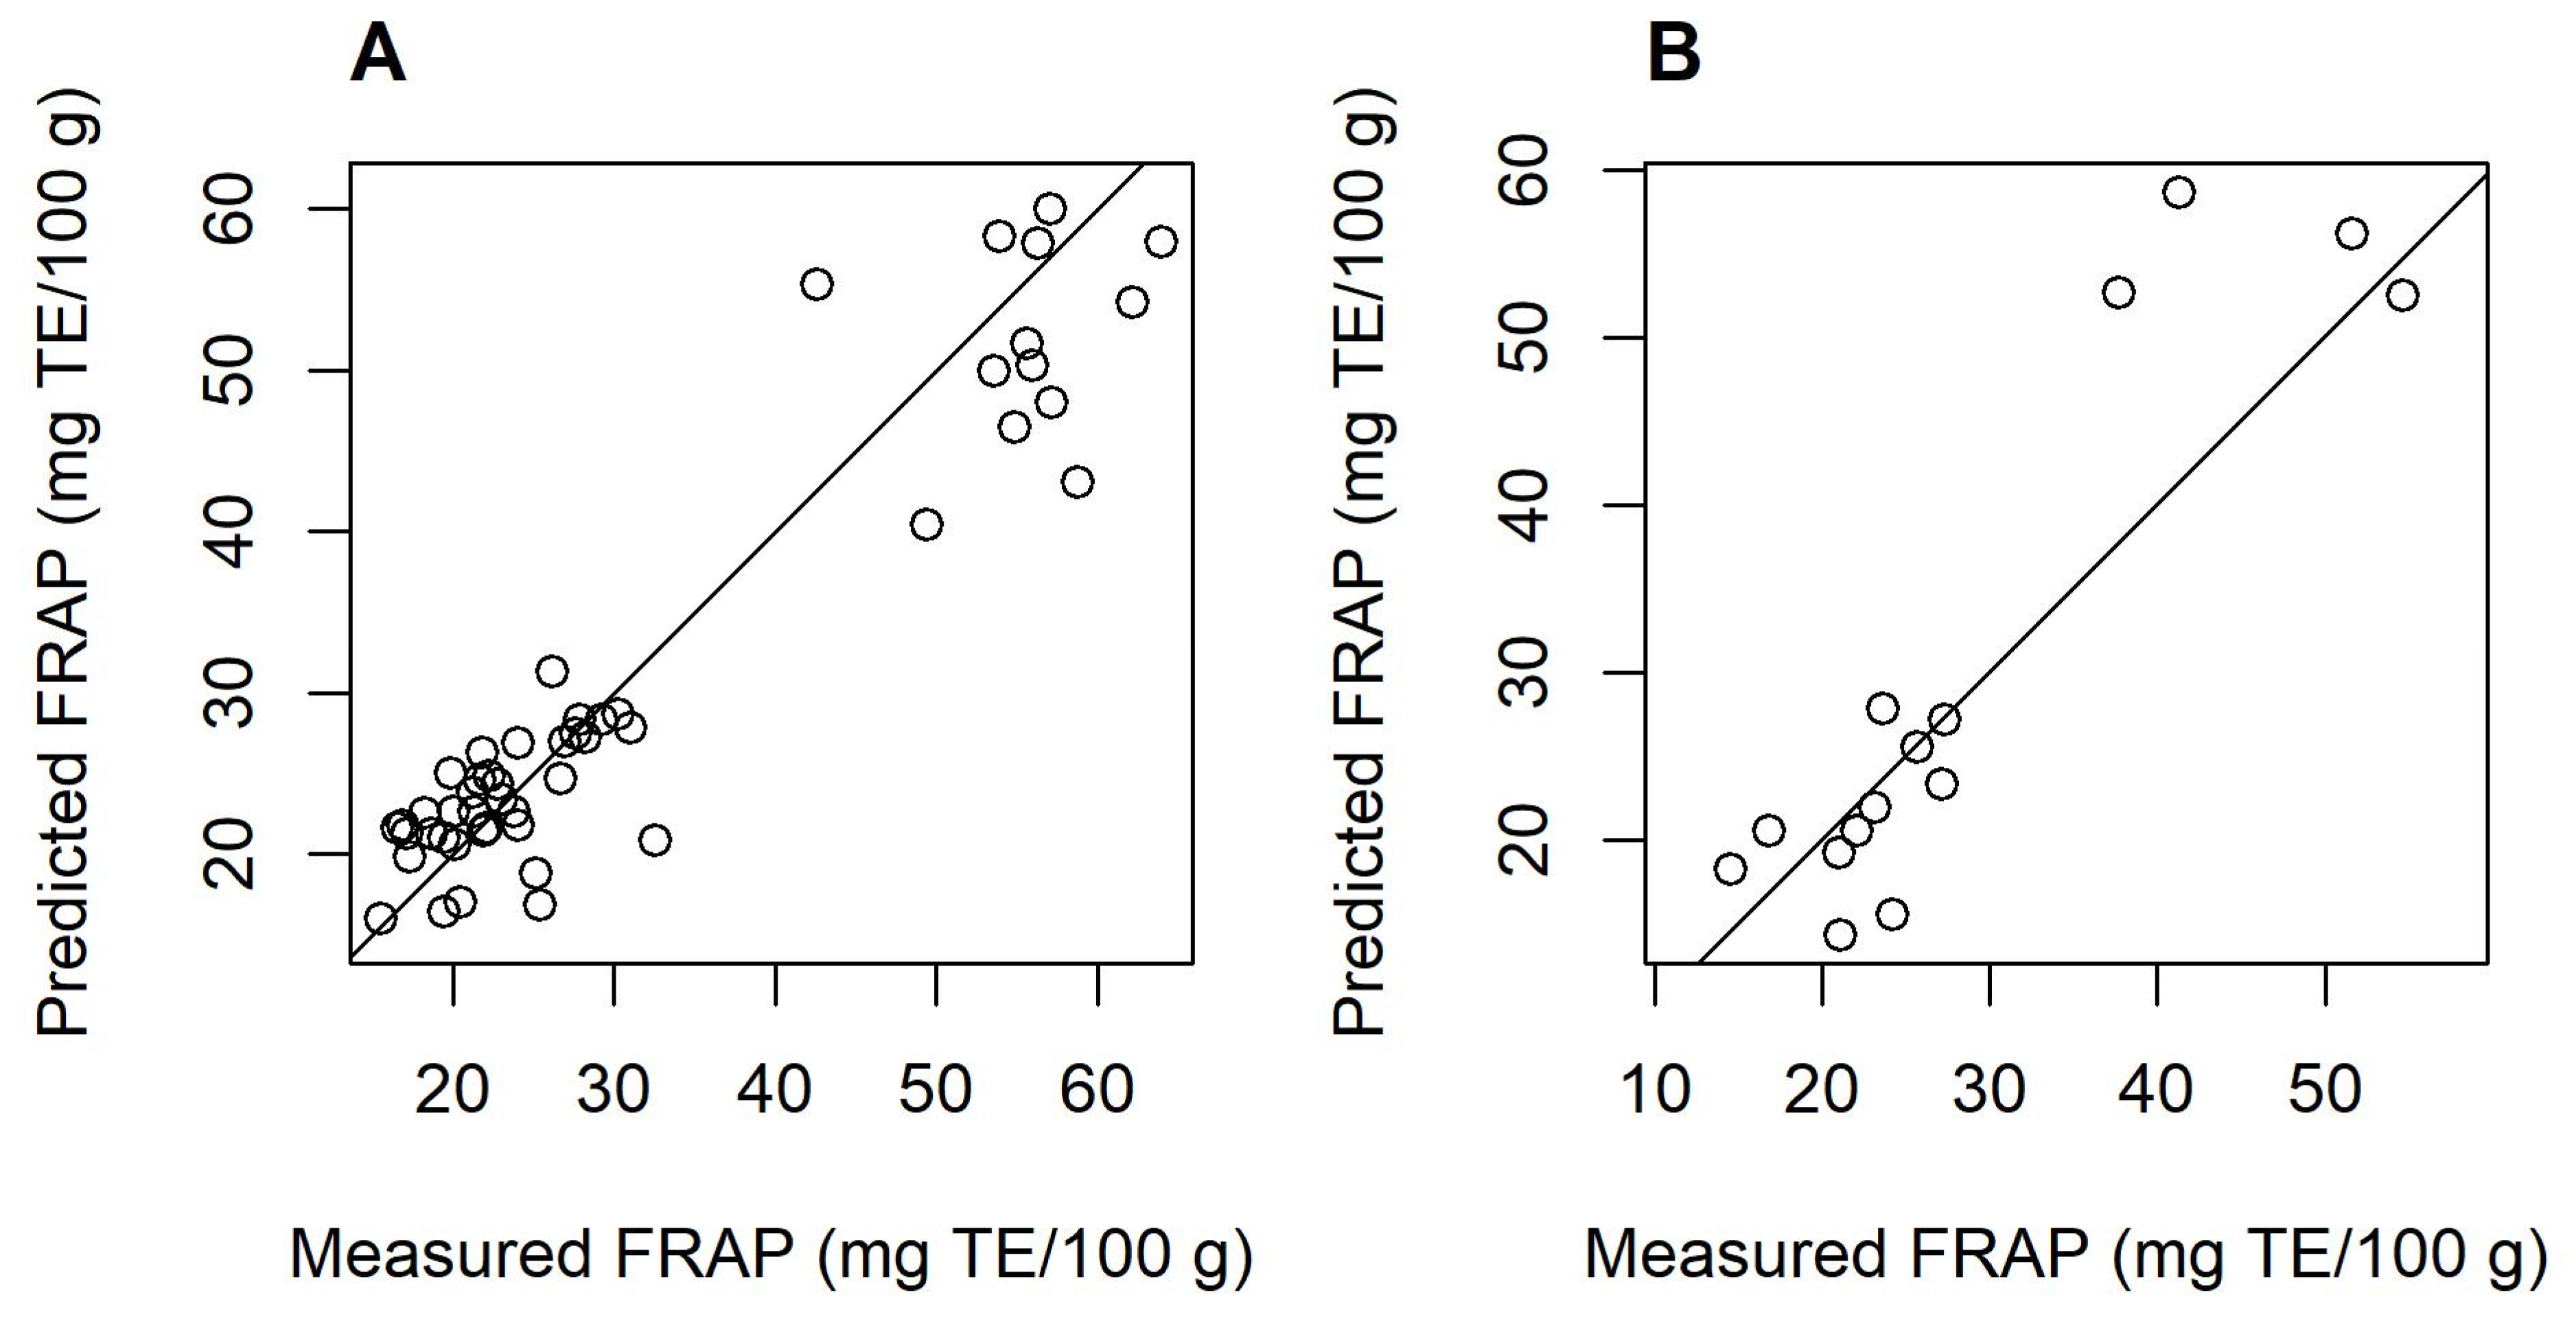
| FRAP | SNV | 6 | 0.88 | 5.6 | 2.95 | 0.917 | 5.4 | −0.64 | 0.620 | 9.2 |
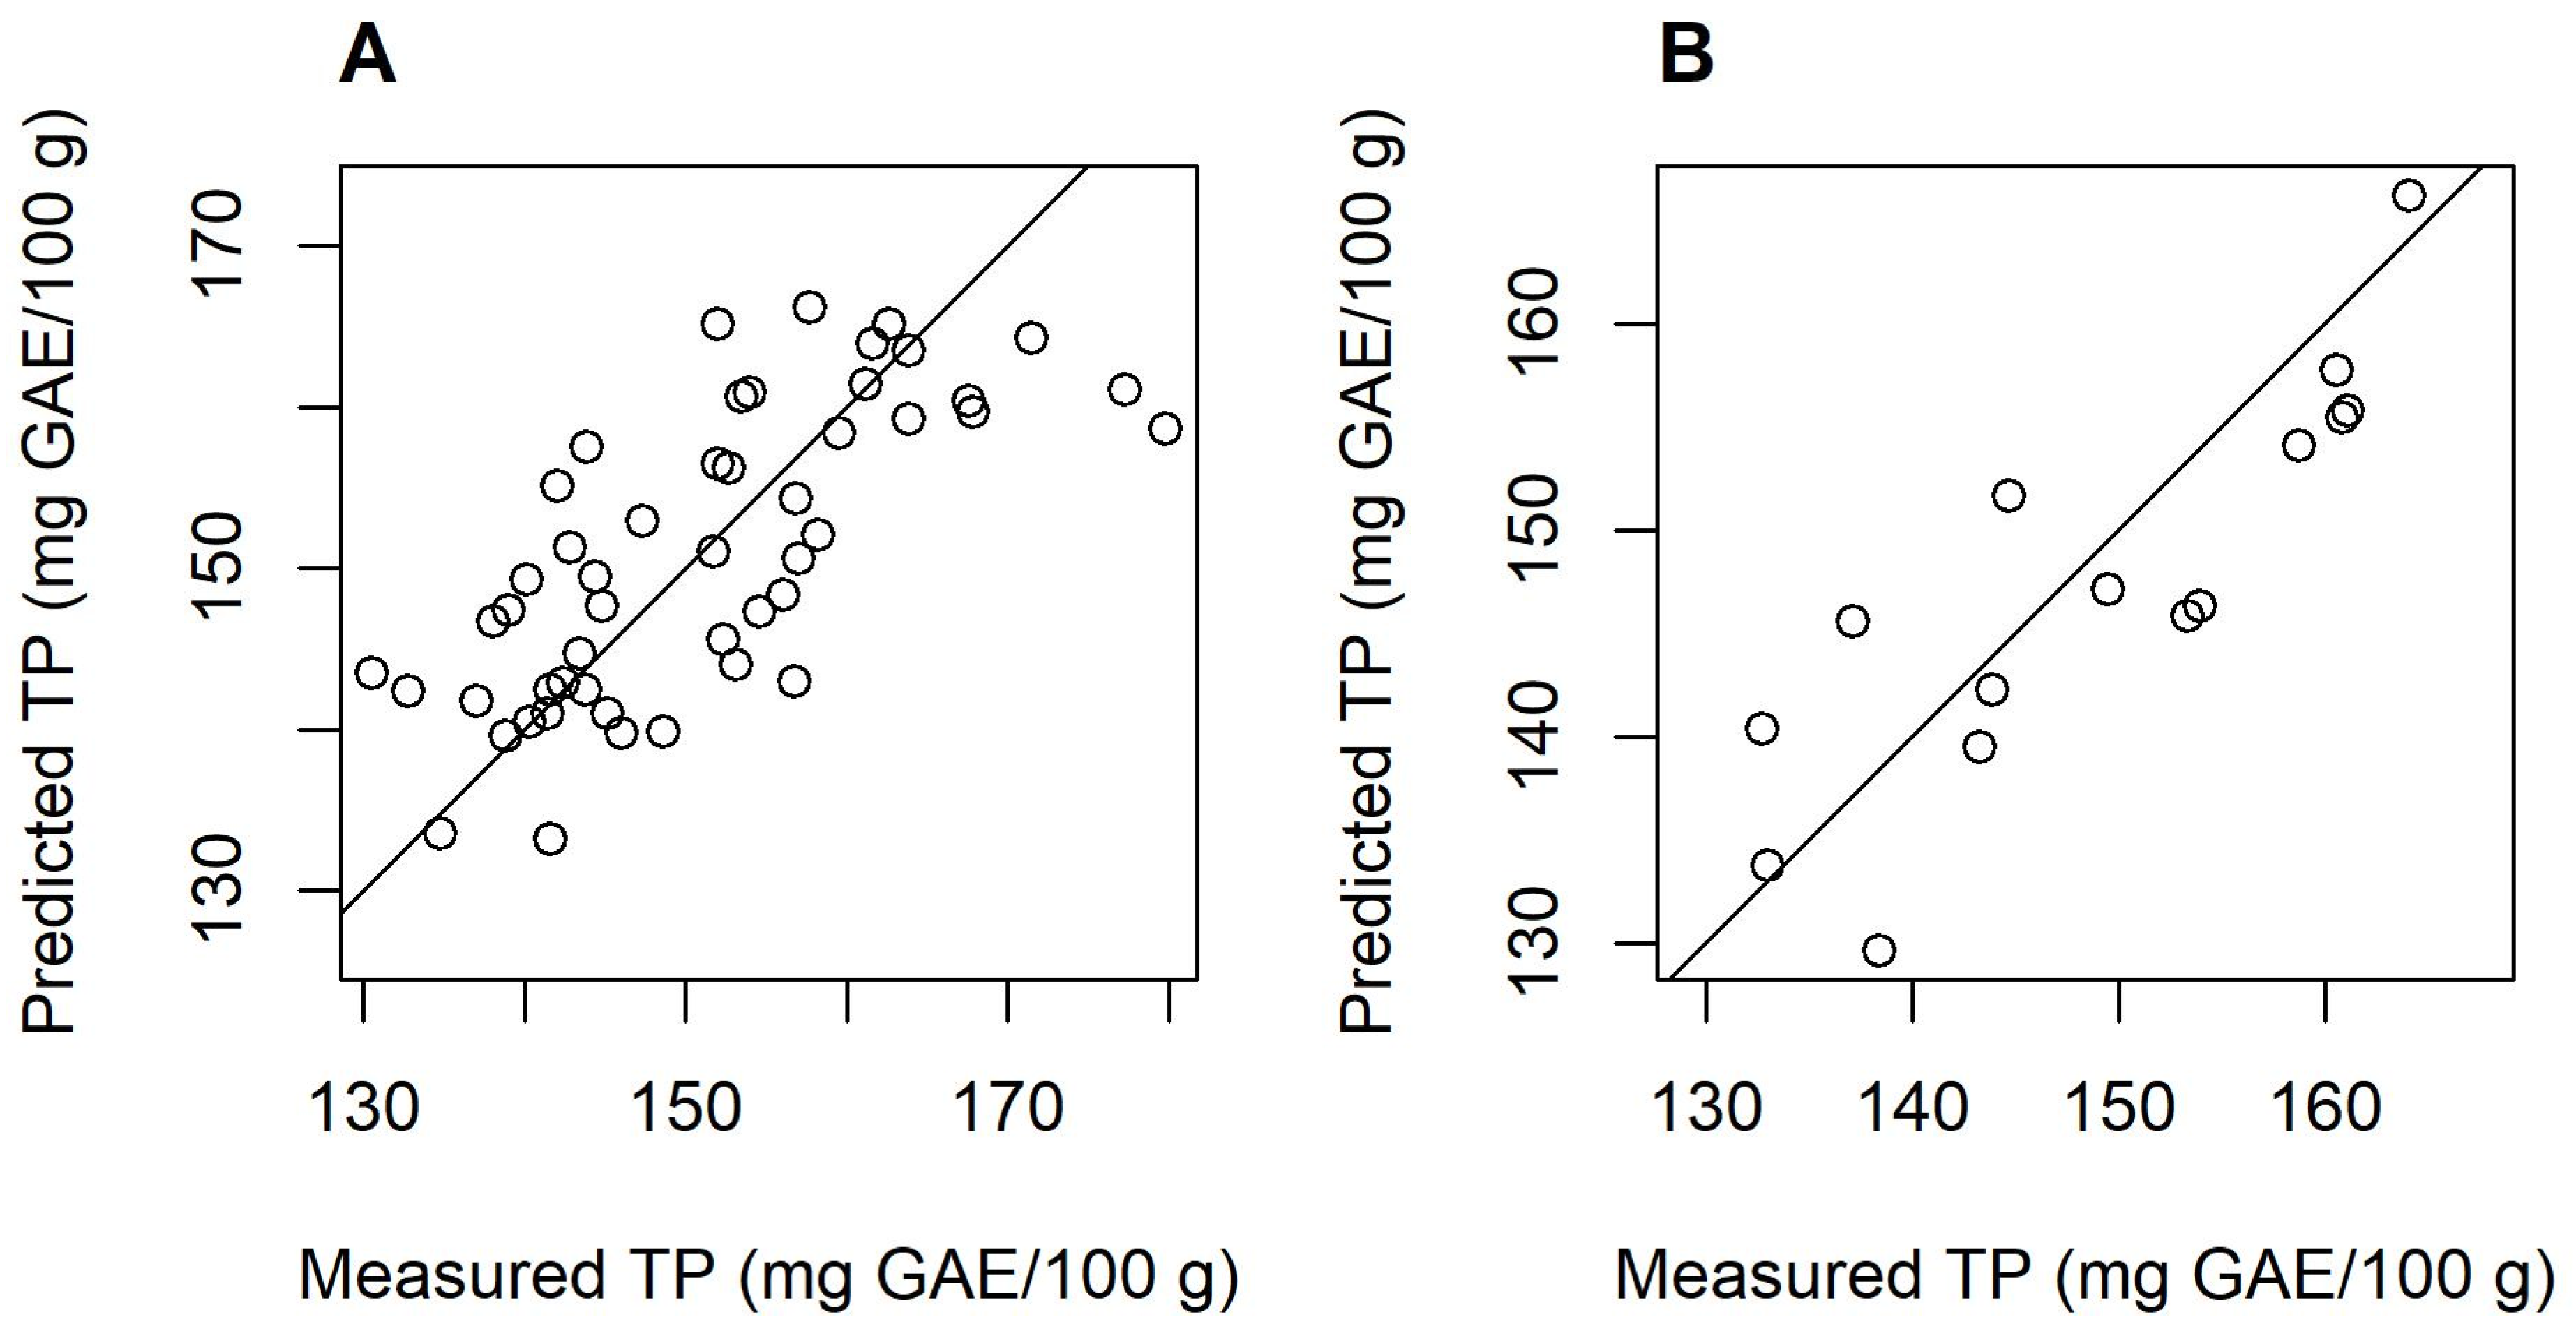
| TPC | SNV + 1d21 | 5 | 0.61 | 7.0 | 1.62 | 0.83 | 3.9 | −0.10 | 0.907 | 14.1 |
| TMA | 1d11 | 4 | 0.05 | 2.1 | 1.03 | 0.00 | 1.9 | −0.63 | 0.02 | 1.98 |
| Parameter | Spectral Pre-Processing | Components | R2cv | RMSECV | RPD | R2test | RMSEP | Bias | Slope | Intercept |
|---|---|---|---|---|---|---|---|---|---|---|
| Moisture | 1d21 | 4 | 0.86 | 0.52 | 2.65 | 0.83 | 0.65 | 0.08 | 1.45 | −5.10 |
| Protein | SNV + 2d15 | 6 | 0.92 | 0.55 | 3.65 | 0.93 | 0.62 | −0.10 | 0.89 | 1.40 |
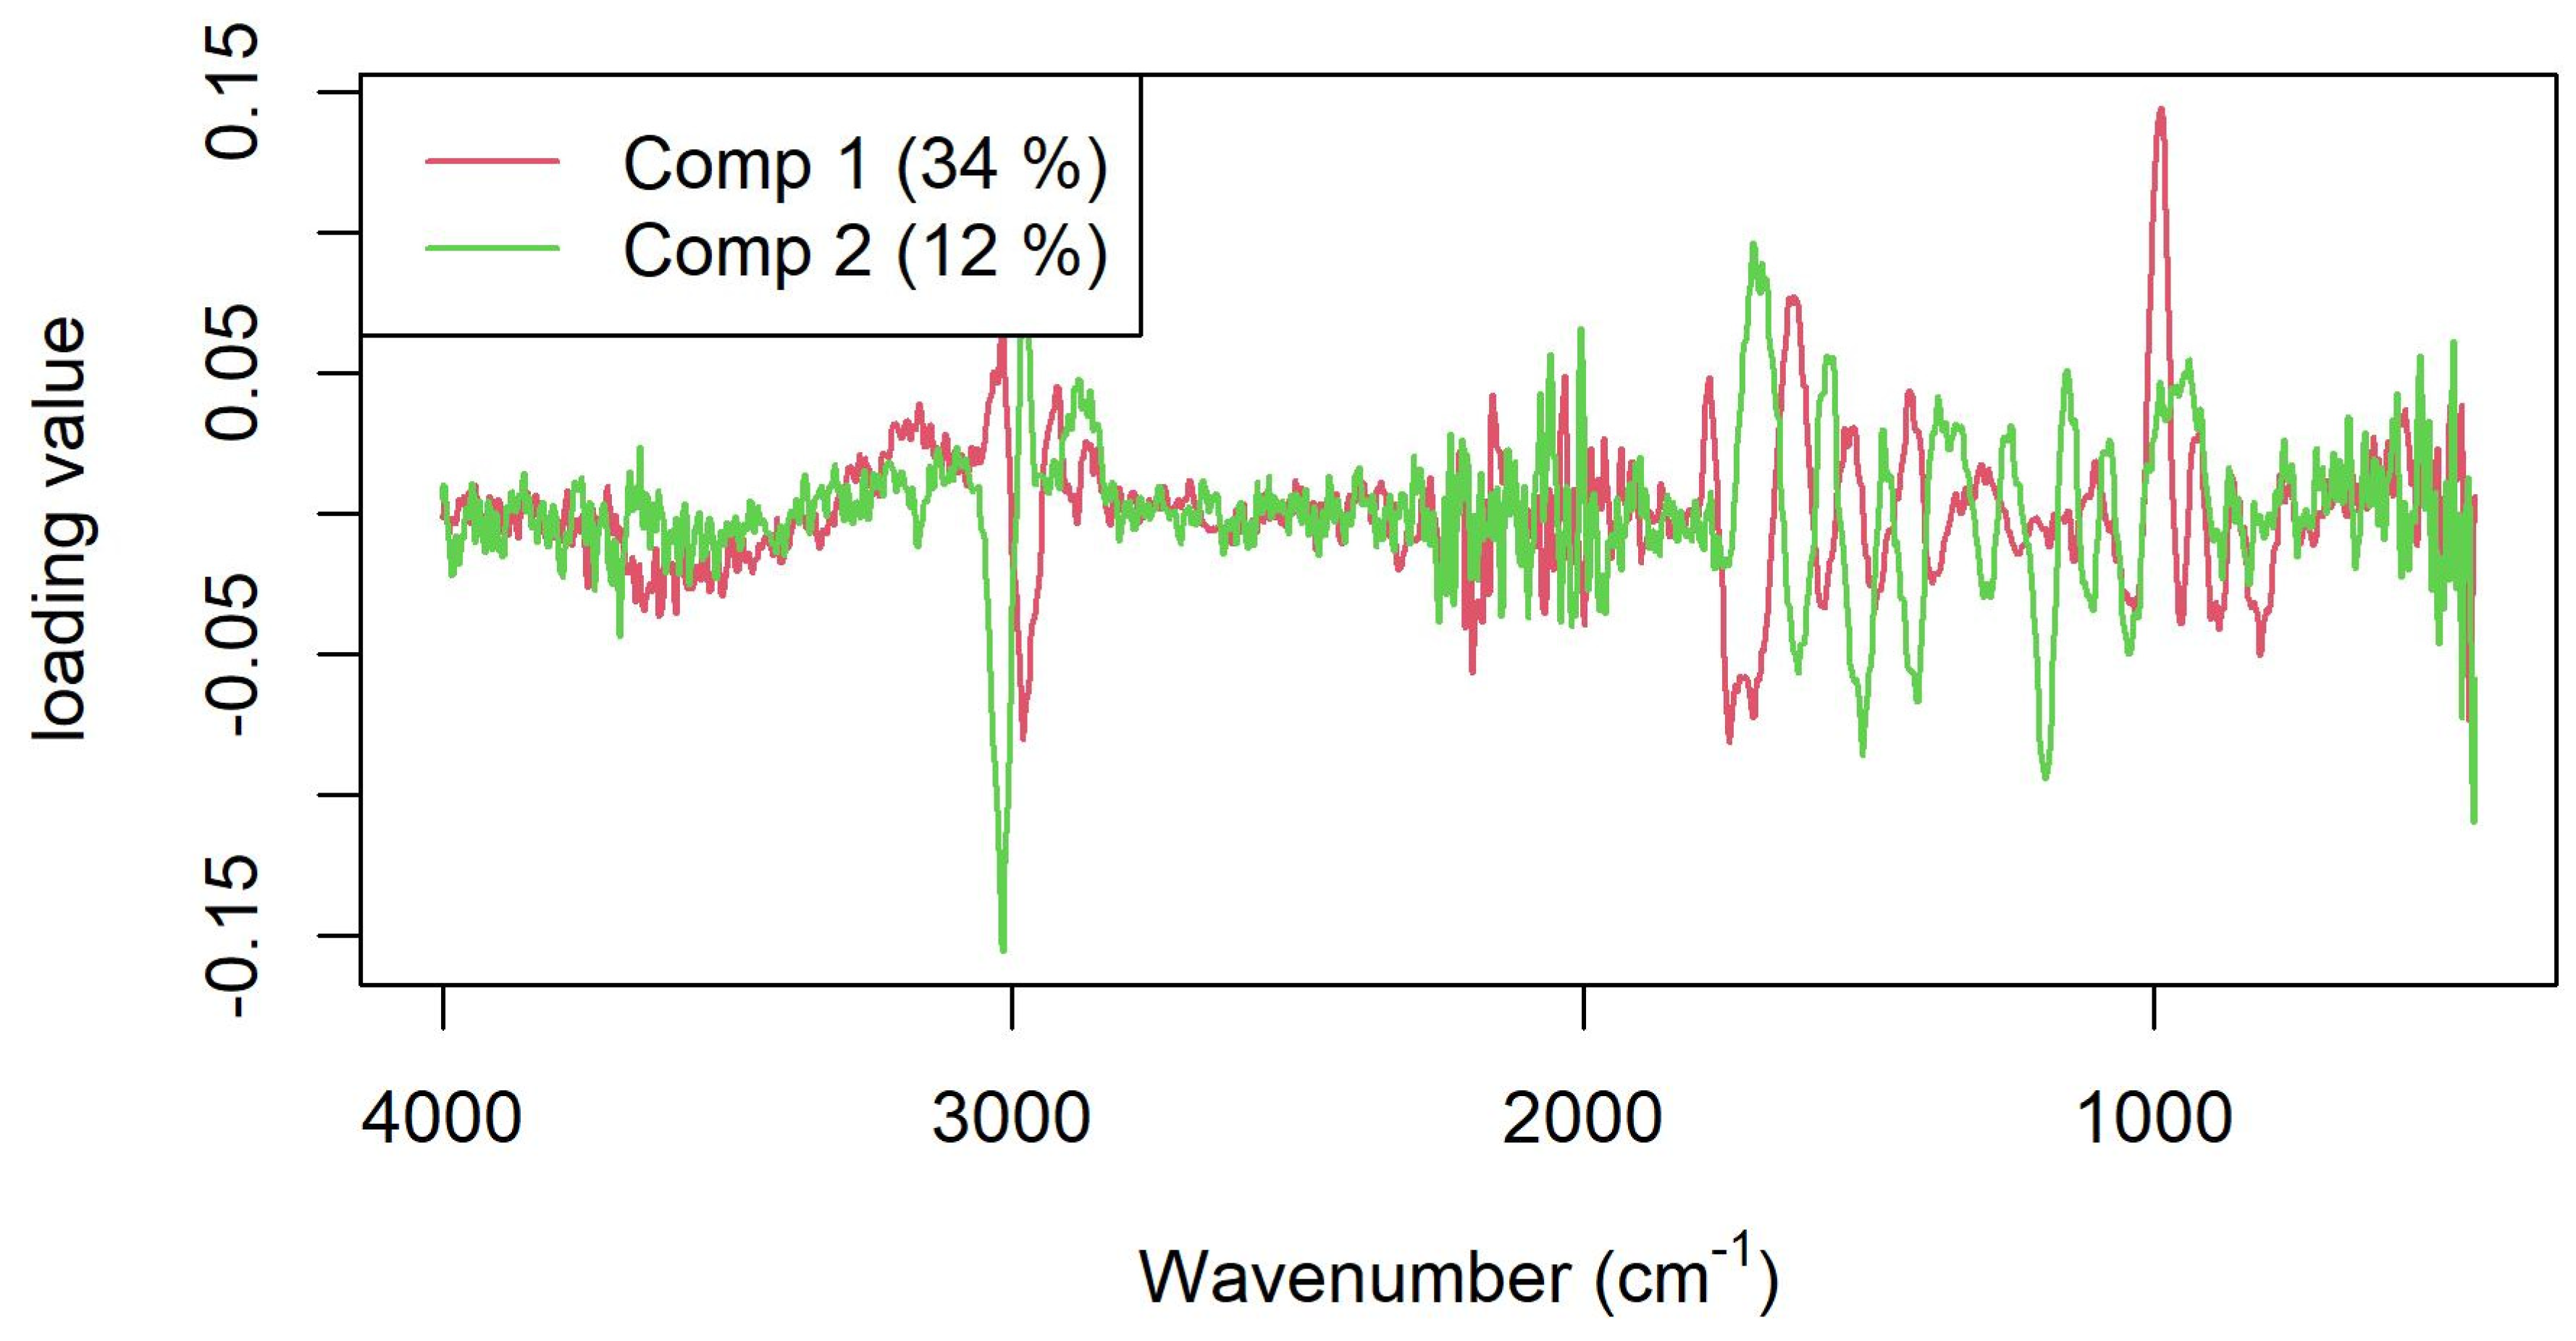
| FRAP | SNV + 1d15 | 6 | 0.88 | 5.2 | 2.93 | 0.83 | 7.0 | 1.56 | 1.20 | −4.21 |
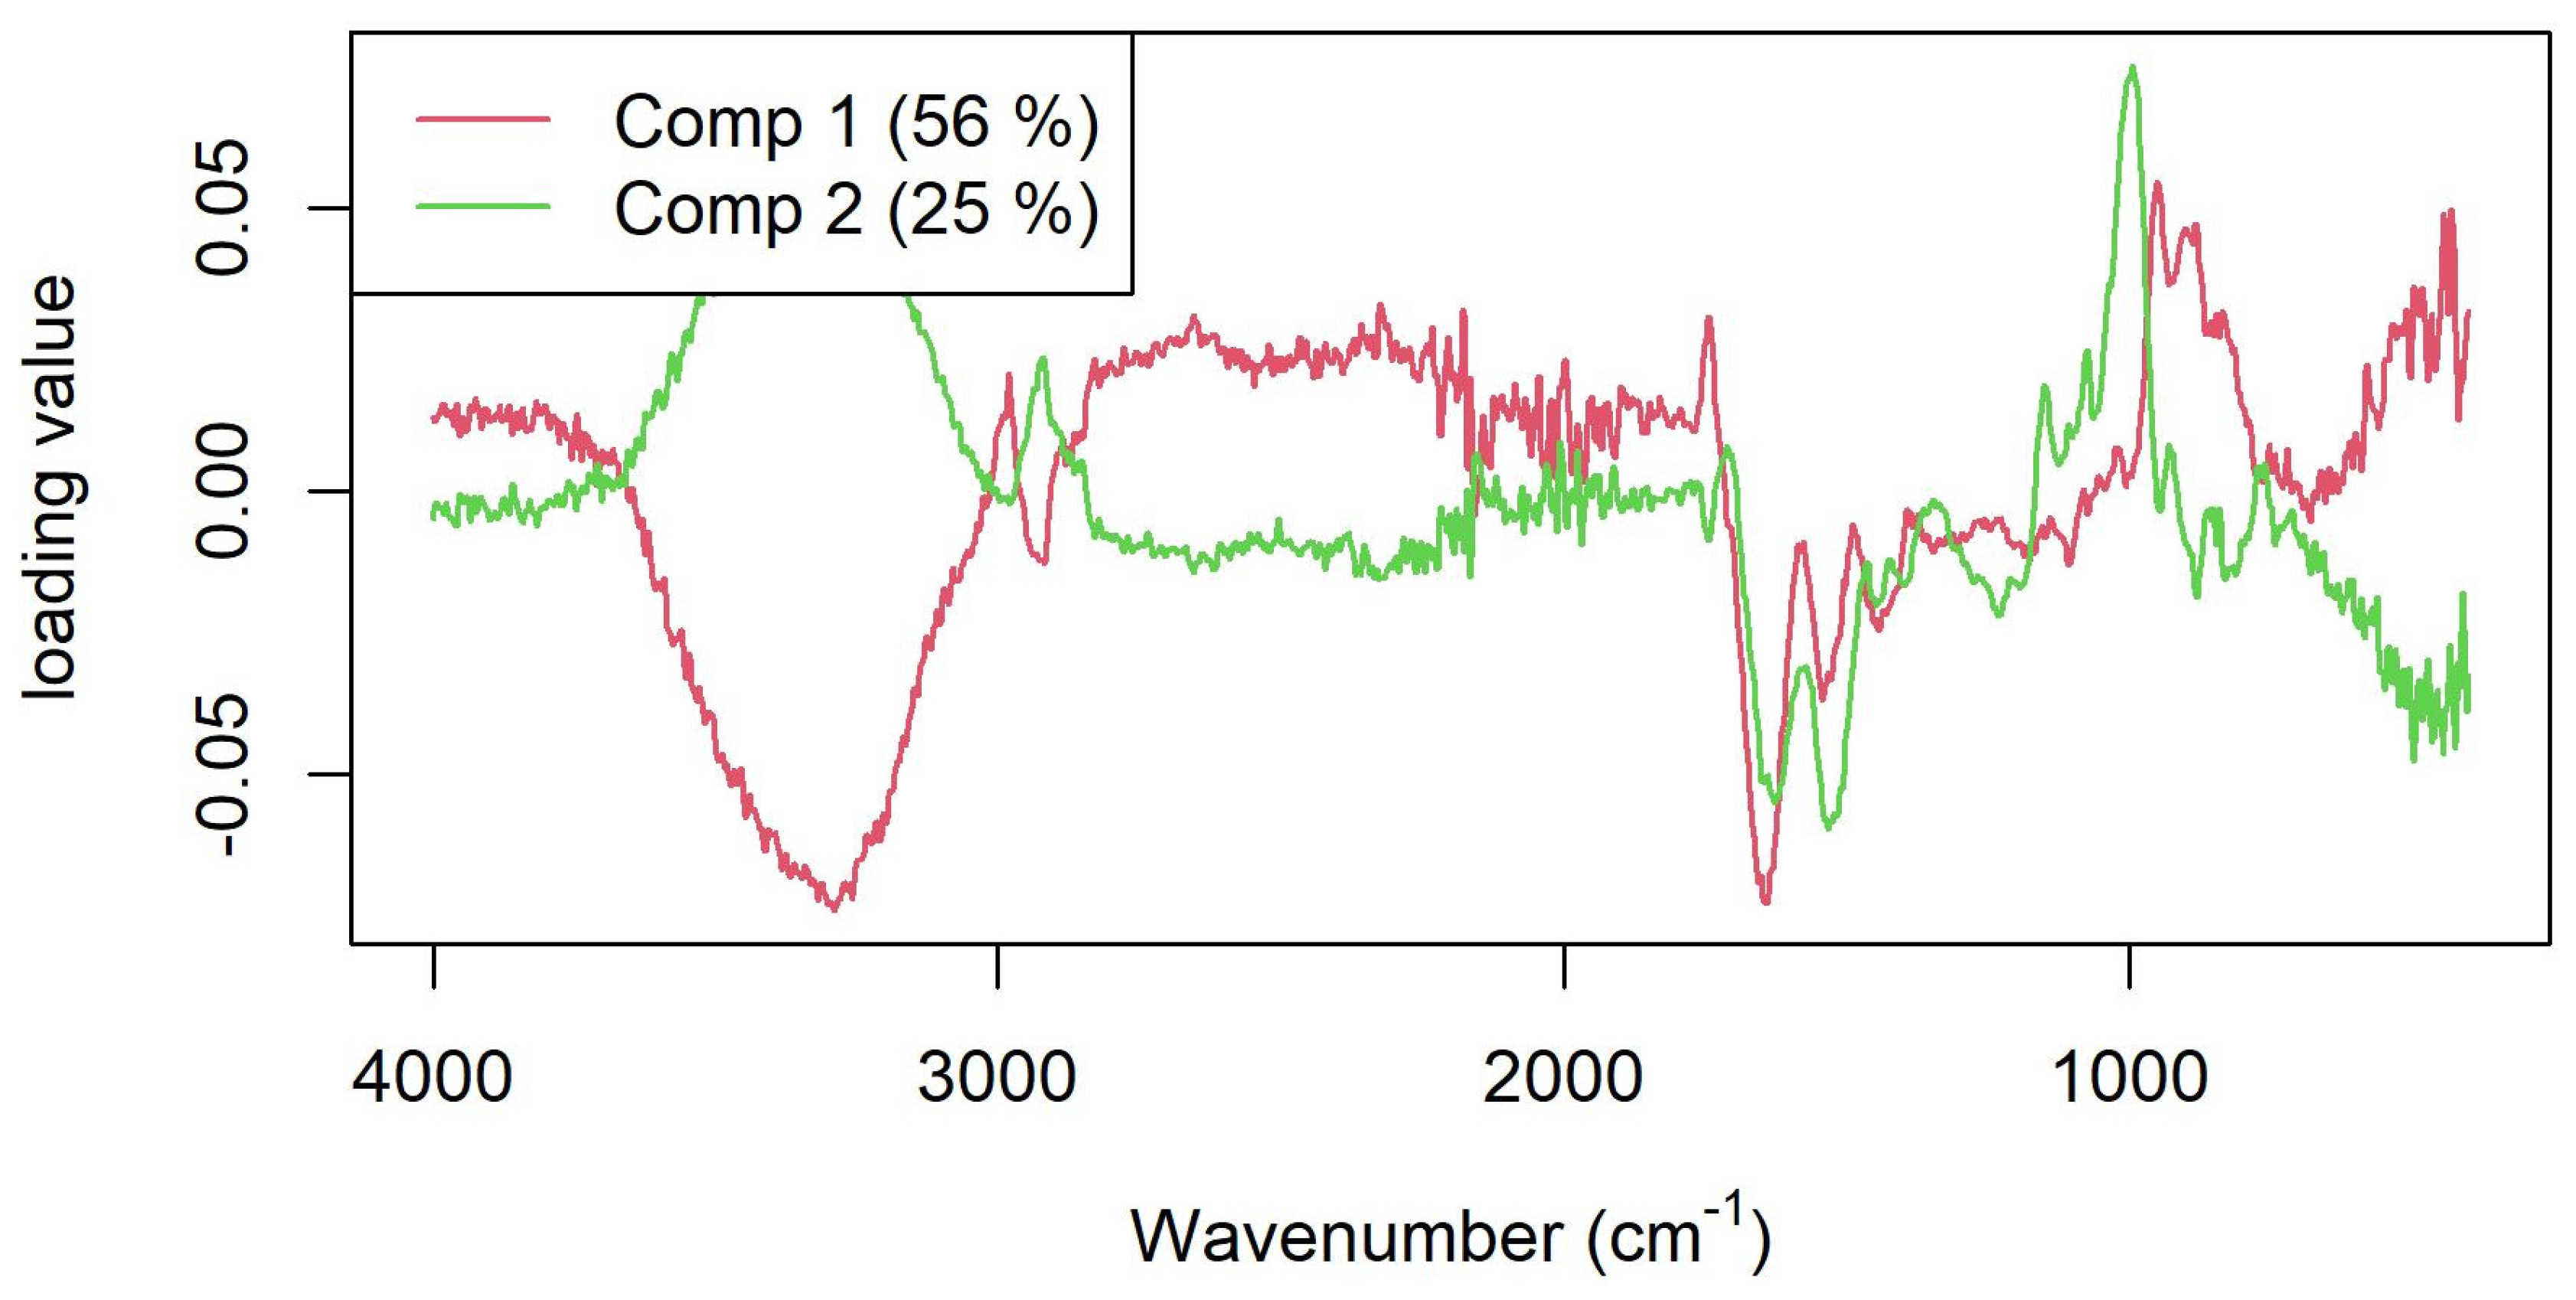
| TPC | SNV | 5 | 0.51 | 7.8 | 1.45 | 0.73 | 5.6 | −1.53 | 0.76 | 33.8 |
| TMA | None | 1 | −0.04 | 2.1 | 0.99 | 0.02 | 1.6 | 0.54 | −1.25 | 5.55 |
| Parameter | Method | Wavelength Range | R2cv | RMSECV |
|---|---|---|---|---|
| NIRS | (nm) | |||
| Protein | Full range | 1000–2500 | 0.976 | 0.302 |
| Protein | Optimised | 1210–2340 | 0.987 | 0.225 |
| FRAP | Full range | 1000–2500 | 0.891 | 5.36 |
| FRAP | Optimised | 1600–2310 | 0.918 | 4.66 |
| TPC | Full range | 1000–2500 | 0.521 | 7.78 |
| TPC | Optimised | 1200–2100 | 0.664 | 6.51 |
| MIRS | (cm−1) | |||
| Protein | Full range | 4000–400 | 0.841 | 0.803 |
| Protein | Optimised | 1515–1315 | 0.916 | 0.584 |
| FRAP | Full range | 4000–400 | 0.750 | 7.56 |
| FRAP | Optimised | 920–800 | 0.846 | 5.92 |
| TPC | Full range | 4000–400 | 0.306 | 9.06 |
| TPC | Optimised | 410–1760 | 0.452 | 8.05 |
Disclaimer/Publisher’s Note: The statements, opinions and data contained in all publications are solely those of the individual author(s) and contributor(s) and not of MDPI and/or the editor(s). MDPI and/or the editor(s) disclaim responsibility for any injury to people or property resulting from any ideas, methods, instructions or products referred to in the content. |
© 2023 by the authors. Licensee MDPI, Basel, Switzerland. This article is an open access article distributed under the terms and conditions of the Creative Commons Attribution (CC BY) license (https://creativecommons.org/licenses/by/4.0/).
Share and Cite
Johnson, J.B.; Walsh, K.B.; Naiker, M. Infrared Spectroscopy for the Analysis of Bioactive Analytes in Wheat: A Proof-of-Concept Study. Appl. Sci. 2023, 13, 8989. https://doi.org/10.3390/app13158989
Johnson JB, Walsh KB, Naiker M. Infrared Spectroscopy for the Analysis of Bioactive Analytes in Wheat: A Proof-of-Concept Study. Applied Sciences. 2023; 13(15):8989. https://doi.org/10.3390/app13158989
Chicago/Turabian StyleJohnson, Joel B., Kerry B. Walsh, and Mani Naiker. 2023. "Infrared Spectroscopy for the Analysis of Bioactive Analytes in Wheat: A Proof-of-Concept Study" Applied Sciences 13, no. 15: 8989. https://doi.org/10.3390/app13158989
APA StyleJohnson, J. B., Walsh, K. B., & Naiker, M. (2023). Infrared Spectroscopy for the Analysis of Bioactive Analytes in Wheat: A Proof-of-Concept Study. Applied Sciences, 13(15), 8989. https://doi.org/10.3390/app13158989


