
Optimizing the Control Level Factors of an Ultrasonic Plastic Welding Machine Affecting the Durability of the Knots of Trawl Nets Using the Taguchi Experimental Method

Abstract
:1. Introduction
2. Materials and Methods
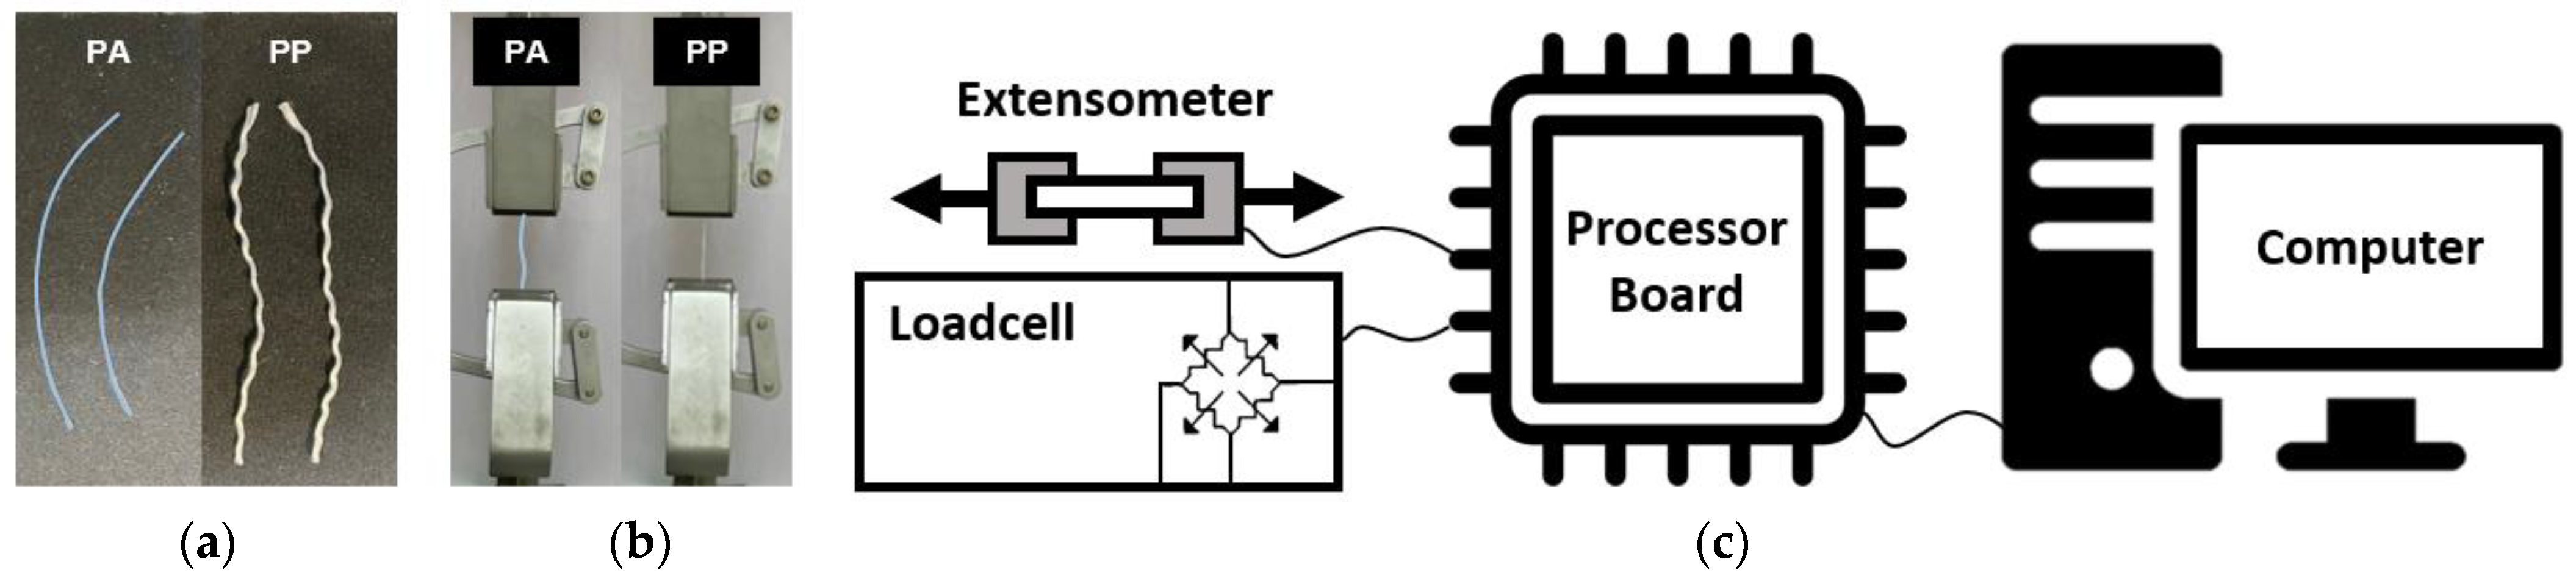
2.1. Materials and Equipment
2.2. Experiment Details
3. Results and Discussion
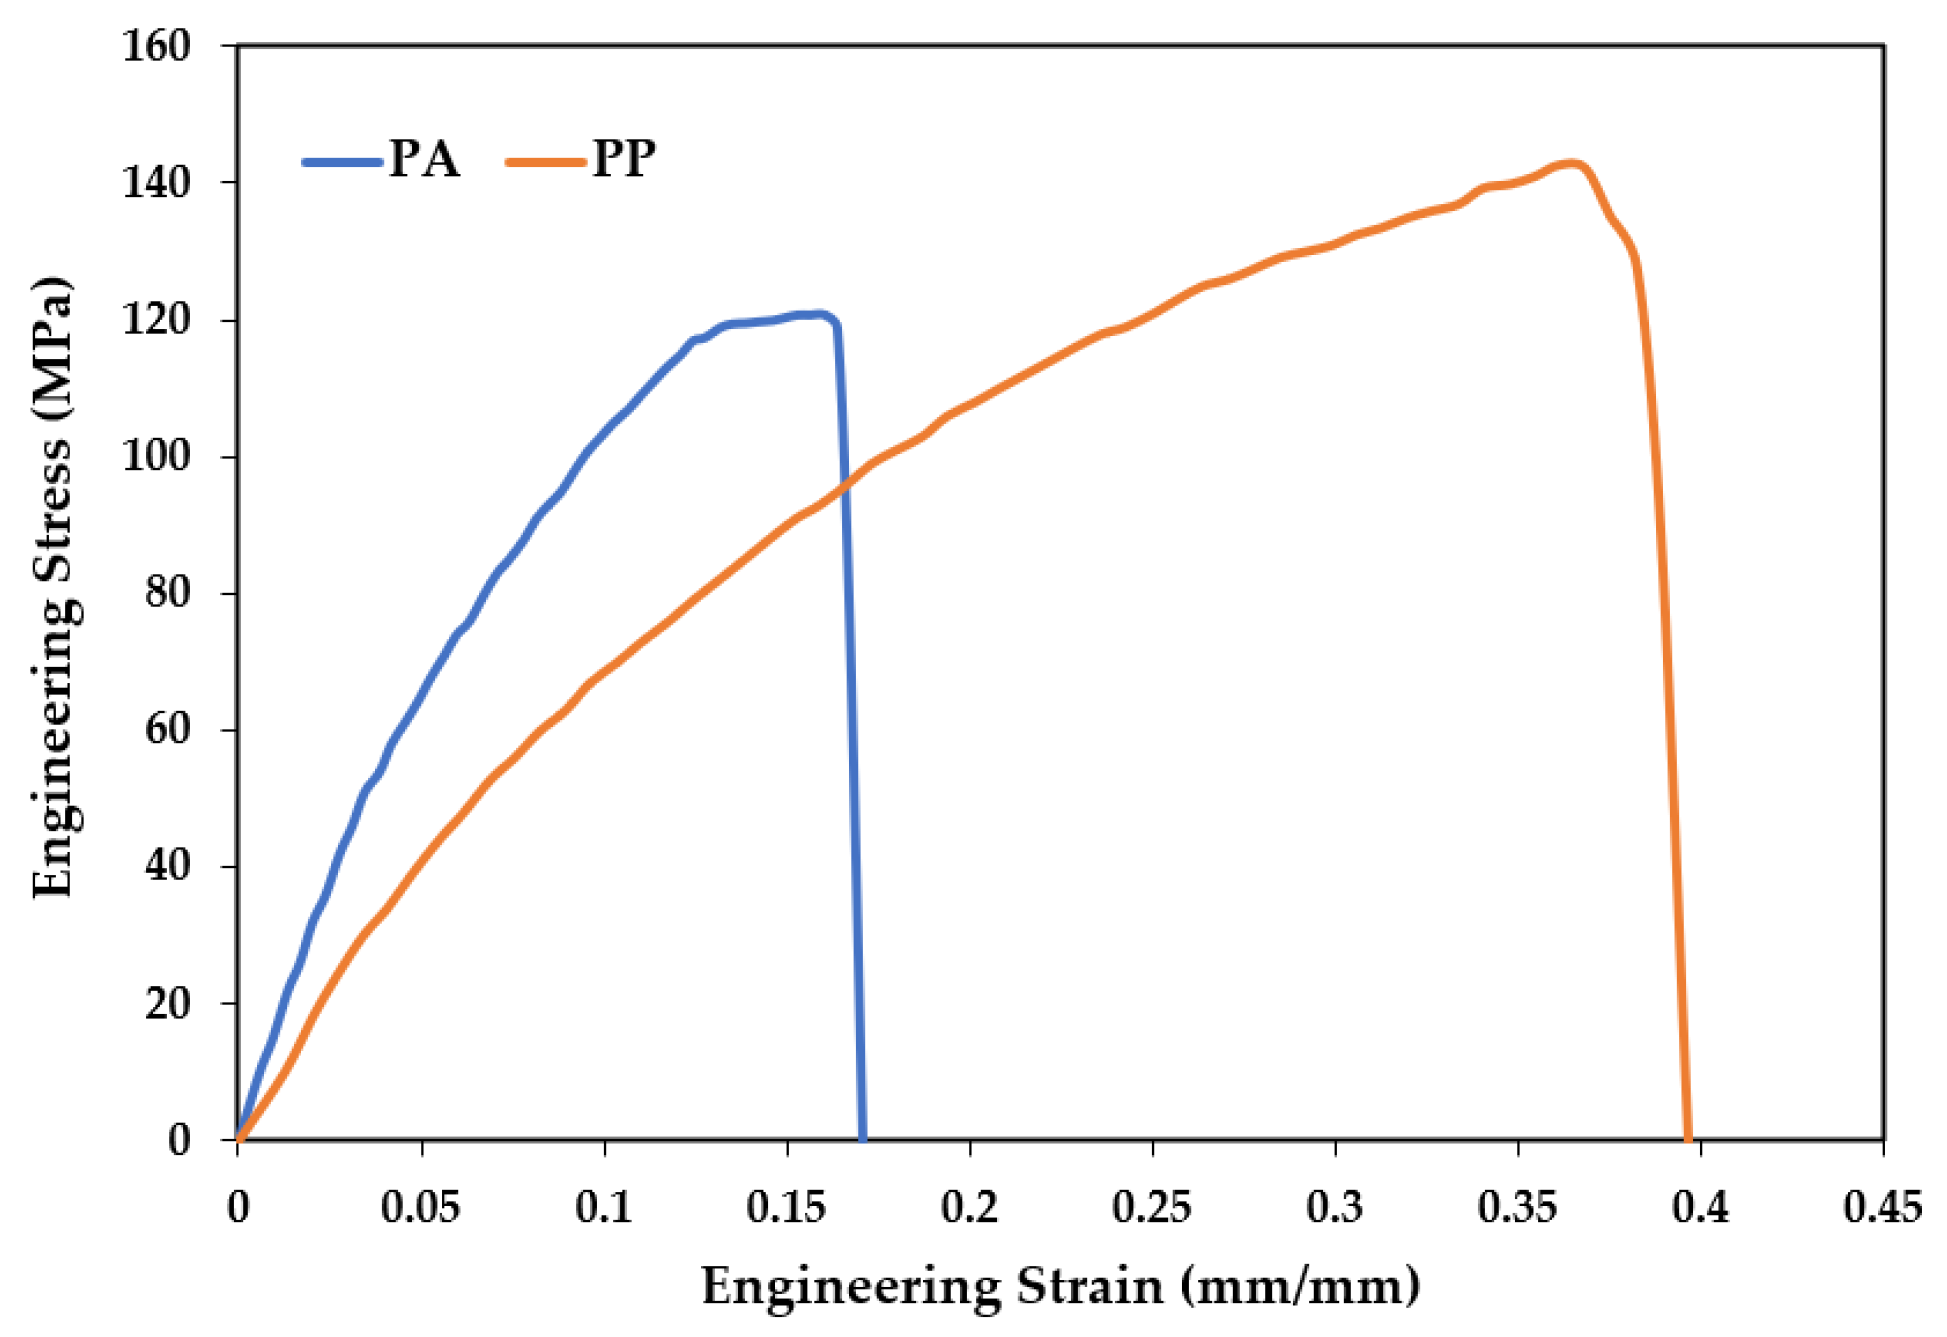
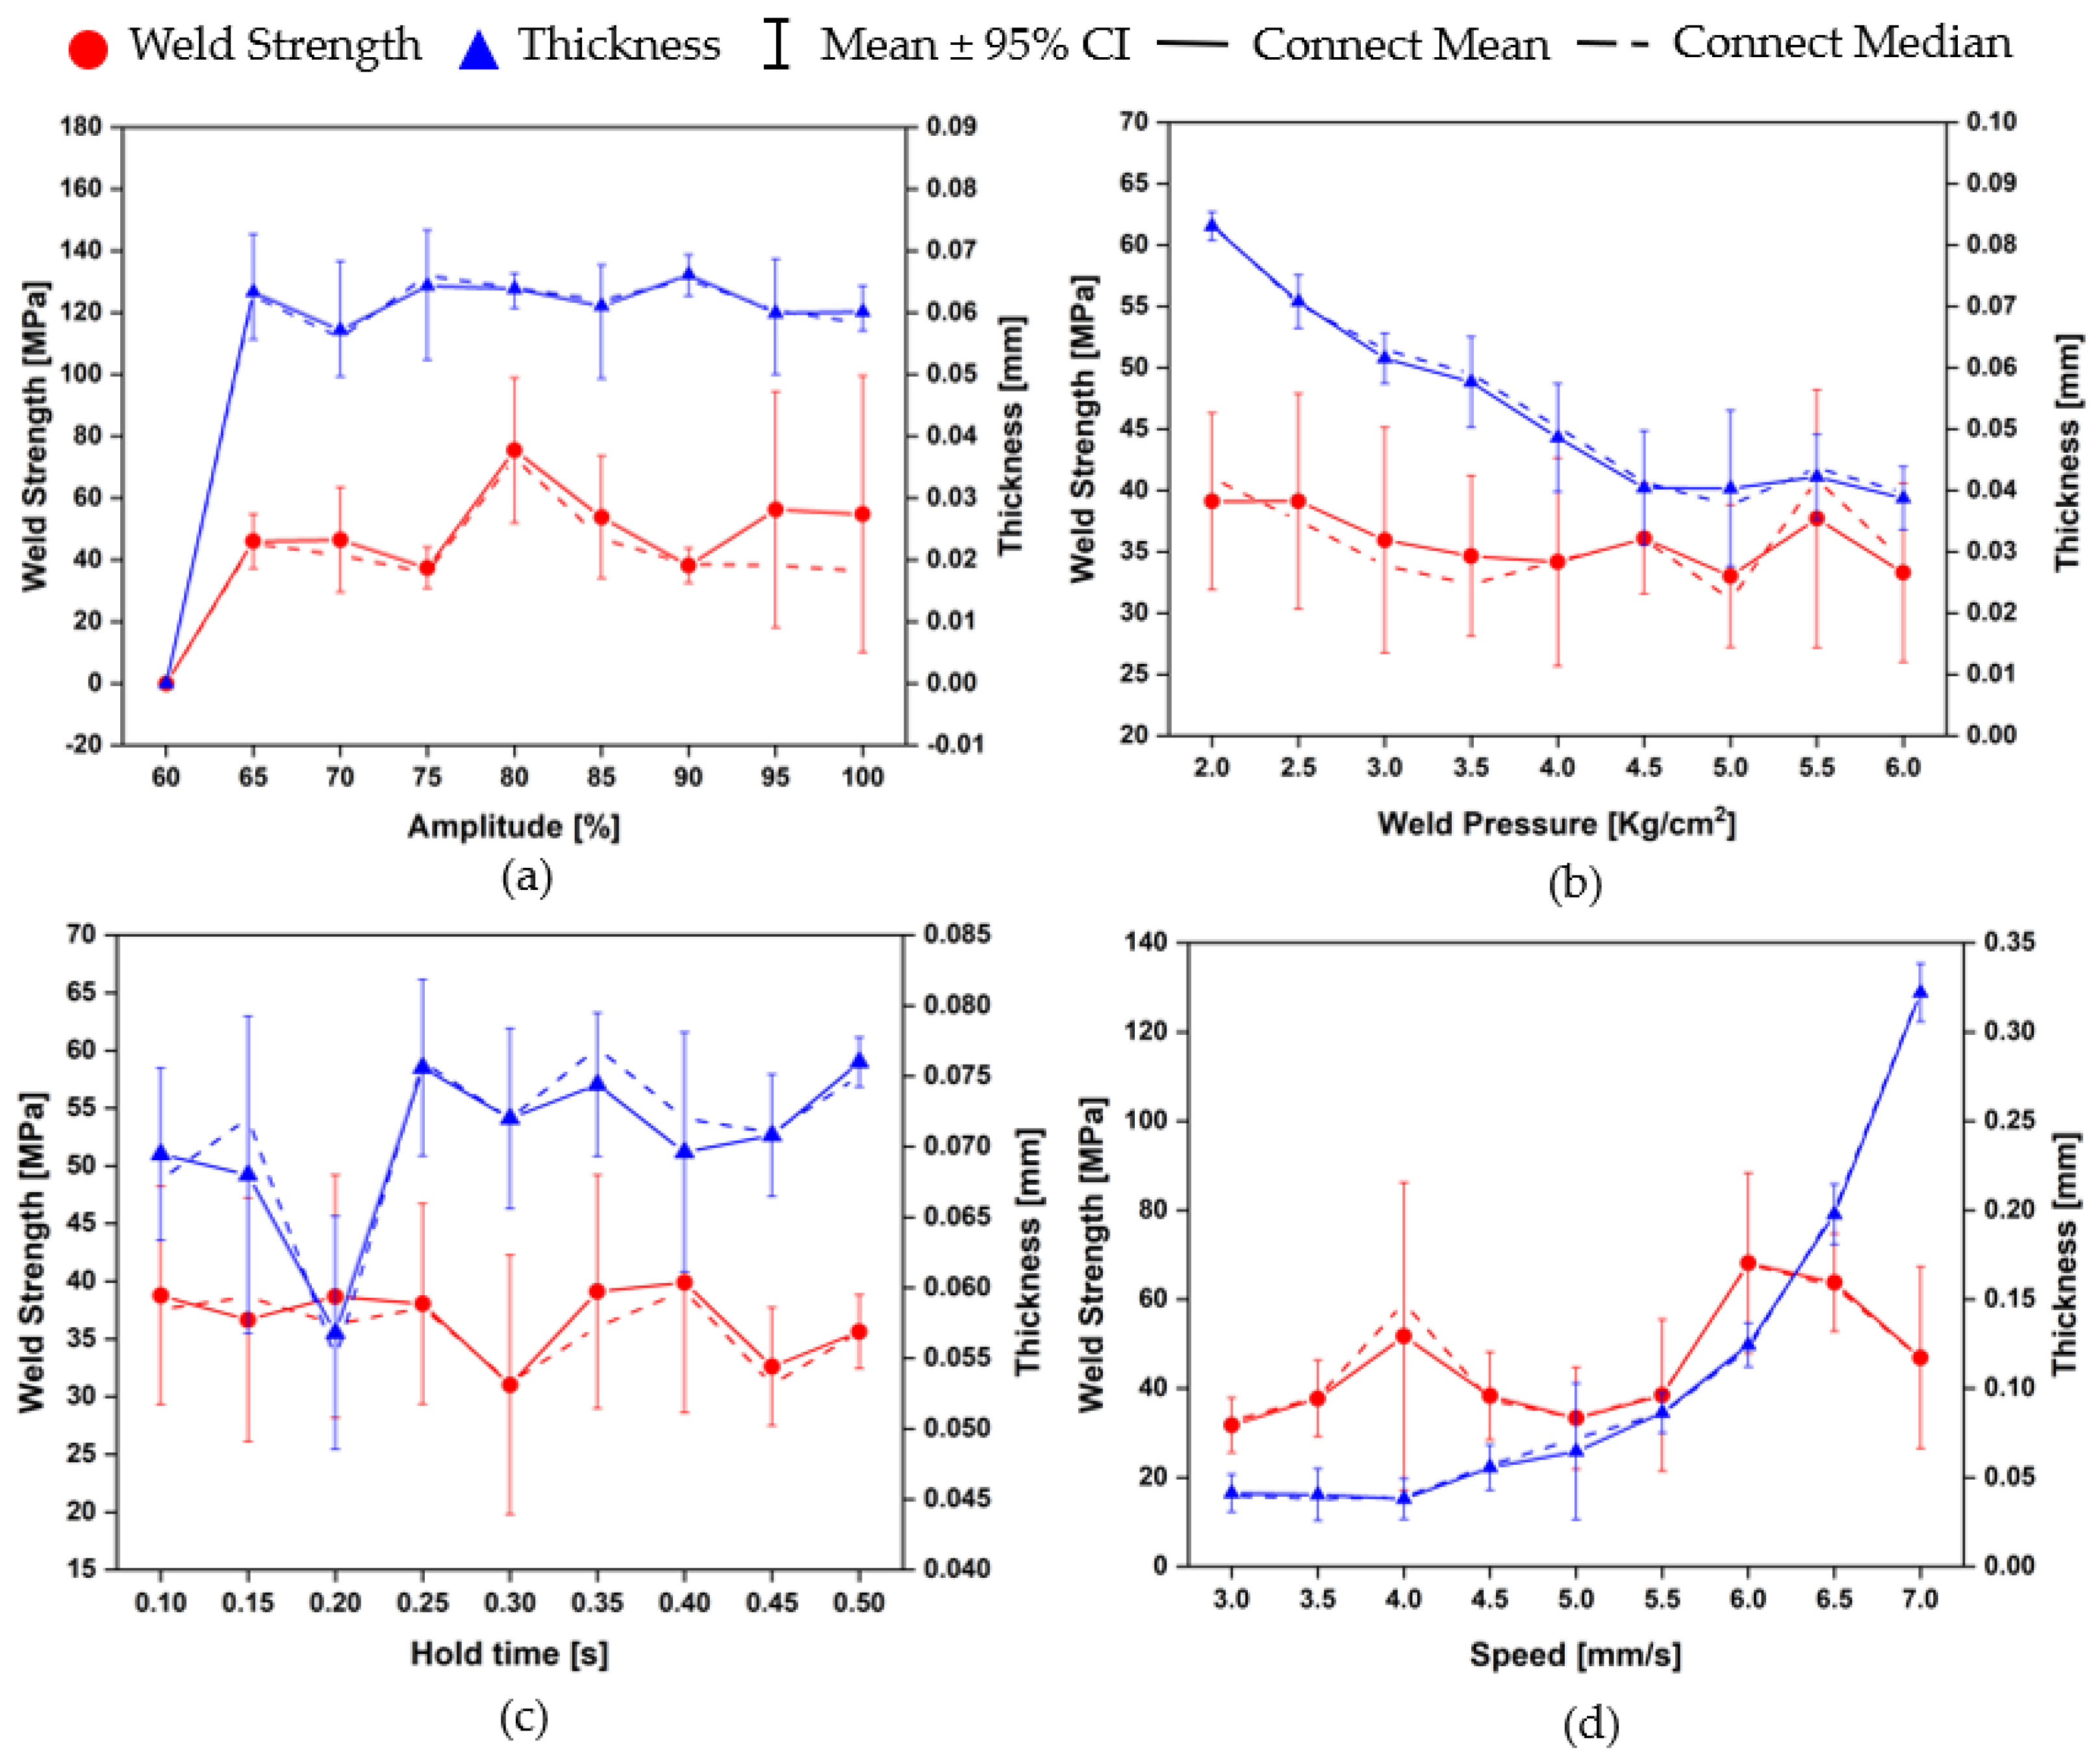
3.1. Polyamide
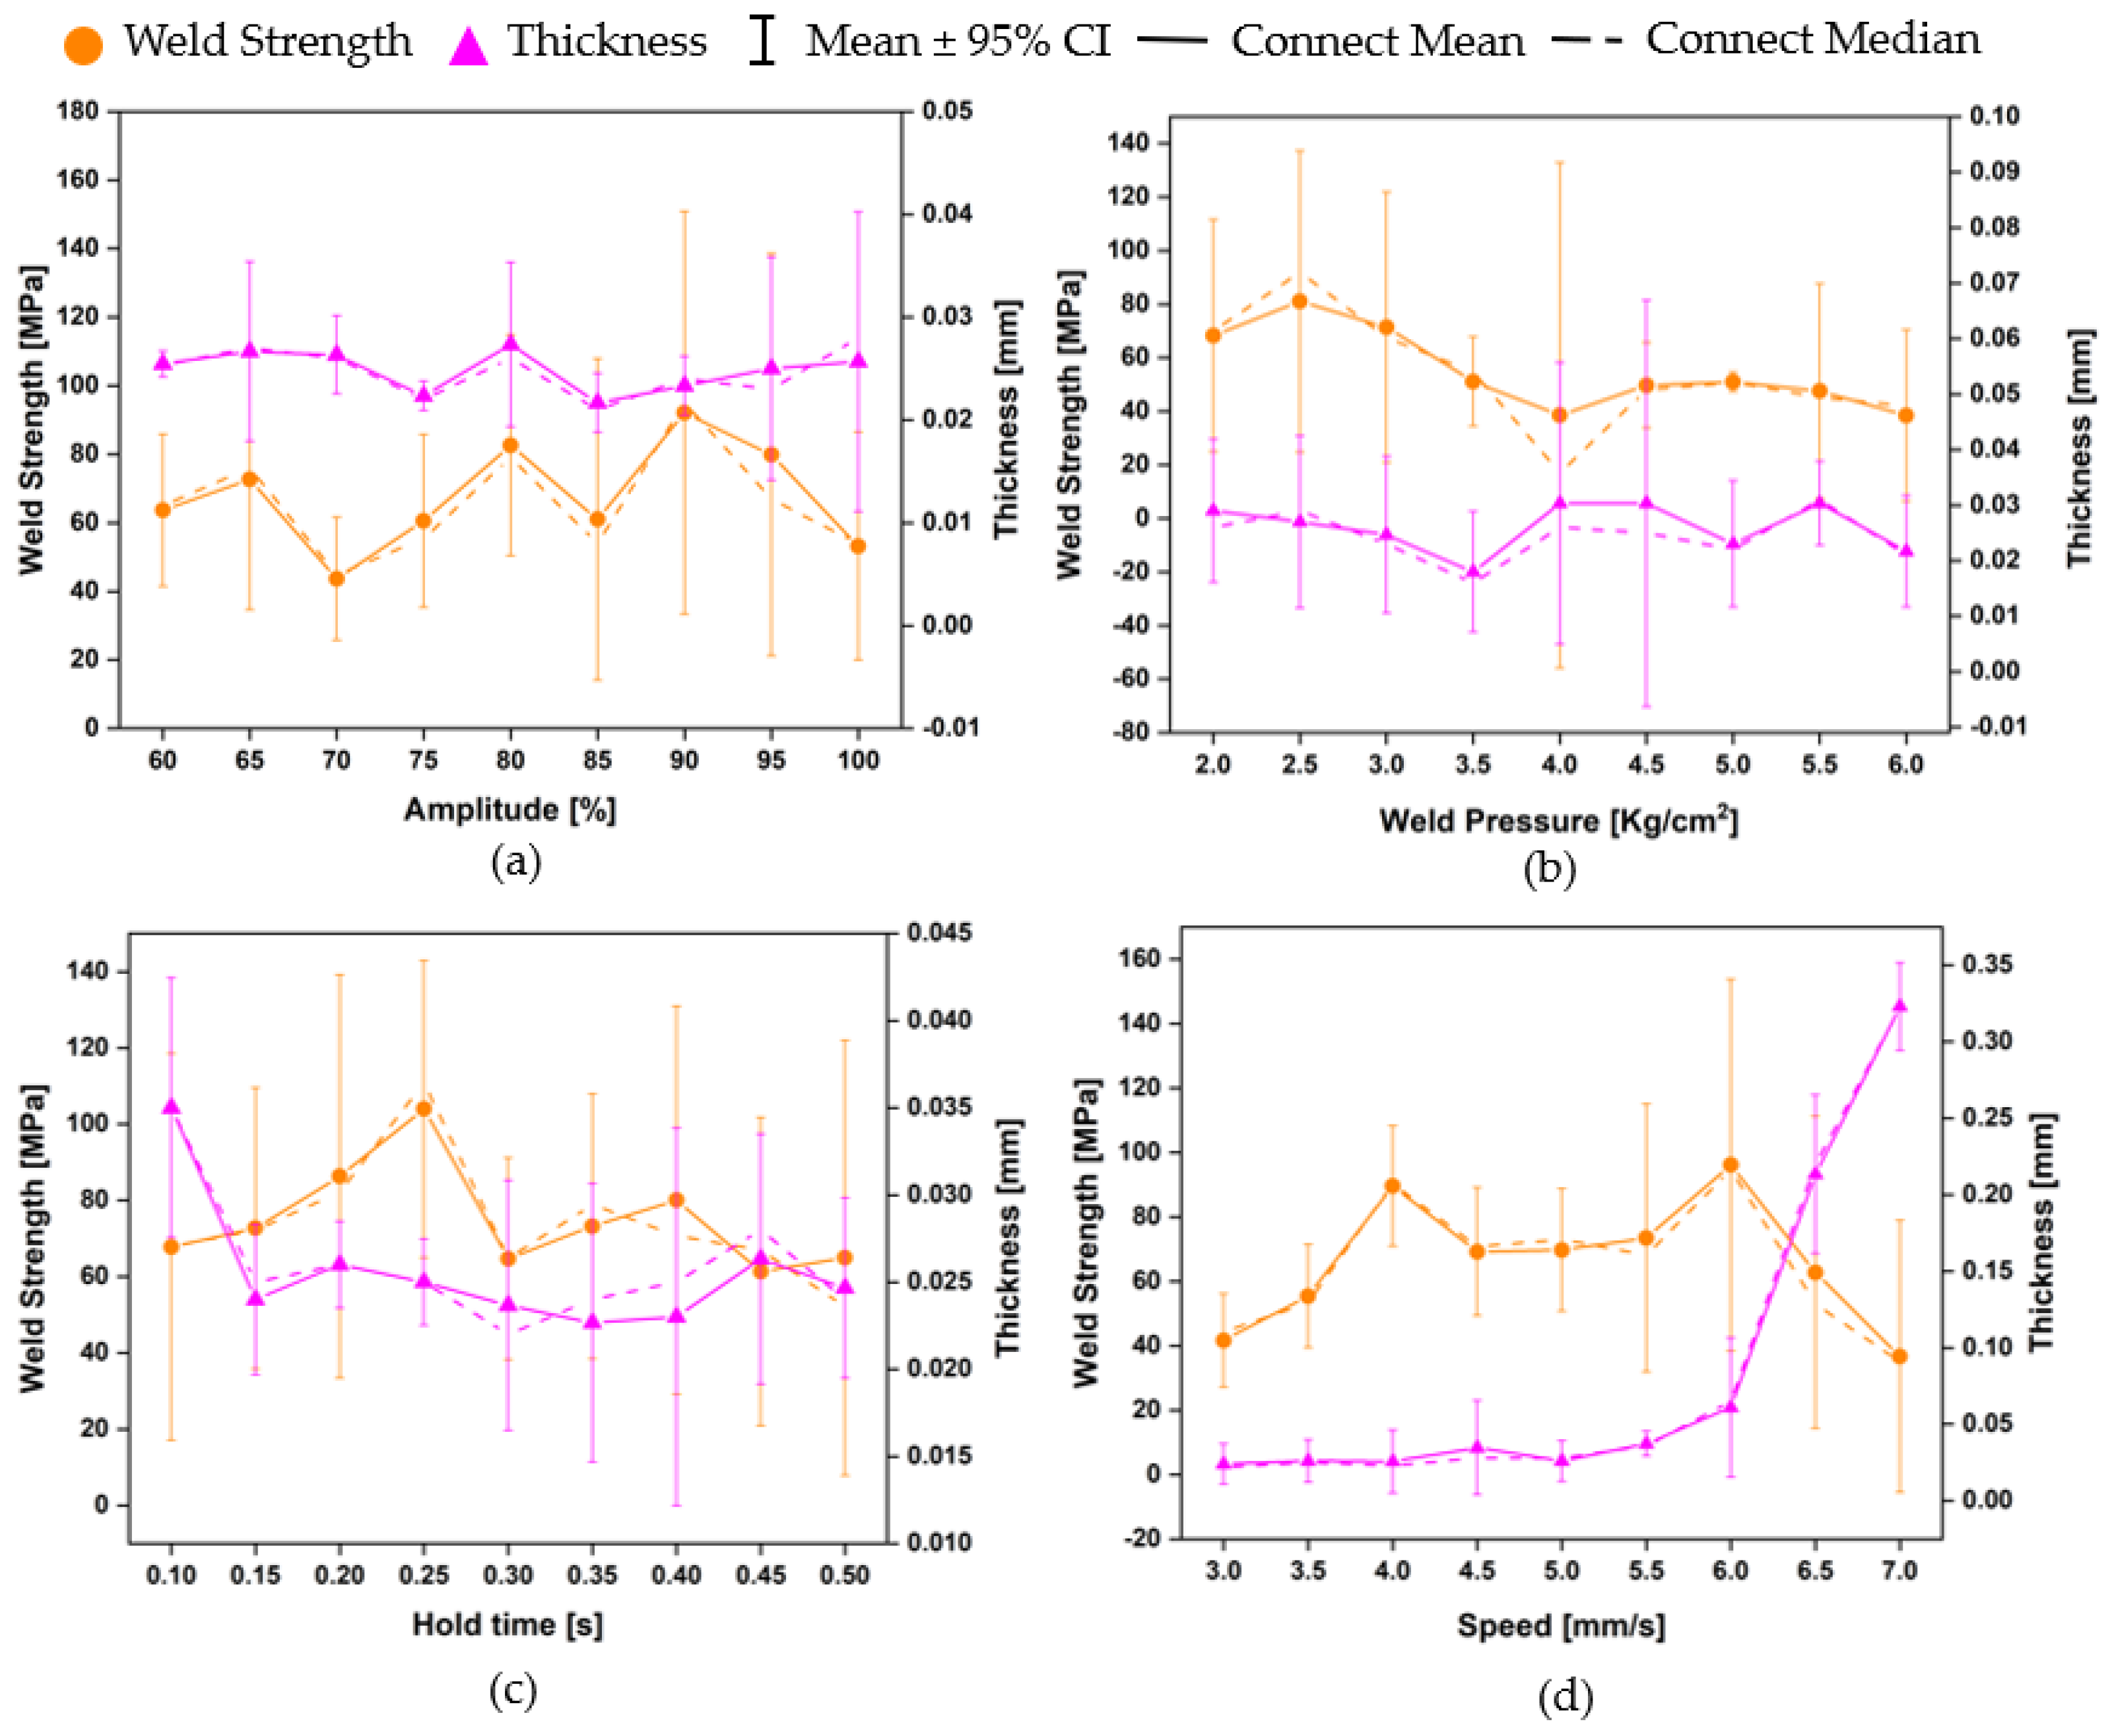
3.2. Polypropylene
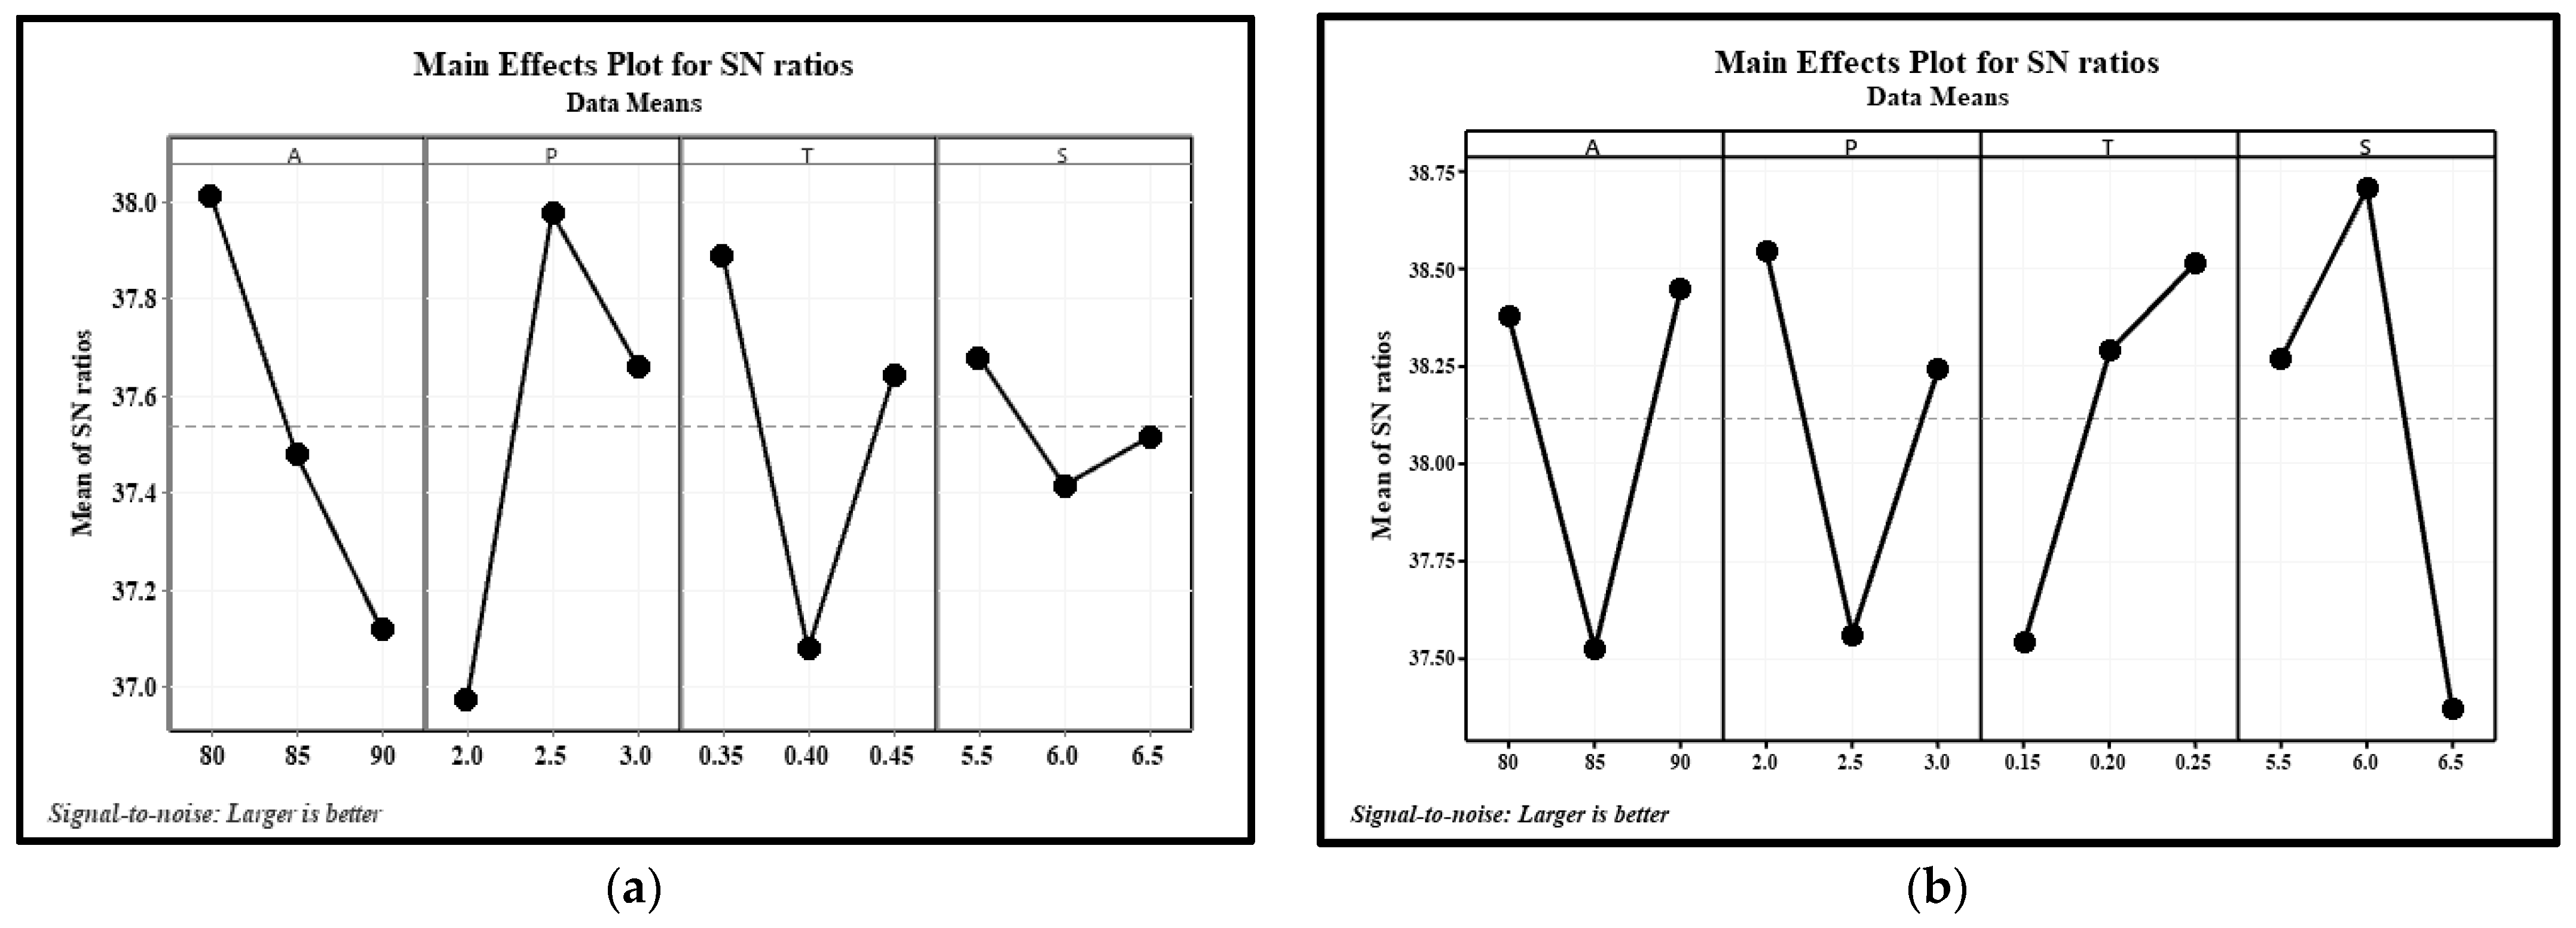
3.3. Taguchi Method
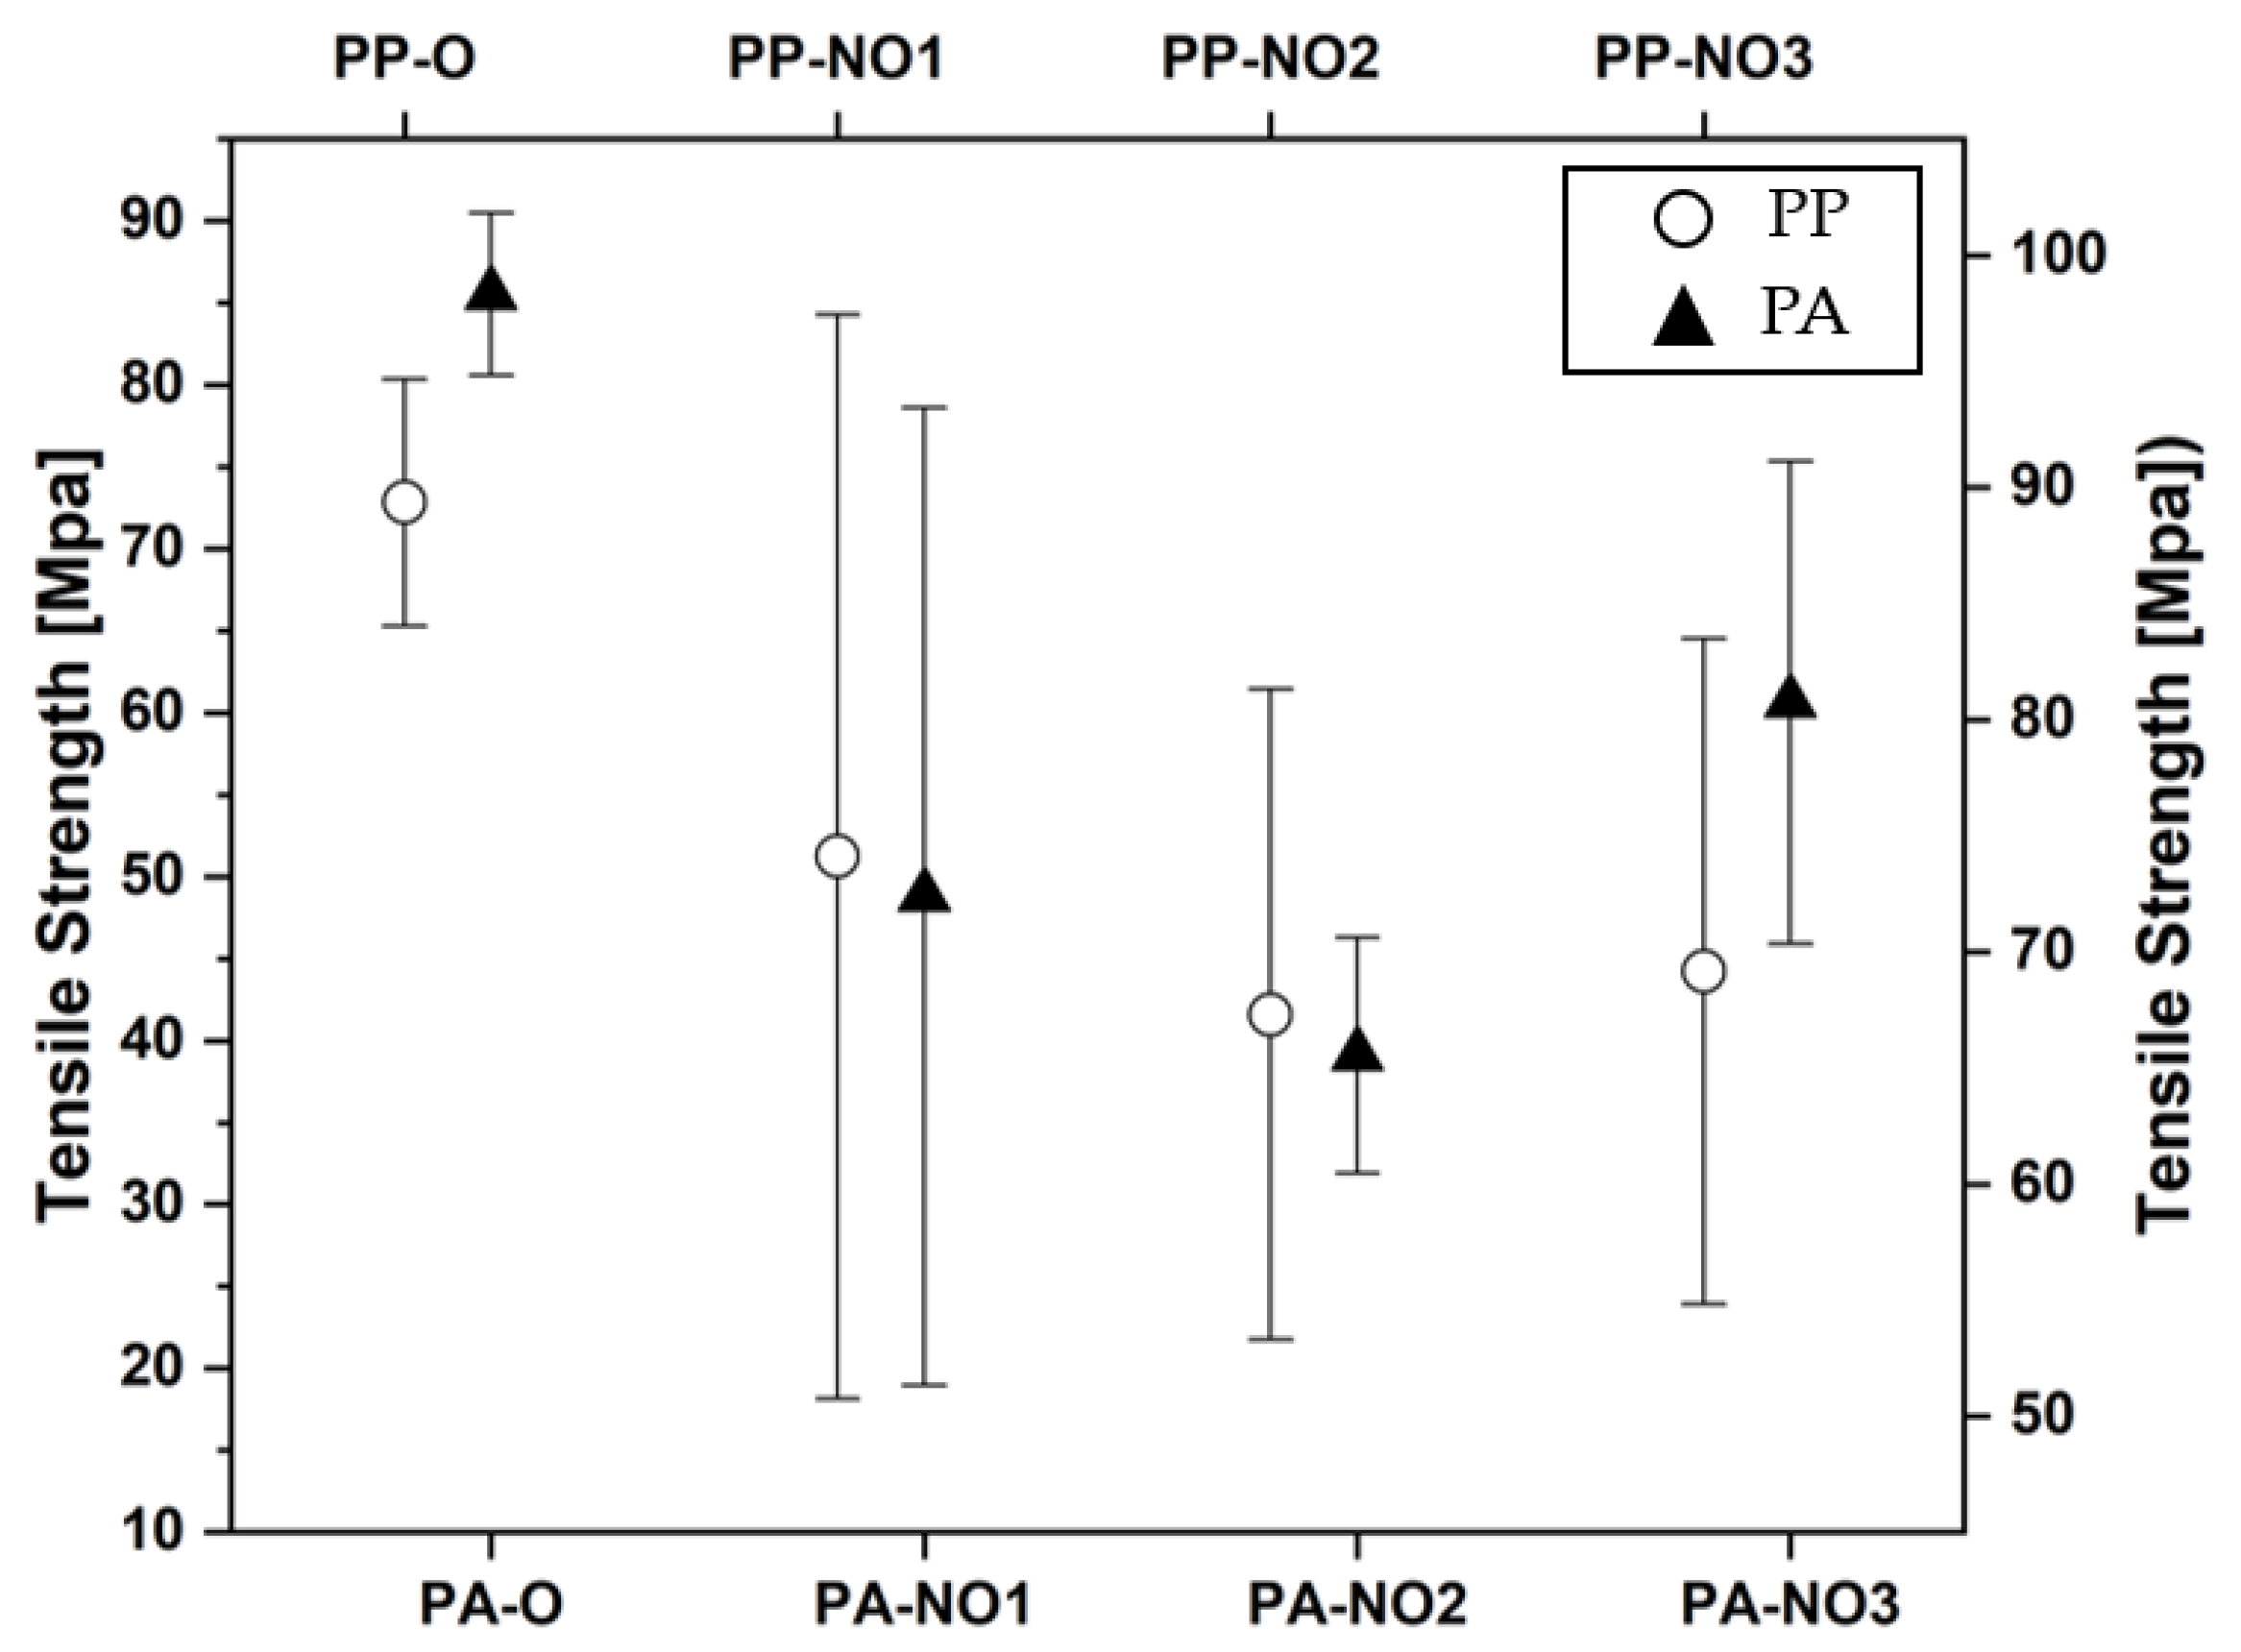
3.4. Confirmation of the Experiment
4. Conclusions
- -
- The knots made from PA filament after welding via the UPWM have stable strength at 75% compared to the original PA filament, with the following parameters after optimization: an amplitude of 32 µm (34%), a welding pressure of 2.5 kg/cm2 (41%), a hold time of 0.35 s (24%), and a speed of 5.5 mm/s (1%).
- -
- The knots made of PP filament had relatively stable strength with the following parameters after optimization: an amplitude of 36 µm (25%), a welding pressure of 2.0 kg/cm2 (22%), a hold time of 0.25s (16%), and a speed of 6.0 mm/s (37%).
- -
- In addition, the difference in the strength of the knots after optimization was significantly improved. However, the thickness of the knots after UW application was relatively small compared to that of the original rope, leading to the low strength of the knots. During the experiment, changing the speed increased the thickness, but reduced the adhesion of the weld. Therefore, it was necessary to reinforce typical materials such as thin films at the location of the knots.
- -
- This research has important implications for the application of UPWM in the manufacture of trawl nets or similar polymer materials. It allows for the selection of welding parameters that are simpler, more cost-effective, systematic, and fast.
Author Contributions
Funding
Institutional Review Board Statement
Informed Consent Statement
Data Availability Statement
Conflicts of Interest
References
- Suzuki, K.; Takagi, T.; Shimizu, T.; Hiraishi, T.; Yamamoto, K.; Nashimoto, K. Validity and visualization of a numerical model used to determine dynamic configurations of fishing nets. Fish. Sci. 2003, 69, 695–705. [Google Scholar] [CrossRef] [Green Version]
- de Dios Rivera, J.; Lopez-Garcia, D. Mechanical characteristics of Raschel mesh and their application to the design of large fog collectors. Atmos. Res. 2015, 151, 250–258. [Google Scholar] [CrossRef]
- Beveridge, M. Cage Aquaculture, 3rd ed.; Blackwell Publishing: Hoboken, NJ, USA, 2004. [Google Scholar]
- Chen, H.; Christensen, E.D. Development of a numerical model for fluid-structure interaction analysis of flow through and around an aquaculture net cage. Ocean Eng. 2017, 142, 597–615. [Google Scholar] [CrossRef] [Green Version]
- Su, B.; Kelasidi, E.; Frank, K.; Haugen, J.; Føre, M.; Pedersen, M.O. An integrated approach for monitoring structural deformation of aquaculture net cages. Ocean Eng. 2020, 219, 108424. [Google Scholar] [CrossRef]
- Baranowski, P.; Małachowski, J.; Niezgoda, T.; Mazurkewicz, Ł. Dynamic behaviour of Various Fibre Systems During Impact Interaction—Numerical Approach. Fibres Text. East. Eur. 2015, 23, 72–82. [Google Scholar] [CrossRef]
- Jensen, Ø.; Dempster, T.; Thorstad, E.; Uglem, I.; Fredheim, A. Escapes of fishes from Norwegian sea-cage aquaculture: Causes, consequences and prevention. Aquac. Environ. Interact. 2010, 1, 71–83. [Google Scholar] [CrossRef] [Green Version]
- Tsujino, J.; Hongoh, M.; Tanaka, R.; Onoguchi, R.; Ueoka, T. Ultrasonic plastic welding using fundamental and higher resonance frequencies. Ultrasonics 2002, 40, 375–378. [Google Scholar] [CrossRef]
- Kuo, C.-C.; Tsai, Q.-Z.; Li, D.-Y.; Lin, Y.-X.; Chen, W.-X. Optimization of Ultrasonic Welding Process Parameters to Enhance Weld Strength of 3C Power Cases Using a Design of Experiments Approach. Polymers 2022, 14, 2388. [Google Scholar] [CrossRef]
- Mahmoudian, M.; Marjani, A.P.; Hasanzadeh, R.; Moradian, M.; Shishavan, S.M. Optimization of mechanical properties of in situ polymerized poly(methyl methacrylate)/alumina nanoparticles nanocomposites using Taguchi approach. Polym. Bull. 2019, 77, 2837–2854. [Google Scholar] [CrossRef]
- Costa, D.M.D.; Paula, T.I.; Silva, P.A.P.; Paiva, A.P. Normal boundary intersection method based on principal components and Taguchi’s signal-to-noise ratio applied to the multiobjective optimization of 12L14 free machining steel turning process. Int. J. Adv. Manuf. Technol. 2016, 87, 825–834. [Google Scholar] [CrossRef]
- Jian, B.-L.; Wang, C.-C.; Yau, H.-T.; Wu, L.-W.; Tian, A.-H. Optimization of Lathe Cutting Parameters Using Taguchi Method and Grey Relational Analysis. Sens. Mater. 2020, 32, 843–858. [Google Scholar] [CrossRef]
- Danh, N.N.; Son, T.D. The solution of taking net-wrapper automatically by using principle of suction fan. J. Austrian Soc. Agric. Econ. 2021, 17, 807–816. [Google Scholar]
- Liu, Z.; Li, Y.; Liu, Z.; Yang, Y.; Li, Y.; Luo, Z. Ultrasonic Welding of Metal to Fiber-Reinforced Thermoplastic Composites: A Review. J. Manuf. Process. 2023, 85, 702–712. [Google Scholar] [CrossRef]
- Mercer, W.B.; Hall, A.D. The Experimental Error of Field Trials. J. Agric. Sci. 1911, 4, 107–132. [Google Scholar] [CrossRef] [Green Version]
- Robert Wayne Atkins. Gill Nets|Robert Wayne Atkins, P.E. grandpappy.org. 2009. Available online: https://grandpappy.org/wgillnet.htm (accessed on 25 April 2023).
- Briassoulis, D.; Mistriotis, A.; Eleftherakis, D. Mechanical behaviour and properties of agricultural nets. Part II: Analysis of the performance of the main categories of agricultural nets. Polym. Test. 2007, 26, 970–984. [Google Scholar] [CrossRef]
- Madueke, C.I.; Mbah, O.M.; Umunakwe, R. A review on the limitations of natural fibres and natural fibre composites with emphasis on tensile strength using coir as a case study. Polym. Bull. 2022, 80, 3489–3506. [Google Scholar] [CrossRef]
- Shen, D.; Liu, C.; Luo, Y.; Shao, H.; Zhou, X.; Bai, S. Early-Age Autogenous Shrinkage, Tensile Creep, and Restrained Cracking Behavior of Ultra-High-Performance Concrete Incorporating Polypropylene Fibers. Cem. Concr. Compos. 2023, 138, 104948. [Google Scholar] [CrossRef]
- Bernasconi, A.; Davoli, P.; Basile, A.; Filippi, A. Effect of fibre orientation on the fatigue behaviour of a short glass fibre reinforced polyamide-6. Int. J. Fatigue 2007, 29, 199–208. [Google Scholar] [CrossRef]
- Montgomery-Liljeroth, E.; Schievano, S.; Burriesci, G. Elastic properties of 2D auxetic honeycomb structures—A review. Appl. Mater. Today 2023, 30, 101722. [Google Scholar] [CrossRef]
- Pham, D.B.; Huang, S.-C. A novel bio-inspired hierarchical tetrachiral structure that enhances energy absorption capacity. J. Mech. Sci. Technol. 2023, 37, 3229–3237. [Google Scholar] [CrossRef]
- Wang, S.; Lin, S. Optimization on Ultrasonic Plastic Welding Systems Based on Two-Dimensional Phononic Crystal. Ultrasonics 2019, 99, 105954. [Google Scholar] [CrossRef]
- Hussen, M.S.; Kyosev, Y.K.; Pietsch, K.; Rothe, S.; Kabish, A.K. Effect of ultrasonic welding process parameters on peel strength of membranes for tents. J. Eng. Fibers Fabr. 2022, 17, 1–19. [Google Scholar] [CrossRef]
- Khan, M.I.; Umair, M.; Hussain, R.; Karahan, M.; Nawab, Y. Investigation of impact properties of para-aramid composites made with a thermoplastic-thermoset blend. J. Thermoplast. Compos. Mater. 2021, 36, 866. [Google Scholar] [CrossRef]
- Nguyen, N.-D.; Huang, S.-C. Trawl Grid Structure Design and Analysis Using the Finite Element Method. Appl. Sci. 2023, 13, 7536. [Google Scholar] [CrossRef]
- Hiwa, B.; Ahmed, Y.M.; Rostam, S. Evaluation of tensile properties of Meriz fiber reinforced epoxy composites using Taguchi method. Results Eng. 2023, 18, 101037. [Google Scholar] [CrossRef]
- Pejkowski, Ł.; Seyda, J.; Nowicki, K.; Mrozik, D. Mechanical performance of non-reinforced, carbon fiber reinforced and glass bubbles reinforced 3D printed PA12 polyamide. Polym. Test. 2023, 118, 107891. [Google Scholar] [CrossRef]
- Almeshari, B.; Junaedi, H.; Baig, M.; Almajid, A. Development of 3D printing short carbon fiber reinforced polypropylene composite filaments. J. Mater. Res. Technol. 2023, 24, 16–26. [Google Scholar] [CrossRef]


| Amplitude (60–100) [%] | Weld Pressure (2.0–6.0) [kg/cm2] | Hold Time (0.1–0.5) [s] | Speed (3.0–7.0) [mm/s] |
|---|---|---|---|
| 80 | 3.0 | 0.3 | 5.0 |
| Materials | Factors | Symbol | Units | Level 1 | Level 2 | Level 3 |
|---|---|---|---|---|---|---|
| PA | Amplitude | A | % | 80 | 85 | 90 |
| Weld pressure | P | kg/cm2 | 2.0 | 2.5 | 3.0 | |
| Hold time | T | s | 0.35 | 0.40 | 0.45 | |
| Speed | S | mm/s | 5.5 | 6.0 | 6.5 | |
| PP | Amplitude | A | % | 80 | 85 | 90 |
| Weld pressure | P | kg/cm2 | 2.0 | 2.5 | 3.0 | |
| Hold time | T | s | 0.15 | 0.20 | 0.25 | |
| Speed | S | mm/s | 5.5 | 6.0 | 6.5 |
| Experiments | Factors | Weld Strength (Mpa) | σ2 | S/N | ||||||
|---|---|---|---|---|---|---|---|---|---|---|
| A | P | T | S | 1 | 2 | 3 | ||||
| PA | 1 | A1 | P1 | T1 | S1 | 76.42 | 85.43 | 76.00 | 5.32 | 37.94 |
| 2 | A1 | P2 | T2 | S2 | 88.15 | 82.93 | 68.11 | 10.39 | 37.87 | |
| 3 | A1 | P3 | T3 | S3 | 85.03 | 82.29 | 77.64 | 3.73 | 38.22 | |
| 4 | A2 | P1 | T2 | S3 | 73.86 | 63.24 | 63.52 | 6.05 | 36.43 | |
| 5 | A2 | P2 | T3 | S1 | 85.86 | 77.30 | 80.43 | 4.33 | 38.16 | |
| 6 | A2 | P3 | T1 | S2 | 76.65 | 78.74 | 78.57 | 1.16 | 37.83 | |
| 7 | A3 | P1 | T3 | S2 | 78.07 | 62.42 | 63.92 | 8.65 | 36.54 | |
| 8 | A3 | P2 | T1 | S3 | 72.65 | 78.61 | 85.63 | 6.49 | 37.89 | |
| 9 | A3 | P3 | T2 | S1 | 67.83 | 69.46 | 73.77 | 3.06 | 36.92 | |
| PP | 1 | A1 | P1 | T1 | S1 | 107.72 | 68.75 | 85.24 | 19.56 | 38.38 |
| 2 | A1 | P2 | T2 | S2 | 90.60 | 98.71 | 72.41 | 13.46 | 38.58 | |
| 3 | A1 | P3 | T3 | S3 | 68.60 | 98.35 | 83.72 | 14.87 | 38.15 | |
| 4 | A2 | P1 | T2 | S3 | 83.93 | 69.08 | 71.26 | 8.01 | 37.37 | |
| 5 | A2 | P2 | T3 | S1 | 72.11 | 70.52 | 85.30 | 8.11 | 37.52 | |
| 6 | A2 | P3 | T1 | S2 | 66.65 | 76.47 | 92.28 | 12.93 | 37.66 | |
| 7 | A3 | P1 | T3 | S2 | 114.63 | 88.40 | 97.43 | 13.32 | 39.86 | |
| 8 | A3 | P2 | T1 | S3 | 76.90 | 66.75 | 61.16 | 7.97 | 36.57 | |
| 9 | A3 | P3 | T2 | S1 | 104.91 | 81.38 | 83.23 | 13.08 | 38.90 | |
| Material | Polyamide (PA) | Polypropylene (PP) | ||||||
|---|---|---|---|---|---|---|---|---|
| Level | A | P | T | S | A | P | T | S |
| 1 | 38.01 | 36.97 | 37.89 | 37.68 | 38.38 | 38.54 | 37.54 | 38.27 |
| 2 | 37.48 | 37.98 | 37.08 | 37.42 | 37.52 | 37.56 | 38.29 | 38.71 |
| 3 | 37.12 | 37.66 | 37.64 | 37.52 | 38.45 | 38.24 | 38.51 | 37.37 |
| Delta | 0.89 | 1.00 | 0.81 | 0.26 | 0.92 | 0.98 | 0.98 | 1.34 |
| Rank | 2 | 1 | 3 | 4 | 4 | 2 | 3 | 1 |
| Material | Specification | Factors | Tensile Strength (Mpa) | ||||||||
|---|---|---|---|---|---|---|---|---|---|---|---|
| A | P | T | S | 1 | 2 | 3 | 4 | 5 | Mean | ||
| PA | Optimized | 80 | 2.5 | 0.35 | 5.5 | 80.7 | 88.6 | 82.4 | 90.1 | 85.8 | 85.5 |
| None optimized 1 | 85 | 3.0 | 0.3 | 5.0 | 41.6 | 36.5 | 44.2 | 90.8 | 30.9 | 48.8 | |
| None optimized 2 | 80 | 2.0 | 0.3 | 5.0 | 44.4 | 30.12 | 36.8 | 41.0 | 43.2 | 39.1 | |
| None optimized 3 | 80 | 3.0 | 0.3 | 6.0 | 76.3 | 45.0 | 66.9 | 54.9 | 60.1 | 60.6 | |
| PP | Optimized | 90 | 2.0 | 0.25 | 6.0 | 89.4 | 84.4 | 95.6 | 86.6 | 90.7 | 89.3 |
| None optimized 1 | 95 | 3.0 | 0.3 | 5.0 | 107.1 | 65.5 | 66.9 | 70.6 | 60.4 | 74.1 | |
| None optimized 2 | 80 | 2.0 | 0.3 | 5.0 | 84.9 | 69.9 | 60.7 | 65.8 | 55.2 | 67.3 | |
| None optimized 3 | 80 | 3.0 | 0.35 | 5.0 | 78.9 | 83.5 | 57.3 | 60.2 | 65.8 | 69.1 | |
Disclaimer/Publisher’s Note: The statements, opinions and data contained in all publications are solely those of the individual author(s) and contributor(s) and not of MDPI and/or the editor(s). MDPI and/or the editor(s) disclaim responsibility for any injury to people or property resulting from any ideas, methods, instructions or products referred to in the content. |
© 2023 by the authors. Licensee MDPI, Basel, Switzerland. This article is an open access article distributed under the terms and conditions of the Creative Commons Attribution (CC BY) license (https://creativecommons.org/licenses/by/4.0/).
Share and Cite
Nguyen, N.-D.; Huang, S.-C. Optimizing the Control Level Factors of an Ultrasonic Plastic Welding Machine Affecting the Durability of the Knots of Trawl Nets Using the Taguchi Experimental Method. Appl. Sci. 2023, 13, 9061. https://doi.org/10.3390/app13169061
Nguyen N-D, Huang S-C. Optimizing the Control Level Factors of an Ultrasonic Plastic Welding Machine Affecting the Durability of the Knots of Trawl Nets Using the Taguchi Experimental Method. Applied Sciences. 2023; 13(16):9061. https://doi.org/10.3390/app13169061
Chicago/Turabian StyleNguyen, Nghia-Danh, and Shyh-Chour Huang. 2023. "Optimizing the Control Level Factors of an Ultrasonic Plastic Welding Machine Affecting the Durability of the Knots of Trawl Nets Using the Taguchi Experimental Method" Applied Sciences 13, no. 16: 9061. https://doi.org/10.3390/app13169061