Article

Effect of Crude Oil on the Geotechnical Properties of Various Soils and the Developed Remediation Methods

by
Haider M. Mekkiyah
1,
Yasir A. J. Al-Hamadani
1,
Ali A. Abdulhameed
2,*,
Ali S. Resheq
3 and
Zainab B. Mohammed
3
1
Ministry of Higher Education and Scientific Research, Baghdad 10059, Iraq
2
Department of Reconstruction and Projects, University of Baghdad, Baghdad 10071, Iraq
3
Civil Engineering Department, University of Technology, Baghdad 10066, Iraq
*
Author to whom correspondence should be addressed.
Appl. Sci. 2023, 13(16), 9103; https://doi.org/10.3390/app13169103
Submission received: 28 March 2023 / Revised: 28 July 2023 / Accepted: 7 August 2023 / Published: 9 August 2023
(This article belongs to the Section Environmental Sciences)

Abstract

:
Crude oil still affects many countries because it is one of the essential fuel sources. It makes life more manageable in modern communities and cannot be overstated because it is easy to use and find. However, the pollution caused by its use in industries such as mining, transportation, and the oil and gas business, especially soil pollution, cannot be ignored. Soil pollution is an issue in most communities because it influences people and ecology. Accidental infusions and spills of ore oils are prevalent occurrences leading to the entire or fractional exchange of the soil pore fluid by oil-contaminated soils that have affected the geotechnical engineering properties. The liquid limitations for polluted soil grades silty loam and sandy loam decreased by 38% and 16%. Oil contamination leads to decreased permeability; the permeability values for sandy loam soil decreased from (3.6 × 10⁻⁶ to 0.25 × 10⁻⁶ cm/s) when the oil content increased from 0 to 16%; however, the permeability values for silty loam decreased from (2.6 × 10⁻⁶ to 0.25 × 10⁻⁶) cm. The current study results exhibit that the geotechnical properties of contaminated soil with oil slag can be modified upon adding cement at different weight percentages (3, 5, and 7%) to the soil. The Atterberg limits and specific gravity of the soil were noticeably reduced when it was stabilised with cement, as well as because oil spills on soil significantly influence the environment. So, there is an immediate and critical need for efficiently removing petroleum hydrocarbon pollutants from contaminated soil. Bioremediation is a new technology gaining interest worldwide to clean up sites that have polluted petroleum hydrocarbons.

1. Introduction

Soil uniquely contributes to plant growth, decomposition, and the recycling of dead biomass. Its disproportionate nature includes gaseous, aqueous, organic, and mineral ingredients. The mineral ingredients of soils are mainly products from the weathering process of stony materials and minor metals such as silicates or mud metal oxides of ferrous metals, aluminium, and manganese; and sometimes, carbonates such as CaCO3 organisms (microorganisms and mesofauna), colloidal humans, and dead plants formed by the effect of microorganisms on plant litter make up the organic matter ingredients of the soil. These solid ingredients are typically collected jointly in groups, establishing an order of linked pores (voids) of various sizes full of air or water [1,2]. Soil pollution can be caused by chemicals made by people or by other changes in the natural environment of the soil. In particular, this could be caused by industrial activities, chemicals used in farming, or getting rid of trash the wrong way [3,4].
Contamination is the synthetic or natural existence of harmful materials with short- or long-term impacts [5,6]. Soil contamination, radioactive contamination, littering, and thermal, visual, light, noise, plastic, and water contamination are all examples of contamination [7,8]. The component of land degradation is one of nature’s most impactful challenges. Hydrocarbons, heavy metals, herbicides, pesticides, etcetera may function as contaminants [9,10].
There are two different kinds of contaminants: organic and inorganic. Hydrocarbons are organic compounds containing carbon and hydrogen in crude oil and natural gas. Most oil contamination comes from oil compounds leaking from reservoirs, transmission lines, or tanker accidents [11]. The quantity of the oil that leaks out depends on the type of contaminant and the soil. When oil contaminants enter the soil, they change its structure, tissue, and physical and mechanical properties, which can be dangerous because they can pollute groundwater resources [12].
Crude oil is a quick and easy way to obtain energy, which makes our lives more comfortable and raises our living standards. It is usually found worldwide, especially in Nigeria, the U.S.A., Libya, Russia, Kuwait, Romania, Saudi Arabia, Iran, Iraq, and Mexico. Oil and gas refineries annually make a billion tons of natural gas, or oil, and their products. These are refined into finished products such as diesel, gasoline, petrol, and lubricants. The international energy agency said that the world’s oil demand was ninety-seven million barrels per day in 2015 and is anticipated to be one hundred million barrels per day by 2021. Ore oil comprises volatile liquid hydrocarbons with different molecular weights and structures. It has more than 17,000 kinds of hydrocarbons and is grouped by the most common one [13].
Petroleum is made up of many different kinds of energy and chemicals. As energy needs grow, more ore oil and by-products enter the soil, water, and air. In the last few years, oil spills have created much pollution on land. Oil leakage is a major ecological issue because cleaning contaminated sites is challenging and expensive. Many things can cause oil to leak, such as broken pipelines, oil tank accidents, coastal facilities dumping oil, and oil products leaking on land [14].
When it comes in contact with the soil, it modifies its chemical and physical qualities. The degree of variance depends on the kind of soil, its precise composition, and the number of hydrocarbons. Wastes from petroleum hydrocarbons dumped on the ground eventually make their way to the soil system, altering soil attributes such as pore fluids, liquid limits, pH, and unconfined compressive strength [15].
When crude oil or one of its products seeps into the soil via the unsaturated zone under the effects of gravity and capillary properties and through the pores, a portion of it sticks to the soil particles, while the remainder reaches the groundwater level, producing water pollution. The evaporation of the residue in the atmosphere pollutes the air, plants, and so on [16,17]. Oil pollution may impact the physical and chemical qualities of soil. Hydrocarbon-contaminated soils’ maximum daily surface temperature is often more significant than that of nearby control sites [18]. In recent years, several nations have done numerous studies on the remediation of oil-contaminated soil. The standard techniques include physical, chemical, microbiological, and plant remediation [19]. Conventional chemistry and physical processes, such as chemical oxidation, extraction–separation, thermal resolution, heat treatment, the elution method, and soil replacement and removal, are utilised to organise the chemical reactions or physical processes that alter the soil features to control contaminants effectively. An attempt to test the virtual commissioning of a process control system for the production of high-paraffin oil was conducted by scholars [20,21]. Technology has been developed for modelling and operating the technologically evolved process’s algorithms. Based on the work conducted, conclusions were drawn about the usefulness of thermal control methods and their high cost.

Research Significance

This study aims to investigate the geotechnical properties of the soil contaminated with different percentages of crude oil using additive techniques. The cement is used to modify these undesirable properties of the contaminated soil due to its high availability, low cost, and effectiveness in fine-grained soil. The many oil-productive companies’ oil refineries in Iraq motivate the authors to investigate soil behaviour within or surrounded by these pollution sources.

2. Impact of Oil Pollution on Geotechnical Features of Soil

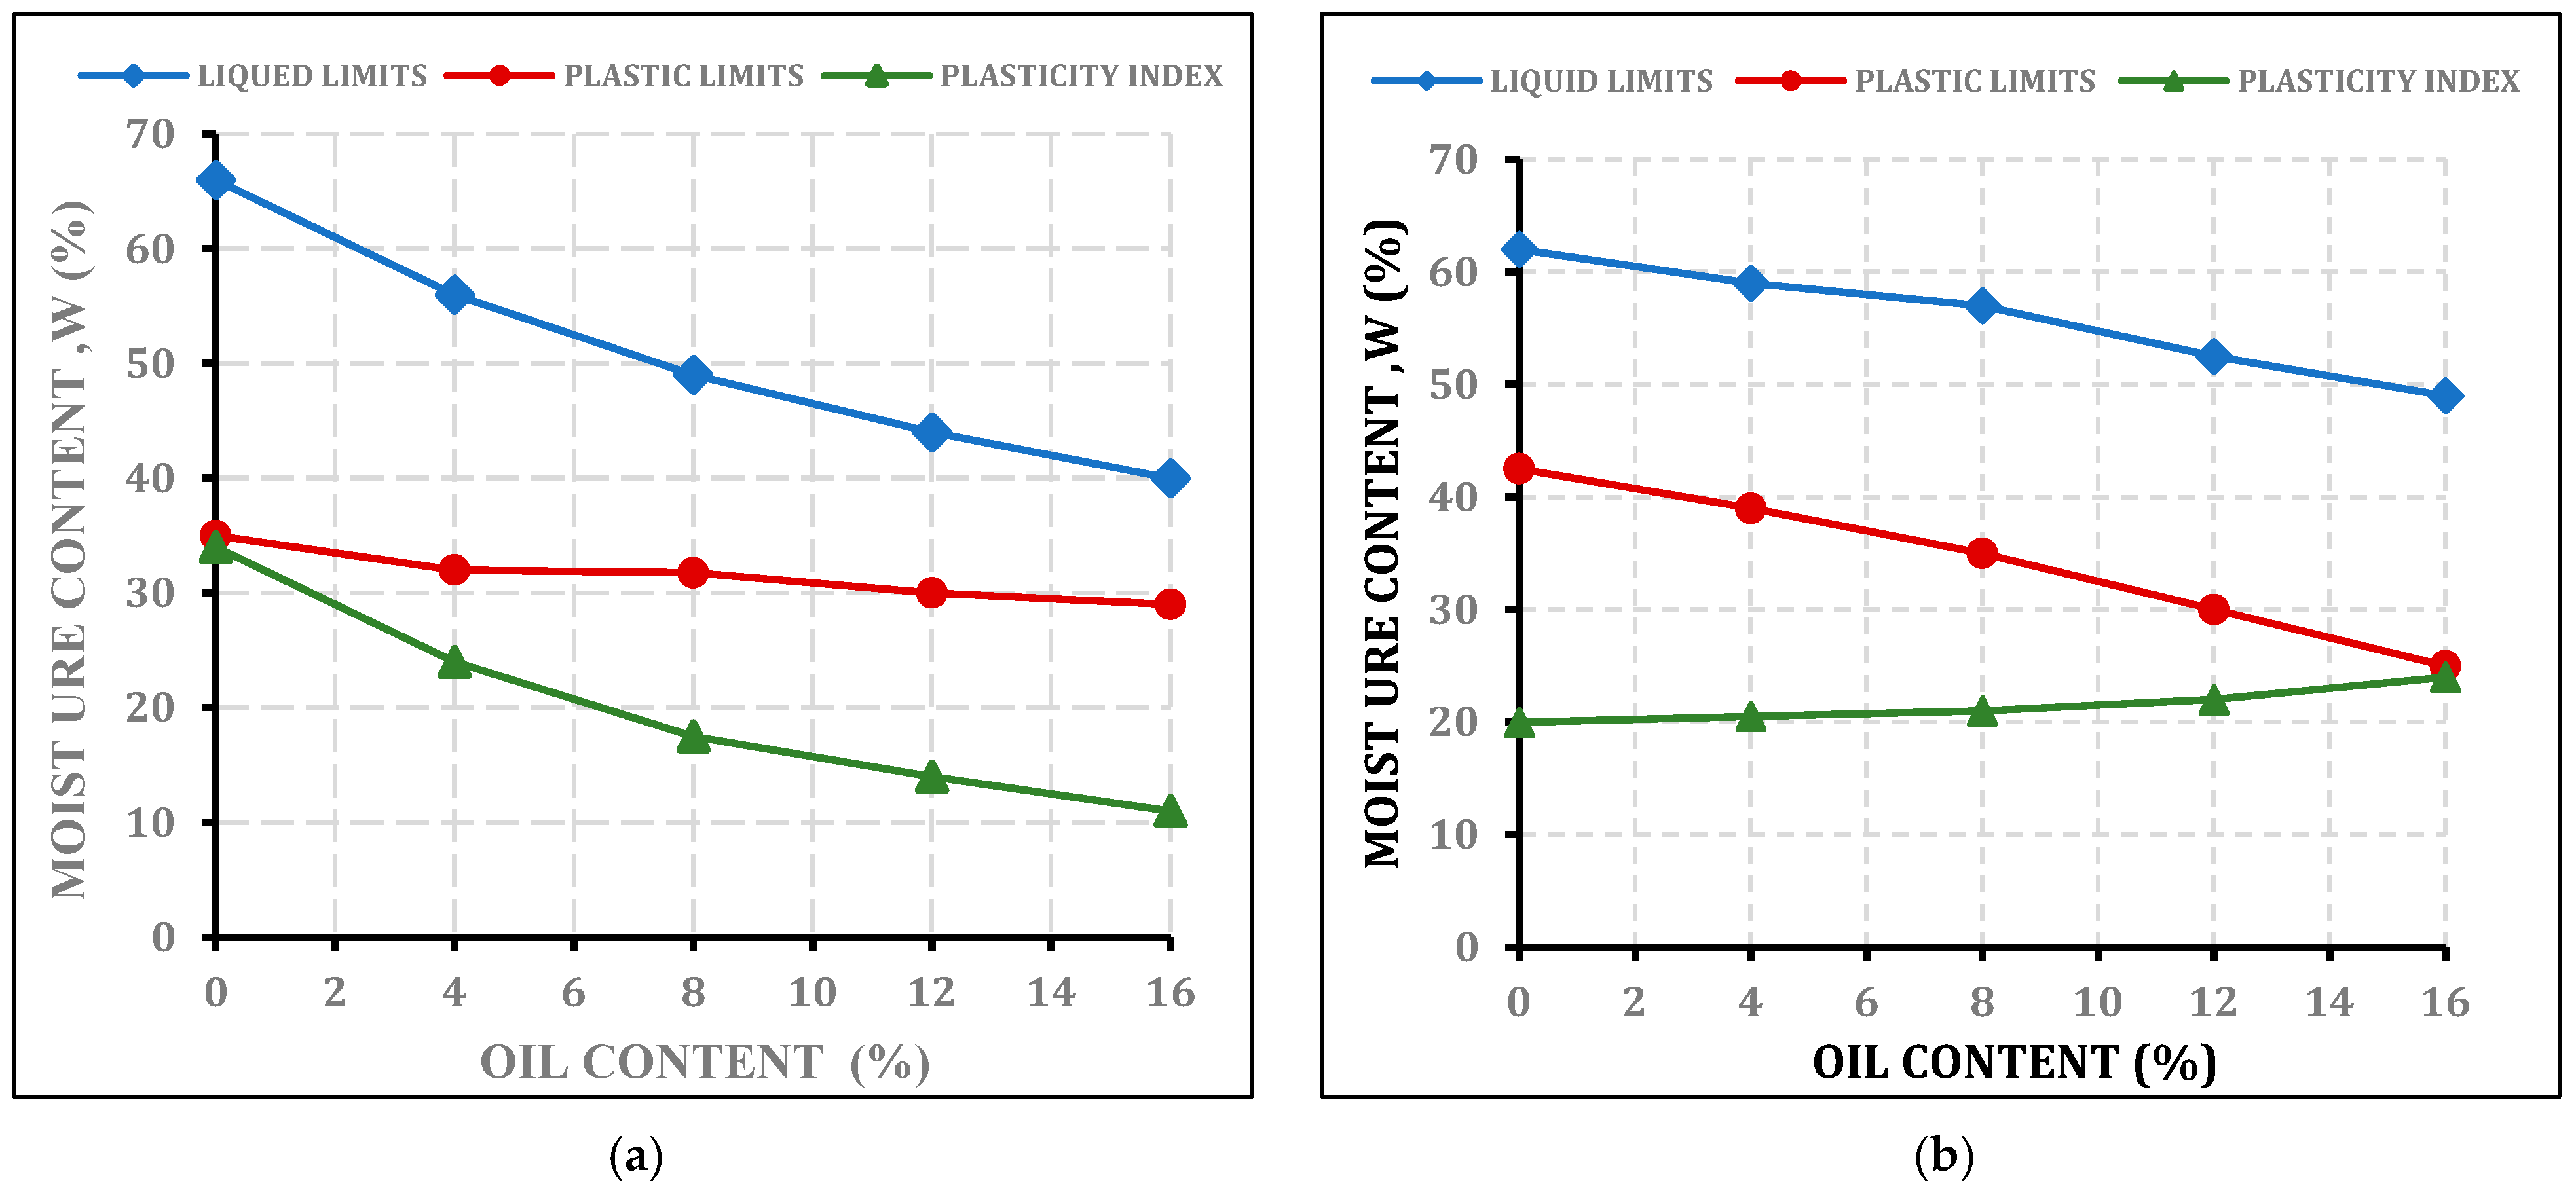
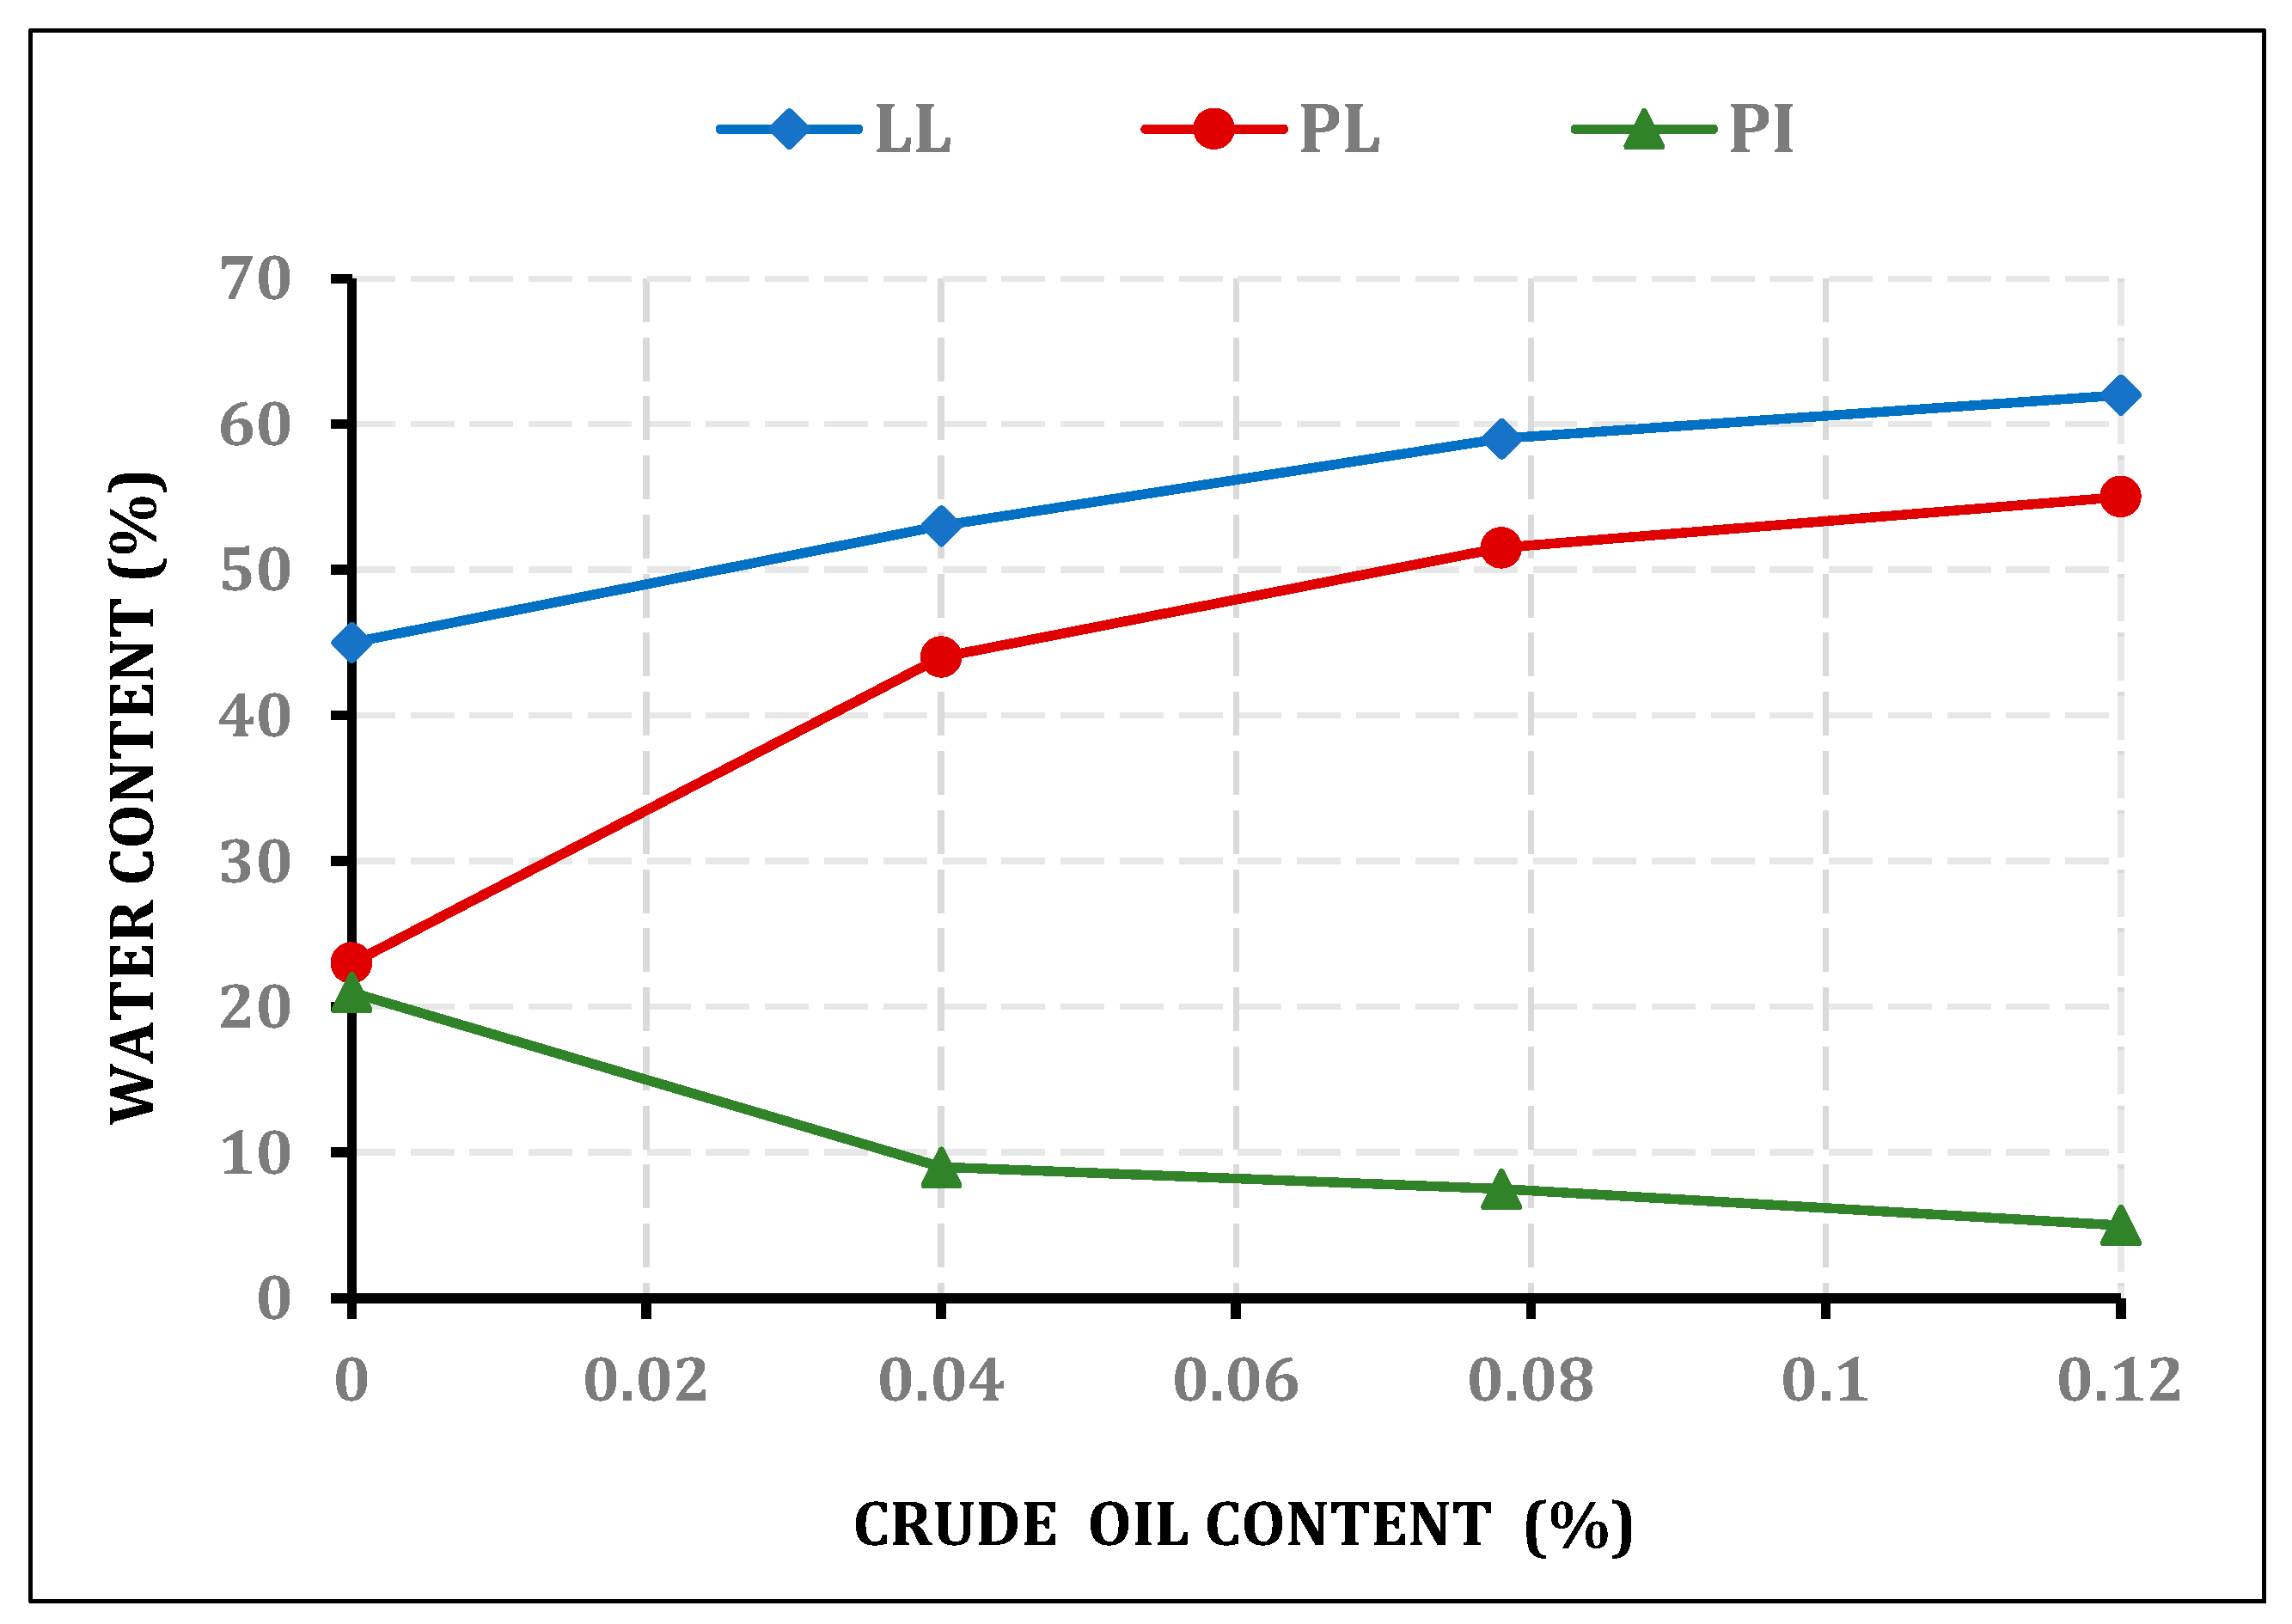
2.1. Atterberg Limits
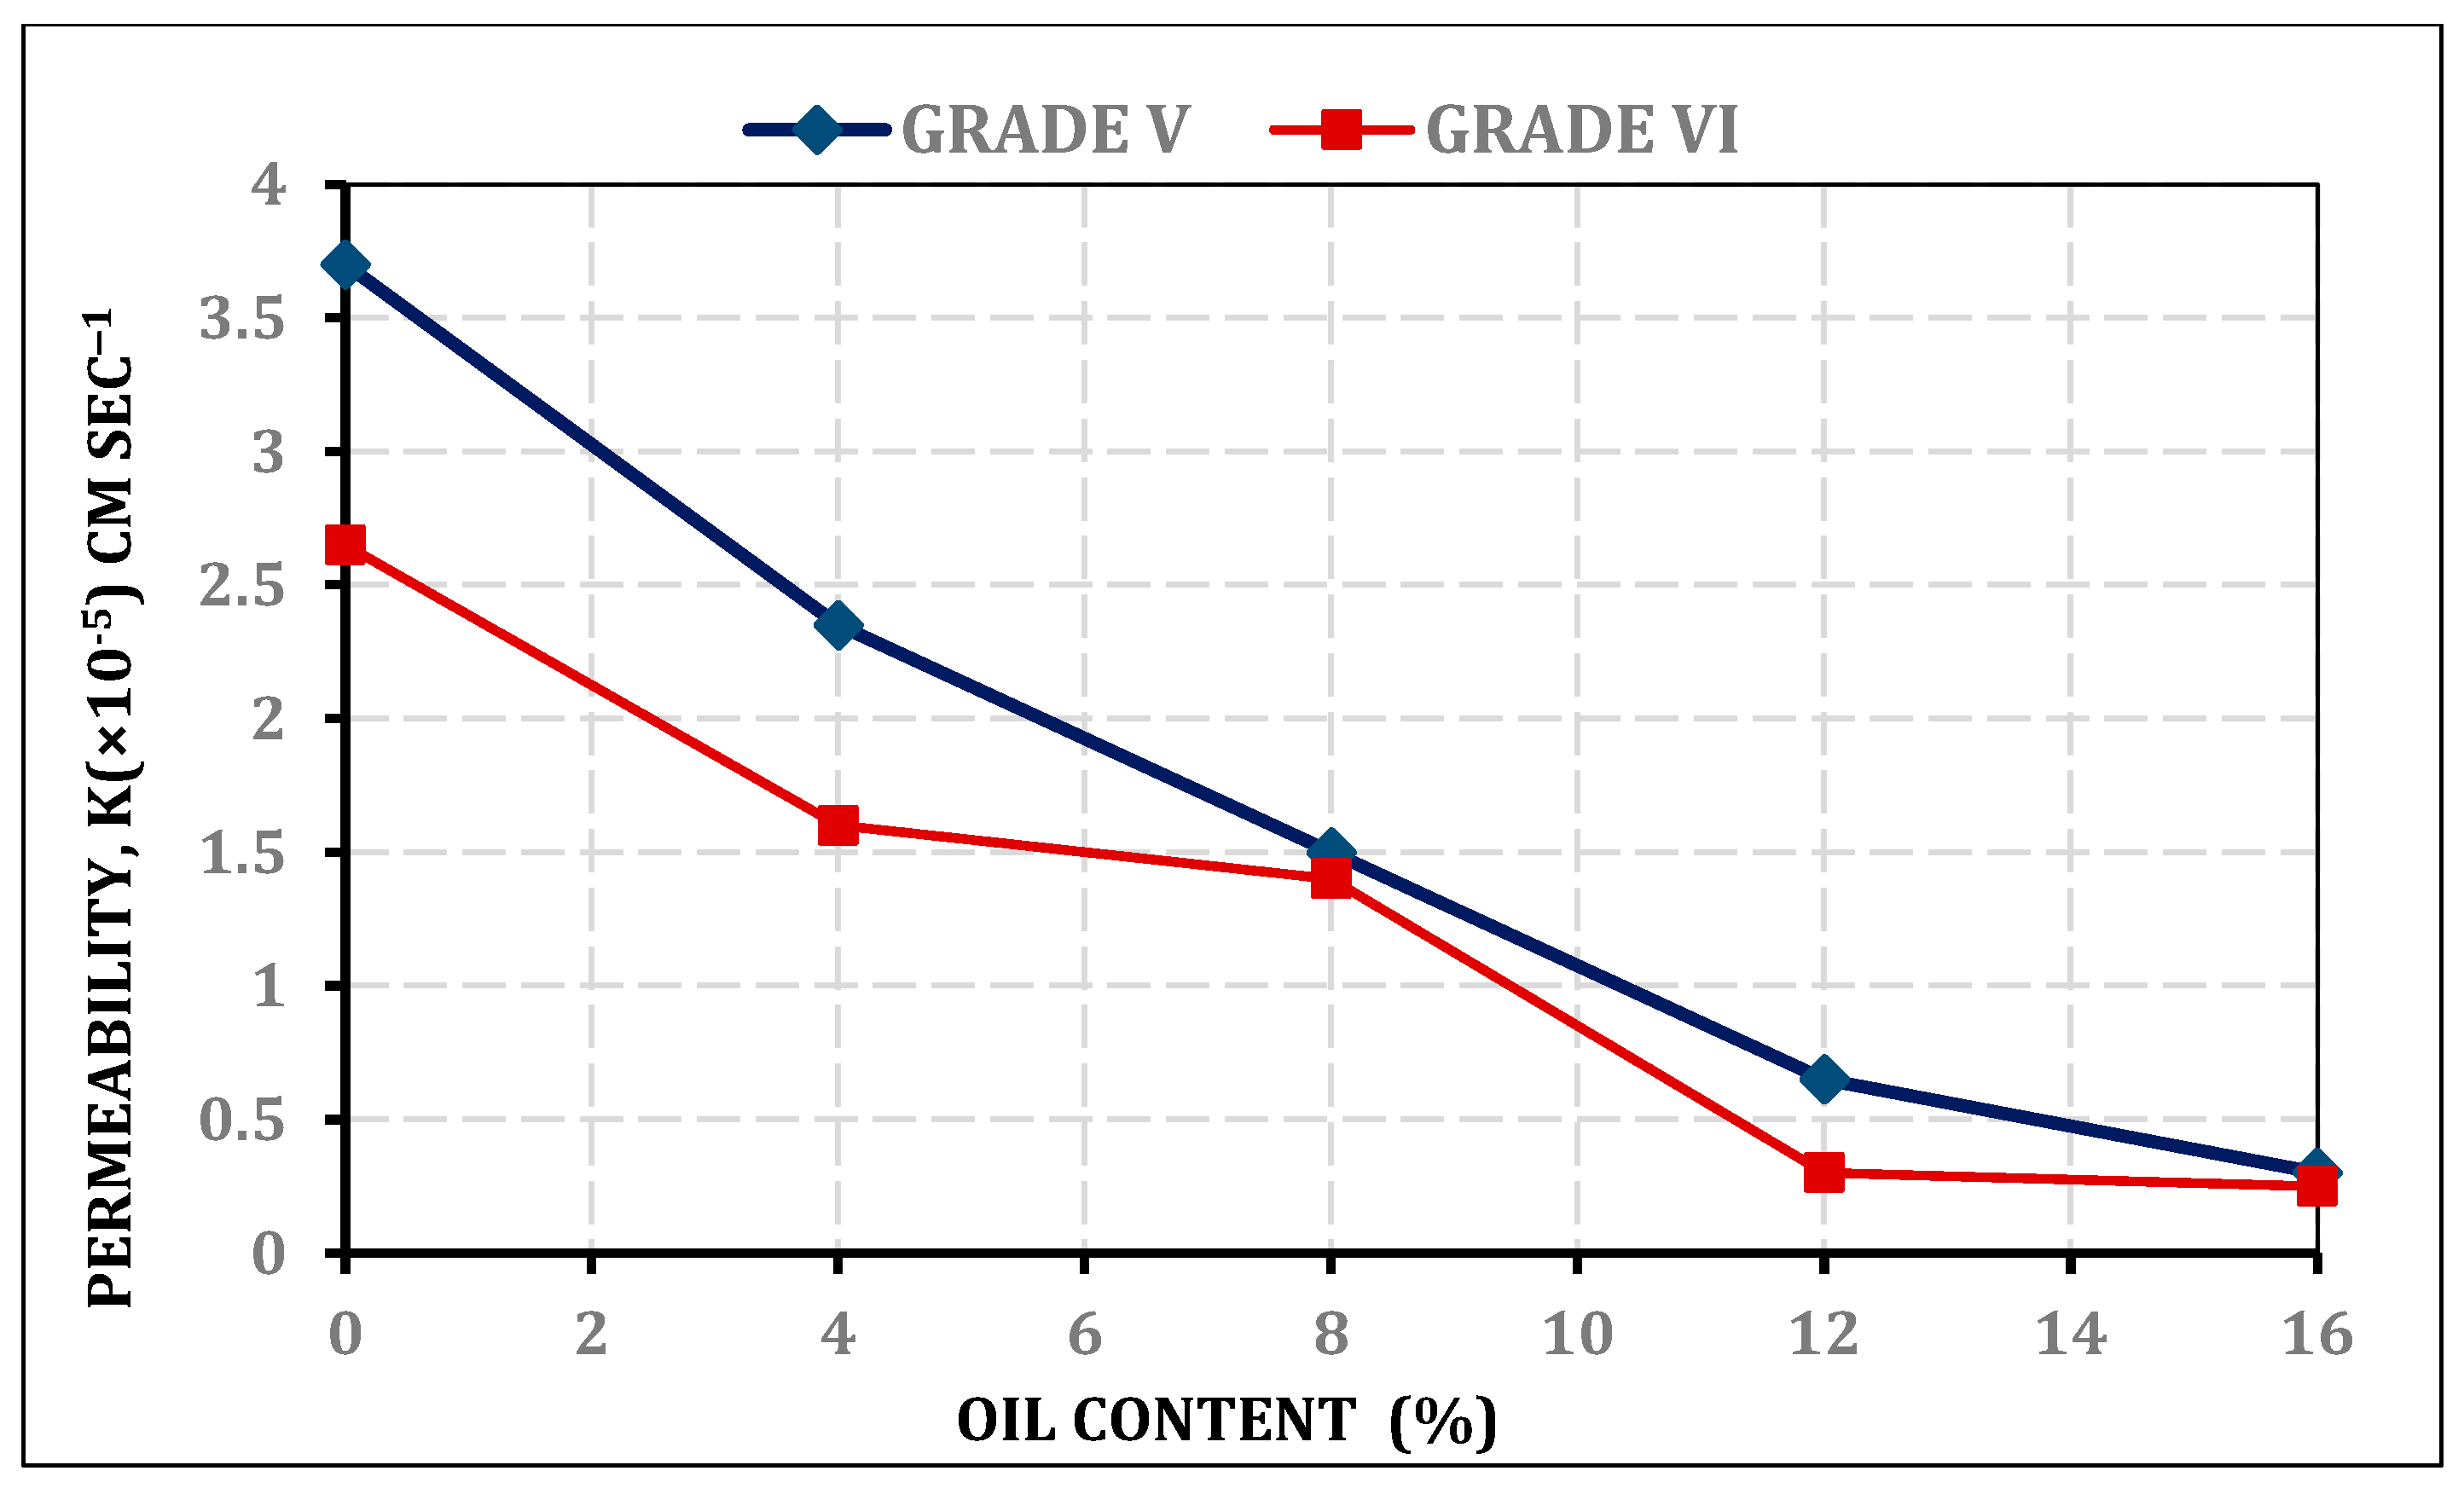
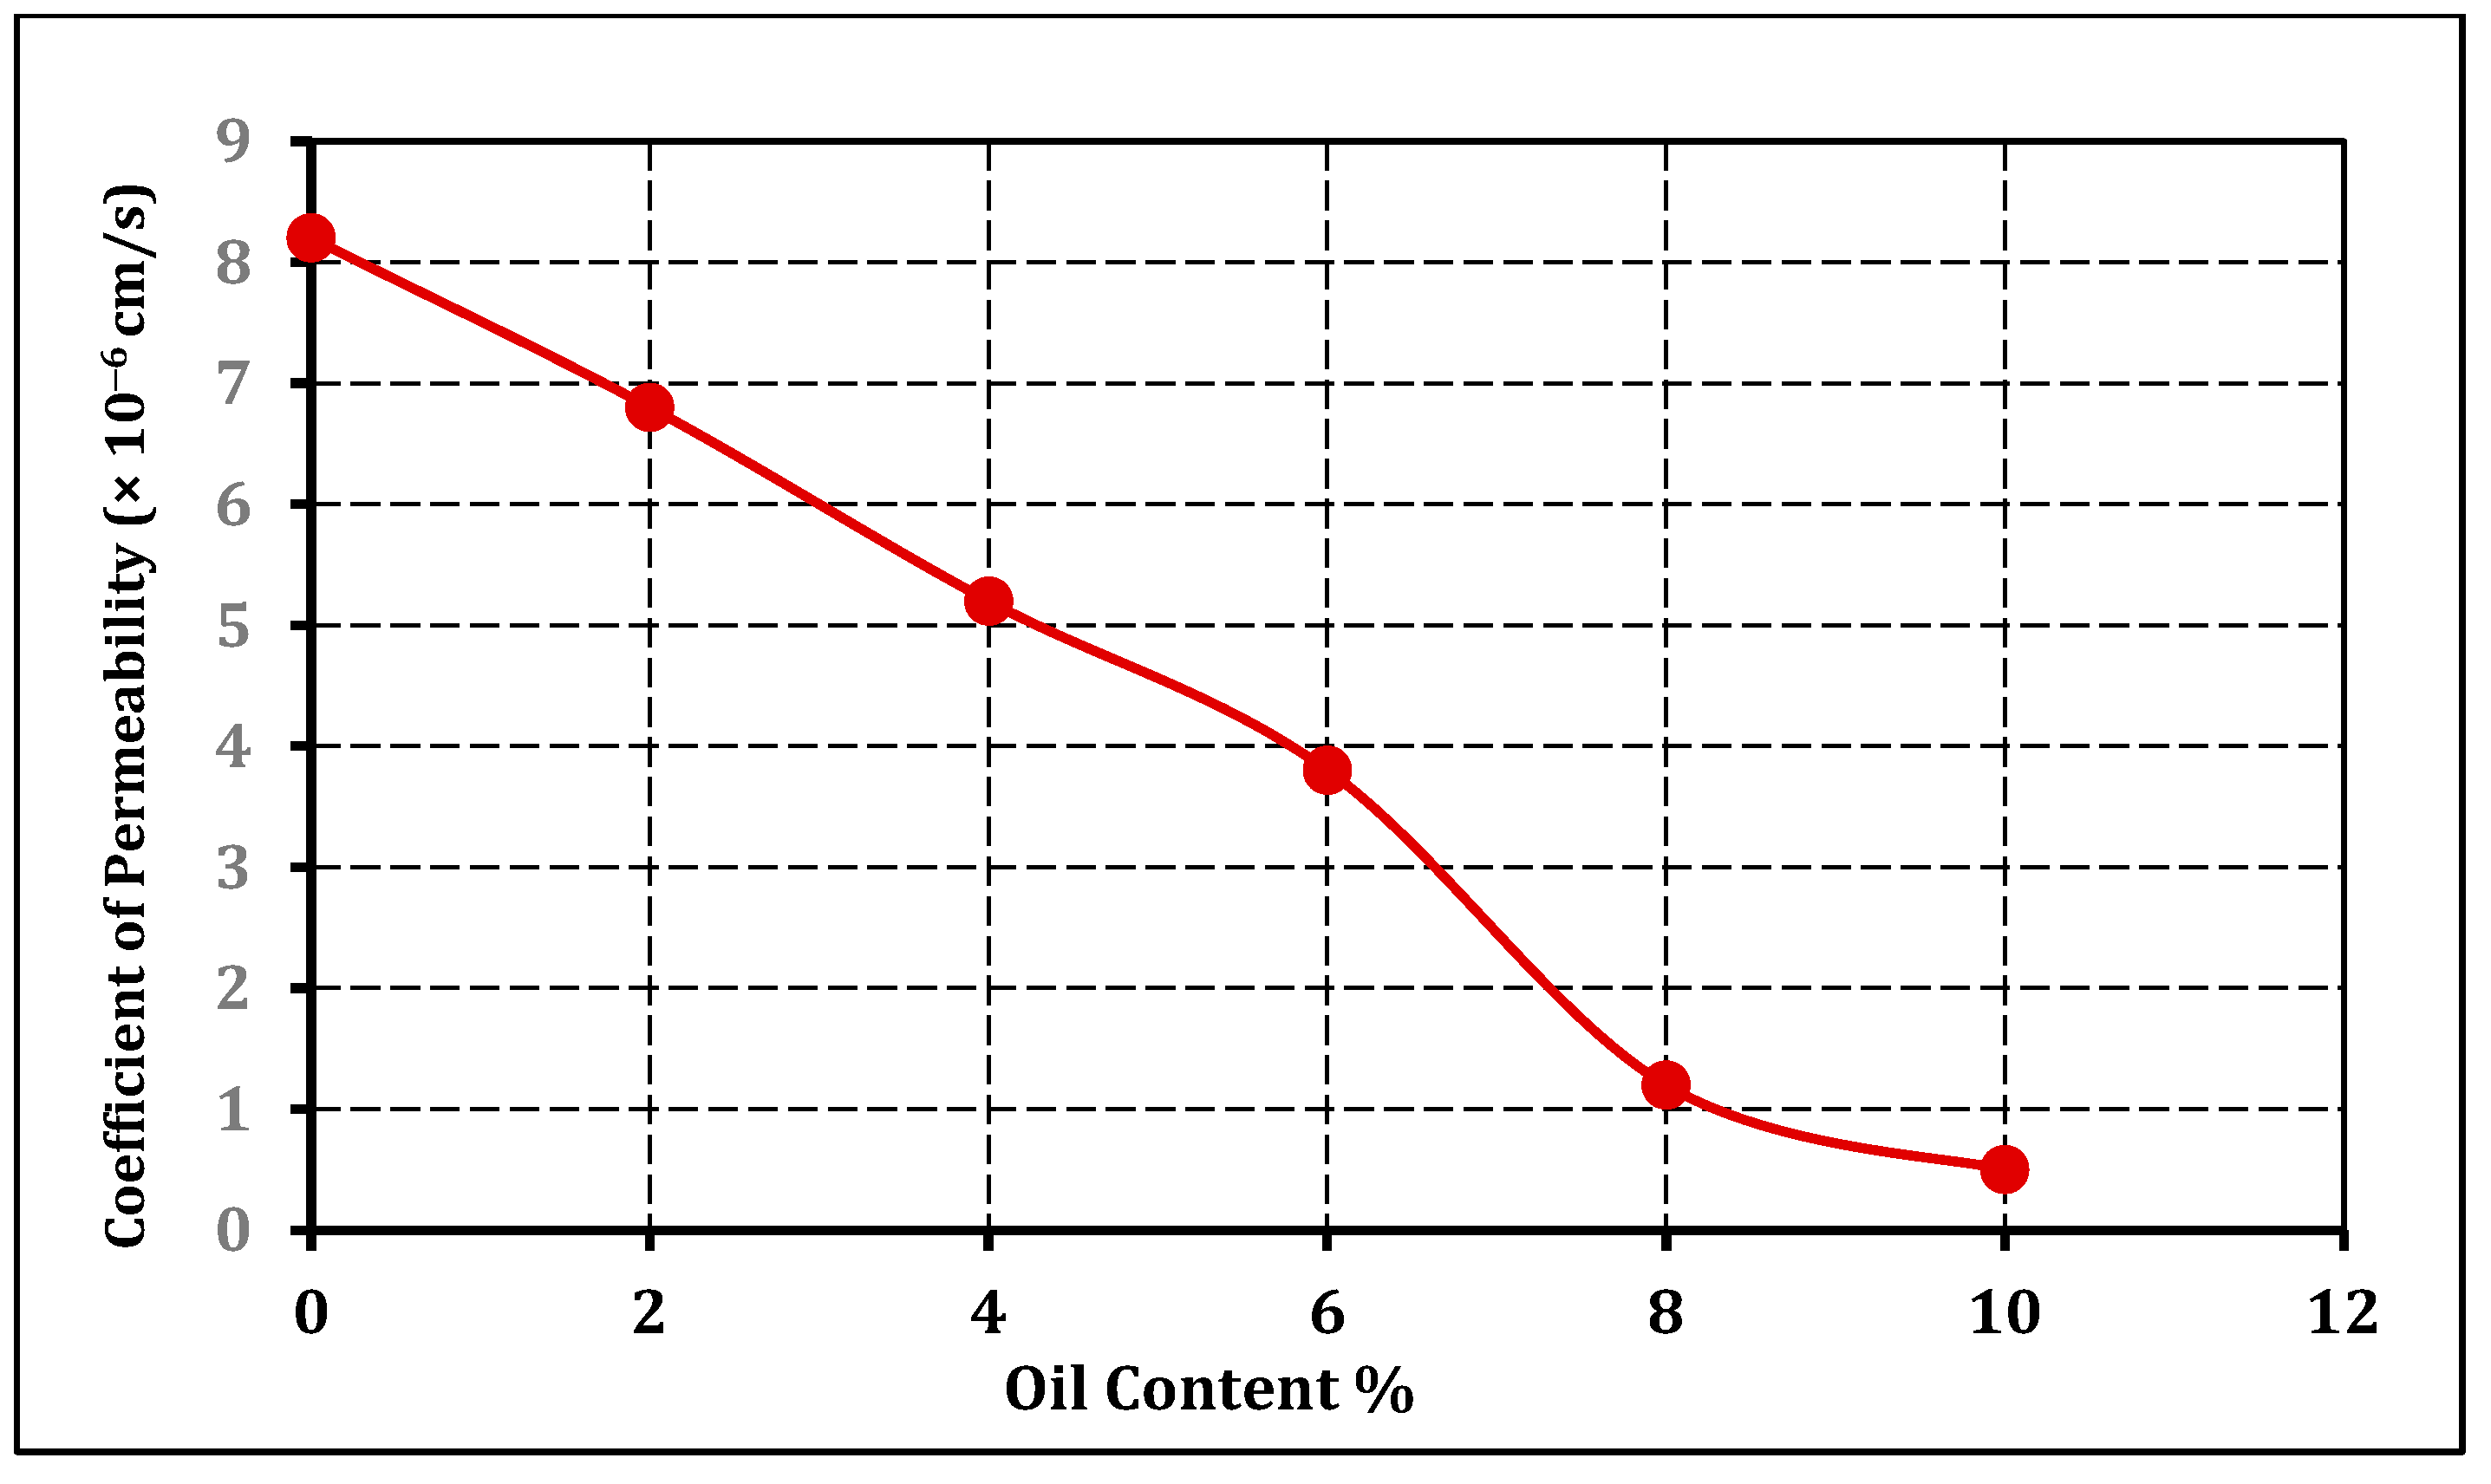
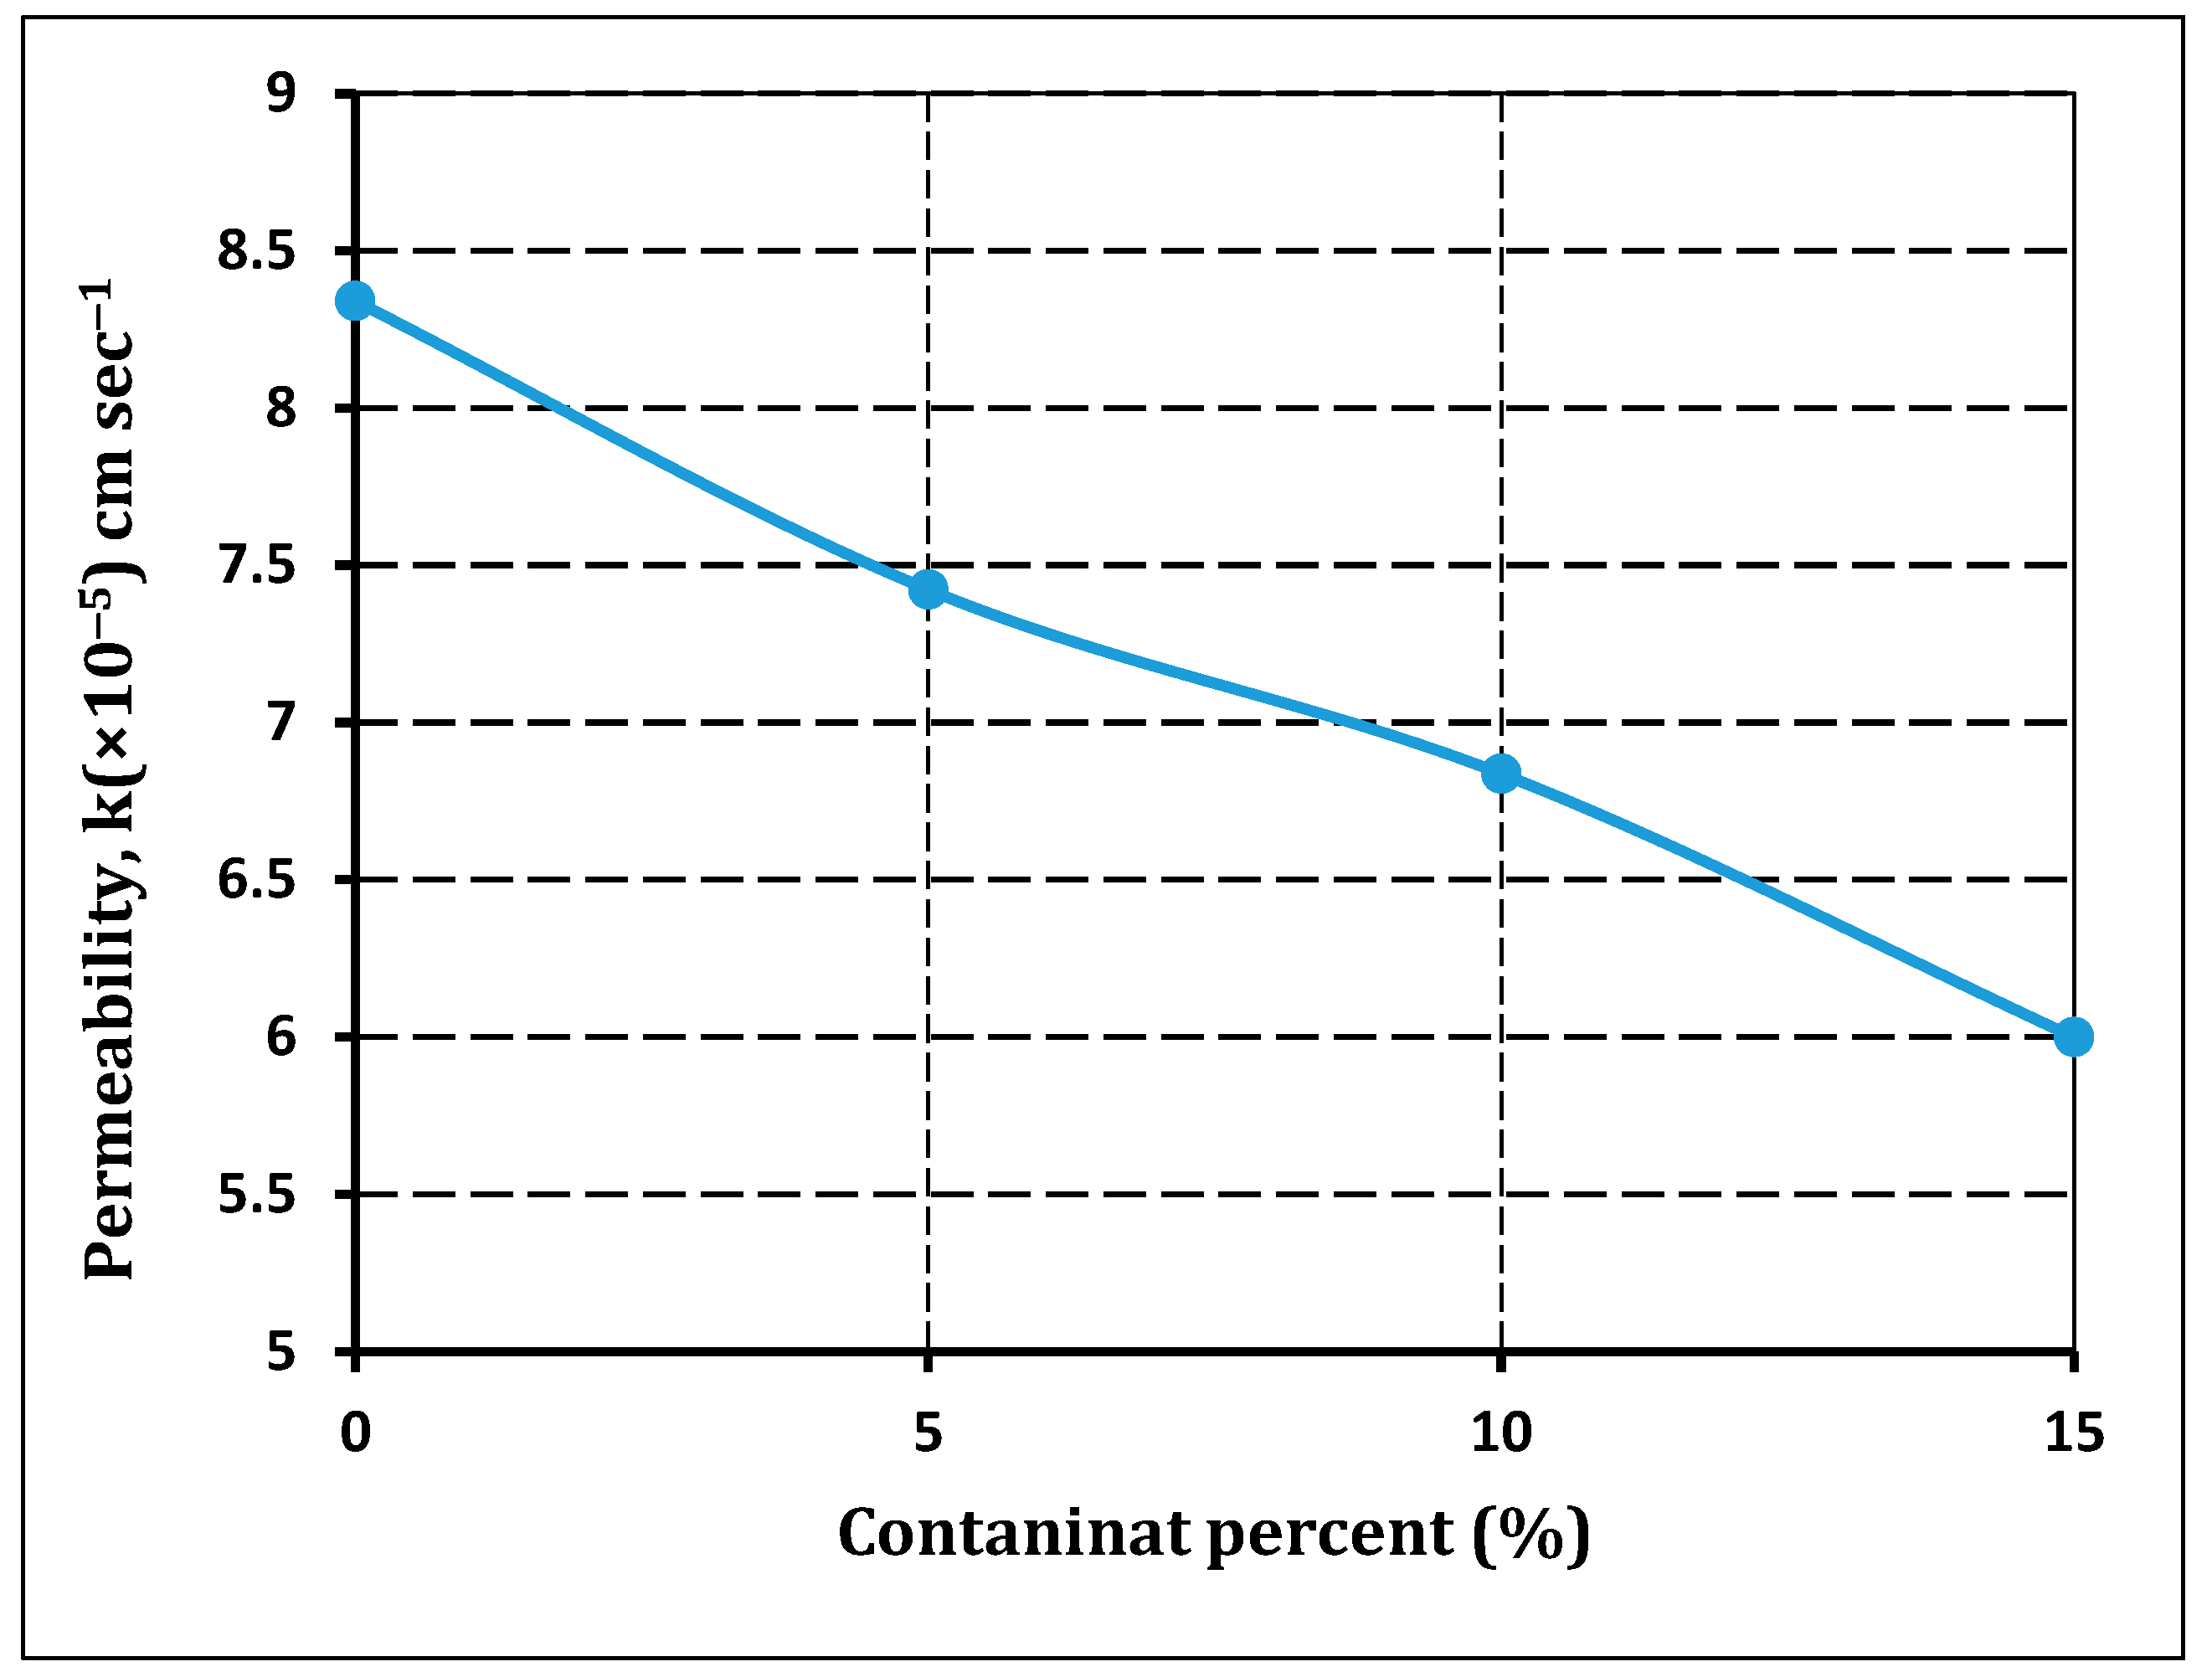
The liquid and plastic limits of the contaminated soils have decreased due to the presence of oil [22]. The liquid limitations for polluted soil grades VI (silty loam) and V (sandy loam) decreased by 38% and 16%, respectively. The plastic limit for silty loam soils has shown a modicum decrease in humidity with increased oil content compared with that of polluted sandy loam soil (38%). The increase in the plasticity index was observed only in grade VI (silty loam), as seen in Figure 1b.
Hydrocarbon contamination ranged from 2% to 16% of the dried weight across the five sets. In order to detect hydrocarbon contamination in soil samples, this research employed commercially available engine oil. The engine oil had the following properties: Water around the charged mud molecules is exchanged with non-polarised oil solutions, as evidenced by the mud’s density (at 15 °C) = 0.889 kg L−1, pour point = −6 °C, flash point = 266 °C, kinematic viscosity (at 40 °C) = 8.2 cSt, and kinematic viscosity (at 100 °C) = 11.1 cSt. Oil touches the clay particles sooner, eliminating the interaction between the water and clay particles. The five sets were dried in an oven at 105 °C. Then, the samples were mixed with crude oil in the amounts of 0, 4, 8, 12, and 16% by weight of the dry soil samples. Similar patterns of behaviour were seen for silty sand S.M. and lean clay CL soils [23]. The liquid limit value for five samples decreased from approximately 36 to 22% when the oil content increased from 15 to 16%. Moreover, the plastic limit for the five samples decreased by approximately 19 to 11% when the oil content increased from 15 to 16% as displayed in Table 1.
Figure 2a,b shows that polluted soils decrease the plastic and liquid limits while decreasing the plastic indicator compared to CL. Fuel oil pollution has changed the Atterberg soil limits, which are recognised by the rise in the plasticity index (7%), liquid limit (11%), and plastic limit (34%).
Table 2 displays the decrease in the liquid limit (11–15%), plastic limit (17–22%), and plasticity index (4–8%) as a result of adding fly ash at varying percentages (5%, 10%, and 20%). Both the liquid and plastic limitations were found to be decreased once cement was added. The results were obtained when the contaminated soil was treated with the additive admixture combining 10% lime, 5% fly ash, and 5% cement (liquid limit 25%, plastic limit 19%, and plasticity index 6%), as shown in Table 3. When the soil was treated with 10% lime, 5% fly ash, and 5% cement admixture, not only did the O.M.C. increase to 15.80%, but the γdmax increased to 1750 kg/m3. Table 3 shows the Atterberg limits and UCS (unconfined compressive strength) of soil treated with additive admixtures.
The impact of fuel oil pollution and the rise in the Atterberg limits of polluted soil is due to an increase in the double-layer thickening of mud metals such as iolite, kaolin, and chlorite. Table 4 and Figure 3 show the characteristics of the soil limits of the plastic CL that were researched, and it was discovered that the feature tends to grow distinctly as the oil substance rises. The value of the plastic limit increases approximately from 22% to 55%, the liquid limits increase approximately from 45% to 61% with a mild regression, and the plastic indicator drops approximately from 20% to 5% as a result [24].
Water molecules contain a positive charge on one side and a negative charge on the other, making them bipolar. H2O is drawn from the negative-clay particles and cations in the double layer. H2 in water molecules is absorbed by the oxygen in the mud layer to create hydrogen bonds. All the water bound to mud molecules by engagement is double-layer water. Adsorbed water is the internal layer of double-layer water adhered tightly by mud. This arrangement of H2O in mud molecules provides clay soils with plastic characteristics. Free H2O is water in the porous space that is not absorbed by mud molecules and travels readily through the soil. Free water influences the liquid behaviour of the soil [25]. Ore oil coats mud molecules and prevents water from reaching double-layer water. Therefore, more water is required for plastic topsoil, which may explain the higher plastic limit. Water added to the soil within the experiments will join the free-water layer if the oil orients the soil particles.

2.2. Permeability

The permeability of weathered basaltic soil tends to decrease with increasing oil content, as noted by Rahman et al. [26]; the permeability values for grade V decreased from (3.6 × 10⁻⁶ to 0.25 × 10⁻⁶ cm/s) when the oil content increased from 0 to 16%; however, the permeability values for grade VI decreased from (2.6 × 10⁻⁶ to 0.25 × 10⁻⁶) cm/s when the oil content increased from 0 to 16%, as shown in Figure 4.
Oil-blocking specific inter-particle gaps are probably caused by the polluted soils’ reduced transmittance. According to the study, an increase in the oil content in contaminated soil reduces spaces between particles spaces for water leakage. The consequences of the transmittance experiments on the soil admixed with various percentages of crude oil content are shown graphically [27]. The permeability of the polluted soil reduced from (82 × 10−6 to 0.5 × 10⁻⁶ cm/s). When the crude oil concentration is raised from 0–10%, crude oil entrapped in pore spaces in polluted soil reduces pore diameters, as shown in Figure 5.

Permeability of Lateritic Clay

Permeability is inversely proportional to oil concentration. The coefficient value of permeability (k) is (3.47 × 10⁻⁵ cm/s) [28]. This value was lower for contaminated soil than that of uncontaminated soil (7.34 × 10⁻⁵ cm/s). Since crude oil occupies the pore spaces in oil-contaminated soil, the flux average across the soil is reduced because the void fraction in charge of aiding the motion of liquids inside the soil is reduced. A graphical representation of the results of permeability experiments on soil admixed with various percentages of crude oil concentrations is shown in Figure 6. As the crude oil concentration grew from 0 to 10%, the permeability of the polluted soil decreased from 0.043 to 0.008 cm/s.

3. Results and Discussion of the Current Study

After reviewing several studies on the improvement of contaminated soil, cement was the most effective substance among the others for its solidification property, cost savings, and effectiveness in a short time. Since the cement was used as a modifier, not a stabiliser, the additive contents were chosen to be within (3, 5, and 7%) to treat a soil contaminated with crude oil at different percentages of the liquid (5, 10, and 15%) by the weight of the soil. The Atterberg limits, the specific gravity of soil solids, and the permeability coefficient were evaluated separately for the contaminated and treated soils. All the soil samples treated with cement were tested in a curing time of 14 days.

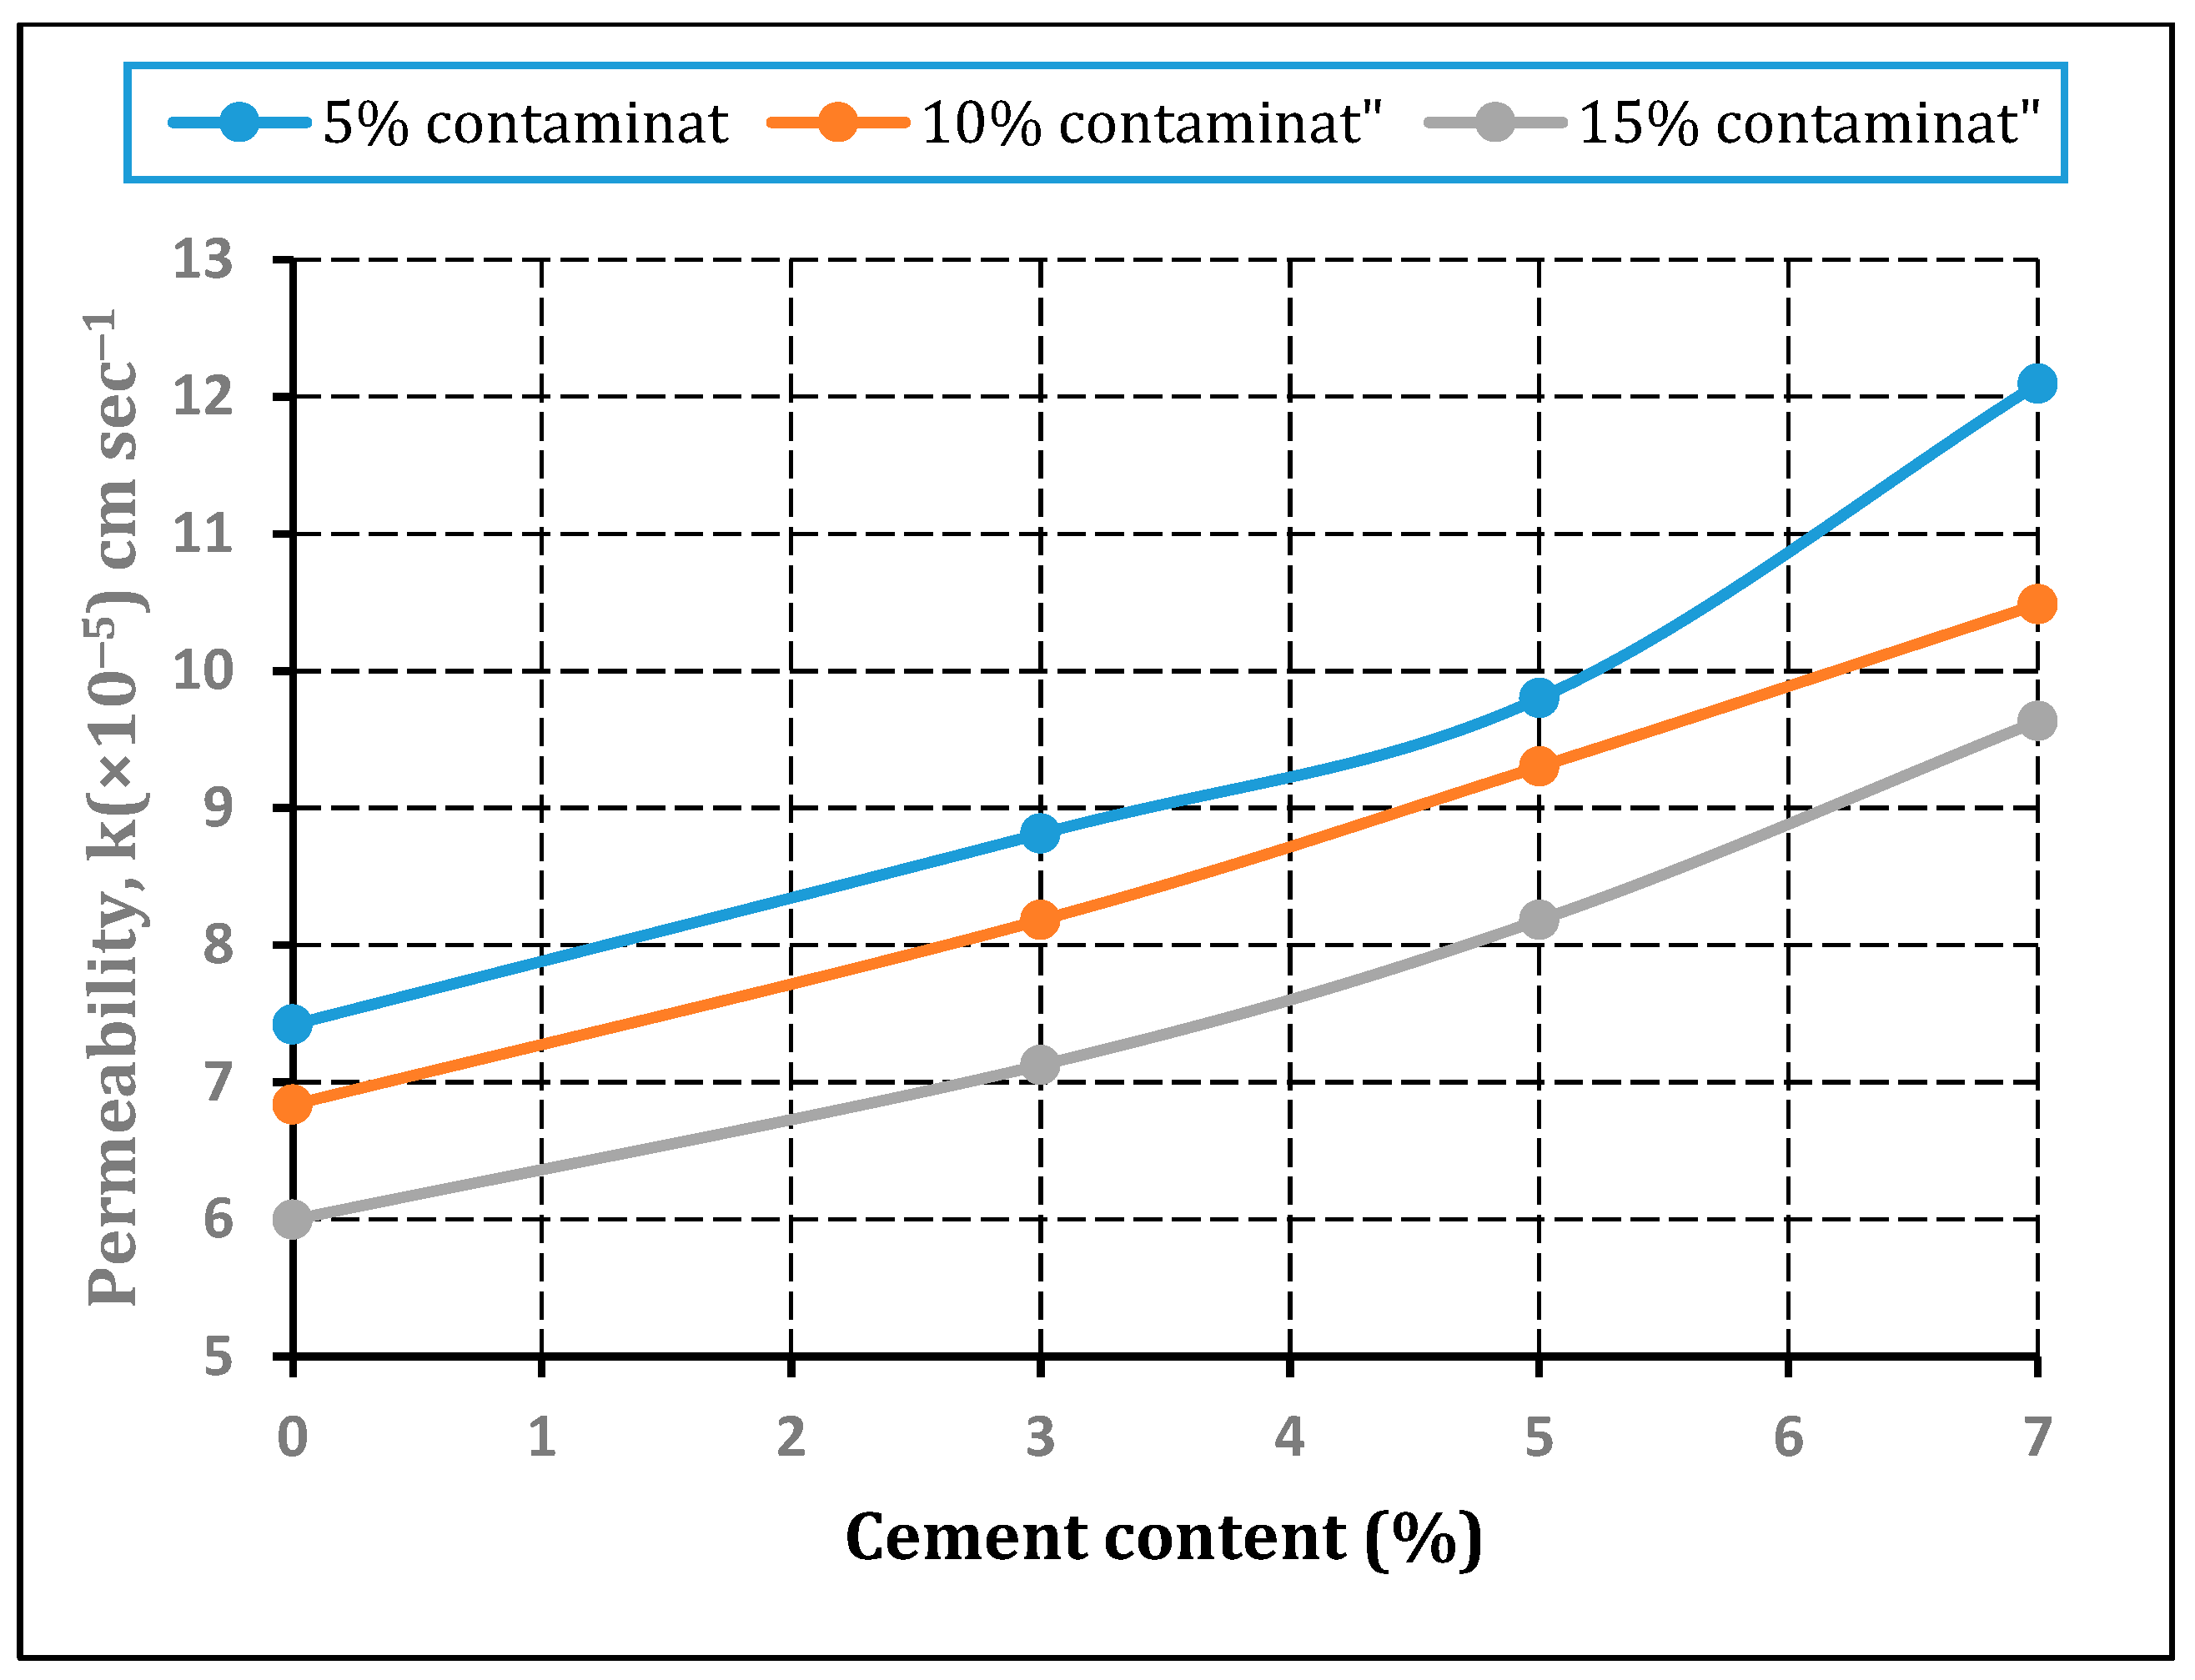
3.1. Effect of Cement Content on the Flow Characteristics of Soil

As illustrated in Figure 7 and Figure 8, the results demonstrate that the coefficient of permeability decreases with the addition of the contaminant. The crude oil, as aforementioned, tends to act as a waterproofing agent in which the passage of water through the voids is feasibly minimised. The coefficient of permeability (k) decreases by about 28% when the contaminant filling the spaces is nearly 15% of the soil weight.
It can be noted that the trend of the variation of soil conductivity with the admixture content is almost similar for all the contaminated soil samples. The results show a proportional relation between k values and the cement content, and the cement action does not vary widely among all contaminant concentrations The cement particles adsorb the water well due to the relatively large surface area and soften the inter-particle voids, reducing the plugging effect of crude oil and thus increasing the water flow rate with increasing the cement content.

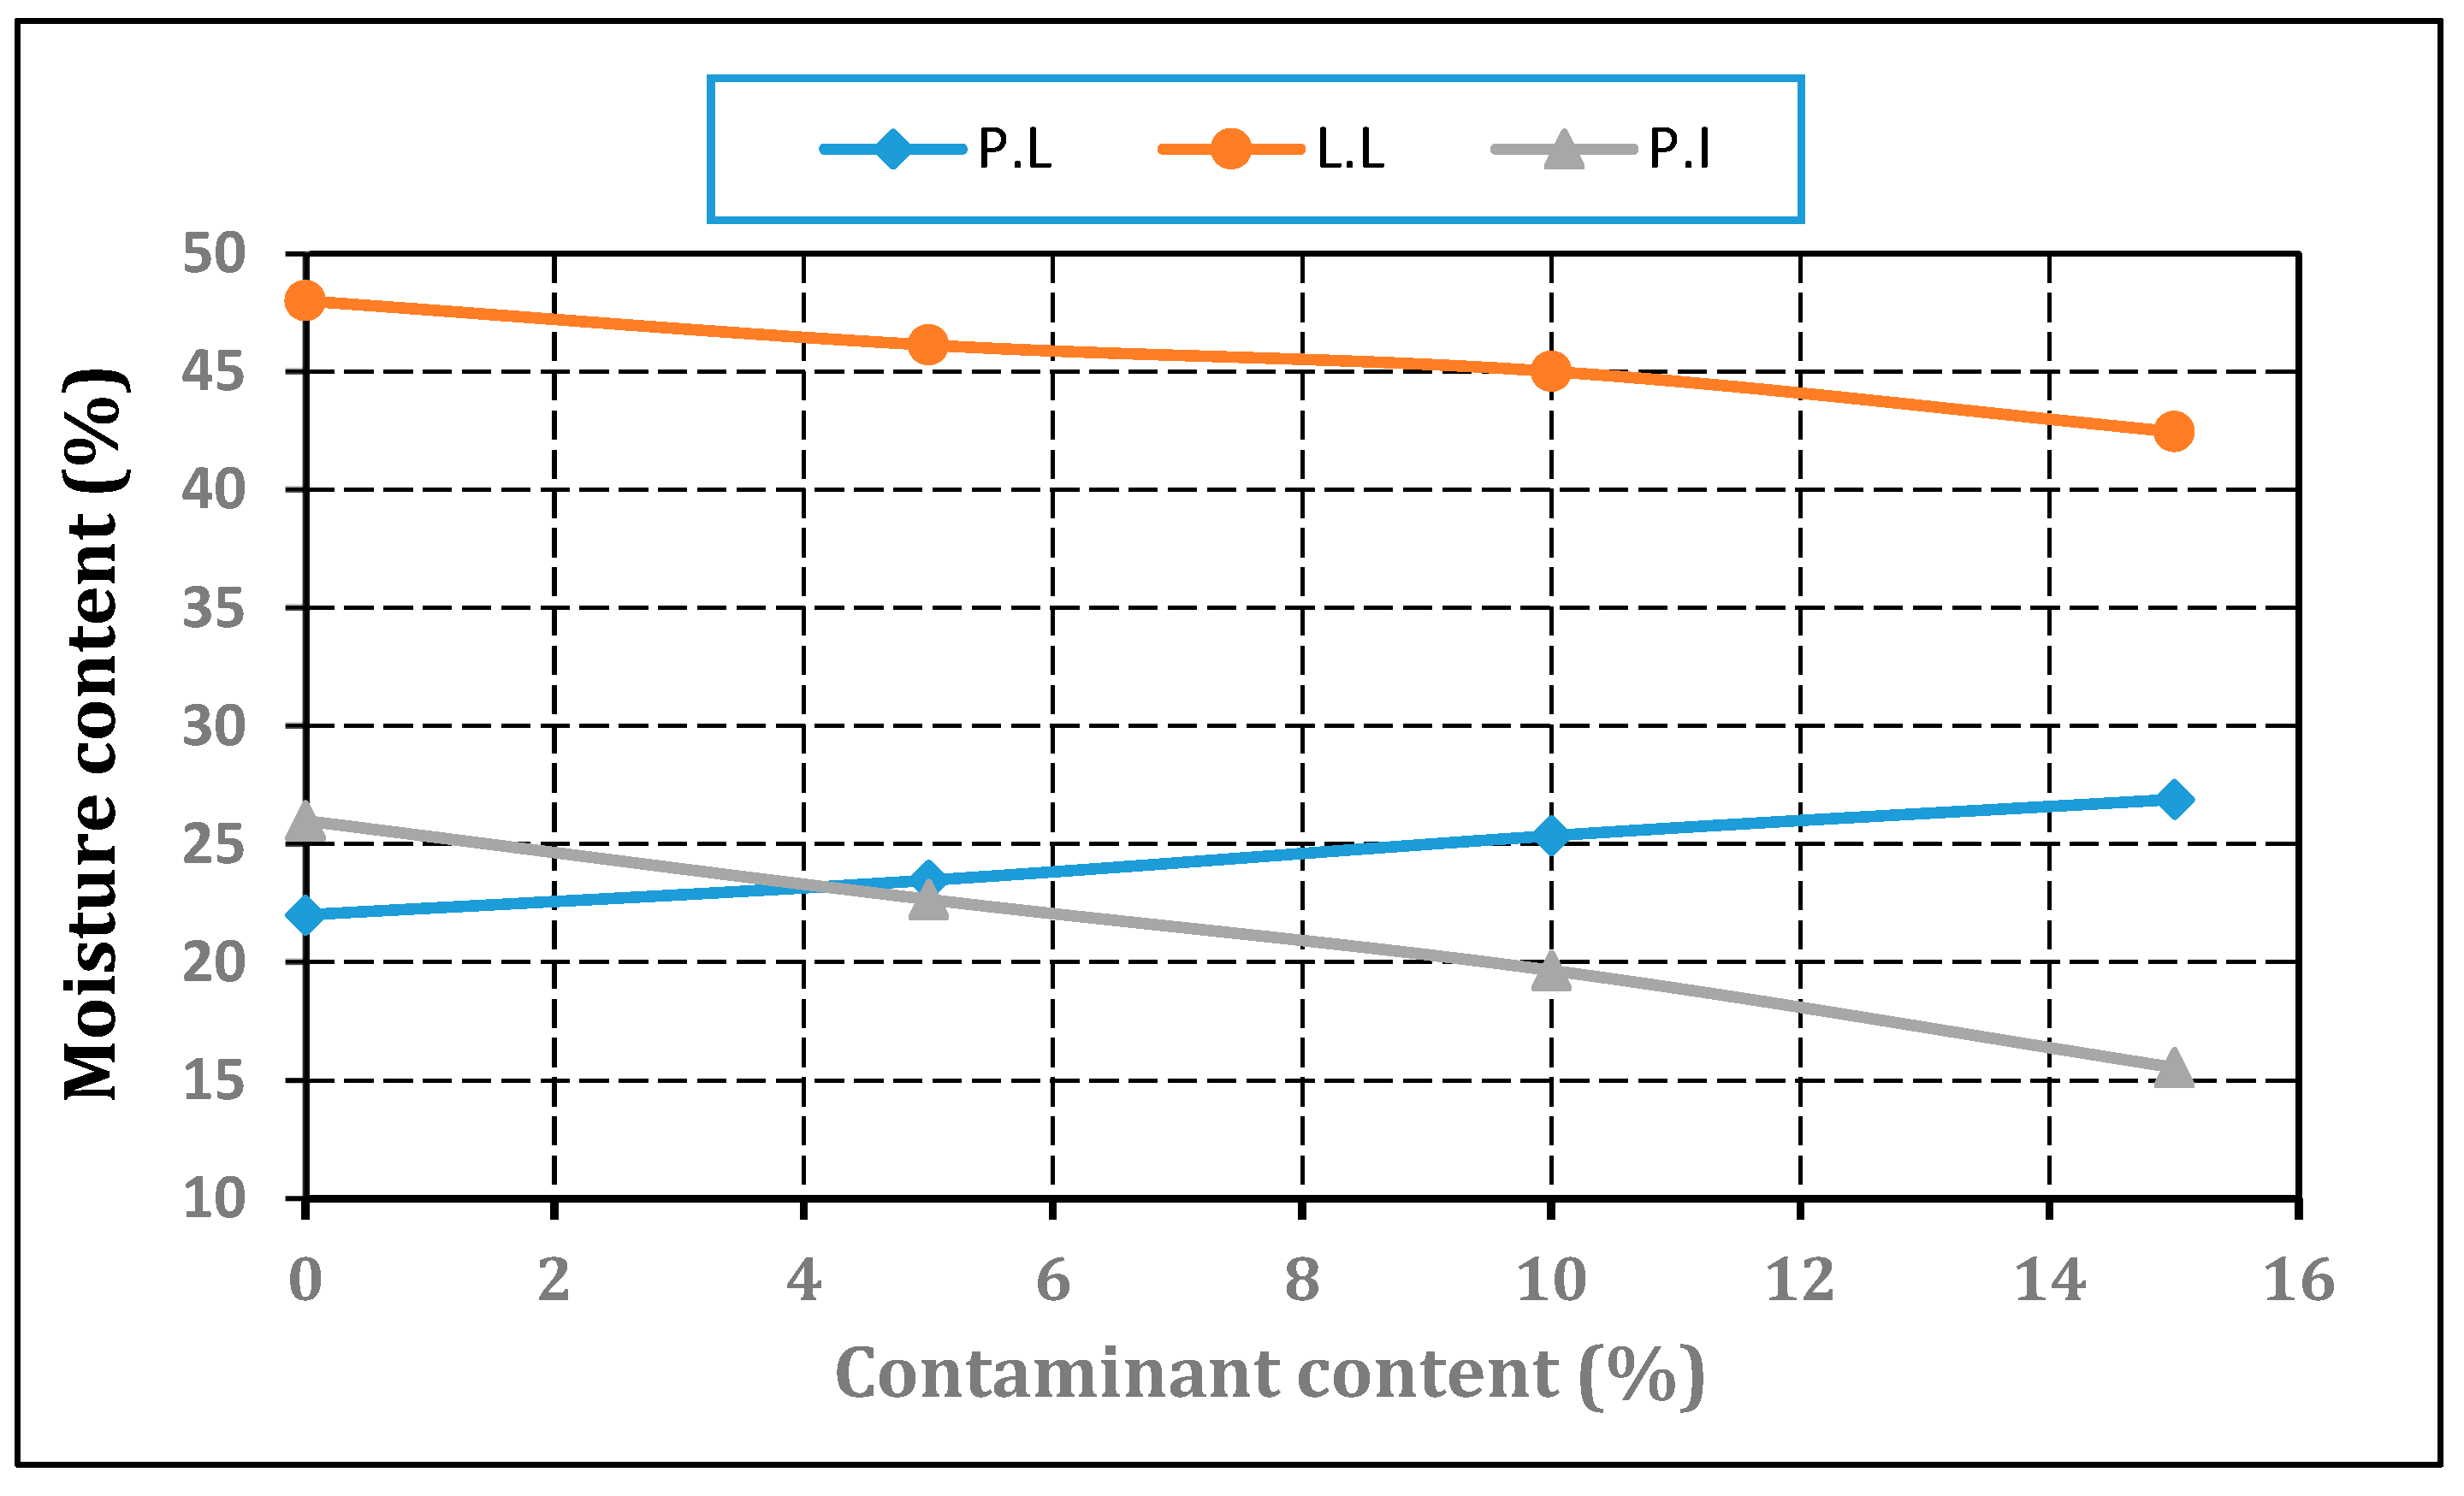
3.2. Effect of Cement Content on the Liquid and Plastic Limits of the Soil

As depicted in Figure 9, the results show that the crude oil in the soil voids tries to occupy more space than water. Further increase of the contaminant content produces an appropriate opportunity to coat the soil particle surface, and thus a stronger tendency of the soil to be granulated without plasticity. The results reveal that the liquid limit values are 48, 46, 45, and 42 at crude oil concentrations of 0, 5, 10, and 15%, respectively. The contaminant-filled soil spaces reduce the double-layer thickness by decreasing the pozzolanic reaction between the water molecules and the charges located at the clay mineral surfaces. For the plastic limit, the trend of water content variation with crude oil presents a somewhat proportional relation. More oil content makes the soil structure more dispersed. Thus, more brittle behaviour is observed as the contaminant content increases, as shown in Figure 10.
As shown in Figure 10, the cement material efficiently reduces the liquid limit more than the plastic limit. The cement particles minimise the contaminant’s potential to cover the soil particles completely, leading to more pronounced spaces and less plasticity. The admixture produces almost the same impact in reducing the plasticity index (P.I) for all the contaminant percentages. For the case of 5% crude oil, the plasticity indices decreased from 22.7 to 10.8 when 7% of cement was added, where the P.I values were 15.7, 11.7, 7.6, and 4.7 for the soil contaminated with 15% crude oil content and treated by 0, 3, 5, and 7% of cement, respectively. The results proved that the best percentage of the additive was 7%, irrespective of the crude oil content.

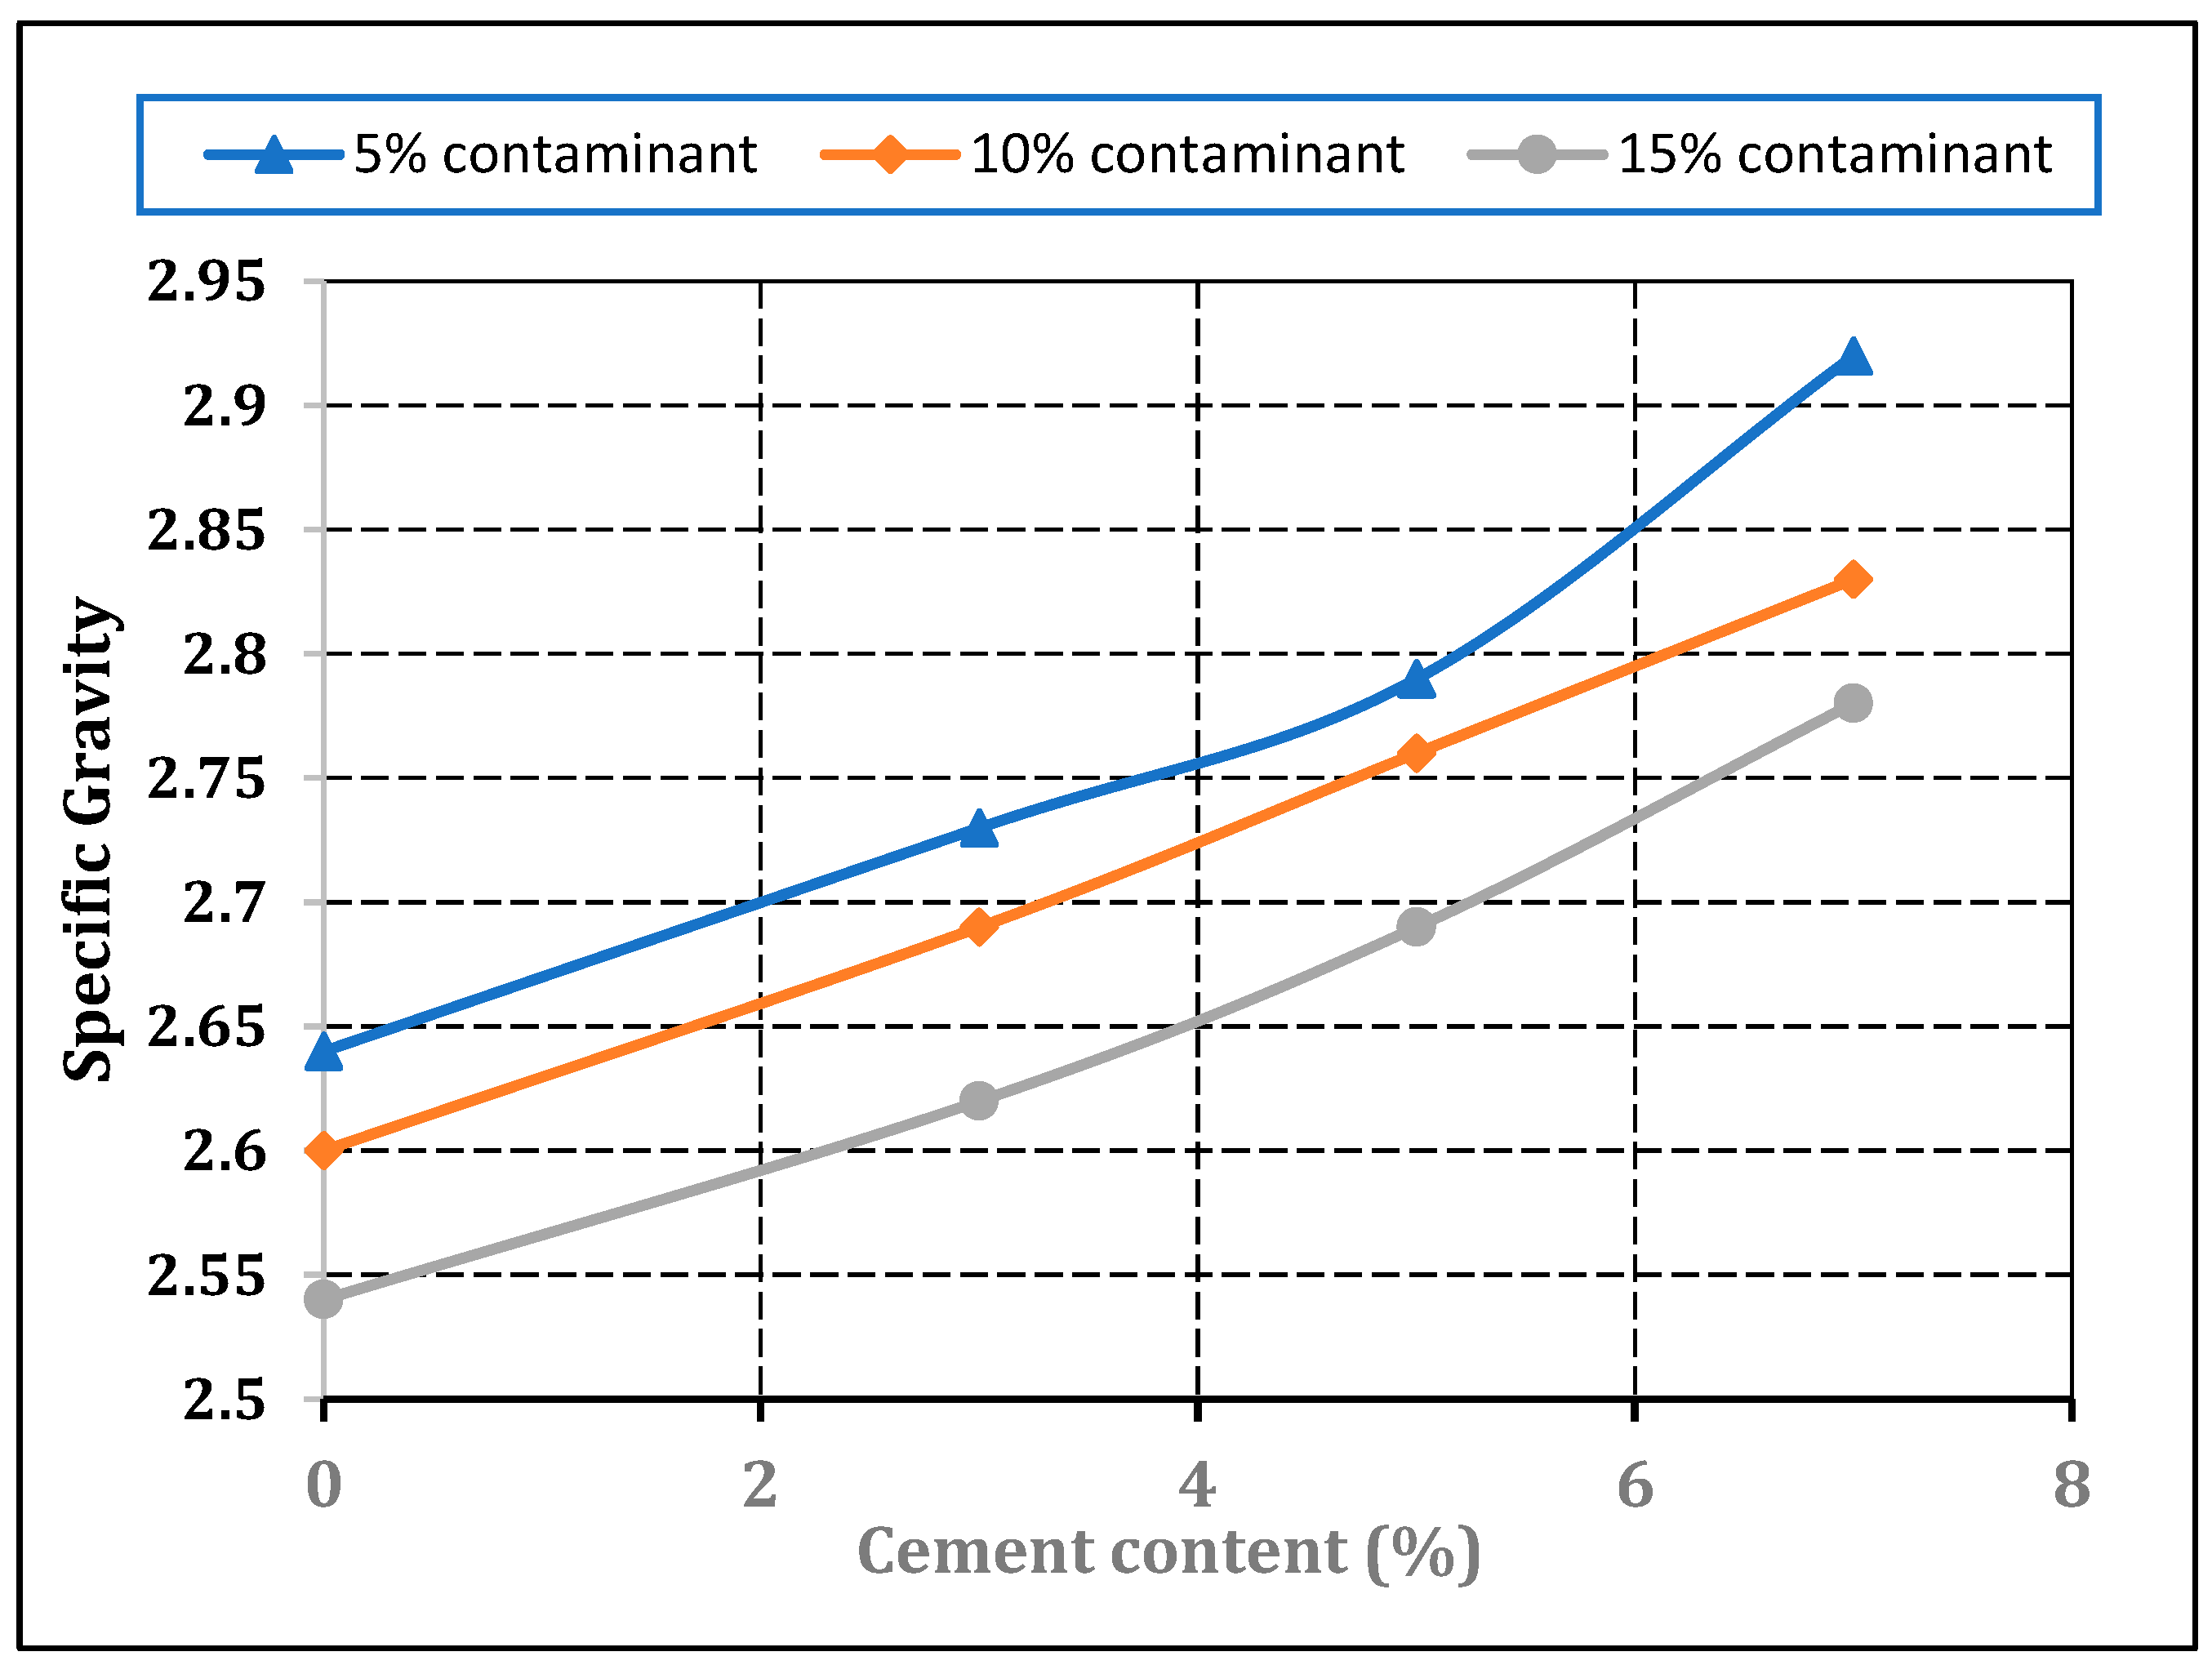
3.3. Effect of Cement Content on the Specific Gravity of Contaminated Soil

The value of the specific gravity of soil solids (Gs) is considered one of the material properties used to classify the soil and compaction process. The higher value of Gs indicates fine-grained soil and vice versa. The results exhibited a reverse proportion between the crude oil content and the unit weight of the soil solids. As shown in Figure 11, the value of Gs for the natural soil was recorded to be 2.7 and remarkably reduced to 2.64, 2.60, and 2.54 when the soil was contaminated with 5, 10, and 15% crude oil content. The agglomeration behaviour of the soil particles controls the size of the spaces due to the larger thickness of the crude oil at which the particles are more granulated, and then reduced specific gravity is generated.
In the treatment stage, the cement was added to the contaminated soil in three percentages: 3, 5, and 7%. For all crude-oil-contaminated soil, adding the cement material increases the specific gravity values of the contaminated soil, as depicted in Figure 12. The cement has a relatively higher unit weight compared to the contaminant substance; thus, the unit weight of the soil solids will be more considerable as the cement is added to the soil. The results have demonstrated that the cement could increase the specific gravity by 10% for all the contaminated soils, and its effectiveness does not vary frequently when the crude oil content changes.

4. Process of Remediation for Oil-Contaminated Soil

Over the last thirty years, several approaches for remediating oil-polluted soil have been developed.

4.1. Techniques for Biological Remediation

Bioremediation, or biodegradation, is how microorganisms digest crude-oil molecules through enzymatic processes, resulting in carbon dioxide, biomass, and water-soluble chemicals. Some bacterial types prevalent in the climate, such as mould, yeast, archaea, and fungus, may feed on crude-oil molecules [29,30,31]. Compared to chemical or physical reform, bioremediation is frequently employed because of its benefits of tremendous impact, quick decomposition rate, and absence of minor contamination.
Biological cleaning uses bacteria that can eat hydrocarbons, producing CO2 and H2O as waste. It was found in the water’s coastline, sediments, columns, and surfaces. Microbes that consume hydrocarbons arise naturally and increase after a spill as more nutrient sources become accessible. Heavy components are too complicated for bacteria to break down immediately and may take months or years. As far as biodegradable hydrocarbons are available, biodegradation begins quickly after a spill. It peaks during the first month following the spill but may be controlled by environmental nutrients.
Onsite bioremediation involves scraping polluted subsoil. Biological methods, such as hydrocarbon breakdown by physical procedures, chemical processes, or microorganisms such as soil venting or air sparing, are used for removing toxins from subsoil and groundwater. The hydrocarbon degradation method may need vertical and horizontal drilling, and it works better on sandy soils than clay soils. Surface pollution may be treated using spreading devices. It also increases aerobic bacteria growth by providing them with oxygen.
Ex situ bioremediation approaches need off-site soil treatment. Incinerating, chemically extracting, or washing the soil removes hydrocarbons. Steam stripping, combustion, extraction, and biological treatments are major ex situ treatment procedures. Chemical extraction uses solvents to dissolve or suspend soil pollutants. It may be used on various crudes and soils but works best on low-clay soil offsite or onsite, although off-site is faster and more efficient. In situ or ex situ surfactant washing is possible. Ex situ procedures may be used if the quantity of polluted soil is modest or if the pollution happened in an industrial or residential location. Offsite treatment is more effective since the pH, temperature, salinity, and moisture may be controlled.
Bioremediated oil-polluted soil utilising microbial consortium and agricultural residues degraded oil ingredients [32]. After 40 days, 68% of the oil was decomposed using the water of pigs and other additives, proving that specific strains of bacteria may be employed in bioremediation. Ochrobactrum, Stenotrophomonas maltophilia, and Pseudomonas aeruginosa degrade ore oil (3% v/v) by more than 80% [33], whereas a separate combination of bacteria degraded diesel-contaminated soil by 89% after 365 days. Most hydrocarbons are hydrophobic and bioavailable; therefore, bioremediation may not work [34].

4.2. Techniques for Physical Remediation

Achugasim D. et al. discovered that a soil-washing agent might remove benzene, tolune, ethylbenzene, and xylene (BTEX) from oil-polluted soil with elimination percentages of 97%, 95%, and 95% for acidic, neutral, and basic pH bands, respectively [35]. Although there was a high elimination percentage, the process did not remove polycyclic aromatic hydrocarbons from the crude oil. The elimination percentages were less than 27%, 41%, and 3% for polycyclic aromatic hydrocarbons in acidic, essential, and neutral bands. Persulphate should not be employed alone to remove hydrocarbons from crude-oil-contaminated soil, according to the study. Falciglia, P.P. et al. found that the efficiency of thermal adsorption and desorption in gas oil-polluted soil at low temperatures depending on the soil structure, texture, treatment duration, and temperature of 175 °C was adequate to desorb diesel-polluted sandy and silt soils, whereas a temperature of 250 °C was required for clay soils [36].
The ultrasonic desorption of petroleum hydrocarbons in fine soil was 61 and 49% from 27.6% silt and 55.3% clay, respectively. Increasing the power boosted the removal rates and found a 61% elimination of total petroleum hydrocarbons in fifteen minutes utilising one hundred and sixty watts of electricity but no further drop, presumably owing to steady-state re-adsorption on the soil [37]. Although studies on ultrasonic remediation are limited, it is expected that it aids bioremediation to decompose clayey soil, whether used simultaneously or as a pre-treatment.

4.2.1. Excavation

Polluted soil is relocated from where pollution happens to the establishment or where exposure to possible contaminants may be managed efficiently. This technique may remediate both inorganic and organic pollutants. The treatment of engraved soil might be conducted offsite, onsite, or in a dumpster. However, excavation is the safest and quickest technique to treat ore-oil-polluted soil, which is neither sophisticated nor inexpensive [38]. Though this procedure is easy and effective, it is incredibly lengthy. It may be harmful, time-consuming, and expensive owing to the transmission of polluted soil to the disposal location and the need to care for dumpsters formed in the process.
Since industrial and mining waste represents 75% of the waste, the quantity of trash in mine dumps defines environmental threats. As a result, air contamination from fumes of pollutants is randomly released into the sky.

4.2.2. Incineration

During incineration, toxic soil is burned at high temperatures under controlled settings. The vaporised contaminants are removed via devolatilisation or collected. That is one of the simplest ways to dispose of the oil in the soil. Using a pilot-scale combustor for practically all oil pollutants may eliminate the polluted ground at roughly 800 °C. Onsite controlled-flame combustion is the cheapest option for remediating contaminated soil. However, it is not ecologically friendly since combustible and volatile chemical compounds in ore oil may create ecological contamination [39].

4.3. Techniques for Chemistry Remediation

Oil in polluted soil may also be removed chemically. Thermal stripping, chemical oxidation, and photochemical oxidation are chemical processes.

4.3.1. Oxidation

Chemical oxidation is another way to eliminate hazardous chemicals from soil. Oxidation of organic pollutants is performed by using reactive oxidants such as hydrogen peroxide (H2O2), ozone (O3), permanganate (MnO4), and persulphate (S2O82−). The approach depends on the soil medium for efficiency [38]. The Fenton reagent, a mixture of Fe+3 and H2O2, is also employed in chemical oxidation. In contrast, in the reaction of Fenton, the Fe+3 inducts processes while H2O2, an oxidising agent, creates O.H. ions. The efficiency of the Fenton reagent on oil removal from sand at a low pH has been proven. Under the right circumstances, this technology removes forty-eight percent of total petroleum hydrocarbons in polluted soils in two hours, indicating it might be utilised to eradicate T.P.H.s from contaminated soils quickly [40]. Other studies have used O3 as an oxidative approach for eliminating oil from the soil since it is readily created, stored, and managed notably under in situ remediation. Soils treated with this technology may be reused since O3 returns to O2 rapidly. Some studies have combined bioremediation with ozonation to boost the effectiveness of the decomposition process. Despite the numerous advantages of ozone, it kills soil microbes. Therefore, supplementation is essential for soil repair. The oxidation process is typically utilised in heavily polluted soil since its implementation is in toxins and at short-range may be oxidised for weeks. The approach may not work well in low-permeability soils [41].

4.3.2. Photochemistry

Photochemical oxidation changes a chemical under sunshine. In this approach, a contaminant–catalyst combination is bombarded with light (U.V. or sunlight), causing organic contaminants to oxidise and create CO2 and water. A stable equivalence range and an unoccupied high-energy conduction band characterise semiconductor stimulators. Irradiating these semiconductors starts photocatalytic processes that promote an electron into the delivery range and produce a puncture in the equivalence band [42]. Photocatalytic reactions create hydroxyl (O.H.−) and superoxide (O2−) anion radicals, which oxidise organic pollutants at the semiconductor surface. High temperatures, exposure periods, or oxygen concentrations accelerate photochemical oxidation in nature.
The photochemical oxidation process degrades oil in soils. Additionally, researchers have employed semiconductor photocatalysts to remediate organic contaminants in soil. The photocatalytic pre-treatment improved biodegradability and oil solubility [43]. Photocatalytic treatment of oil-polluted soil with titanium dioxide (TiO2) and bioremediation may eliminate total petroleum hydrocarbons (T.H.P.s) only if enough light is infiltrated [44]. Previous results show that oxidative photodegradation removes all types of total petroleum hydrocarbons, indicating nonselective elimination. In contrast, removal increases with humidity content, keeping with the concept that water is necessary for hydroxyl radical formation. Photochemical oxidation of oil using a TiO2/zeolite composite is an environmentally friendly technique to eliminate oil deposits.

5. Conclusions

Petroleum hydrocarbons enter the environment due to accidents and oil spills. When the oil comes into contact with soil, it affects the geotechnical properties, and this contamination needs remediation in order to not reach the groundwater and cause damage to the environment.
  • Considering the Atterberg limits, there are two opinions: The first one is that oil reduced the moisture content of the liquid and plastic limits of the polluted soils; the plastic index rose with oil-polluted soils. This might be because the water about the charged mud molecules is changed with non-polarised oil solutions. The second one is that both values of the liquid and plastic limits increase, the plastic index drops, and the ore oil wraps mud molecules and prevents water particles from reaching double-layer water; therefore, plastic soil requires more water, which may explain the higher plastic limit, and water added to the soil will join the free-water layer if the oil orients the soil particles.
  • Increasing oil contents reduce permeability values due to the oil blocking specific inter-particle gaps in the soil. A reverse proportion was noted between the permeability value and the amounts of cement added to the contaminated soil due to adsorption behaviour.
  • The appropriate percentage of cement to modify the geotechnical properties of contaminated soil is 7% and affects the results evenly, irrespective of the contaminant content.
  • Adding cement in amounts from 3 to 7% to the contaminated soil may convert the behaviour from fine-grained to coarse-grained soil, leading to a smaller dry unit weight at a higher water content.
  • Bioremediation is a natural process that does not add secondary chemicals to the soil and can completely mineralise oil into the water and carbon dioxide. Furthermore, photocatalysis mitigation may assist in smashing long-chain hydrocarbon portions of oil into primary forms that microorganisms can naturally break. As a result, the time required to restore polluted ground or soil was reduced.

Author Contributions

Conceptualizations, H.M.M., Y.A.J.A.-H. and A.A.A.; data curation, H.M.M., A.A.A., A.S.R. and Z.B.M.; formal analysis, Y.A.J.A.-H., A.S.R. and Z.B.M.; funding acquisition, H.M.M. and A.A.A.; investigation, A.S.R. and Z.B.M.; methodology, H.M.M., Y.A.J.A.-H.; project administration, H.M.M., A.A.A. and Z.B.M.; resources, H.M.M., Y.A.J.A.-H. and A.A.A.; software, H.M.M., Y.A.J.A.-H. and A.A.A.; supervision, H.M.M., Y.A.J.A.-H. and A.A.A.; validation, A.S.R. and Z.B.M.; visualization, H.M.M., Y.A.J.A.-H. and A.A.A.; writing—original draft, Z.B.M., Y.A.J.A.-H. and A.S.R.; writing—review and editing, H.M.M. and A.A.A.; project administration, H.M.M. and A.A.A.; funding acquisition, H.M.M. All authors have read and agreed to the published version of the manuscript.

Funding

This research received no external funding.

Institutional Review Board Statement

Not applicable.

Informed Consent Statement

Not applicable.

Data Availability Statement

Data are presented in the article.

Acknowledgments

The authors would like to express their gratitude for the support of the Ministry of Higher Education and Scientific Research-Iraq, the University of Baghdad-Iraq, and the University of Technology-Iraq.

Conflicts of Interest

The authors declare no conflict of interest.

References

  1. Hyman, M.; Dupont, R.R. Groundwater and Soil Remediation: Process Design and Cost Estimating of Proven Technologies; ASCE Press: Reston, VA, USA, 2001. [Google Scholar]
  2. Gavrilescu, M.; Pavel, V.L.; Cretescu, I. Characterisation and remediation of soils contaminated with uranium. J. Hazard. Mater. 2008, 163, 475–510. [Google Scholar] [CrossRef]
  3. Albuquerque, M.T.D.; Gerassis, S.; Sierra, C.; Taboada, J.; Martin, J.E.; Antunes, I.M.H.R.; Gallego, J.R. Developing a new Bayesian Risk Index for risk evaluation of soil contamination. Sci. Total Environ. 2017, 603–604, 167–177. [Google Scholar] [CrossRef] [PubMed]
  4. Rizzardini, C.B.; Goi, D. Sustainability of domestic sewage sludge disposal. Sustainability 2014, 6, 2424–2434. [Google Scholar] [CrossRef] [Green Version]
  5. Nadia, N.S.; Alabdraba, W.M.; Mohamed, G.H.; Mohammed, Z.B. Water Quality Monitoring of Tigris River by Using (GIS)-Based Physicochemical Parameters in Baghdad, Iraq. Int. J. Eng. Technol. 2018, 7, 57–62. [Google Scholar] [CrossRef]
  6. Al-Hamadani, Y.A.; Salal, A.M.; Mohammed, Z.B.; Assi, L.N.; Resheq, A.S. WQ Assessment of Water Treatment Plants Using Environmental and Statistical Indicators within Baghdad City. Period. Eng. Nat. Sci. 2022, 10, 427–436. [Google Scholar] [CrossRef]
  7. Harrison, R.M. An Introduction to Pollution Science; Royal Society of Chemistry: London, UK, 2006. [Google Scholar]
  8. Harrison, R.M. Pollution: Causes, Effects and Control; Royal Society of Chemistry (RSC): London, UK, 2001. [Google Scholar]
  9. Calabrese, E.J.; Kostecki, P.T.; Dragun, J. Contaminated Soils, Sediments and Water Volume 10: Successes and Challenges; Springer Science & Business Media: New York, NY, USA, 2006; Volume 10. [Google Scholar]
  10. Fine, P.; Graber, E.R.; Yaron, B. Soil interactions with petroleum hydrocarbons: Abiotic processes. Soil Technol. 1997, 10, 133–153. [Google Scholar] [CrossRef]
  11. Shin, E.C.; Das, B.M. Bearing capacity of unsaturated oil-contaminated sand. Int. J. Offshore Polar Eng. 2001, 11, 220–226. [Google Scholar]
  12. Ezeji, U.; Anyadoh, S.O.; Ibekwe, V.I. Cleanup of crude oil-contaminated soil. Terr. Aquat. Environ. Toxicol. 2007, 1, 54–59. [Google Scholar]
  13. Dos Santos, J.J.; Maranho, L.T. Rhizospheric microorganisms as a solution for recovering soils contaminated by petroleum: A review. J. Environ. Manag. 2018, 210, 104–113. [Google Scholar] [CrossRef]
  14. Westlake, D.W.S.; Jobson, A.; Phillippe, R.; Cook, F.D. Biodegradability and crude oil composition. Can. J. Microbiol. 1974, 20, 915–928. [Google Scholar] [CrossRef]
  15. Pampanin, D.; Sydnes, M. Polycyclic aromatic hydrocarbons a constituent of petroleum: Presence and influence in the aquatic environment. Hydrocarbon 2013, 5, 83–118. [Google Scholar]
  16. Ahmed, H.-U.-R.; Abduljauwad, S.N.; Akram, T. Geotechnical behavior of oil-contaminated fine grained soils. Electron. J. Geotech. Eng. 2007, 12, 1–12. [Google Scholar]
  17. Talukda, D.K.; Saika, B.D. Effect of crude oil on some consolidation properties of clay soil. Int. J. Eng. Technol. Adv. Eng. 2013, 3, 117–120. [Google Scholar]
  18. Aislabie, J.M.; Balks, M.R.; Foght, J.M.; Waterhouse, E.J. Hydrocarbon spills on Antarctic soils: Effects and management. Environ. Sci. Technol. 2004, 38, 1265–1274. [Google Scholar] [CrossRef] [PubMed]
  19. Han, J.C. Introduction to Land Engineering; Science Press: Beijing, China, 2013; pp. 188–191. (In Chinese) [Google Scholar]
  20. Ilyushin, Y.V.; Fetisov, V. Experience of virtual commissioning of a process control system for the production of high-paraffin oil. Sci. Rep. 2022, 12, 18415. [Google Scholar] [CrossRef] [PubMed]
  21. Potseshkovskaya, I.V.; Soroka, A.N. Revitalisation of Urban Industrial Areas Based on Sustainable Development Principles. E3S Web Conf. 2021, 266, 08012. [Google Scholar] [CrossRef]
  22. Khamehchiyan, M.; Charkhabi, A.H.; Tajik, M. Effects of crude oil contamination on geotechnical properties of clayey and sandy soils. Eng. Geol. 2007, 89, 220–229. [Google Scholar] [CrossRef]
  23. Shah, S.J.; Shroff, A.V.; Patel, J.V.; Tiwari, K.C.; Ramakrishnan, D. Stabilisation of fuel oil contaminated soil—A case study. Geotech. Geol. Eng. 2003, 21, 415–427. [Google Scholar] [CrossRef]
  24. Kermani, M.; Ebadi, T. The effect of oil contamination on the geotechnical properties of fine-grained soils. Soil Sediment Contam. Int. J. 2012, 21, 655–671. [Google Scholar] [CrossRef]
  25. Salih, M.M.; Jawad, F.W.; Al-Ameri, A.F.; Abdulhameed, A.A. Geotechnical Correlations of Soil Properties in Hilla City – Iraq. Open Eng. 2022, 12, 729–742. [Google Scholar] [CrossRef]
  26. Rahman, Z.A.; Hamzah, U.; Taha, M.R.; Ithnain, N.S.; Ahmad, N. Influence of oil contamination on geotechnical properties of basaltic residual soil. Am. J. Appl. Sci. 2010, 7, 954. [Google Scholar] [CrossRef] [Green Version]
  27. Akinwumi, I.I.; Diwa, D.; Obianigwe, N. Effects of crude oil contamination on the index properties, strength and permeability of lateritic clay. Int. J. Appl. Sci. Eng. Res. 2014, 3, 816–824. [Google Scholar]
  28. Abdulhamid, S.N.; Hasan, A.M.; Aziz, S.Q. Solidification/Stabilisation of Contaminated Soil in a South Station of the Khurmala Oil Field in Kurdistan Region, Iraq. Appl. Sci. 2021, 11, 7474. [Google Scholar] [CrossRef]
  29. Atlas, R.M.; Stoeckel, D.M.; Faith, S.A.; Minard-Smith, A.; Thorn, J.R.; Benotti, M.J. Oil Biodegradation and Oil-Degrading Microbial Populations in Marsh Sediments Impacted by Oil from the Deepwater Horizon Well Blowout. Environ. Sci. Technol. 2015, 49, 8356–8366. [Google Scholar] [CrossRef]
  30. Mustafa, Y.A.; Abdul-Hameed, H.M.; Abdul Razak, Z. Bioremediation of Soil Contaminated with 2,4-D Herbicide Using Bioslurry Reactor. J. Eng. 2023, 20, 109–128. [Google Scholar] [CrossRef]
  31. Karkush, M.O.; Ziboon, A.T.; Hussien, H.M. Studying the Effects of Contamination on Soil Properties Using Remote Sensing. J. Eng. 2023, 20, 78–90. [Google Scholar] [CrossRef]
  32. Zhang, H.; Yuan, X.; Xiong, T.; Wang, H.; Jiang, L. Bioremediation of co-contaminated soil with heavy metals and pesticides: Influence factors, mechanisms and evaluation methods. Chem. Eng. J. 2020, 398, 125657. [Google Scholar] [CrossRef]
  33. Varjani, S.J.; Rana, D.P.; Jain, A.K.; Bateja, S.; Upasani, V.N. Synergistic ex-situ biodegradation of crude oil by halotolerant bacterial consortium of indigenous strains isolated from on shore sites of Gujarat, India. Int. Biodeterior. Biodegrad. 2015, 103, 116–124. [Google Scholar] [CrossRef]
  34. Zhu, H.; Aitken, M.D. Surfactant-enhanced desorption and biodegradation of polycyclic aromatic hydrocarbons in contaminated soil. Environ. Sci. Technol. 2010, 44, 7260–7265. [Google Scholar] [CrossRef] [Green Version]
  35. Achugasim, D.; Osuji, L.; Ojinnaka, C. Use of activated persulfate in the removal of petroleum hydrocarbons from crude oil polluted soils. Res. J. Chem. Sci. 2011, 1, 57–67. [Google Scholar]
  36. Falciglia, P.P.; Giustra, M.G.; Vagliasindi, F.G.A. Lowtemperature thermal desorption of diesel polluted soil: Influence of temperature and soil texture on contaminant removal kinetics. J. Hazard. Mater. 2011, 185, 392–400. [Google Scholar] [CrossRef]
  37. Effendi, A.J.; Aminati, T. Enhancing Bioremediation of Crude Oil Contaminated Soil by Combining with Photocatalytic Process Using TiO2 as Catalyst. Int. J. Geomate 2019, 17, 100–107. [Google Scholar] [CrossRef]
  38. Ahmad, A.A.; Muhammad, I.; Shah, T.; Kalwar, Q.; Zhang, J.; Liang, Z.; Mei, D.; Juanshan, Z.; Yan, P.; Zhi, D.X.; et al. Remediation methods of crude oil contaminated soil. World J. Agric. Soil Sci. 2020, 4, 8. [Google Scholar]
  39. Diphare, M.; Muzenda, E. Remediation of Oil Contaminated Soils: A review. In Proceedings of the Integrated Waste Management & Environmental Engineering (ICCIWEE’2014), Johannesburg, South Africa, 15–16 April 2014; pp. 180–184. [Google Scholar]
  40. Adipah, S. Remediation of Petroleum Hydrocarbons Contaminated Soil by Fenton’s Oxidation. J. Environ. Sci. Public Health 2018, 2, 168–178. [Google Scholar] [CrossRef] [Green Version]
  41. Ogunkeyede, A.O. Conventional and Microwave Pyrolysis Remediation of Crude Oil Contaminated Soil. Ph.D. Thesis, University of Nottingham, Nottingham, UK, 2016; 223p. [Google Scholar]
  42. Xiang, Q.; Yu, J.; Wong, P.K. Quantitative characterisation of hydroxyl radicals produced by various photocatalysts. J. Colloid Interface Sci. 2011, 357, 163–167. [Google Scholar] [CrossRef] [PubMed]
  43. Brame, J.A.; Hong, S.W.; Lee, J.; Lee, S.H.; Alvarez, P.J.J. Photocatalytic pre-treatment with food-grade TiO2 increases the bioavailability and bioremediation potential of weathered oil from the Deepwater Horizon oil spill in the Gulf of Mexico. Chemosphere 2013, 90, 2315–2319. [Google Scholar] [CrossRef] [PubMed]
  44. Yang, Y.; Javed, H.; Zhang, D.; Li, D.; Kamath, R.; McVey, K.; Sra, K.; Alvarez, P.J.J. Merits and limitations of TiO2-based photocatalytic pretreatment of soils impacted by crude oil for expediting bioremediation. Front. Chem. Sci. Eng. 2017, 11, 387–394. [Google Scholar] [CrossRef]
Figure 1. Atterberg limits of various silty soils. (a) Grade V—sandy loam; (b) grade VI—silty loam.
Applsci 13 09103 g001
Figure 2. Influence of oil content on Atterberg limits of CL samples. (a) Liquid limit; (b) plastic limit.
Applsci 13 09103 g002
Figure 3. Atterberg limits and plasticity index under the influence of oil content.
Applsci 13 09103 g003
Figure 4. Permeability curves for the basaltic soils of grades V (sandy loam) and VI (silty loam).
Applsci 13 09103 g004
Figure 5. Variation of permeability with oil content in sandy clay.
Applsci 13 09103 g005
Figure 6. Variation of permeability with oil content in sand soil.
Applsci 13 09103 g006
Figure 7. Relationship between the coefficient of permeability of the soil and crude oil content.
Applsci 13 09103 g007
Figure 8. Variation of the coefficient of permeability of the contaminated soil and additive content.
Applsci 13 09103 g008
Figure 9. Illustration of Atterberg limits values and crude oil content.
Applsci 13 09103 g009
Figure 10. Effect of cement additive on the Atterberg limits of the contaminated soil.
Applsci 13 09103 g010
Figure 11. Variation of specific gravity of soil solids with crude oil content.
Applsci 13 09103 g011
Figure 12. Relationship between the cement content and specific gravity of contaminated soil.
Applsci 13 09103 g012
Table 1. Index properties of the variant soils.
Soil PropertiesUncontaminated SoilContaminated Soil
MeanS.DMeanS.D
Natural moisture content (%)141.5610.52.43
In situ density (kg/m3)13600.1610801.87
Liquid limit (%)380.86421.77
Liquid limit (%) (exp. results)--46.711.44
Plastic limit (%)17.421.9522.92.84
Plastic limit (%) (exp. results)--26.172.96
Plasticity index (%)0.581.9119.12.37
Plasticity index (%) (exp. results)--20.543.91
Flow index (%)8.580.6710.50.84
Maximum dry17501.2516800.11
Density (kg/m3)--14500.15
OMC (%)16.481.5312.51.05
OMC (%) (exp. results)--15.520.89
UCS (kPa) (average of three tests)0.58-0.38-
Cohesion (kPa) (average of three tests)0.63-0.2-
The angle of internal friction (average of three tests)18-14-
Table 2. Atterberg limits for different additives in stabilised soil.
Additives
LimeFly AshCement
Atterberg LimitsPolluted Soil/
(Exp. Results)
Polluted Soil/
(Exp. Results)
5%10%20%5%10%20%5%10%20%
Liquid limit (%)4246.7142.22 41.8040.6437.3036.8035.5038.5037.9036.60
Plastic limit (%22.926.1725.80 23.7019.4419.0018.7017.9019.2818.5017.80
Plasticity index (%)19.120.5416.42 19.1021.2018.3018.1017.6019.2219.4018.80
Table 3. Atterberg limits and UCS of soil treated with combined additive admixtures.
AdditivesLL (%)PL (%)PI (%)UCS in (kPa)
10% lime + 10% fly ash42.8423.1119.73109.44 (294%)
10% cement + 10% fly ash38.4618.4519.9687.28 (234%)
15% lime + 5% fly ash40.7322.3818.35122.58 (328%)
10% lime + 5% fly ash + 5% cement25.5919.875.72138.28 (371%)
Table 4. Overview of initial soil characteristics soils.
ParameterQuantity
Clay, Silt, Sand, and Gravel (M.I.T. Categorization)3%, 89%, 7%, 1%
L.L., P.L., PI23.9, 45.5, 21.6
Water Content3.90%
Organic Material Content3.64%
P.H. (in 27 °C)8–8.3
Disclaimer/Publisher’s Note: The statements, opinions and data contained in all publications are solely those of the individual author(s) and contributor(s) and not of MDPI and/or the editor(s). MDPI and/or the editor(s) disclaim responsibility for any injury to people or property resulting from any ideas, methods, instructions or products referred to in the content.

