Article

Modeling of Strain Actuation on Relatively Soft Curved Beams by Piezoelectric Ceramics for De-Icing Systems

by
Salvatore Ameduri
1,*,
Armando Castrovinci
2,
Alessia Serena Perna
2,
Antonio Viscusi
2,
Antonio Concilio
1,* and
Luigi Carrino
2
1
Department of Adaptive Structures, Centro Italiano Ricerche Aerospaziali, 81043 Capua, Italy
2
Department of Chemical, Materials and Industrial Production Engineering, University of Naples Federico II, Piazzale Tecchio 80, 80125 Naples, Italy
*
Authors to whom correspondence should be addressed.
Appl. Sci. 2023, 13(16), 9104; https://doi.org/10.3390/app13169104
Submission received: 3 July 2023 / Revised: 1 August 2023 / Accepted: 4 August 2023 / Published: 9 August 2023

Abstract

:
In this work, the effects of some geometric and mechanical parameters that characterize curved and relatively soft structures integrated with piezoelectric actuators are investigated. The effect of parameters such as the curvature, location, and extension of the piezo device, as well as the thickness of the bonding and its strength, are considered in view of a potentially lighter model that replaces the piezoelectric device via its actions, namely pin forces, whose layout and values are strongly dependent on the curvature. When comparing the results obtained by a finite element model of the structure with the piezo device and of the structure alone under the action of pin forces, dedicated indicators were found, which could be useful to support lighter modeling approaches and to predict the authority of the piezoelectric device.

1. Introduction

Piezoelectric actuators are transducers that convert electrical energy into mechanical displacement or stress. Owing to their ease of use and ability to generate huge forces and accurate displacements, they have found usage in a variety of sectors, including ultra-precision positioning and the creation and management of forces or pressures in static and dynamic domains. Piezoelectric actuators have a wide frequency range and may be employed in a variety of setups [1,2].
All of these characteristics make piezoelectric actuators very attractive in a wide range of applications; for instance, their use as prevention systems for ice formation in aircraft structures represents a potential solution that has been studied in the literature in recent years [3,4,5,6]. The formation of ice on aircraft structures has been considered a dangerous phenomenon posing a significant risk to the safety of the flight. Wings, blades, and aerodynamic surfaces in general suffer from this issue, which leads to losses in performance and safety for the aircraft [7,8,9].
The mechanism of the ice formation on the airframe is quite simple. It is known from the literature that liquid water can exist in an unstable condition at temperatures below zero degrees Celsius [10]. If the temperatures of the clouds range from 0 to −20 °C, super-cooled water can exist, even in many g/m3. Under these conditions, when the droplets impact the surfaces of the aircraft structures they immediately freeze on the skin, thereby promoting ice formation and growth [11,12,13].
Icing reduces the aircraft’s efficiency by increasing its weight, reducing lift, decreasing thrust, and increasing drag. The growth of the ice produces an increase in the roughness of the wing surface that results in airfoil distortion and boundary layer transition. This means that both the friction and the pressure drag increase, with additional fuel consumption, while the lift and critical angle of attack decrease due to ice formation. Furthermore, the icing on the horizontal tail seriously damages the stability and manipulation of airplanes. Several accidents had occurred before authorities figured out the importance of icing formation as a main cause of them [9].
To preserve aircrafts from the dangerous effects of ice formation, various anti- or de-icing systems have been developed over the years. The state of the art of these technologies has been in continuous development since the 1980s when the authorities started to implement new regulations concerning on-ground and on-flight procedures. The more traditional systems include electro-thermal and hot bleed air de-icing or anti-icing methods, fluid anti-icing techniques, hydrophobic coating anti-icing methods, and mechanical de-icing methods (electro-vibratory, microwave, shape memory alloy, pneumatic boots, and electro-impulsive) [14,15,16,17]. These methods are currently used but are energy-hungry and expensive to make and operate. The weight is of primary concern, as are the power consumption and effectiveness. The most common de-icing system currently in use for fixed-wing aircrafts is fluid de-icing, which presents great environmental concerns and only provides temporary ice protection.
In this scenario, the research into low-power, high-frequency de-icing and anti-icing systems has been ongoing. In particular, the relatively new piezo-based actuation concept exhibits significant development prospects for improved energy efficiency. It relies on the capability of piezoelectric transducers bonded on the structure to induce mechanical waves (e.g., Lamb waves) causing shear stresses that produce ice delamination and fracture effects [18,19,20,21,22].
It is, thus, worthwhile investigating in depth the phenomena of resonance between the piezoelectric actuator and the beam to which it is attached. The first studies on the use of piezoelectric actuators to induce vibrations on an elastic structure were carried out by Crawley and de Luis [23], who proposed a predictive one-dimensional model describing the shear transmission at the ice–structure interface. Afterwards, further studies and theoretical models were proposed in the literature [24].
To date, to the authors’ best knowledge, no papers exist in the literature dealing with the development of efficient and reliable models of strain actuation on curved relatively soft beams by piezoelectric ceramic transducers, while also taking into account the adhesive layer, for the prediction of the forces and deformations transmitted to curved aerodynamic surfaces. These aspects could be of certain interest for many applications, including for the ice protection of windshields [25], piping [26], or wing parts (even if in this case one talks generally of actuation on harder materials). In the case of piezoelectric ceramic actuators that are used as de-icing systems for curved-wing structures (e.g., the leading edge), the matter gets more complicated, and further studies are needed due to the curved shape of the surface.
Therefore, the scope of the research activity is to study, develop, and propose an efficient model to fill the gap of knowledge in terms of actuation by piezoelectric patches bonded on relatively soft curved structures. This paper aims to describe numerical and experimental investigations on the use of Lamb waves for transmitting forces and deformations to curved beams through piezoelectric ceramic transducers bonded on the surface.
For this purpose, the theory of strain actuation on curved beams was proposed as an extension of the Crawley and de Luis theoretical models. Then, finite element models were developed for predictive analyses. Static and dynamic investigations were performed to estimate the effective shear at the interface and the resulting forces and deformations transmitted to the curved beam. This allowed for assessing the influence of the curvature of the beam on both the forces and the strain transmitted to the beam, while also providing the tools to properly set the position of the piezo device on the curved structure.
To better orient the reader, a block diagram was prepared to illustrate the structure of the work and highlight the main phases (Figure 1).

2. Modeling of Strain Actuation on Curved Beams

2.1. Theoretical Models

The first models concerning the strain actuation from a piezoelectric ceramic transducer to a straight beam were proposed by Crawley and de Luis in 1987 [23]. For bending excitations, they considered the classical butterfly diagram for the strain within the beam thickness and constant deformation along the actuator thickness. This latter assumption is reasonable as the piezo device is significantly thinner than the driven structure. The model took into account the presence of the adhesive layer between the two elements and reached important conclusions, among which were an expression for the quality of the bonding and an expression for the transmitted strain along the contact zone. The formulas are synthetically reported herein:
Actuated   Strain   Function ε t Λ = 6 ψ + 6 6 ψ + 6 ch Γ x ch Γ
Adhesive   Layer   Quality Γ 2 = L 2 2 G a / E p t a t p ψ + 6 ψ
The main conclusions of the theory may be summarized as follows, directly linked to Formulas (1) and (2) above, respectively:
  • The strain transmitted to the structure is made of a constant and an exponential term, which vanishes for values of the Γ parameter higher than 10, and the adhesion is called “perfect”;
  • For usual values of the physical and geometrical characteristics, the adhesion quality constant is always higher than 10.
Indeed, the first point should be better clarified by adding that at the extremities of the contact region, the structural deformation is always null (boundary condition); for larger and larger values of Γ, in the region where the strain is different from a constant value (left term), the expression results are smaller and smaller.
This formulation loses its validity as the thickness of the piezoelectric element approaches the structural one; in such cases, the hypothesis of considering the strain along the vertical direction of the actuator to be constant cannot hold anymore. Different theoretical approaches have tried to overcome this limitation, although assuming that the adhesive layer could be always considered perfect, or in other words that the bonding quality always attains high values. This further hypothesis is reasonable if standard physical and geometrical values are considered, as reported before. Among the different proposals, the one introduced by Lecce and Concilio in 1995 is herein reported. The transmitted strain, which is now constant along the contact region extension and is now a scalar, assumes a slightly different form, as follows:
Actuated   Strain ε t Λ = 6 ( t ¯ 2 + t ¯ ) ϕ t ¯ 3 + 6 t ¯ 2 + 12 t ¯ + 8
It should be noted that by moving from the favorable assumption of a perfect bonding layer, these models allowed deal with the problem from a 2D standpoint, so that the Poisson module does appear. Finally, it can be seen how the novel resembles the former expression as the piezoelectric thickness vanishes, according to the classical rules of polynomial fractions, and the Poisson modules are equal to each other.
All of these expressions are retrieved for planar systems, without any curvature. This eventuality may cause the models to express results that are very far from reality for many applications, such as for the use of piezoelectric actuators as dynamic exciters of curved beams or plates. This may be the case for wing sections and for the implementation of compact mechanical de-icing systems.
The reported models may be used as a support to extrapolate some hybrid numerical–analytical model on the bases of the major outcomes recalled here. Since the deformation is considered constant along the bonding line, this does mean that its field may be replicated through some equivalent forces that are deployed at the borders of the contact region, representing the action of the actuator on the structural surface. It is reasonable to think that such a result is not modified in the case of a curved element, as the adhesion is considered perfect. However, since the structure is curved, the border forces do act on the same plane; to maintain the equilibrium, further forces are applied normally to the surface. In turn, this would mean that the strain in the contact region cannot be considered constant anymore because of the crossed effects of the loads on the deformation, driven by the Poisson modules. This effect grows as the curvature grows, meaning it can be expected that at a certain point, the adopted model cannot be considered valid any longer. The modeling strategy that was adopted here consists of simple steps, combining numerical simulations and theoretical assumptions (in turn based on the previous results), with the following aims:
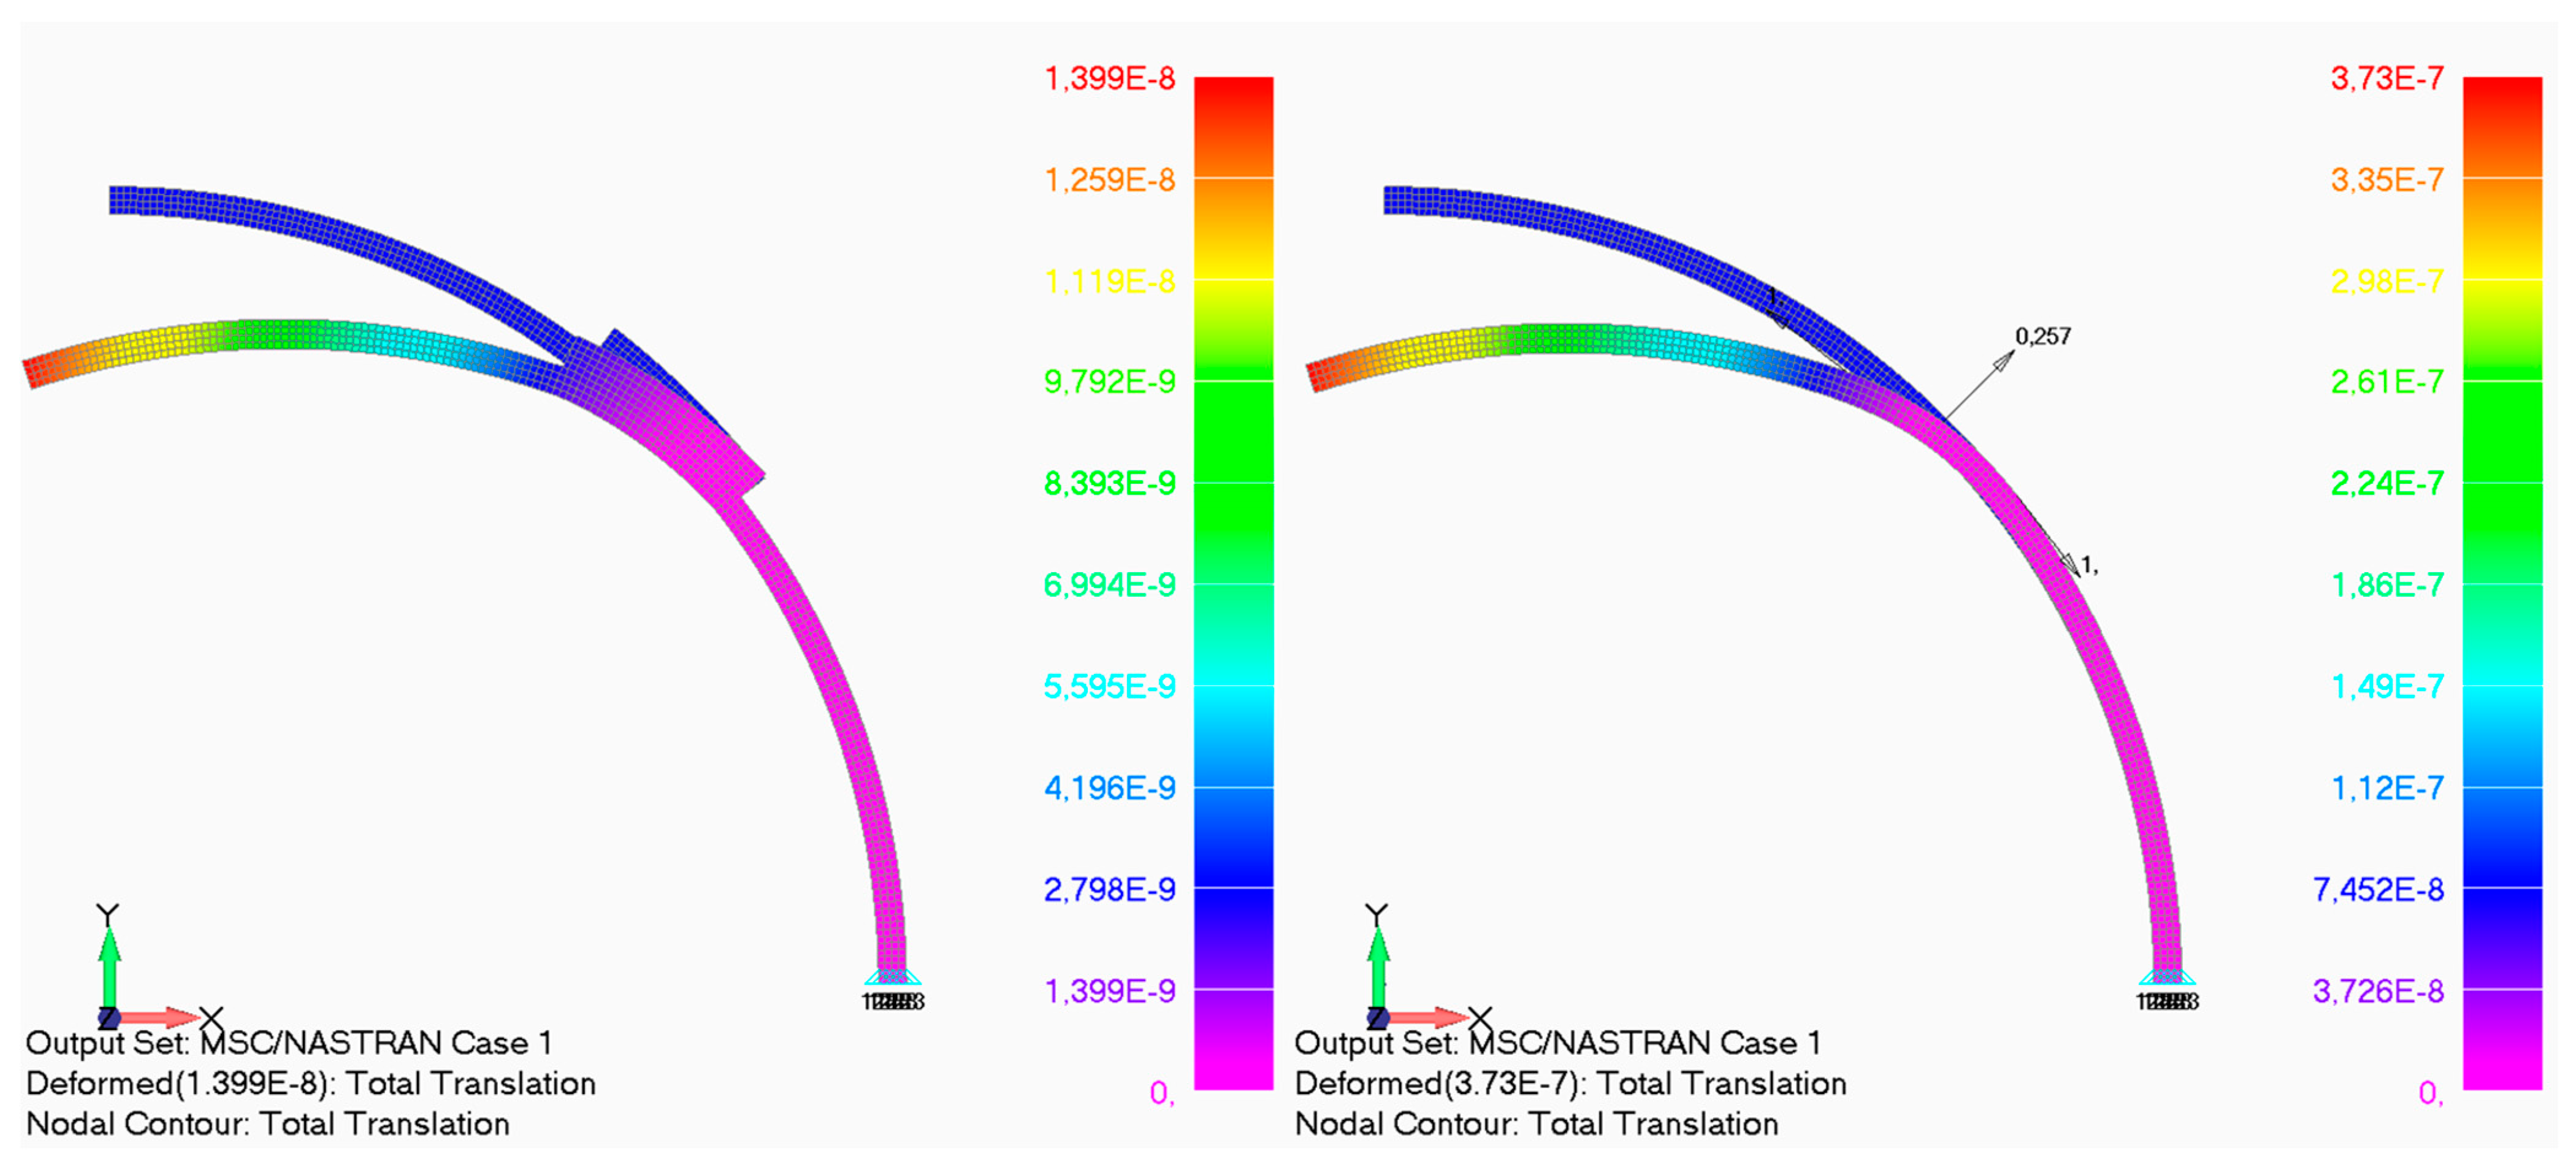
  • To simulate the presence of a piezoelectric actuator on a series of curved beams with different characteristics (in terms of the curvature radius, thickness, and so on);
  • Remove the piezoelectric actuator and impose the expected force field at the boundaries of the contact region;
  • Evaluate the displacement at certain characteristic points of the structure, such as the tip;
  • Verify the ratio among the displacements coming from the theoretical models (flat plates) and the numerical ones (with the piezo device and with its effect only).
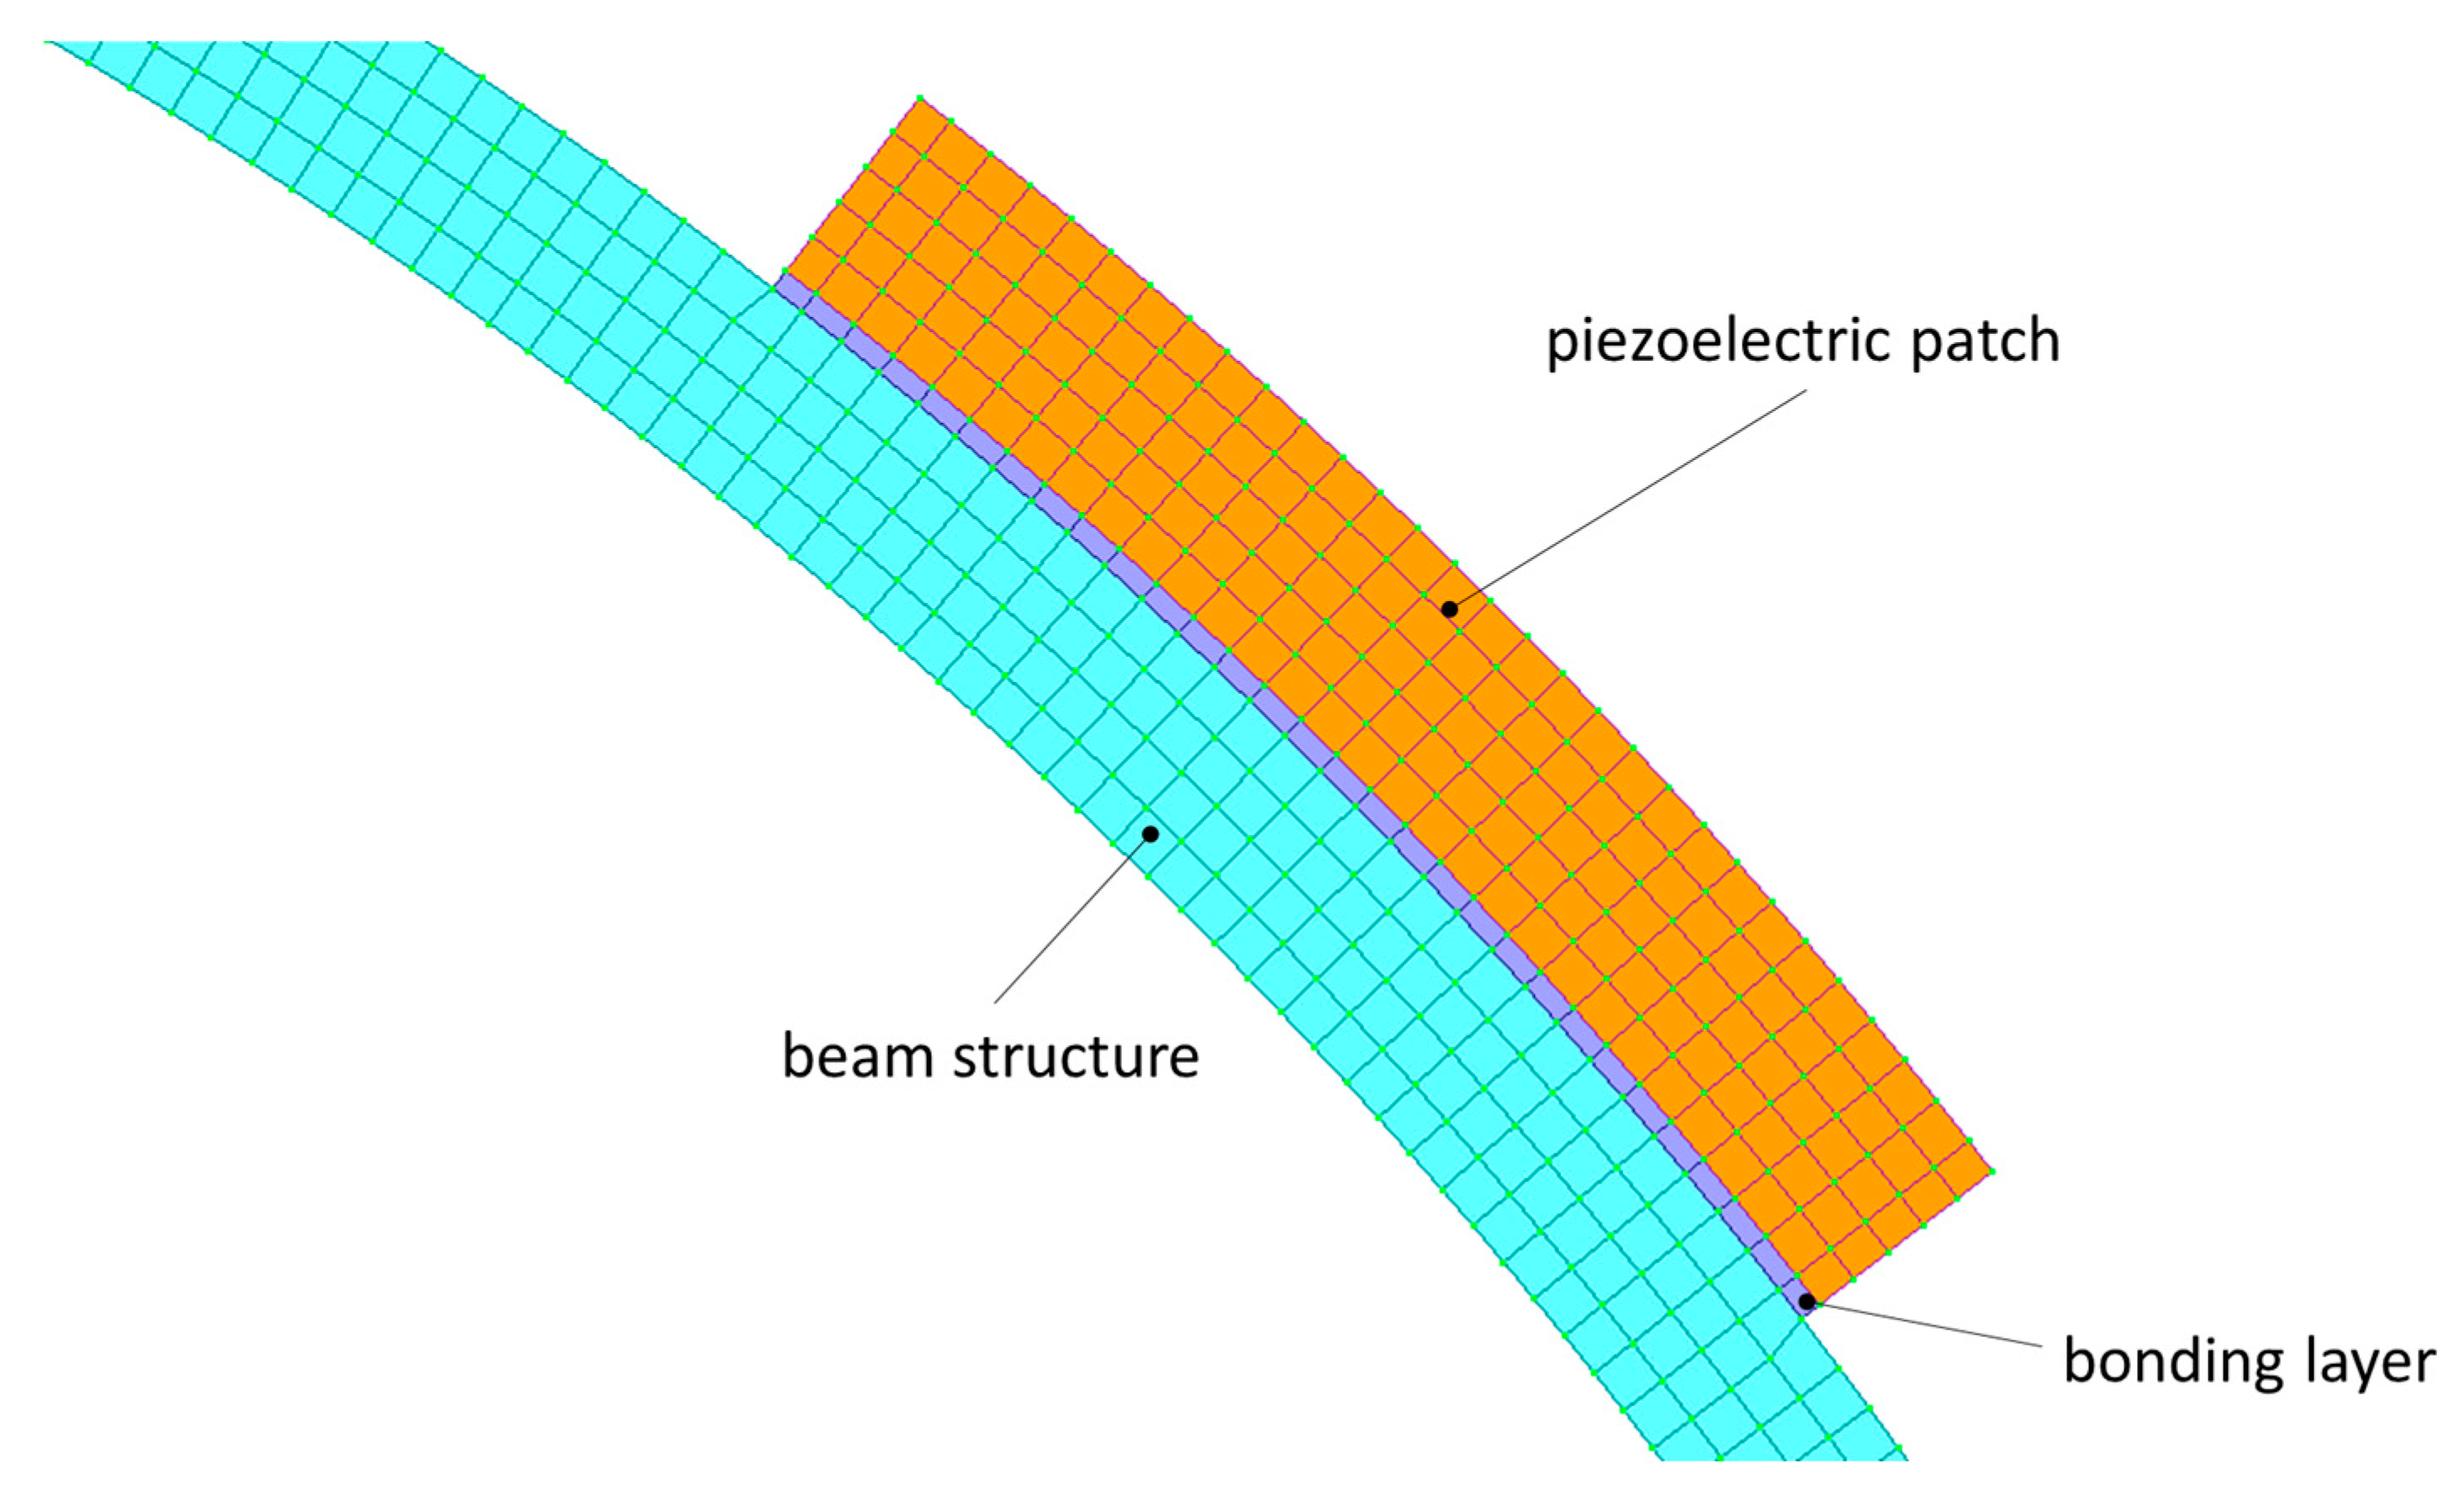
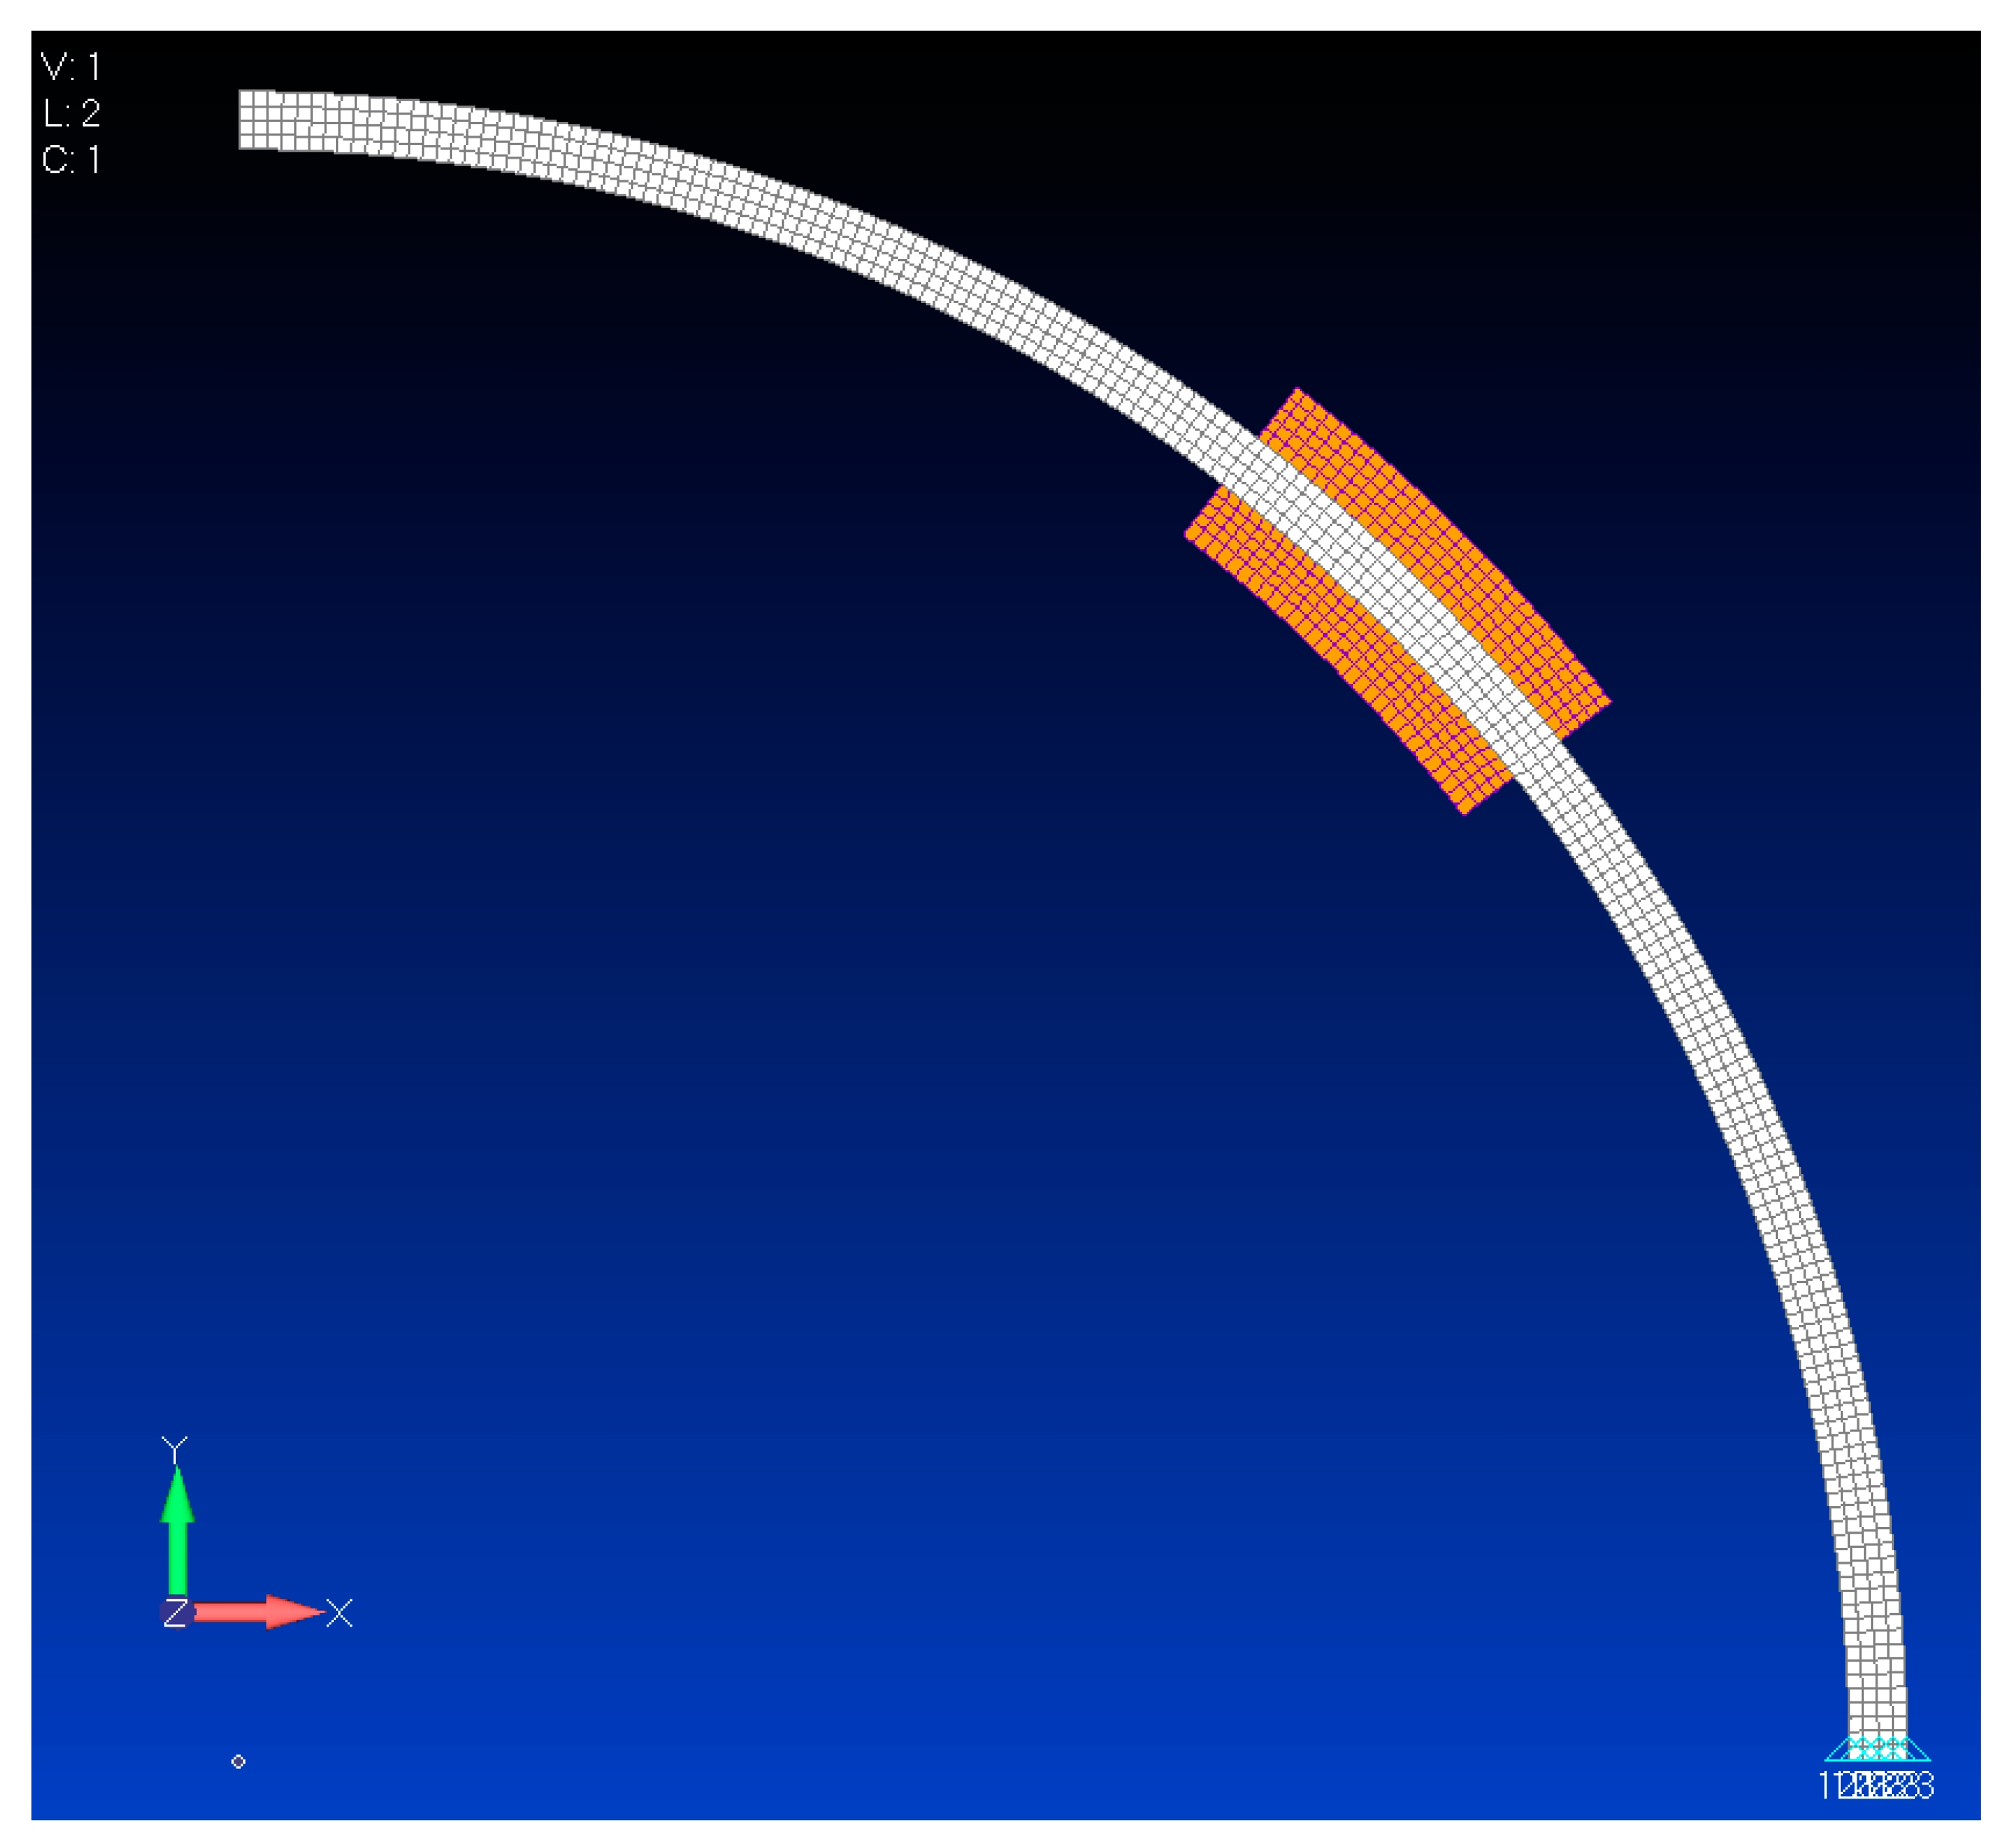
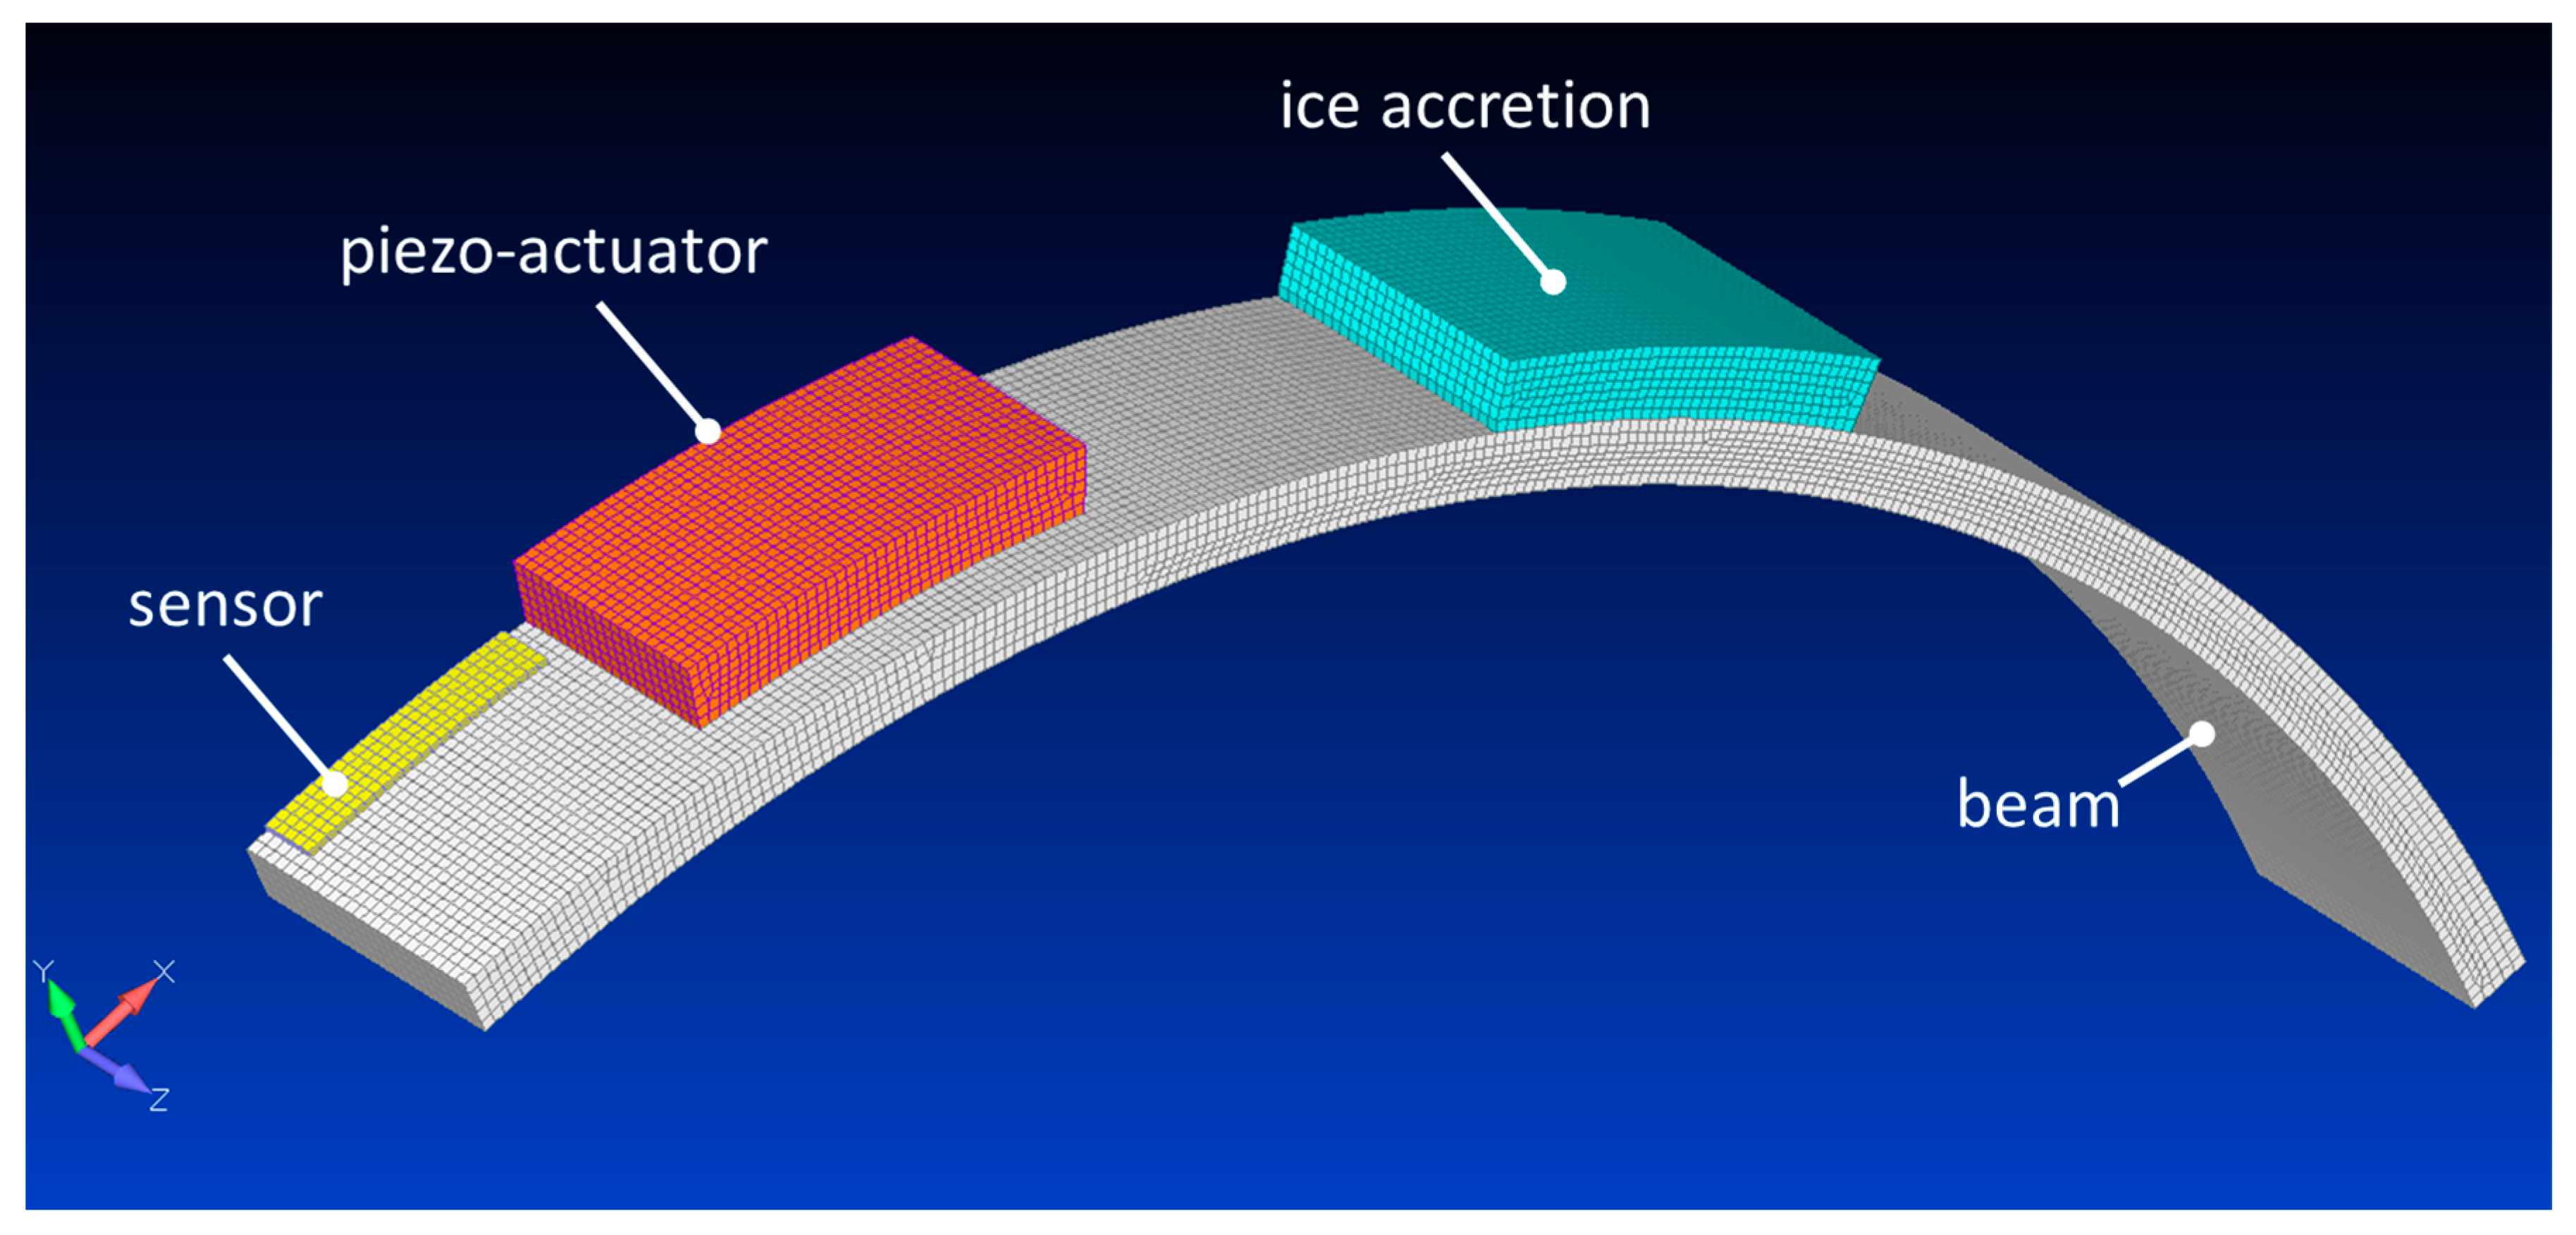
The first aspect is expected to confirm the theoretical predictions for small values of the curvature; the second and third aspects are expected to provide coincident results as long as the performed assumptions hold. Then, the results are expected to diverge, establishing the validity of the adopted considerations. Formally, it is assumed that the transmitted strain always has the following form:
Actuated   Strain ε t Λ = f
As we talk in terms of the transmitted force, the expressions are a bit different. In the hypothesis of a linear strain function along the structural system, the expression for εt is sufficient to define the law for the deformation along the thickness as:
Actuated   Strain ε y = 2 ε t t s y
and the expression for the transmitted moment as:
M = E s t s 2 ε t 6
Here, the transmitted force may be written as:
M = F t s F = E s t s ε t 6   o r   F = f E s t s Λ 6
The maximum transmittable force is the blockage piezo force, i.e.,:
F M = E p t p Λ
Therefore, the ratio between the transmitted force and the maximum transmitted force may be written as:
F F M = f 6 E s t s E p t p = f   ψ 6

2.2. FE Modeling

The finite element modeling approach was implemented to investigate the effect of the curvature on the transmission performance of a piezoelectric patch bonded onto a curved structure. The complex geometry of the architecture and the presence of curved interfaces led to us considering the finite element simulation approach, which is also appropriate for more complex and realistic applications, such as the protection of aircraft leading edges, inlets, and nacelles from ice [21].
The model hereafter illustrated was conceived to meet the following requirements:
  • To determine a relation between the strain and displacement transmitted by an expanding piezoelectric element and by pin forces;
  • To describe the strain displacement field along the radial and tangential coordinates;
  • To investigate the effects of specific parameters such as the piezo device/structure thickness ratio, the angular position of the piezo device, and its tangential extension;
  • To estimate the stress–strain field within the bonding layer;
  • Finally, to ensure adequate computational lightness.
The structural system under investigation is shown in Figure 2.
In line with these requirements and considering the plane nature of the problem, 2D finite elements (CQUAD) were considered for the piezo device, the structure, and the boundary layer for the parameterization process. The system is constituted by a 90 degree PVC arc with a piezo patch bonded on the outer side. A radius of 75 mm was assumed for the mean line of the arc; the out-of-plane dimension was set at one-quarter of a millimeter, at least 1 order thinner than the other dimensions, to make negligible any output variation along this direction. Four elements were placed along the thickness of the piezo patch and the beam structure to represent the displacement by a higher-order polynomial. A detailed view of the mesh close to the zone of connection between the structure and the piezo device is shown in Figure 3. The physical connection among the piezo patch, the boundary layer, and the beam was obtained through rigid links (RBE2) among coincident nodes. The perfect bonding condition was simulated by removing the adhesive layer and connecting the nodes of the piezo patch directly to the structure.
The static behavior of the system was investigated by considering two different types of actions:
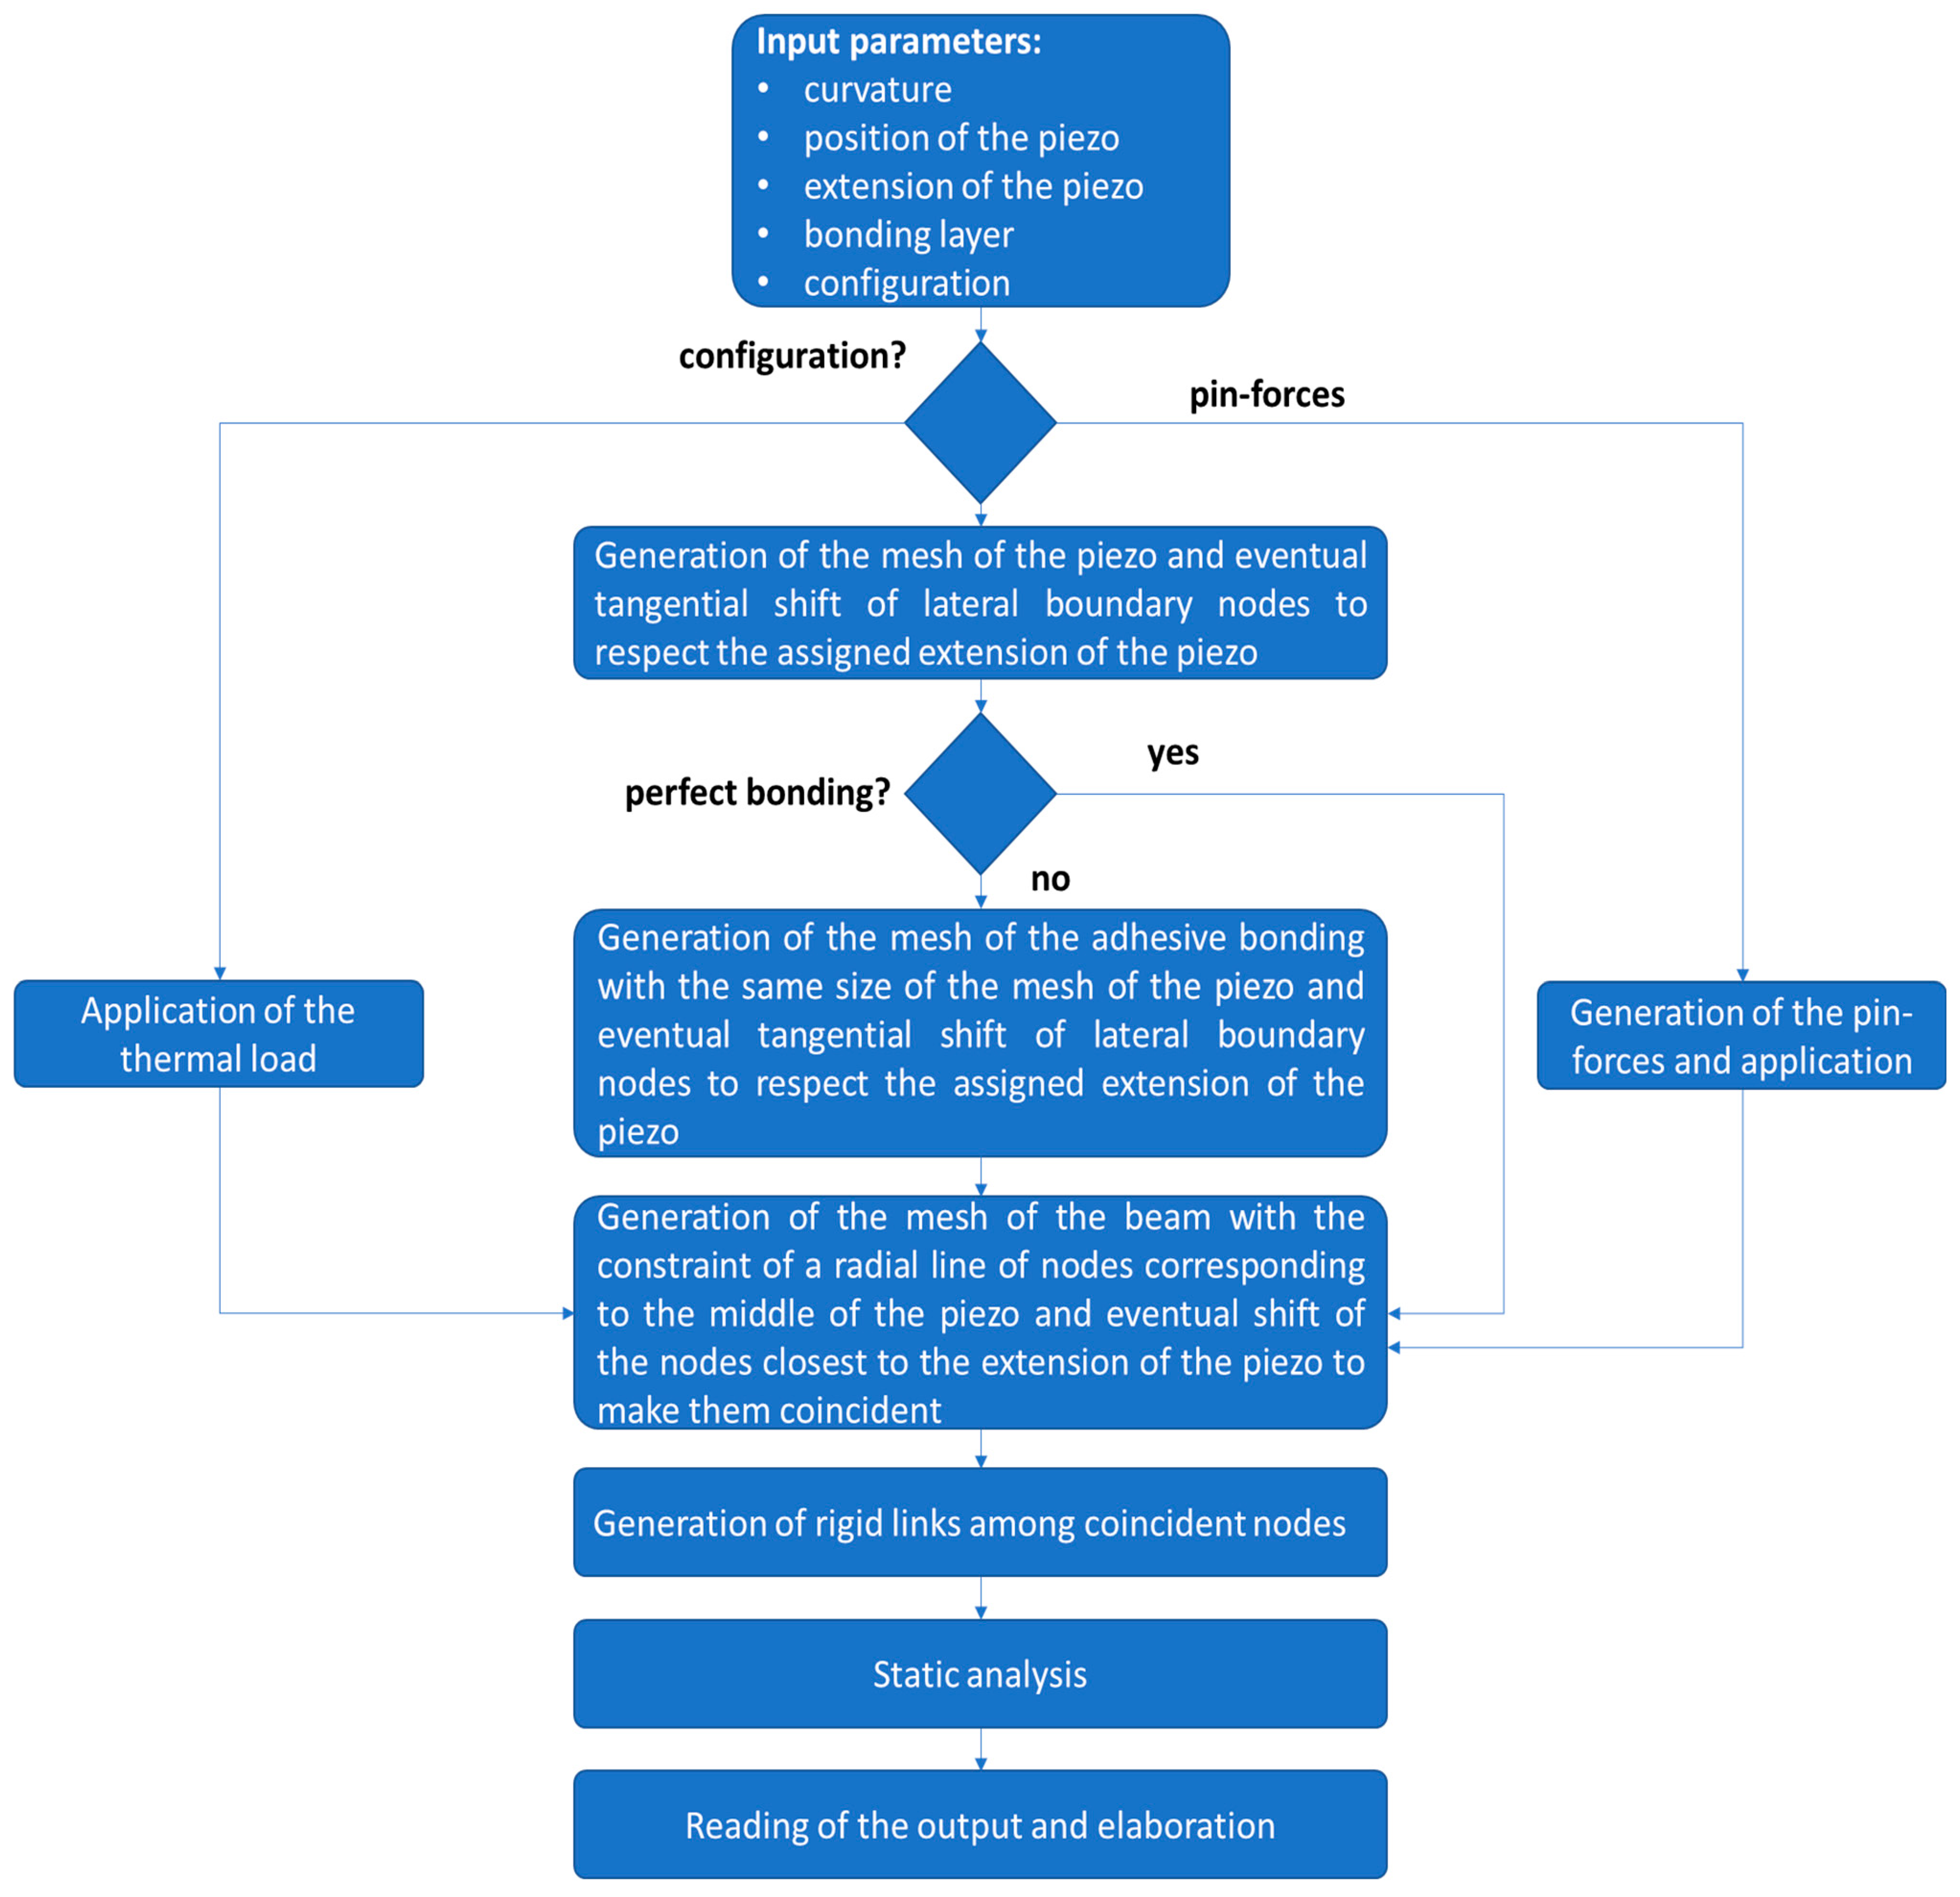
  • The thermal load: The expansion (contraction) caused by the application of a voltage between the top and bottom faces of the piezo device was simulated by assigning to the piezo material a fictious expansion coefficient, α_PZT:
α P Z T = d 31 t p
This approach approximates the behavior of the system well when electromechanical cross-related effects are negligible; that is to say, far from resonance peaks.
  • The pin forces: Three forces were placed at the interface between the piezo device and the structure—on the first and last nodes, oriented in opposite ways along the tangential direction, and on the middle node, oriented along the radial direction. This last radial force was also considered to allow the force balance along the radial direction, which is already intrinsically satisfied by the thermal loading. The scheme in Figure 4 illustrates the relation between the two opposite tangential forces, Ft, and the radial one, Fr. In practice, the equilibrium requires that the radial force is 2 times the sine of the halved tangential extension, θ, of the piezo device.
Figure 4. Radial force balance scheme.
Applsci 13 09104 g004
The scope of the work is to find a relation between the results achieved by the above load conditions. This can be addressed by computing the ratio between the deflection, δ t l , caused by the thermal load and the deflection, δ 1 , caused by the pin forces:
k = δ t l δ 1
This last relation indicates that to obtain the same displacement produced by an assigned thermal load, a pin force that is scaled by k should be applied.
In addition, attention will be also paid to the ratio between the unitary tangential force, F θ 1 , applied to the structure without the piezo device (pin force) and the one generated by the code, F Δ V 1 , to produce the effect of a unitary voltage:
k f = F θ 1 F Δ V 1
The main features of the nominal structural system are summarized in Table 1. The parametric investigations presented in the next subsections focus on the variation of the curvature and the tangential location and extension of the piezo device.
A dedicated MATLAB® procedure was prepared to quickly alter the model and change the feature objects of the parameterization. The block diagram in Figure 5 illustrates the main tasks of the code. The input of the process is constituted by the main features of the beam–piezo device system, namely the curvature, position, and extension of the piezo device; the bonding layer; and the configuration (that is to say, the beam integrated with the piezo device or with pin forces). Then, for the pin force configuration, the mesh of the beam alone will be generated; alternatively, for the structure + piezo device configuration, the mesh of the piezo device will also be generated. As in this second configuration, in cases of perfect bonding, no adhesive layer will be generated and the piezo device will be directly linked to the structure below; alternatively, in cases of real bonding, the mesh of the adhesive layer will also be generated. To avoid any gap at the interface among the subparts, a specific strategy is adopted to move the nodes that are not perfectly overlapped. The connection among nodes of the interface is finally addressed by means of rigid links.
Both the model with pin-forces and the model with the piezo device are used for a static analysis that provides data such as the displacement at a specific part of the beam, strictly related to the transmission of actuation.

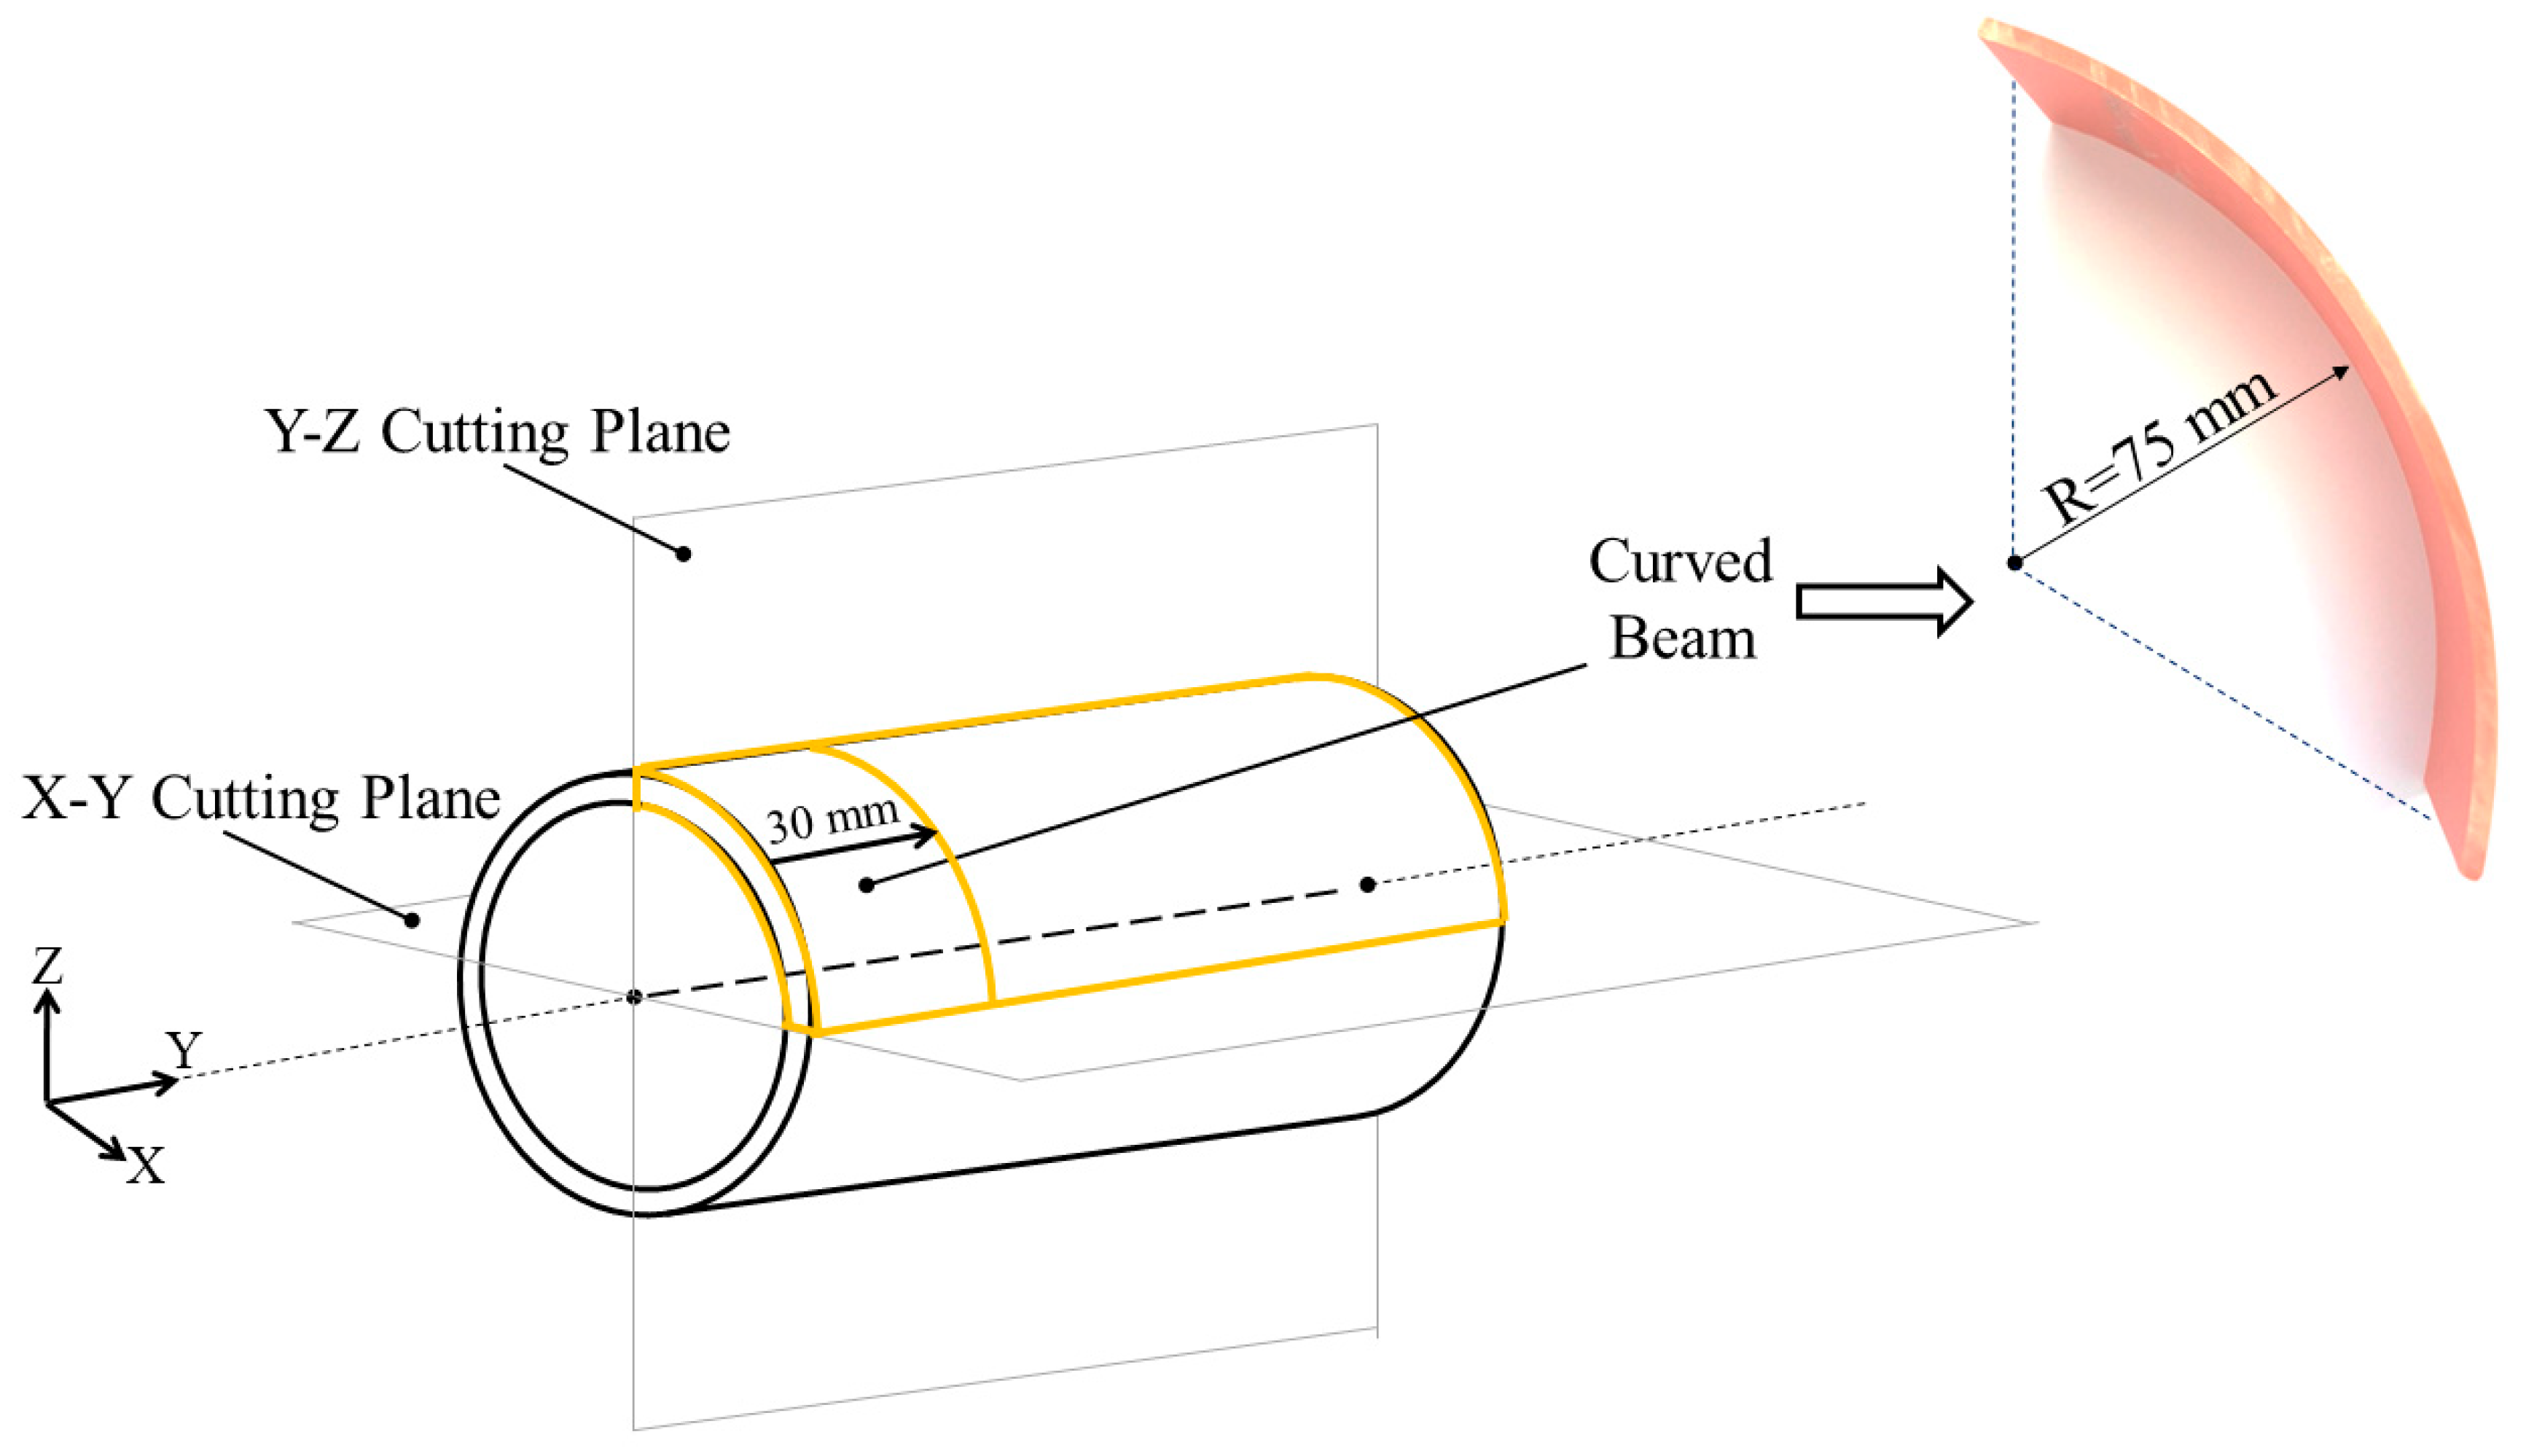
2.2.1. Effect of the Curvature

At first, the impact of the curvature on the transmission was investigated. Twenty different values of the curvature were considered, assuming the piezoelectric device to be located on the middle of the arc, as shown in Figure 2. The thickness of the piezo device, the thickness of the beam, and the lengths of the piezo device and the beam were fixed at the following values:
  • Piezo device thickness: 3 mm;
  • Beam thickness: 2.7 mm;
  • Piezo device’s tangential extension: 10 mm (corresponding to a value of 14.75 deg for the internal reference radii of 0.075 m)
  • Beam length (main line): 119.9 mm;
With the tangential extensions of both the beam and the piezo device being fixed, their angular sweep and piezo angular location were calculated for each curvature case investigated. In Table 2, the main features of the numerical test cases are reported. The figures of the reference configuration for this parameterization and for the ones reported in the next sections are highlighted in bold characters.

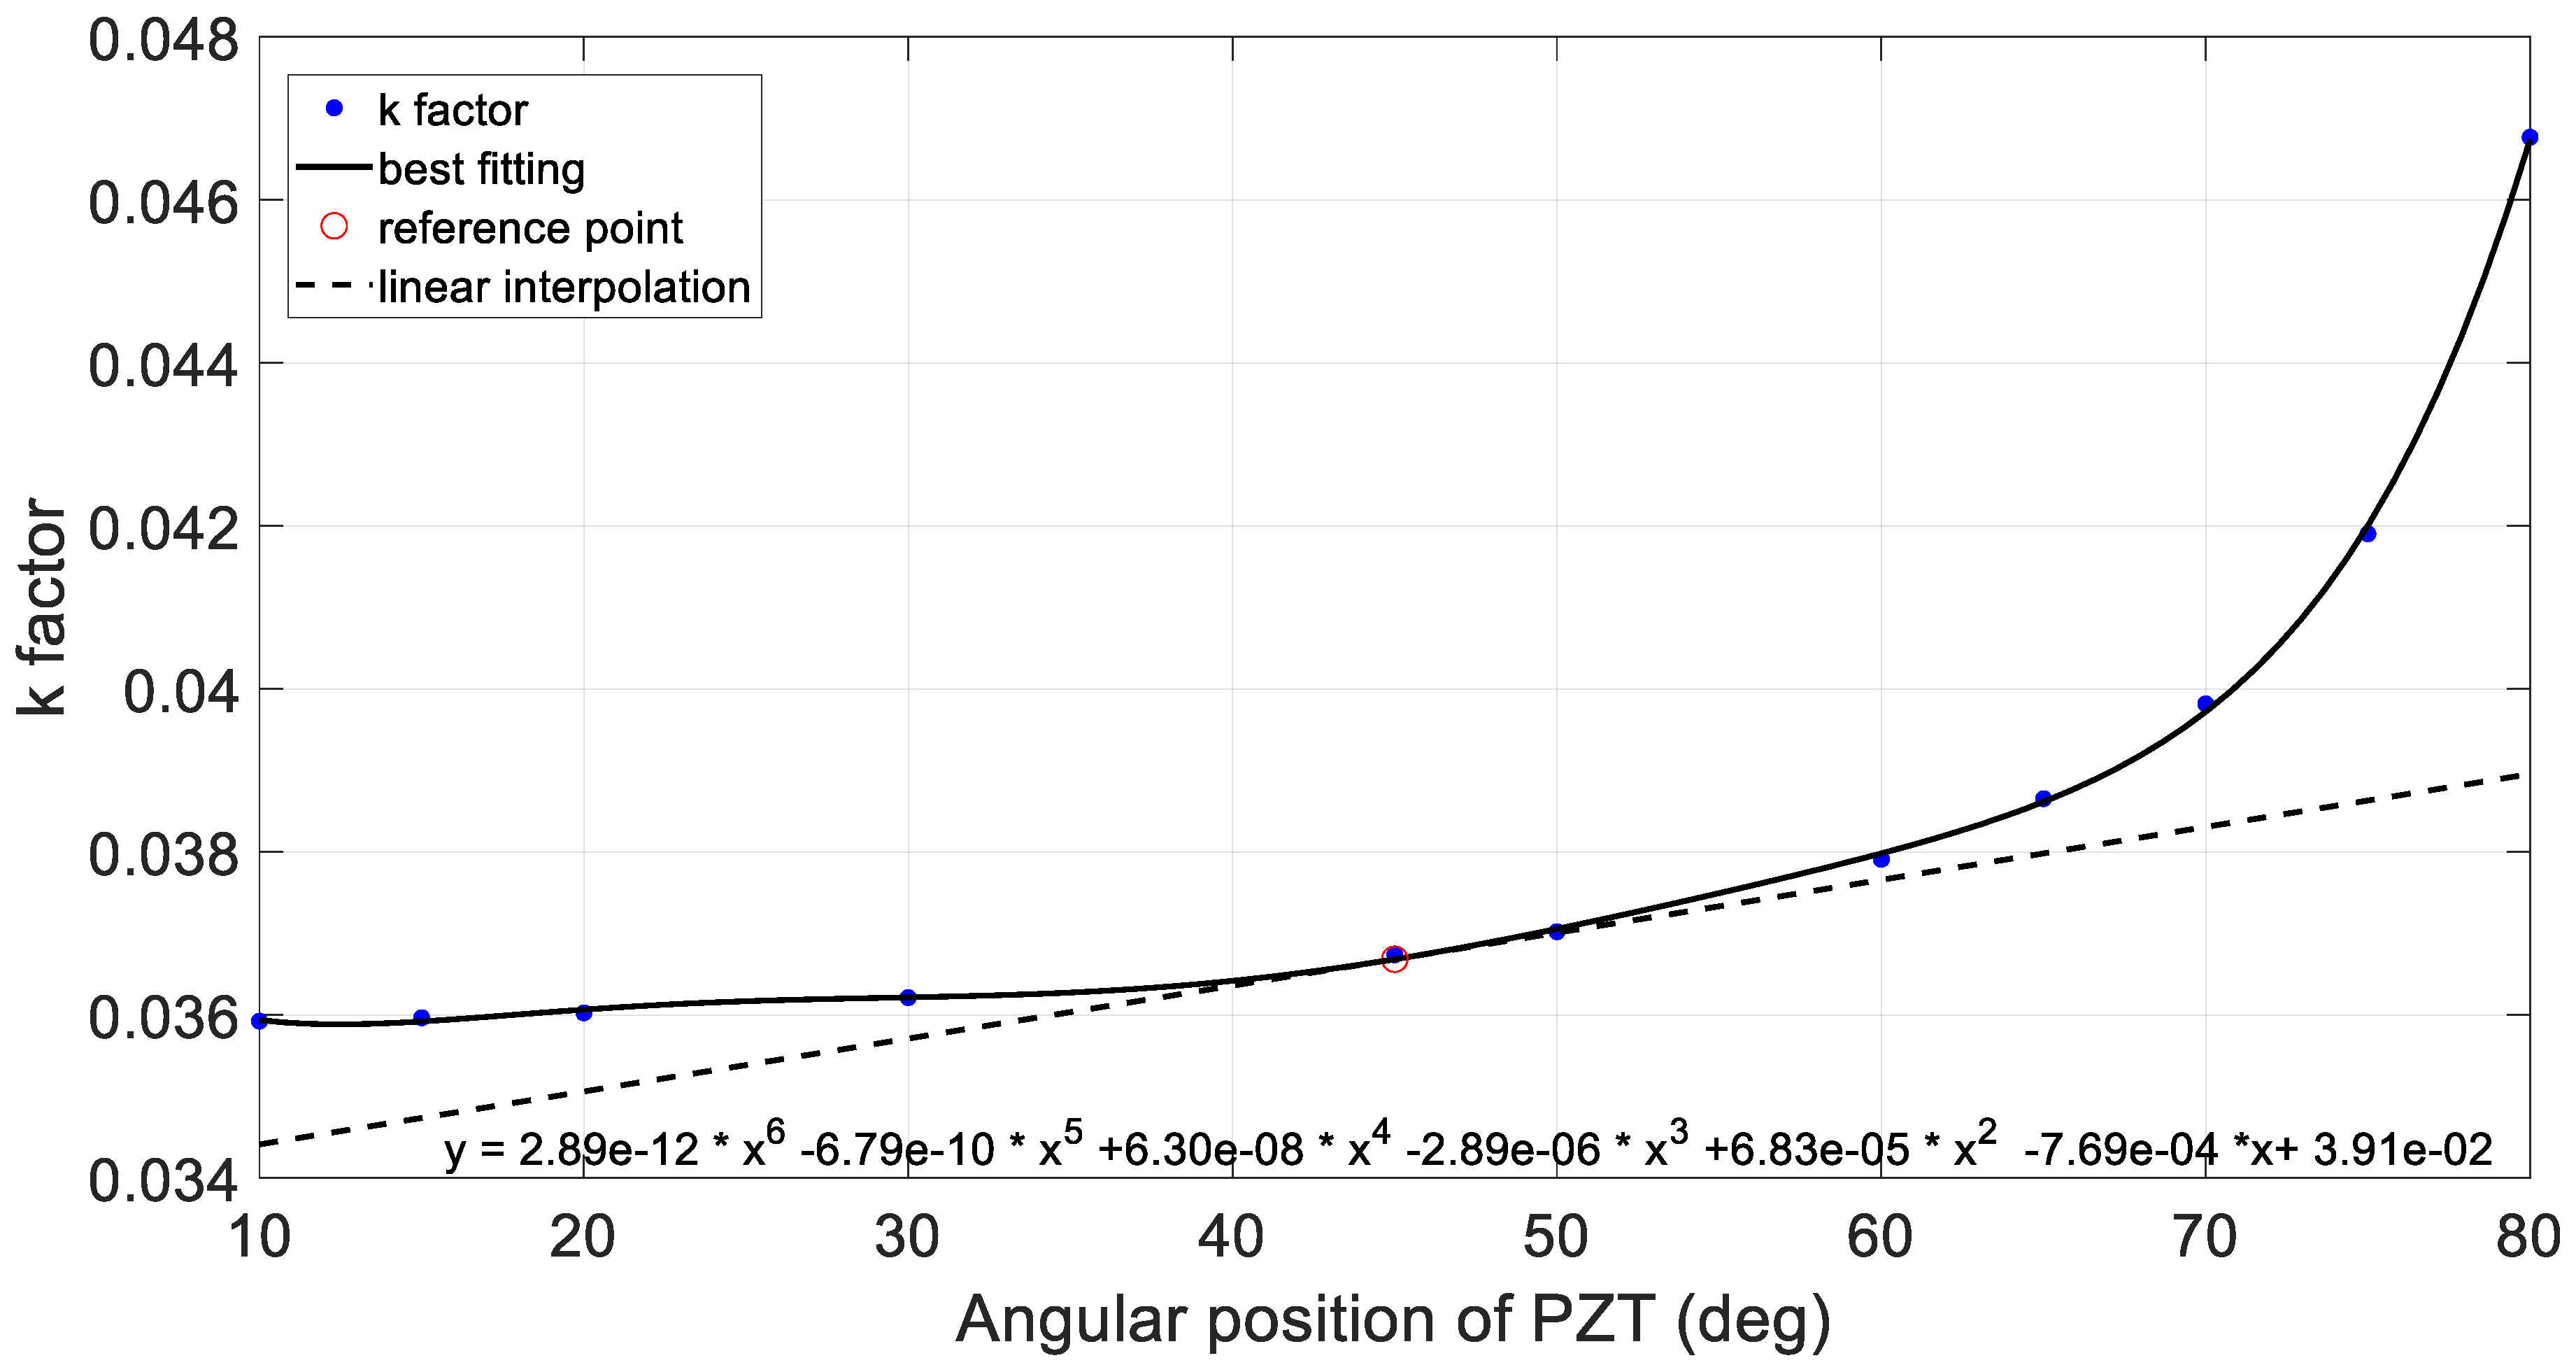
2.2.2. Effect of the Angular Position of the Piezoelectric Patch

The objective of this parameterization was to understand whether the positions of the piezoelectric patch may impact the transmission of the force. The investigation cases were scheduled by fixing a curvature as a reference in a linear range of error. Thus, the angular length of both the beam and piezo was fixed. The 11 explored angular positions ranged from 10° up to 80° with respect to the free end of the beam. In Table 3, the main features of the numerical test cases are reported.

2.2.3. Effect of the Angular Extension of the Piezo Patch

The aim of the simulations summarized in Table 4 was to quantify the impact of the angular extension of the piezoelectric patch on the transmission of the force. The curvature was fixed at a likely value inside a linear range of error—in order to shift the results on a different curvature just dividing by this curvature and multiplying by the next one.

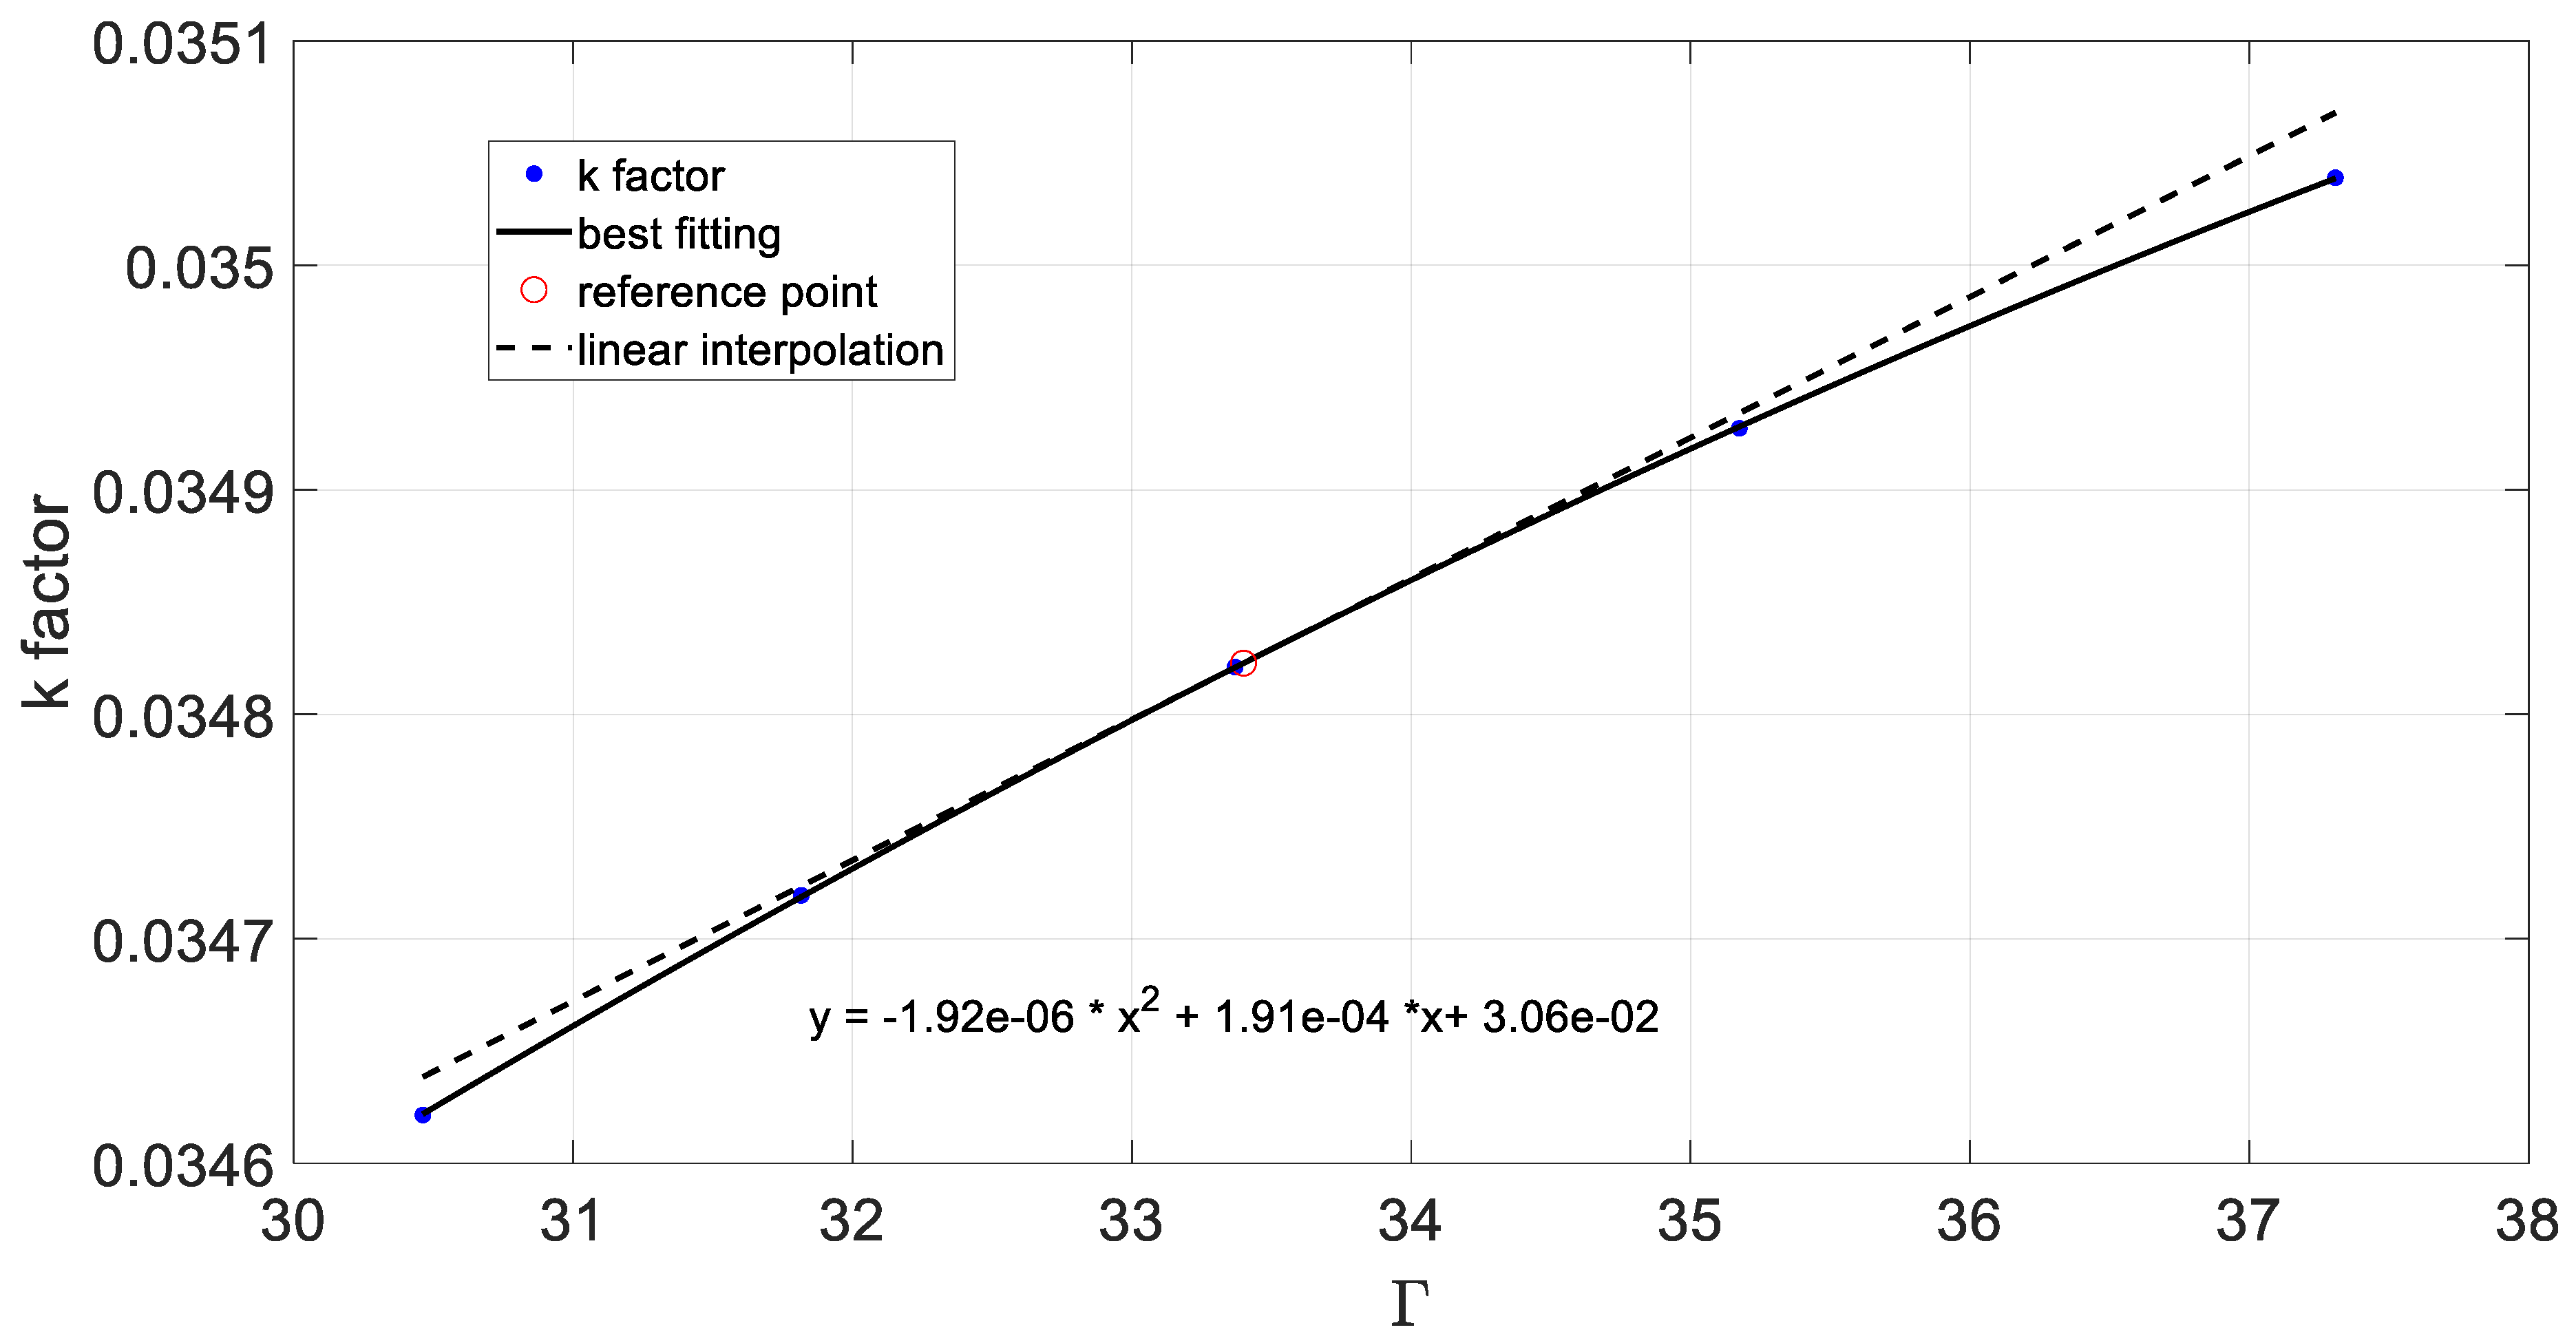
2.2.4. Effect of the Adhesive

The parameterizations above refer to a perfect bonding configuration. The main objective of this section was to analyze the adhesives selected to find the best one in terms of transmission. These simulations were conducted with the same curvature (13.33 m−1) and a fixed thickness (100 µm) of the bonding layer. This was necessary to decompose the effect of the pure adhesive (and its mechanical properties) from the effect of the thickness, which will be discussed in the next section. In Table 5, the adhesives considered for the investigations are summarized.

2.2.5. Effect of the Bonding Layer Thickness

The thickness of the bonding layer is a critical parameter in terms of force transmission; according to the theory, the more it increases, the smaller the force transmission coefficient. Nevertheless, some deviations from the nominal thickness value can be plausible due to errors in the deposition of the uncured adhesive or in the hardening process. The impact of thicknesses ranging from 80 to 120 μm was investigated, fixing the curvature of the beam at 13.33 m−1 and the length of the piezo at 20 mm (corresponding to a location on the middle of the beam); finally, the best-performing adhesive in terms of factor k, the Loctite-Hysol 9395, was considered for this investigation (refer to the first line of Table 5 for the mechanical properties). The simulation cases are reported in Table 6.

3. Results and Validation

This section is devoted to three main aspects: the validation of the transmission numerical model described in the previous part, the presentation of the parameterization results, and an estimate of the effectiveness of the piezo device as an ice protection system bonded on a curved soft beam.

3.1. Validation through Theoretical Transmission Models

The validation was performed by means of theoretical models and a dedicated experimental setup.
Two models were considered, both of them focusing on the strain transmission of the piezoelectric device bonded on a flat structural element. Since these models refer to a couple of piezo patches bonded in a collocated configuration and operating in an antagonistic way, an update of the numerical model of the curved beam was performed, adding also an inner piezo patch. The numerical model presented in Figure 6 was, thus, realized, which reproduces the reference configuration (internal radii and thickness of the beam of 75 and 2.7 mm, respectively; extension and thickness of the piezo patches of 20 and 3 mm, respectively; piezoelectric devices placed at the center of the beam).
The radial displacement of the free edge was computed by applying an opposite unitary thermal load. In the same analysis, the forces generated by the solving code to simulate the thermal effect were also computed. Both the tip radial displacement and tangential force resultants are reported in Table 7. The forces were equal for the outer and inner piezo patches. In the same table, the radial displacement obtained by replacing the two piezoelectric patches with unitary pin forces is also reported.
The corresponding transmission factor was computed by dividing the ratio of the radial displacement, i.e., the k factor defined in (11), by the tangential force generated by the solving code. This parameter, equal to 2.89 × 10⁻³, was compared in Table 8 with the corresponding ones computed for flat beams with a piezo device of the same dimensions, using the transmission model reported above in Equation (9).
The prediction given by the transmission model on the curved beam was satisfactory. The strain linear profile of the piezo device’s thickness, which characterizes this latter model, approximates well the behavior of the piezoelectric device acting on the beam.

3.2. Experimental Validation

The experimental activities were carried out aiming to validate the FE numerical models of strain actuation on curved beams by piezoelectric ceramic transducers, as well as to provide further support for the results obtained from the models. In this section, the materials and the experimental procedures that were developed for the preparation of the test specimens will be described. The test setup will be defined, and the methodologies used for the experimental campaign will be detailed.

3.2.1. Description and Preparation of the Test Specimens

The curved beams were obtained from a polyvinyl chloride (PVC) cylinder with a nominal internal diameter and thickness equal to 150 mm and 2.7 mm, respectively. The cylinder was cut across two mutually orthogonal planes, obtaining four curved parts with a nominal internal radius equal to 75 mm, in agreement with the scheme reported in Figure 7. Curved beams of 30 mm in length were cut from the curved parts for the test specimens.
The piezoelectric ceramic transducers, manufactured by Physik Instrumente, have a 20 × 20 mm square plan form and a thickness of 3 mm. The geometry of the transducer was chosen accordingly to the experimental case study, after preliminary theoretical and numerical analyses. The material of the curved beams was selected by taking into account the relatively low stiffness of the PVC versus the piezoelectric transducer, thereby magnifying the displacements and strains induced by the transducer on the structure in the experimental tests.
In light of the results from the Crawley–de Luis theory, the adhesive layer between the transducer and the surface above which it is applied assumes a relevant influence on the effectiveness of the transmitted forces and strains; the adhesive typology, its physical and chemical properties, and the adhesive layer thickness and conditions can affect the interaction between the piezoelectric transducer and the beam [23]. In this research activity, the piezoelectric ceramic transducers were bonded on the top surface of each curved beam through the bi-component epoxy adhesive Araldite® 420 A/B by Huntsman. The mechanical properties of the adhesive and its processing procedures were provided by the supplier.
It is known from the literature that the low surface energy materials, such as polymers, are difficult to bond [27]; therefore, with the aim of improving the adhesion, roughening of the surface was carried out, ensuring an increase in the surface area and leading to more molecular bonding interactions and mechanical interlocking [28]. The curing was performed at room temperature for 24 h to obtain a full cure and an adhesive layer of about 100 µm. Each piezoelectric transducer was applied at a given distance from the end edge of the curved beam to ensure the proper area was equipped for the following tests. The test specimen, consisting of a piezoelectric ceramic transducer and a curved beam above which it is bonded, is shown in Figure 8.

3.2.2. Description of the Test Setup

The beam specimen was then connected to a dedicated setup. A picture of the setup and its schematic are provided in Figure 9. PXIe 5423 was used to generate the excitation signal, which was then amplified through the PI E472 module to adequately supply the square piezo transducer. The signal used for the tests, a swept sine excitation in the range 0–3 kHz, excited the dynamic response of the beam, whose deformation was detected by the two thin piezo transducers. The excitation and the strain-related signals were collected by the PXIe 5105 module and elaborated through a PC.
The main characteristics of the experimental setup were collected in Table 9, while the instrumented prototype is shown in Figure 10. The piezoelectric transducers adopted for this application meet the European standard EN 50324-2:2004. The accuracy of the piezoelectric patches used as sensors depends on several parameters discussed in [29]; here, the accuracy is conservatively assumed to be equal to 1%. This kind of transducer was chosen because of its high sensitivity (at least 3 orders of magnitude larger than for resistive strain gauges), as well as its large frequency bandwidth (in the range of several MHz), making it able to follow the characteristic phenomena associated with ultrasound-wave-based de-icing systems. Other types of sensors, such as fiber optic sensors, even if more sensitive, would require dedicated acquisition systems presenting practical limitations in terms of the max frequency bandwidth (generally below 20 kHz), making them hardly compatible with ultrasound applications.

3.2.3. Experimental Results and Discussion

The dynamic response of the system was investigated. To this end, the refined finite element model shown in Figure 11, reproducing by symmetry one half of the test specimen, was used. At first, a normal mode analysis was implemented. The first 4 modes are shown in Figure 12. Then, the dynamic frequency response was investigated and compared with the experimental one. The plot in Figure 13 compares the electrical signals produced by the outer and inner piezo transducers, numerically estimated by considering the expanding piezo forces (solid magenta and cyan lines) and the pin forces alone (dot-dashed magenta and cyan lines) and the experimental data (red and blue lines). The pin force magnitude was computed by multiplying it by a factor of 2.89 × 10⁻³ (see Table 8) the tangential and resultant loads were applied by Nastran to simulate the thermal expansion effect. The difference between the configurations with and without the piezo device becomes more evident as the frequency increases for the impact of the piezoelectric patch on the overall dynamic response, both in terms of the mass and stiffness. Some considerations could be made for the results presented in the plot of Figure 13:
  • A direct comparison should be done between the solid lines referring to the experimental (red and blue) and numerical (magenta and cyan) data, since all of them refer to the beam with the piezo actuator mounted on it. The numerical model seems to be adequate not only in the static condition but also for a certain dynamic range, as suggested by the good agreement found for the first two peaks at 84 and 274 Hz; amplitude differences were noticed, although they can be attributed to the system damping not having an impact on the proposed model;
  • The deviation between the experimental outcomes with piezo forces (red and blue solid lines) and numerical predictions with pin forces replacing the piezo forces (magenta and cyan dashed lines) are due to the remarkable effect of the piezo patch on the overall dynamic response, both in terms of the mass and stiffness; it is, however, worth noting that once again a good agreement is found for the two peaks. The remaining peaks in the range do not differ so much in terms of frequency but they do in terms of magnitude.
For this configuration, the ratio of the radial component over the tangential component was 22.6% in a condition of static actuation. This value is in line with the one highlighted by the red marker in the parameterization illustrated in the plot of Figure 21.

3.3. Parameterization Results

After having validated the model of the curved beam with theoretical schemes and experimental measurements, attention was paid to the impact of the parameters described in Section 2 on the transmission capability.

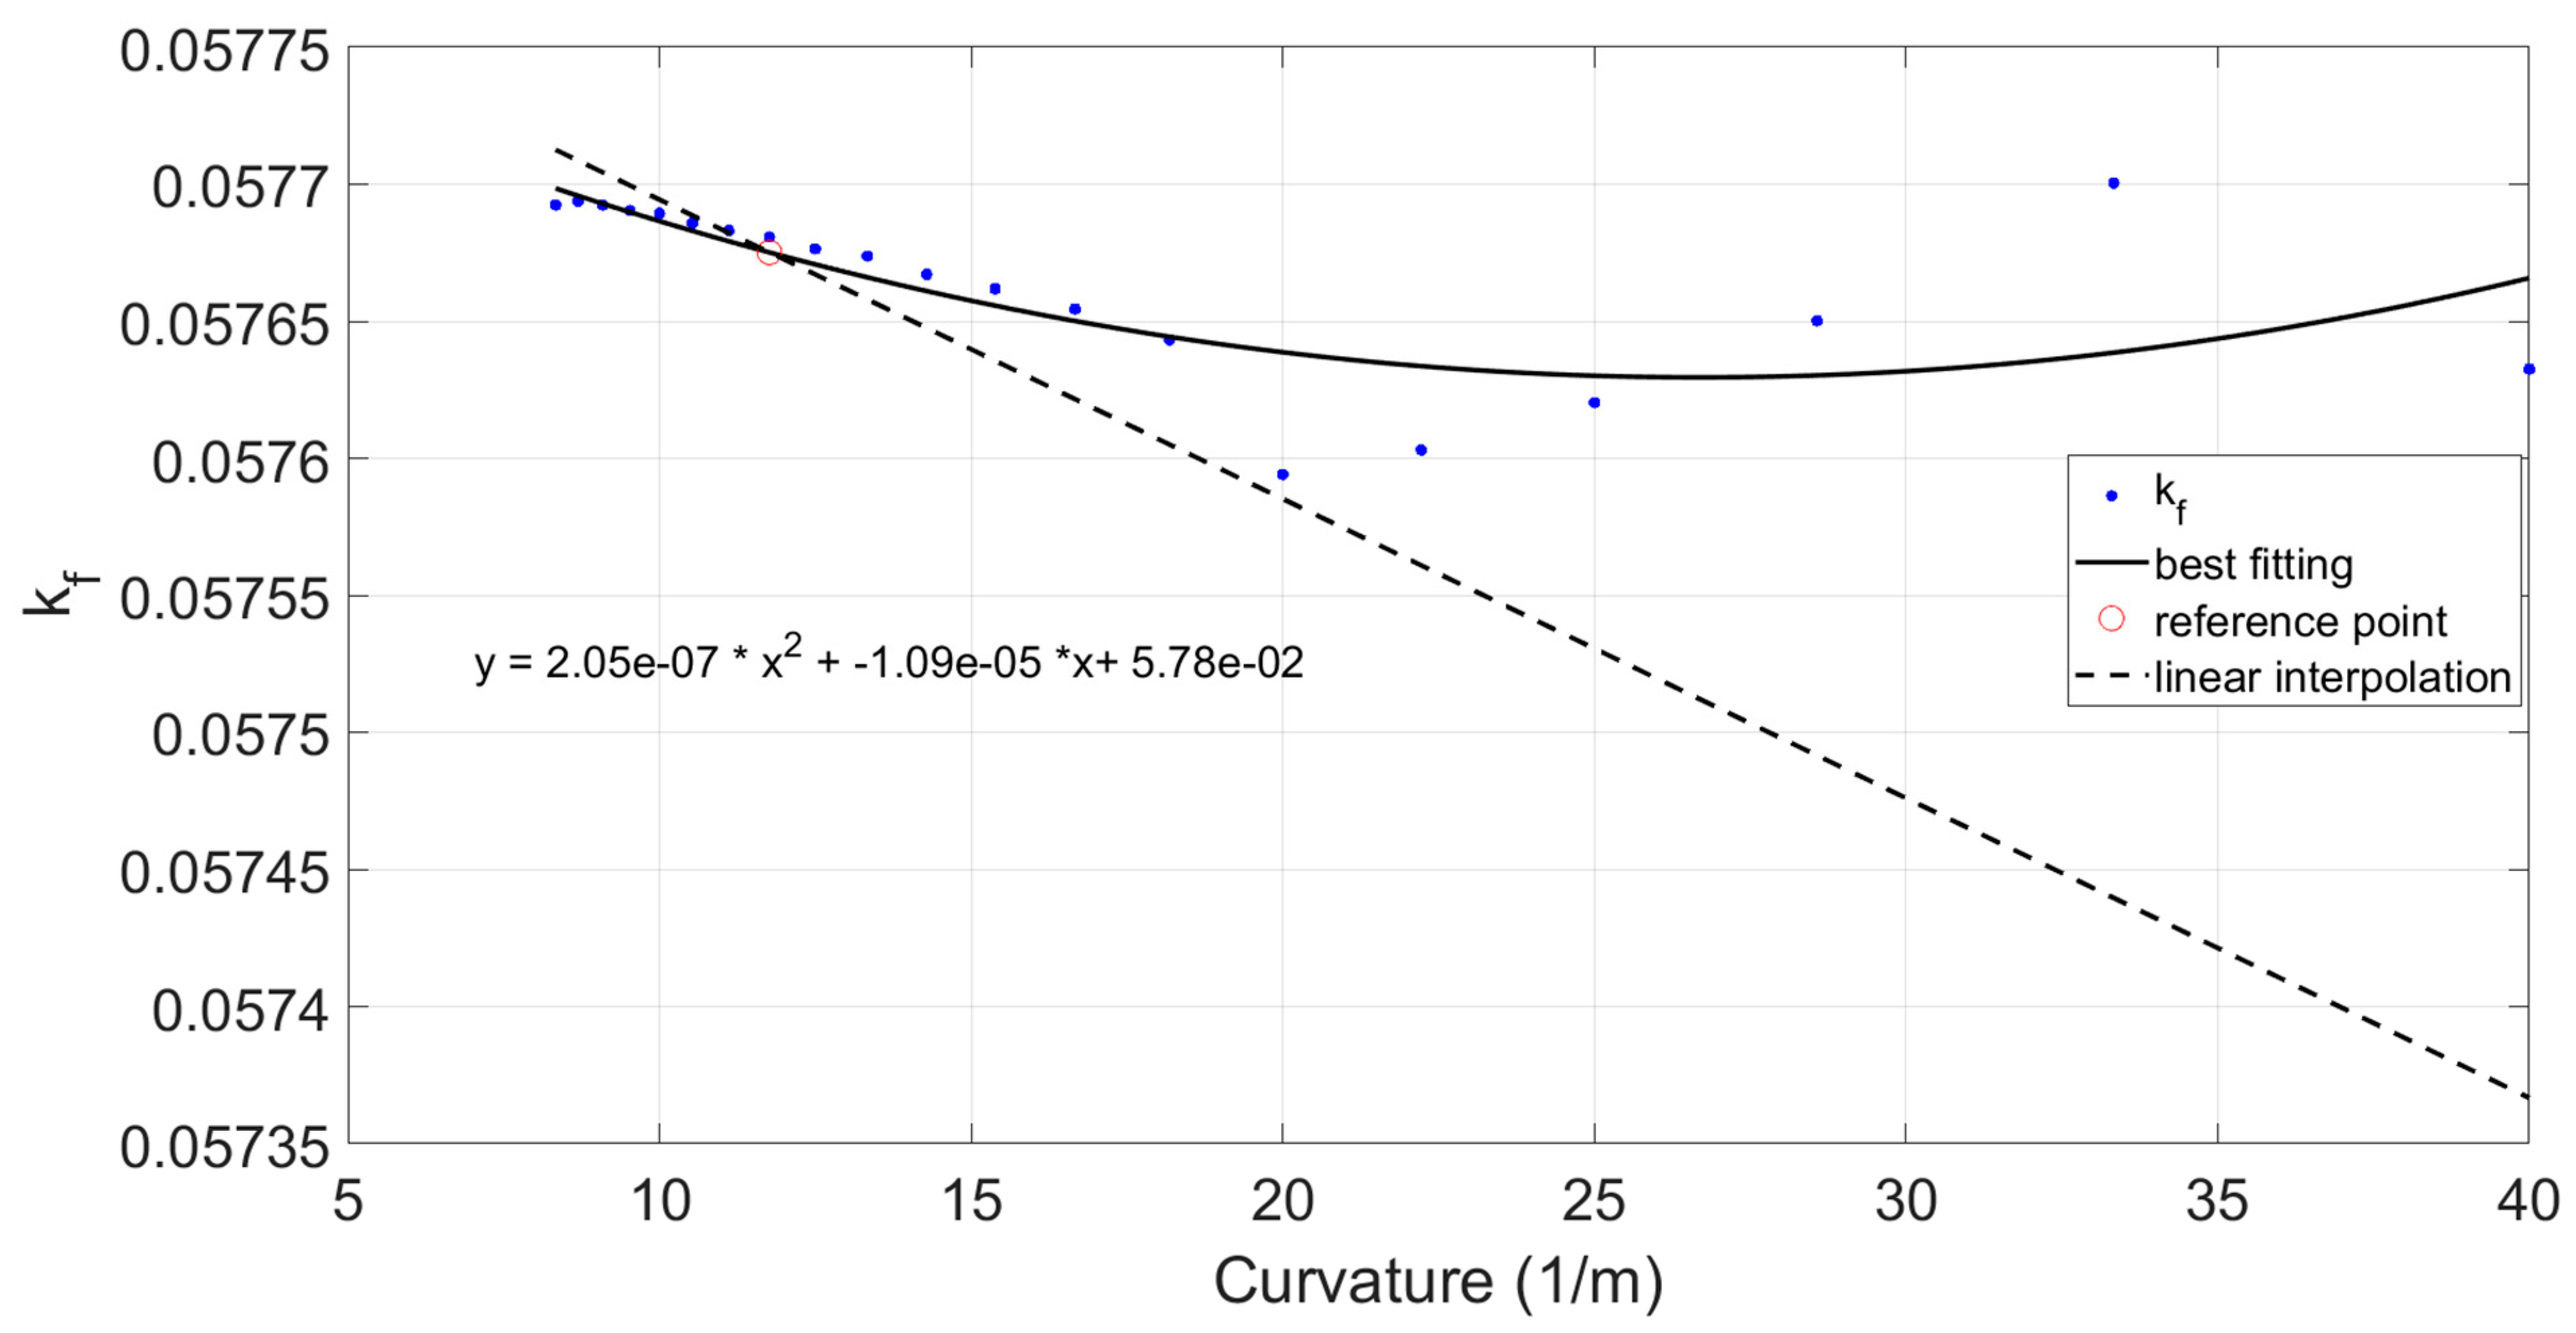
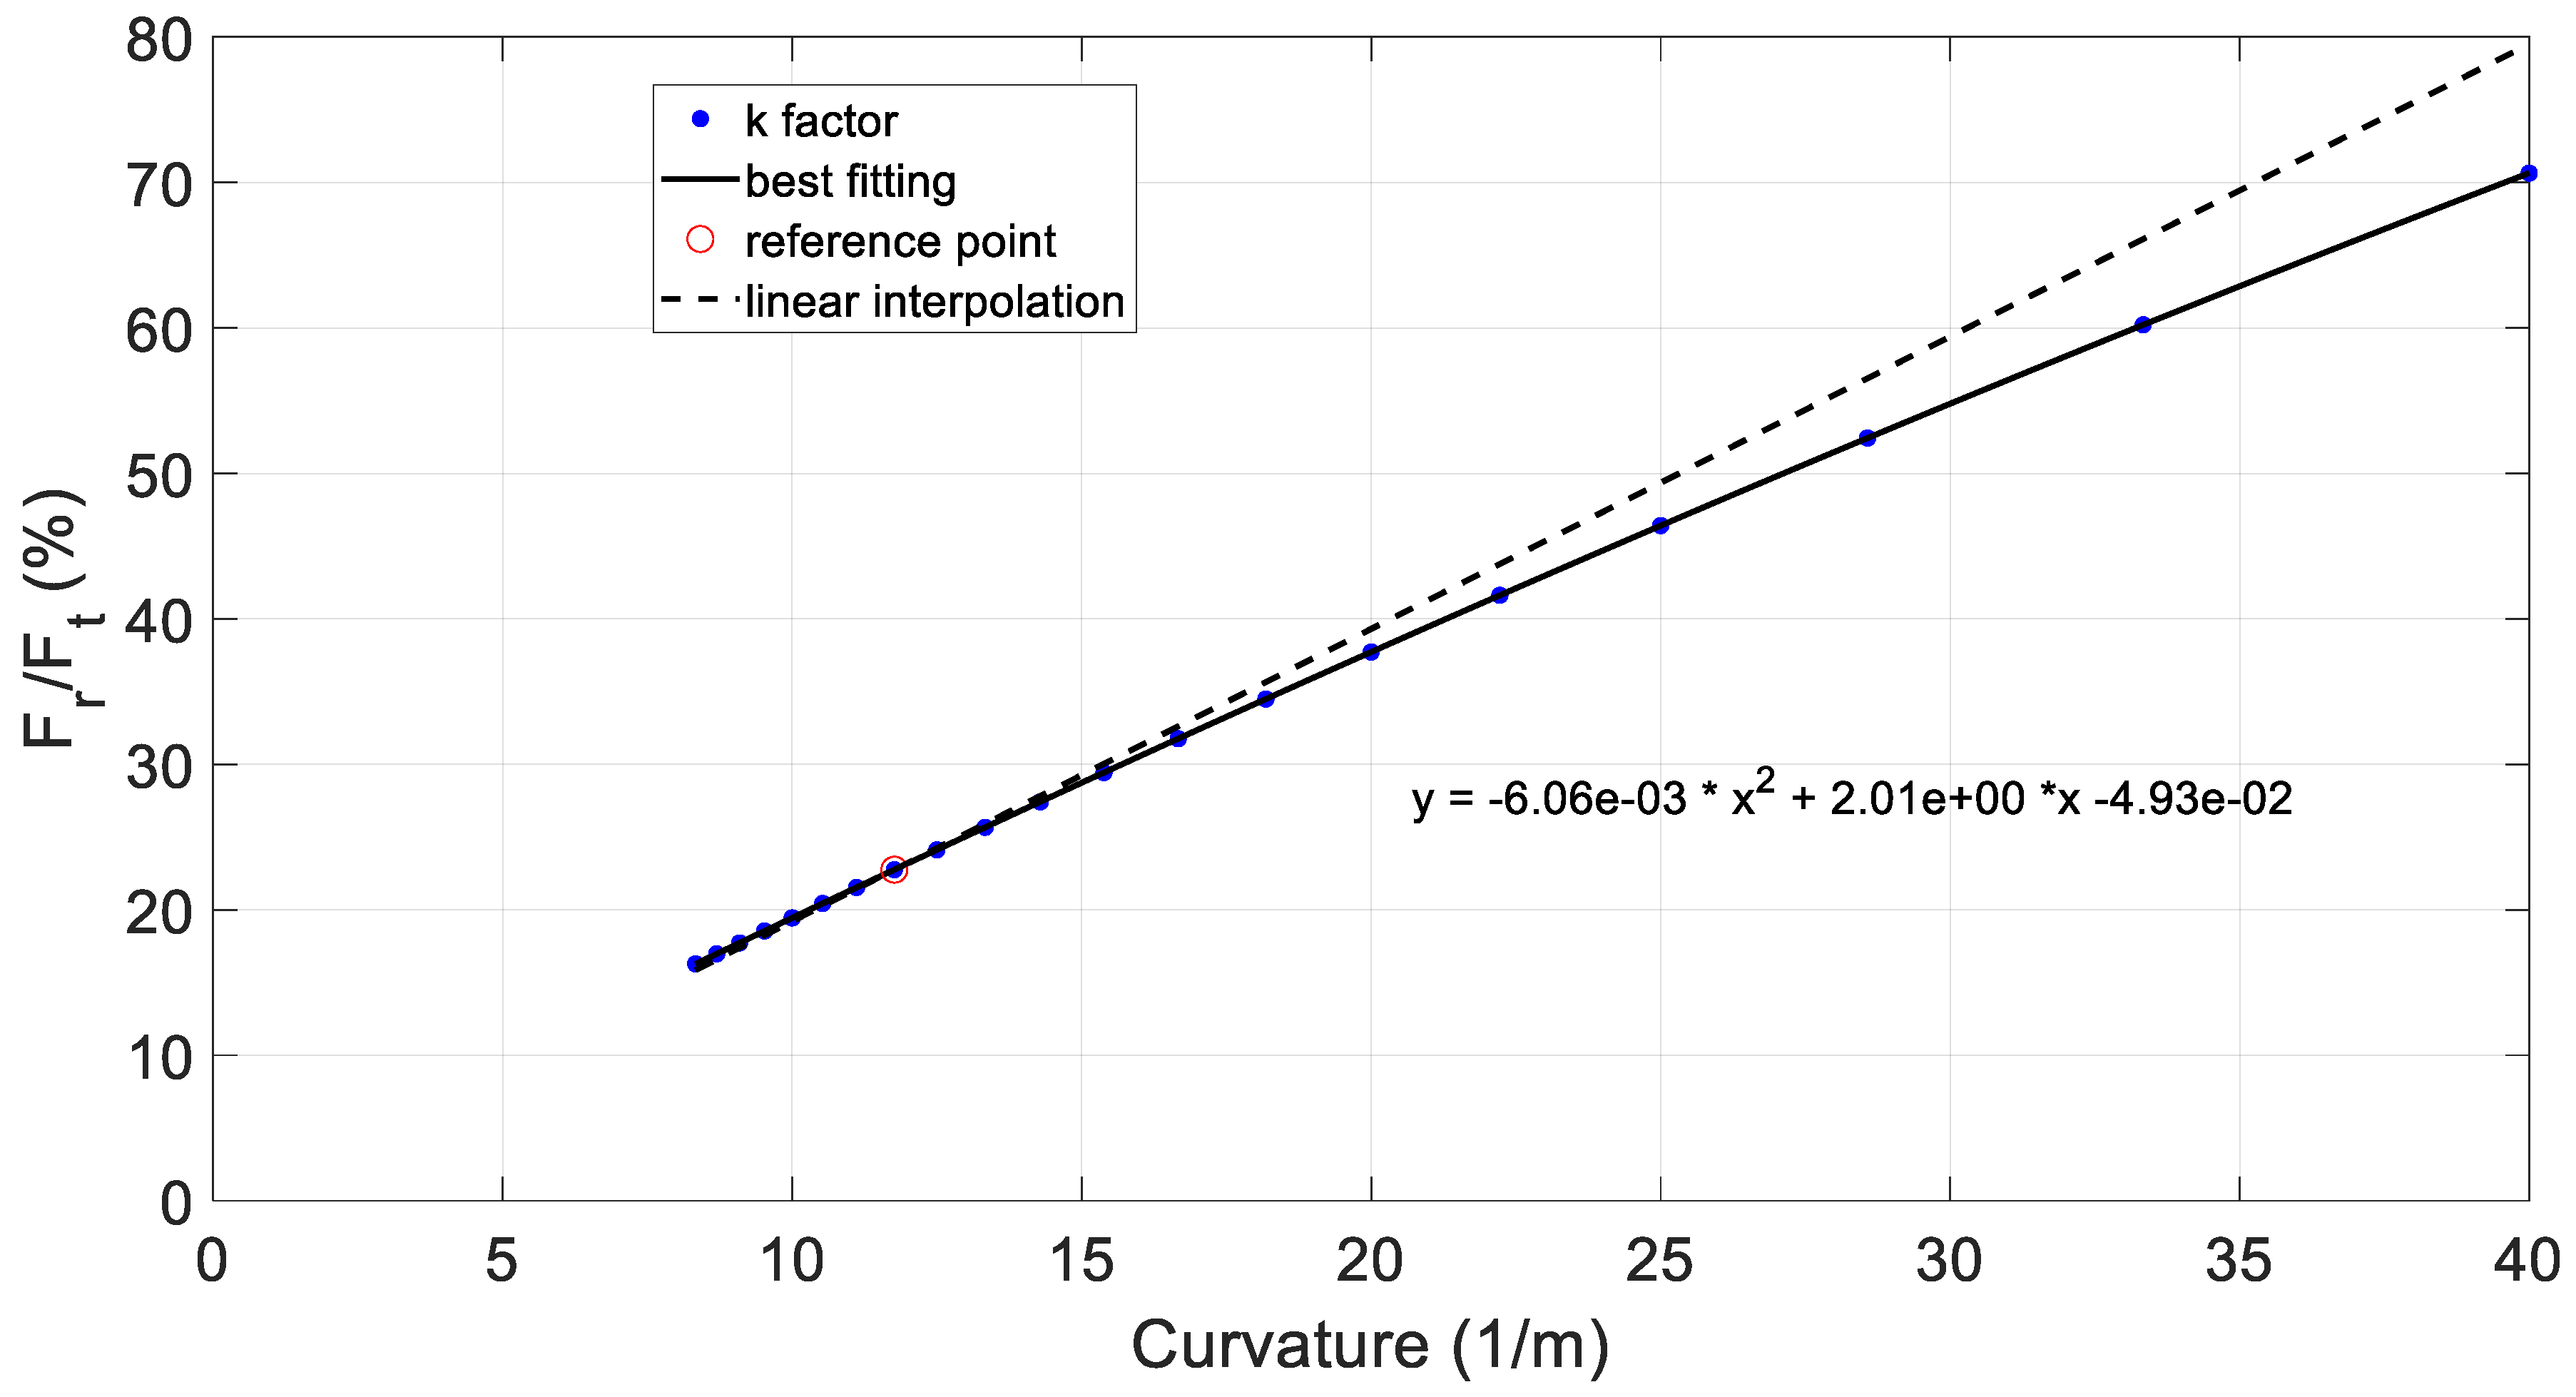
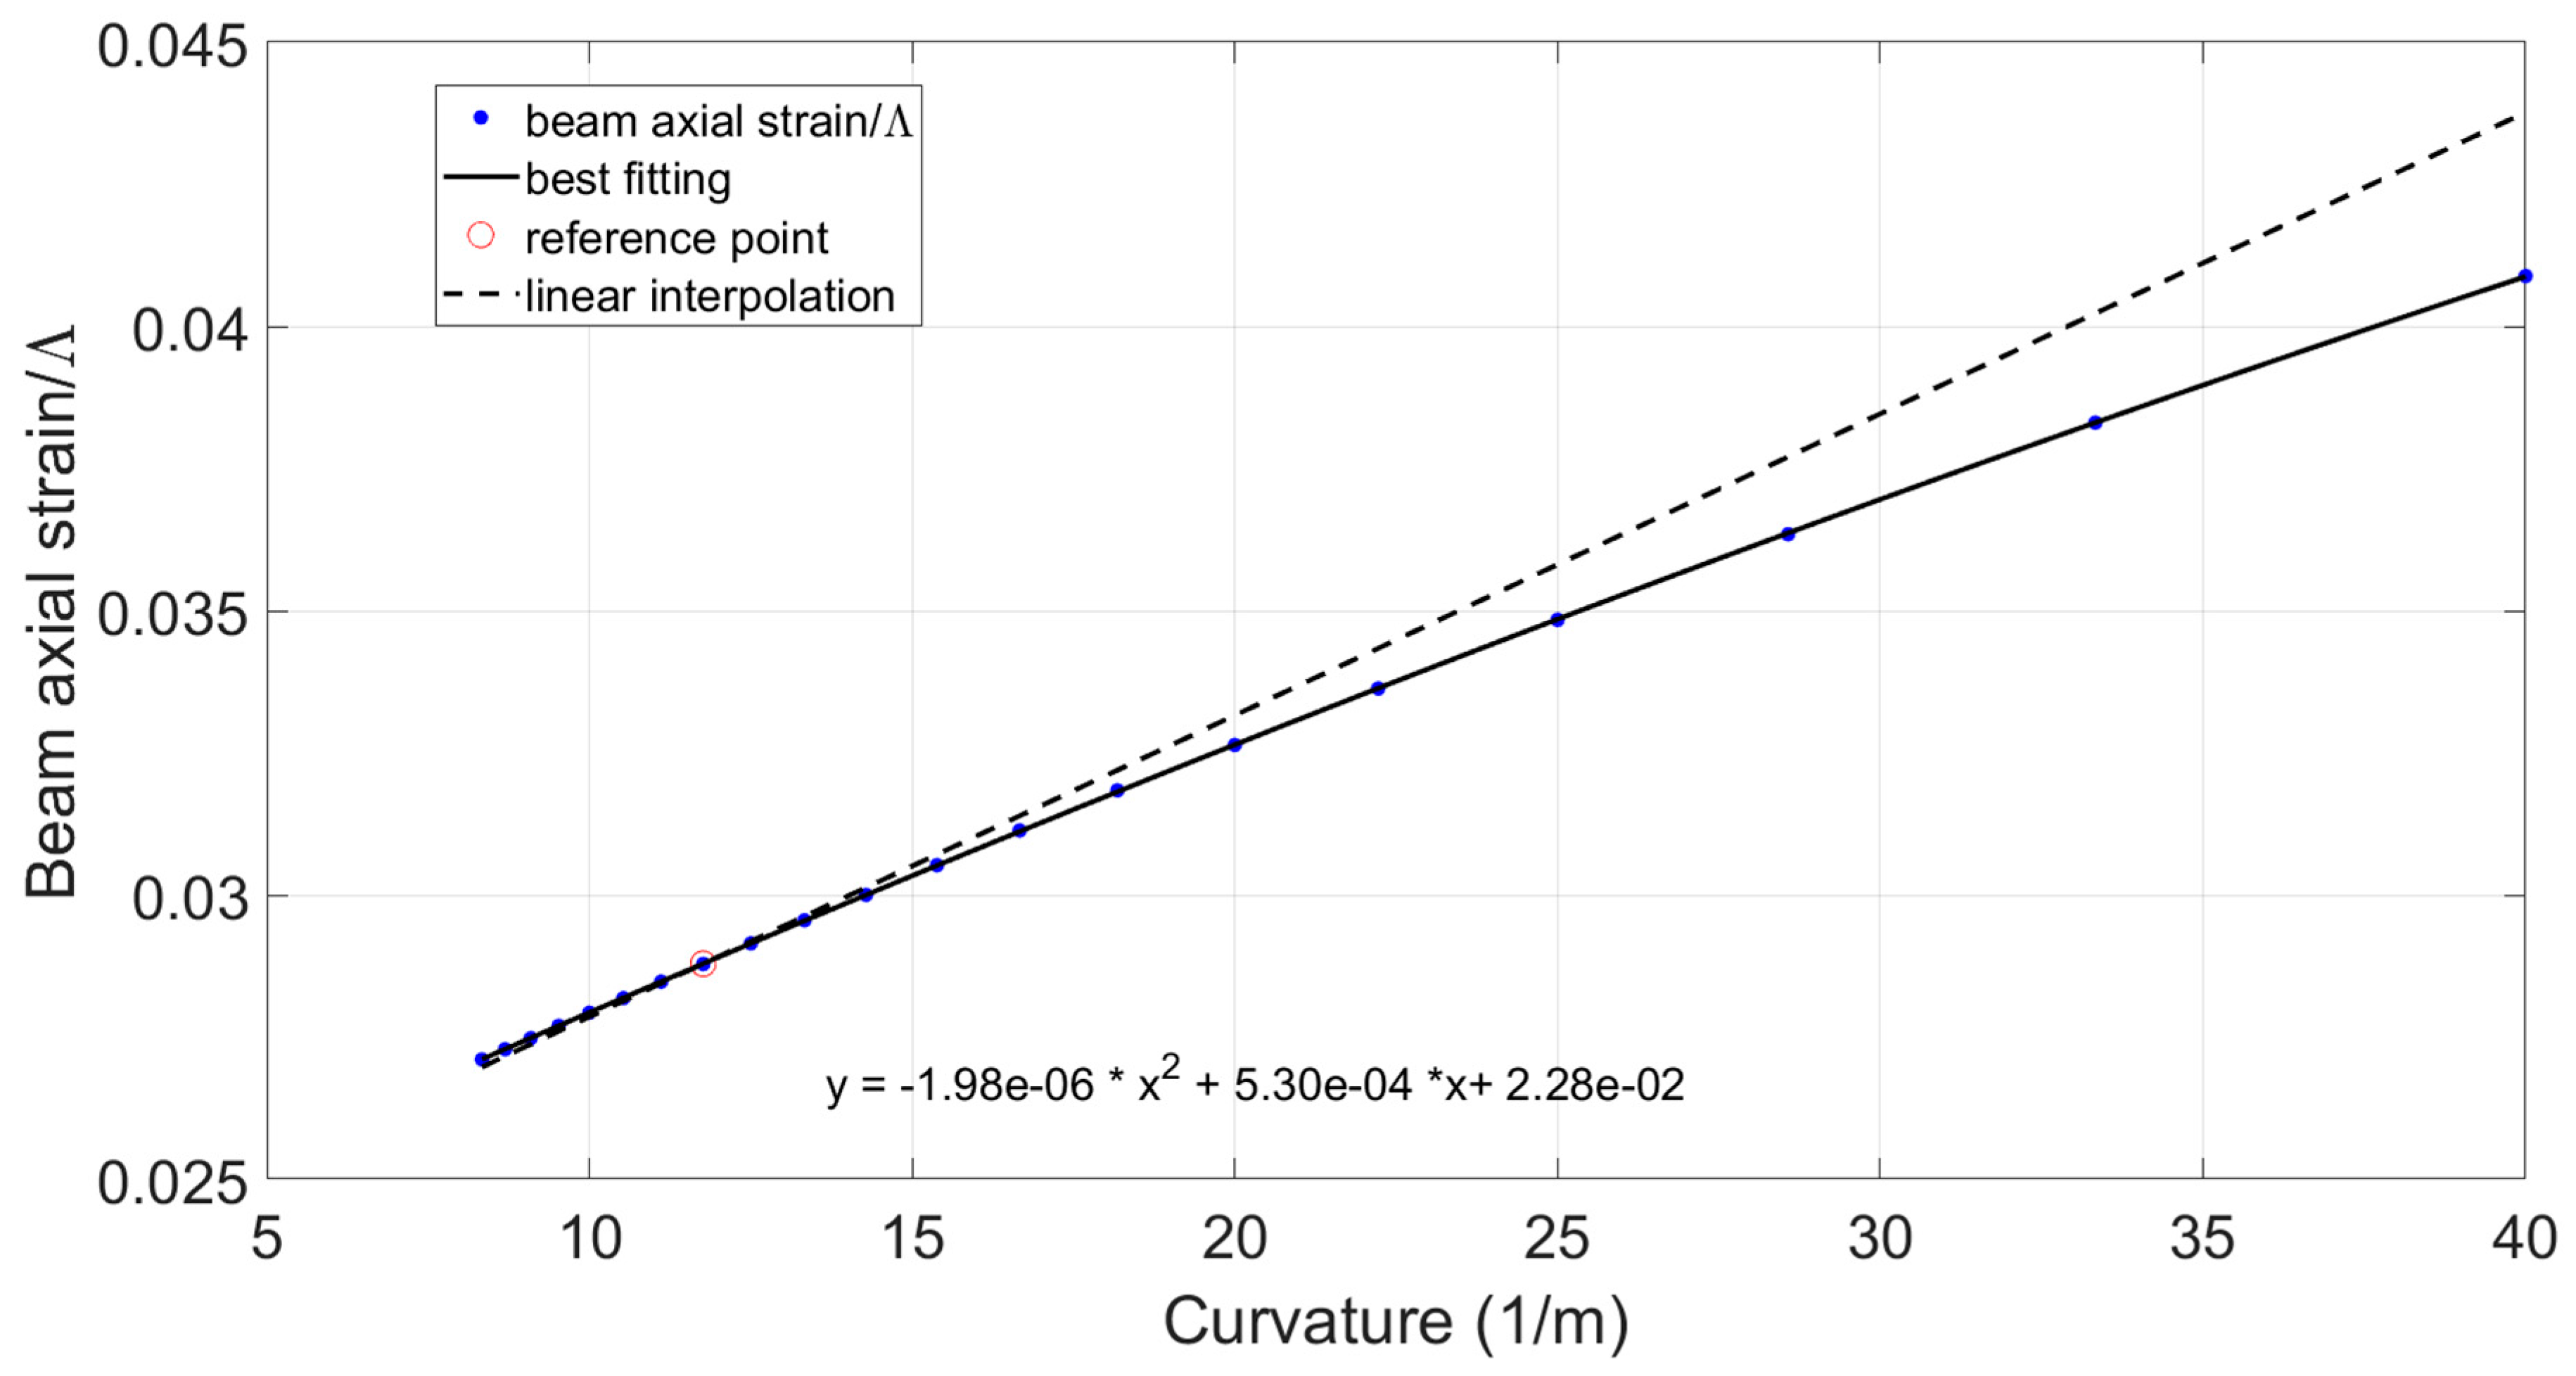
3.3.1. Effect of the Beam Curvature on the Transmission Force and Deformation

The contour plots shown in Figure 14 compare the deflection obtained by means of the thermal load (left) and the pin forces (right) for a curvature of 12 m−1. The evolution of the k and kf factors defined in (11) and (12) and the % ratio between the radial and tangential pin forces are plotted in Figure 15, Figure 16 and Figure 17. Finally, in Figure 18, the axial strain transmitted to the beam over the piezoelectric free strain, Λ, is plotted against the curvature.
A linear behavior of the transmission k factor can be observed up to a curvature of 15 m−1. The advantage of this is that the curvature effect may be handled just through a corrective factor before introducing the adhesive layer effect. As the curvature increases, the pin forces ratio also increases, making necessary larger radial forces to balance tangential components with smaller relative angles. Additionally, a similar trend can be observed for the beam axial strain over the piezoelectric free strain. Finally, kf seems to not be remarkably affected by the curvature. This factor remains practically constant around a value of 0.0575 for the parameters investigated in the next sections. For this reason, it is not reported.

3.3.2. Effects of the Position of the Piezo Device on Transmission Force and Deformation

As shown in the plot in Figure 19, the angular location of the piezo transducer does not have any appreciable impact on the k factor for piezo angular positions ranging from 10 to 50 deg. In line with this, no variations can be observed in terms of the transmitted axial strain. This would allow us to dispose of more than one piezo device along the beam (assuming the curvature to be constant) without losing anything in terms of performance. Therefore, instead of using a long piezo patch (we will see that this will bring to lose some performance), a constellation of piezo patches can be used. This is also in agreement with what Crawley and de Luis stated in their work.

3.3.3. Effect of the Length of the Piezo Patch on Transmission Force and Deformation

As shown in Figure 20, the k factor remarkably changes for piezo patches with small angular extensions (diminishing by about 40% in the extension range of 10–30 degree), while it remains practically constant as the extension increases.
A linear trend for the extension was also estimated for the radial/tangential pin force ratio (Figure 21). Finally, a parabolic trend for the beam-transmitted axial strain over the free strain of the piezoelectric patch was observed (Figure 22).

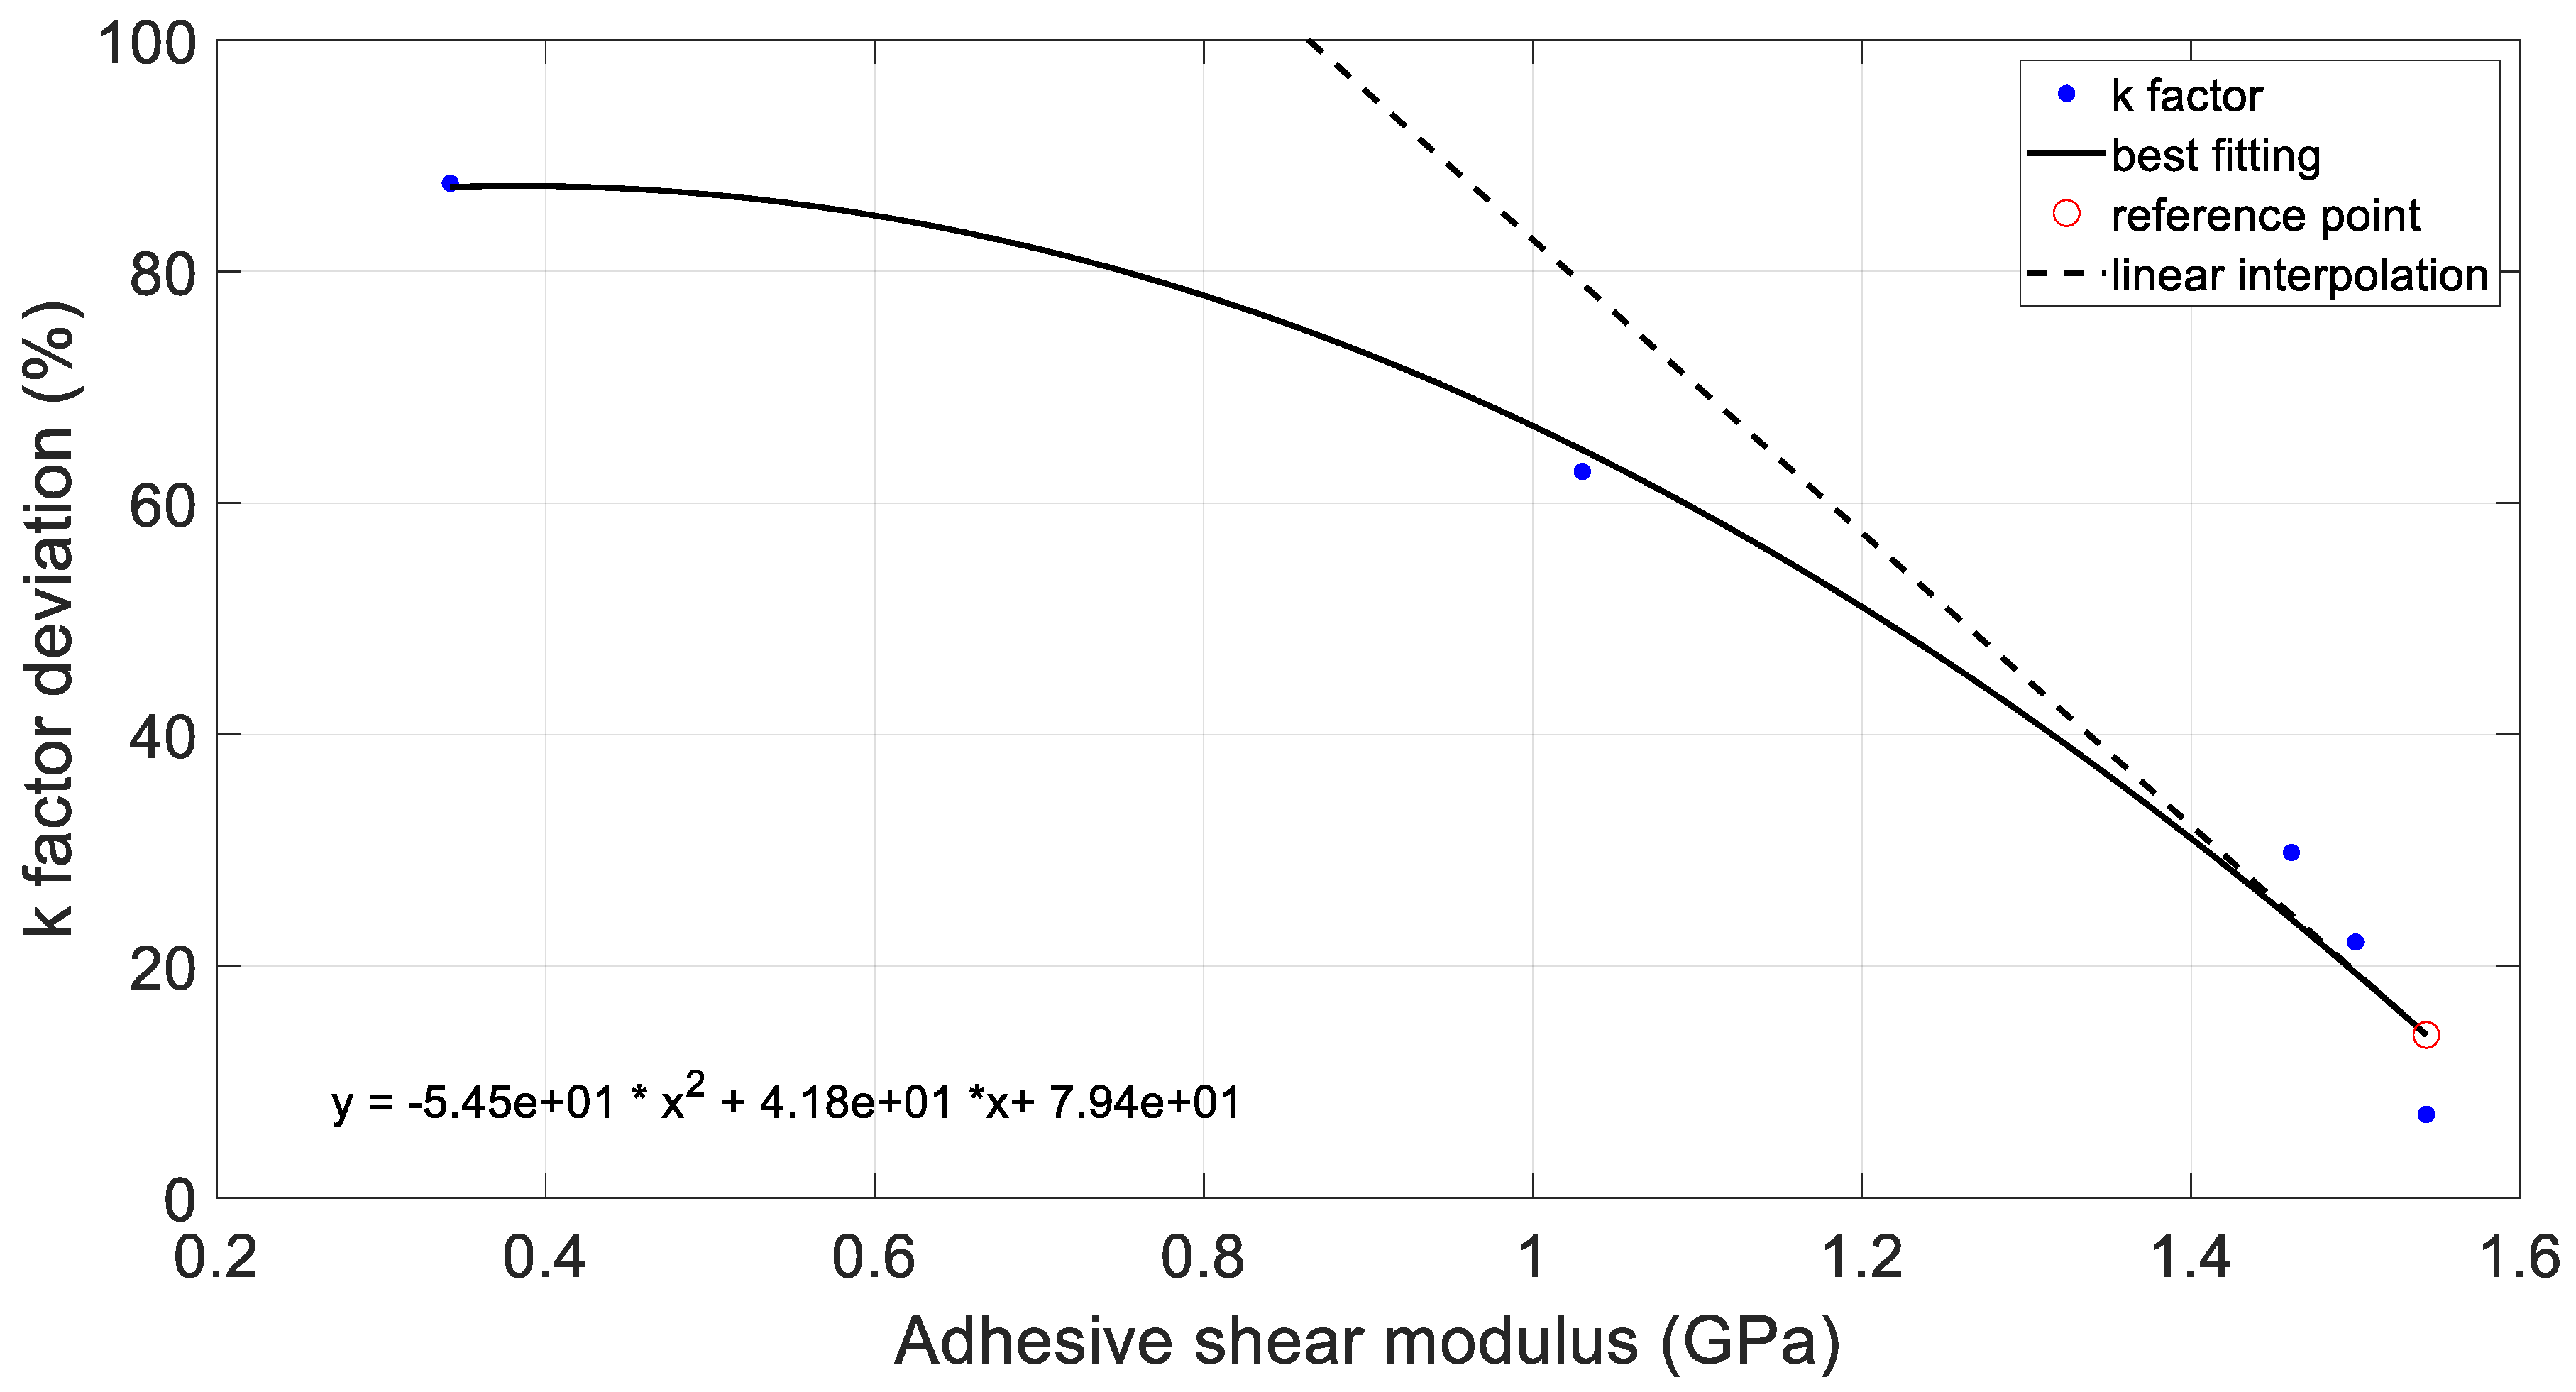
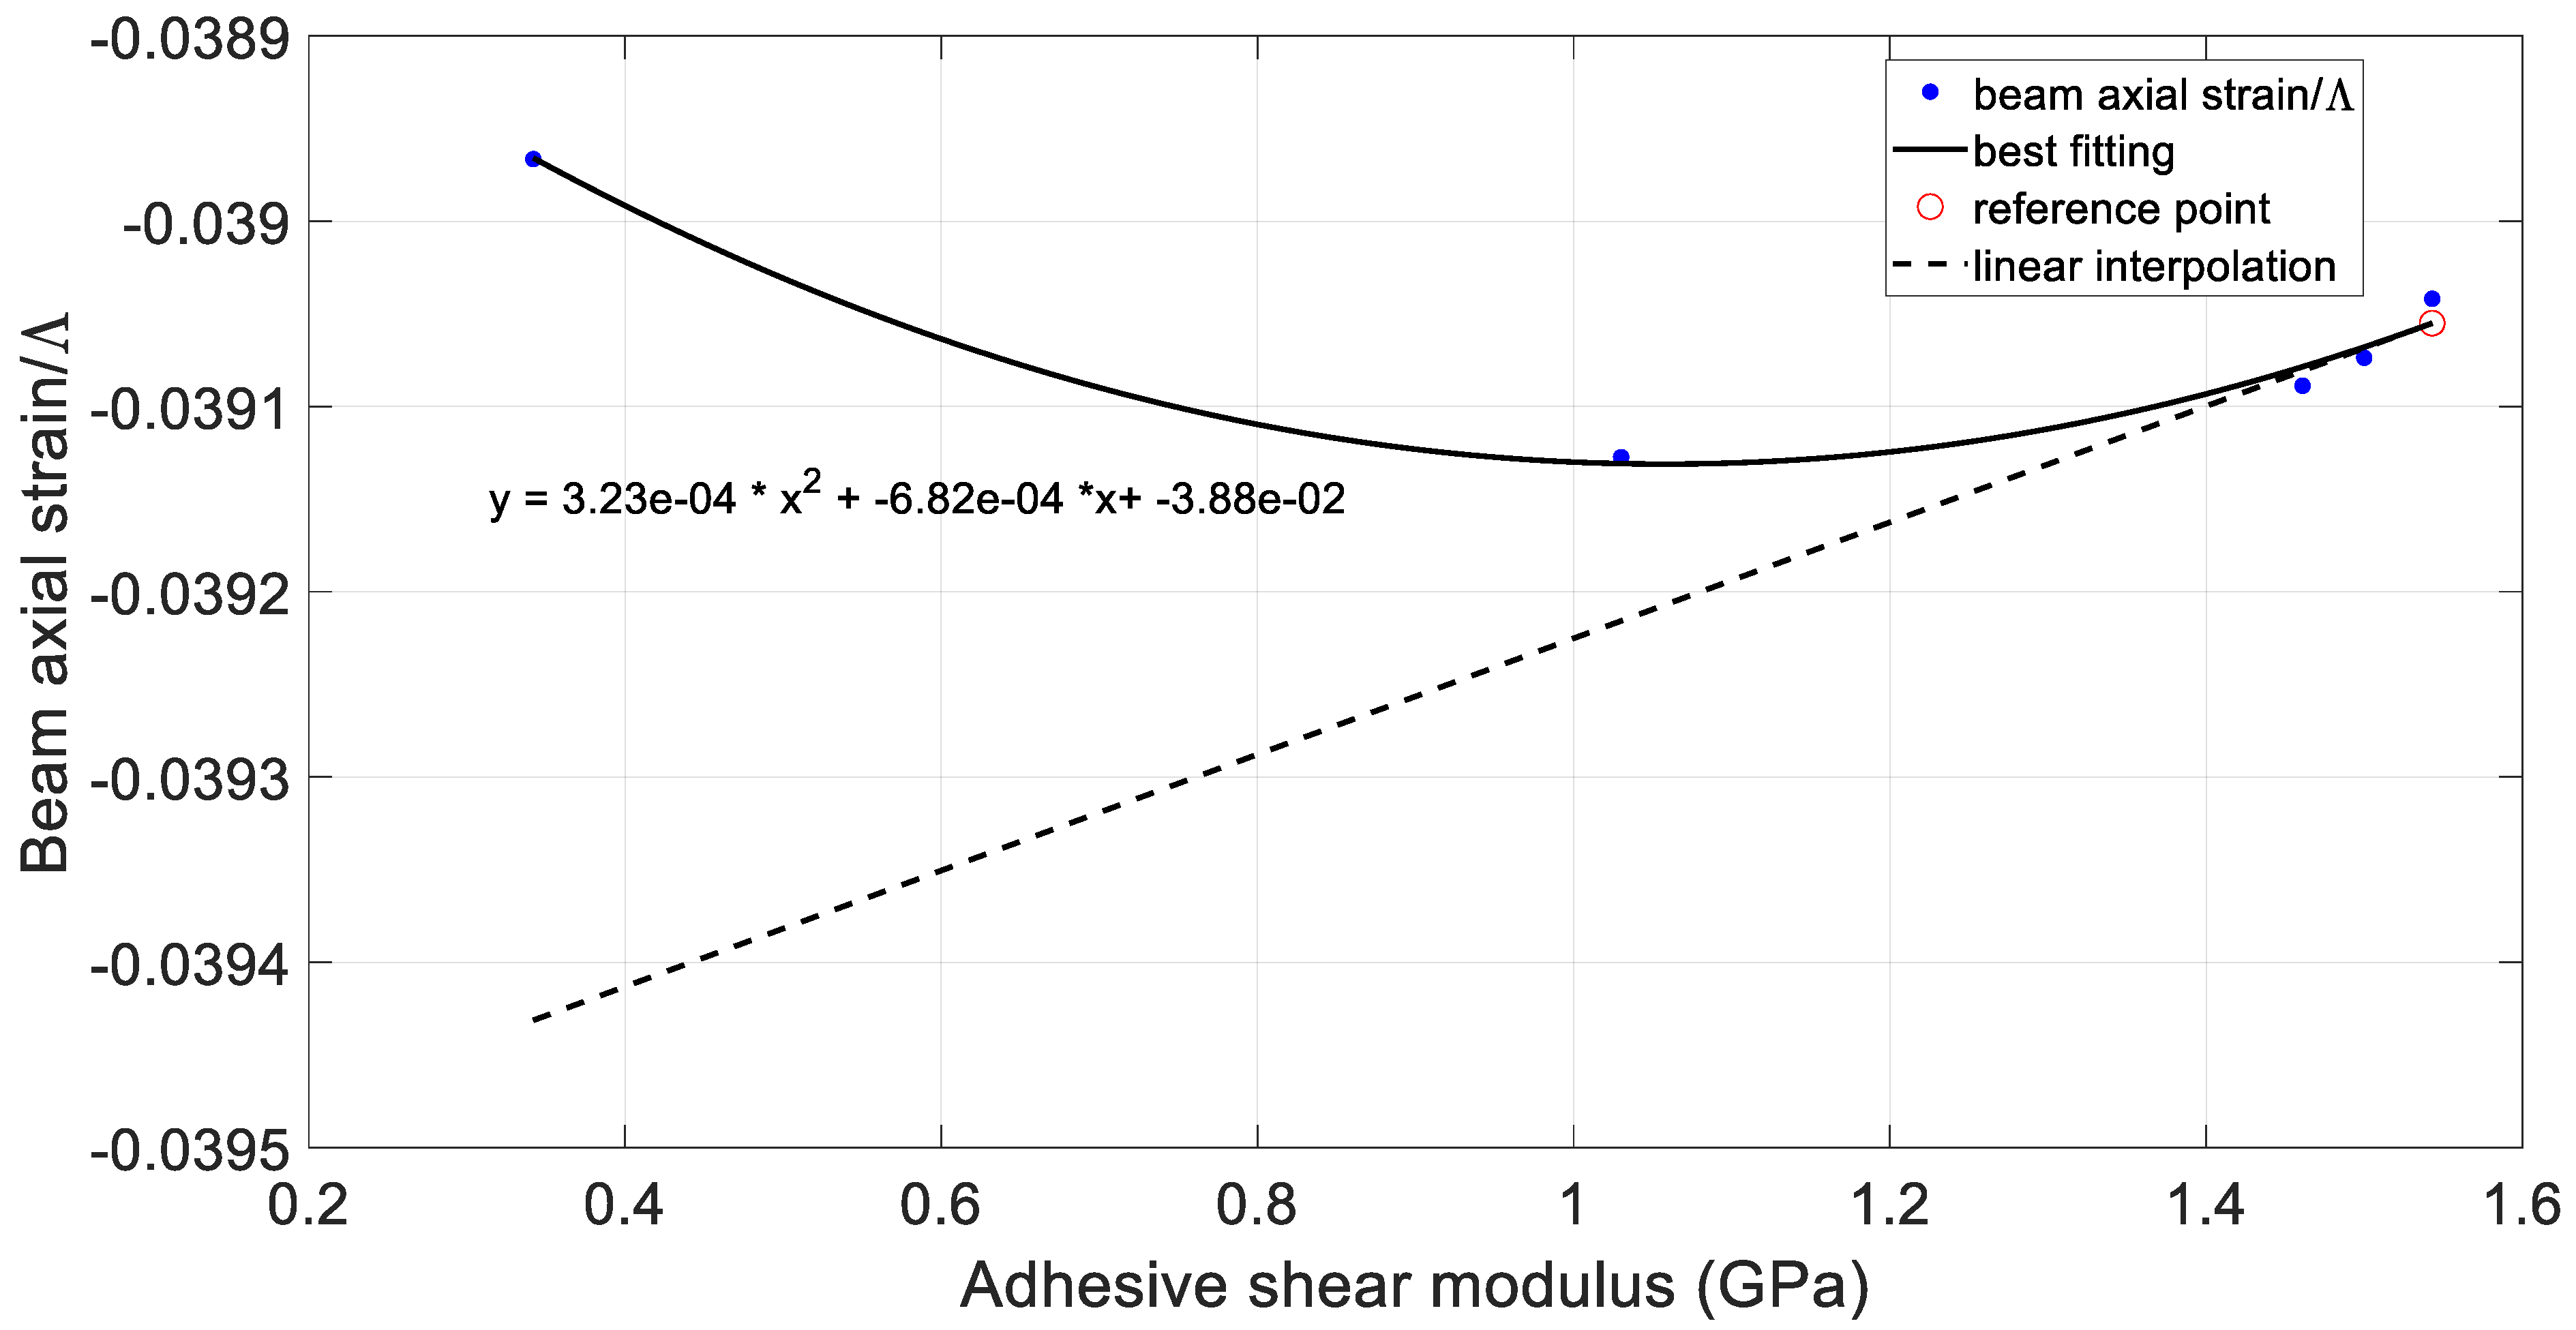
3.3.4. Effect of the Type of Adhesive on the Transmission Force and Deformation

A summary in terms of the k factor, % of transmission, and % of error with respect to the case without an adhesive is reported in Table 10.
The % deviation of the k factor with respect to the ideal bonding is plotted against the shear modulus of the adhesive in Figure 23. Finally, in Figure 24 the beam axial strain against the shear modulus of the adhesive.

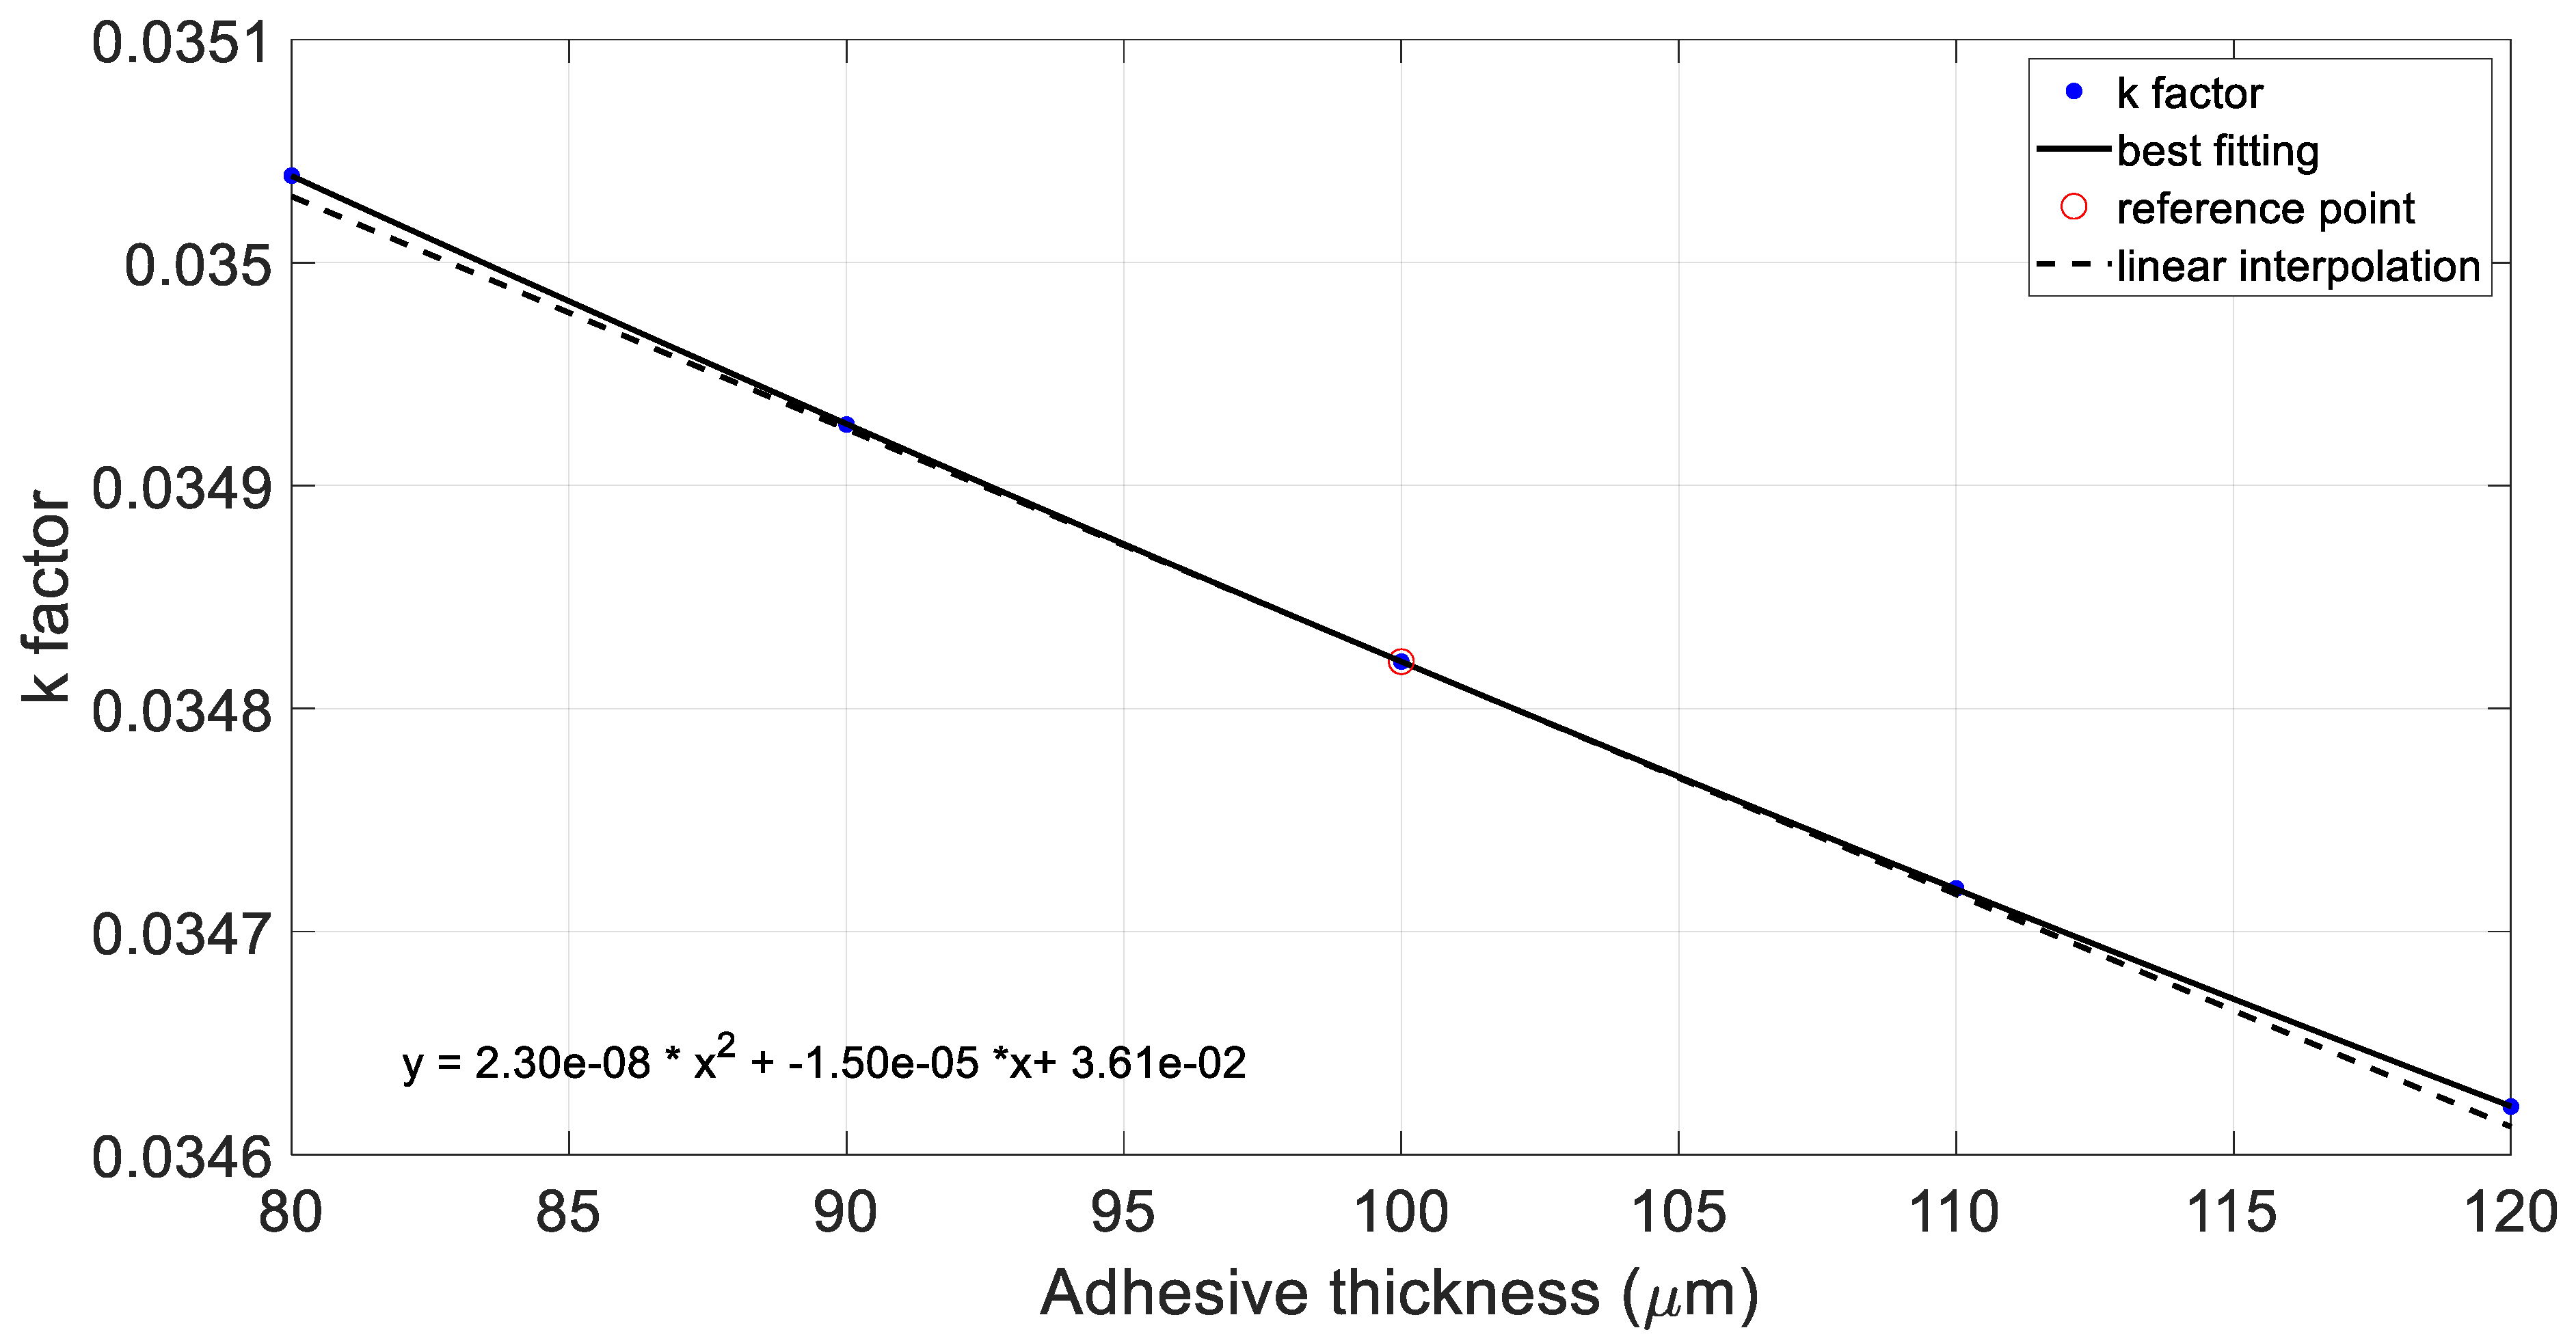
3.3.5. Effects of the Thickness of the Layer of Adhesive on the Transmission Force and Deformation

To highlight the most effective resin in terms of transmission, a dedicated FE model was used, including a bonding layer. The plot in Figure 25 shows the displacement field obtained by means of a piezoelectric patch with a tangential extension of 10 mm, bonded on the middle (45 degree) of the beam with a curvature of 20 m−1. The resin used in this case was Loctite-Hysol-9394. The impact of the thickness of the adhesive and Γ parameter was also investigated in Figure 26 and Figure 27. In particular, the k factor linearly decreased with the bonding thickness, with a decrease of about 1% when passing from a thickness of 80 µm to a thickness of 120 µm. A similar trend was also observed for the beam-transmitted strain over the free strain of the piezoelectric device (Figure 28). It should be noted that the adhesive layer possesses a curvature like that of the beam and the piezoelectric patch.
As evident, the physical bonding layer brings about an important reduction in the transmission factor as the adhesive becomes softer. The case with the shear modulus equal to 10 can be considered representative of perfect bonding, leading to 100% transmission, although this is not realistically achievable due to the current limitations of the adhesives.

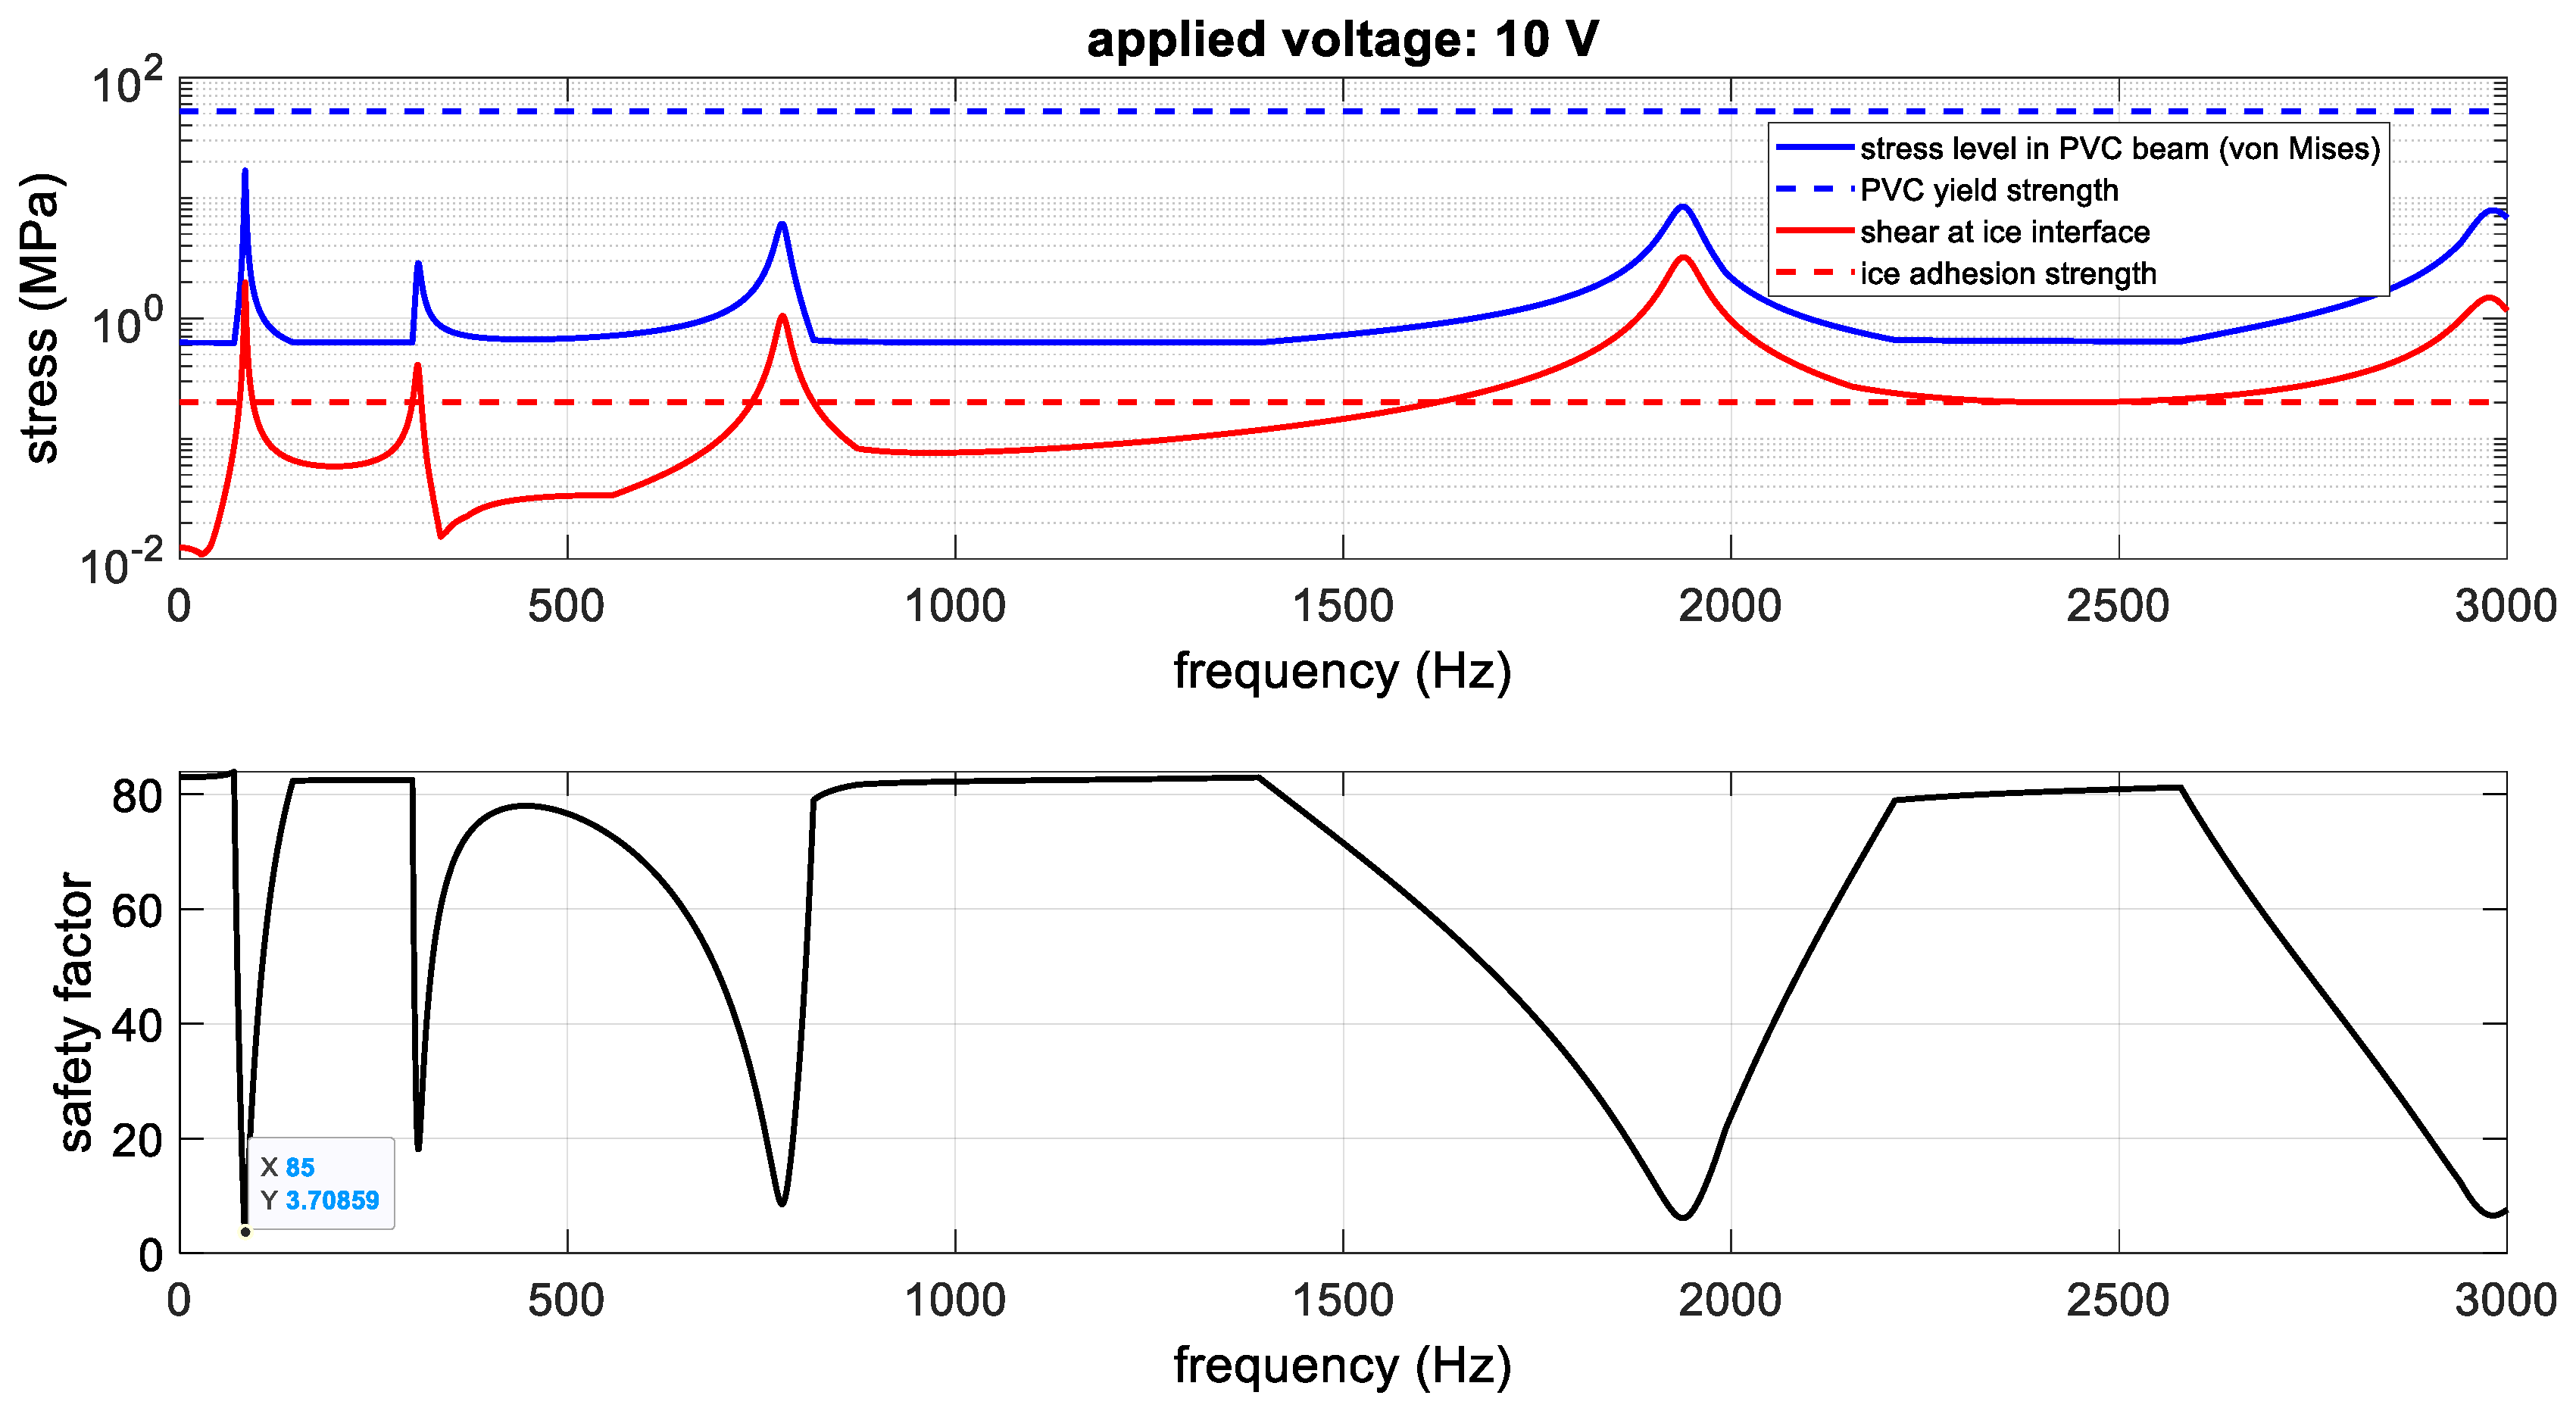
3.3.6. Impact of the Piezo Actuator on Ice Protection

In this section, the impacts of the piezoelectric both as ice protection system and in terms of the stress transmitted to the structure are preliminarily discussed. To this end, the model shown in Figure 11 was integrated with an ice accretion measuring 3 mm in thickness, with the same angular extension of the piezo actuator, covering the entire width of the arch and placed in its middle. The model is shown in Figure 29.
The properties of the ice used in the simulation are summarized in Table 11.
An FRF analysis was implemented to estimate the maximum stress level in the beam and the shear action at the interface with the ice within the frequency bandwidth. In Figure 30, in the graph on the top, the stress level (von Mises) produced in the beam by the piezo device excited at 10 V is plotted (blue line) and compared with the PVC yield stress (blue dashed line, 52 MPa, Table 1). As is evident, within the entire bandwidth the stress remains well below the stress limit. This is also confirmed by the safety factor (black line) plotted in the graph on the bottom (minimum value of 3.7). Finally, in the graph on the top, the shear at the interface with the ice (red line) was compared with the adhesion strength (red dashed line, 0.2 MPa). As is evident, a tension of 10 V is enough to cross the shear strength threshold for all peaks of the bandwidth, thereby confirming, even preliminarily, the effectiveness of the ice protection method and its compliance with the structural integrity of the beam.

4. Conclusions and Future Steps

In this work, attention was paid to estimating the actuation produced by piezoelectric patches bonded on curved beam elements made of PVC material, in view of ice protection applications on different parts, such as the piping and windshield. The peculiarity of these applications is represented by the stiffness of the protected structure, which is 1 order of magnitude lower than the piezoelectric patch. The aim of the work was to find a parametric relation among certain geometric features of the system (e.g., the curvature, location, and extension of the piezo patch; the thickness and strength of the bonding) and the force transmitted. In this sense, two configurations were investigated—one constituted by a curved structure with a piezo patch bonded and expanding under the effect of a unitary thermal load (representative of the voltage when a fictious thermal coefficient is assigned to the material of the piezo patch) and another one constituted by the structure alone subjected to unitary tangential pin forces and balanced radial components, reproducing the action of the piezoelectric patch. At first, a comparison was organised with models from the literature; although these theoretical schemes refer to flat applications, a good agreement was found in terms of the transmission factor, especially when the strain profile was assumed linearly to the thickness of the piezo patch. After having proven the consistency of the proposed model, the parameterization was carried out, whereby the ratio between the displacements for the two configurations and the ratio between the unitary pin force and the load generated by the solver and equivalent to the unitary thermal were computed. These two ratios, in fact, play a critical role in two aspects—the modeling of curved plates under the action of pin forces representing piezoelectric actions in static configuration and the computation of the strain transmission.
The work herein presented is just a step towards the comprehension of the strain actuation of piezoelectric patches integrated onto curved soft structures. The results provide operational guidelines for designers in the static field; that is to say, far from resonance phenomena. Notwithstanding the typical applications of the piezoelectric actuators, which rely upon the resonance effect, the next step of the research will be the extension of the results to the dynamic responses.

Author Contributions

Conceptualization, A.C. (Antonio Concilio); specifications, A.C. (Armando Castrovinci); specifications of the actuation systems, A.C. (Antonio Concilio); methodology, A.S.P., A.V.; validation, A.V.; formal analysis, S.A.; visualization, A.S.P., S.A., A.C. (Armando Castrovinci); supervision, L.C., A.C. (Antonio Concilio); writing, all authors; original draft preparation, A.S.P., A.V., S.A.; project administration, L.C. All authors have read and agreed to the published version of the manuscript.

Funding

This research received no external funding.

Data Availability Statement

Data available on request due to restrictions.

Conflicts of Interest

The authors declare no conflict of interest.

Acronyms and Symbols

α P Z T Simulated (FEM) piezoelectric thermal expansion coefficient featuring a voltage effect (converse piezoelectric effect)
c u r v Airfoil’s local curvature
c u r v e q Airfoil’s average curvature
d31Transversal converse piezoelectric constant
δ 1 Deflection due to pin forces
δ t l Deflection due to thermal load
EpYoung’s modulus of the piezoelectric actuator
EsYoung’s modulus of the structural element
FrRadial pin force
FtTangential pin force
GaShear modulus of the adhesive layer
ΓBonding (or adhesion) quality factor
k Thermal load over pin force beam deflection
LPiezoelectric actuator length
L e q Piezoelectric disk-equivalent in-plane length
Λ = d31V/tcStrain of the unconstrained piezo device under the voltage V
ν p Poisson’s modulus of the piezoelectric actuator
ν s Poisson’s modulus of the structural element
t ¯ = t s / t p Thickness ratio
taThickness of the adhesive layer
tpThickness of the piezoelectric actuator
tsThickness of the structural element
ϕ Elastic constant ratio
θTangential coordinate
ψStiffness constant ratio
VPiezoelectric driving voltage
xAbscissa along the piezoelectric actuator length
xNon-dimensional abscissa

References

  1. Fath, A.; Xia, T.; Li, W. Recent Advances in the Application of Piezoelectric Materials in Microrobotic Systems. Micromachines 2022, 13, 1422. [Google Scholar] [CrossRef]
  2. Aabid, A.; Raheman, M.A.; Ibrahim, Y.E.; Anjum, A.; Hrairi, M.; Parveez, B.; Parveen, N.; Mohammed Zayan, J. A Systematic Review of Piezoelectric Materials and Energy Harvesters for Industrial Applications. Sensors 2021, 21, 4145. [Google Scholar] [CrossRef]
  3. Villeneuve, E.; Ghinet, S.; Volat, C. Experimental Study of a Piezoelectric De-Icing System Implemented to Rotorcraft Blades. Appl. Sci. 2021, 11, 9869. [Google Scholar] [CrossRef]
  4. Villeneuve, E.; Volat, C.; Ghinet, S. Numerical and Experimental Investigation of the Design of a Piezoelectric De-Icing System for Small Rotorcraft Part 2/3: Investigation of Transient Vibration during Frequency Sweeps and Optimal Piezoelectric Actuator Excitation. Aerospace 2020, 7, 49. [Google Scholar] [CrossRef]
  5. Sakaue, H. Special Issue: Deicing and Anti-Icing of Aircrafts. Aerospace 2021, 8, 72. [Google Scholar] [CrossRef]
  6. Li, Y.; Shen, H.; Guo, W. Effect of Ultrasonic Vibration on the Surface Adhesive Characteristic of Iced Aluminum Alloy Plate. Appl. Sci. 2022, 12, 2357. [Google Scholar] [CrossRef]
  7. Cao, Y.; Tan, W.; Su, Y.; Xu, Z.; Zhong, G. The Effects of Icing on Aircraft Longitudinal Aerodynamic Characteristics. Mathematics 2020, 8, 1171. [Google Scholar] [CrossRef]
  8. Yamazaki, M.; Jemcov, A.; Sakaue, H. A Review on the Current Status of Icing Physics and Mitigation in Aviation. Aerospace 2021, 8, 188. [Google Scholar] [CrossRef]
  9. Li, S.; Paoli, R. Aircraft Icing Severity Evaluation. Encyclopedia 2022, 2, 56–69. [Google Scholar] [CrossRef]
  10. Teixeira, J. The “Puzzle” of Water Behavior at Low Temperature. Water 2010, 2, 702–710. [Google Scholar] [CrossRef] [Green Version]
  11. Tan, M.; Mei, J.; Xie, J. The Formation and Control of Ice Crystal and Its Impact on the Quality of Frozen Aquatic Products: A Review. Crystals 2021, 11, 68. [Google Scholar] [CrossRef]
  12. Zhao, Y.; Zuo, Z.; Tang, H.; Zhang, X. Ice Coverage Induced by Depositing a Water Drop onto the Supercooled Substrate at Extreme Low Vapor Pressure. Crystals 2021, 11, 691. [Google Scholar] [CrossRef]
  13. Camisasca, G.; De Marzio, M.; Rovere, M.; Gallo, P. Slow Dynamics and Structure of Supercooled Water in Confinement. Entropy 2017, 19, 185. [Google Scholar] [CrossRef] [Green Version]
  14. Jiang, X.; Wang, Y. Studies on the Electro-Impulse De-Icing System of Aircraft. Aerospace 2019, 6, 67. [Google Scholar] [CrossRef] [Green Version]
  15. Muhammed, M.; Virk, M.S. Ice Accretion on Fixed-Wing Unmanned Aerial Vehicle—A Review Study. Drones 2022, 6, 86. [Google Scholar] [CrossRef]
  16. Tamer, O.; Walter, F.; Sinapius, M.; Böl, M. A Computational Geometric Parameter Optimization of the Thermomechanical Deicing Concept. Actuators 2022, 11, 223. [Google Scholar] [CrossRef]
  17. Ding, L.; Wang, X.; Zhang, W.; Wang, S.; Zhao, J.; Li, Y. Microwave Deicing Efficiency: Study on the Difference between Microwave Frequencies and Road Structure Materials. Appl. Sci. 2018, 8, 2360. [Google Scholar] [CrossRef] [Green Version]
  18. Shi, Z.; Zhao, Y.; Ma, C.; Zhang, J. Parametric Study of Ultrasonic De-Icing Method on a Plate with Coating. Coatings 2020, 10, 631. [Google Scholar] [CrossRef]
  19. Palacios, J.; Zhu, Y.; Smith, E.; Rose, J. Ultrasonic shear and lamb wave interface stress for helicopter rotor de-icing purposes. In Proceedings of the 47th AIAA/ASME/ASCE/AHS/ASC Structures, Structural Dynamics, and Materials Conference 14th AIAA/ASME/AHS Adaptive Structures Conference, Newport, RI, USA, 1–4 May 2006. [Google Scholar]
  20. Palacios, J.L.; Smith, E.C.; Zhu, Y.; Rose, J.L.; Morrow, P. Global ultrasonic shear wave anti-icing actuator for helicopter blades. In Proceedings of the Annual Forum Proceedings-American Helicopter Society, Virginia Beach, VI, USA, 1–3 May 2007. [Google Scholar]
  21. Ameduri, S.; Brindisi, A.; Concilio, A.; Giusto, G.; Maio, L.; Memmolo, V.; Notarnicola, L.; Pellone, L.; Piscitelli, F.; Ricci, F. Design and realisation of a Wind Tunnel model for ice protection system demonstration. In Proceedings of the 2022 IEEE 9th International Workshop on Metrology for AeroSpace (MetroAeroSpace), Pisa, Italy, 27–29 June 2022. [Google Scholar]
  22. Maio, L.; Piscitelli, F.; Ameduri, S.; Brindisi, A.; Pellone, L.; Memmolo, V.; Ricci, F.; Concilio, A.; Laracca, M. On the use of smart on-board systems for aircraft ice removal. In Proceedings of the 2020 IEEE 7th International Workshop on Metrology for AeroSpace (MetroAeroSpace), Pisa, Italy, 22–24 June 2020. [Google Scholar]
  23. Crawley, E.F.; Luis, J.D. Use of Piezoelectric Actuators as Elements of Intelligent Structures. AIAA J. 1987, 25, 1373–1385. [Google Scholar] [CrossRef]
  24. Dimitriadis, E.; Fuller, C.; Rogers, C.A. Piezoelectric Actuators for Distributed Vibration Excitation of Thin Plates. J. Vib. Acoust. 1991, 113, 100–107. [Google Scholar] [CrossRef]
  25. Tinti, A.; Carallo, G.A.; Greco, A.; Romero-Sánchez, M.D.; Vertuccio, L.; Guadagno, L. Effective Practical Solutions for De-Icing of Automotive Component. Nanomaterials 2022, 12, 2979. [Google Scholar] [CrossRef] [PubMed]
  26. Meshkinzar, A.; Al-Jumaily, A.M. Cylindrical Piezoelectric PZT Transducers for Sensing and Actuation. Sensors 2023, 23, 3042. [Google Scholar] [CrossRef] [PubMed]
  27. Marshall, S.J.; Bayne, S.C.; Baier, R.; Tomsia, A.P.; Marshall, G.M. A review of adhesion science. Dent. Mater. 2010, 26, 11–16. [Google Scholar] [CrossRef] [PubMed]
  28. Packham, D.E. Surface energy, surface topography and adhesion. Int. J. Adhes. Adhes. 2003, 23, 437–448. [Google Scholar] [CrossRef] [Green Version]
  29. Martowicz, A.; Uhl, T.; Stepinski, T. Uncertainty and sensitivity analysis of electro-mechanical impedance based SHM system. IOP Conf. Ser. Mater. Sci. Eng. 2010, 10, 012207. [Google Scholar] [CrossRef]
  30. Emelyanenko, K.A.; Emelyanenko, A.M.; Boinovich, L.B. Water and Ice Adhesion to Solid Surfaces: Common and Specific, the Impact of Temperature and Surface Wettability. Coatings 2020, 10, 648. [Google Scholar] [CrossRef]
  31. Engineering ToolBox. Ice—Mechanical Properties. Available online: https://www.engineeringtoolbox.com/ice-properties-mechanical-d_2179.html (accessed on 25 July 2023).
Figure 1. Structural system of a cylindrical beam with a piezoelectric patch.
Applsci 13 09104 g001
Figure 2. Structural system of a cylindrical beam with a piezoelectric patch.
Applsci 13 09104 g002
Figure 3. Mesh details for the piezo patch and the structure below.
Applsci 13 09104 g003
Figure 5. Tasks executed by the parameterization code.
Applsci 13 09104 g005
Figure 6. FE model of a curved beam with collocated piezoelectric patches.
Applsci 13 09104 g006
Figure 7. Details of the curved beams.
Applsci 13 09104 g007
Figure 8. Test specimen with the piezoelectric ceramic transducer and the curved beam.
Applsci 13 09104 g008
Figure 9. Experimental setup (top) and relevant block diagram (bottom).
Applsci 13 09104 g009
Figure 10. The instrumented beam, showing an outer view (left), inner view (right), and layout of the piezo patches on the outer side (middle).
Applsci 13 09104 g010aApplsci 13 09104 g010b
Figure 11. Finite element model of the test specimen.
Applsci 13 09104 g011
Figure 12. First four normal modes of the test specimen.
Applsci 13 09104 g012
Figure 13. Dynamic responses with a FRF analysis of the outer and inner sensors, experimental data (red and blue), and numerical data with expanding piezo forces (solid magenta and cyan) and pin forces (dashed magenta and cyan).
Applsci 13 09104 g013
Figure 14. Comparison between the deflection for the 12 m−1 curvature, obtained with the thermal load (left) and pin forces (right).
Applsci 13 09104 g014
Figure 15. The k factor vs. the curvature.
Applsci 13 09104 g015
Figure 16. The kf factor vs. the curvature.
Applsci 13 09104 g016
Figure 17. The Fr/Ft percentage vs. the curvature.
Applsci 13 09104 g017
Figure 18. The strain transmission factor vs. the curvature.
Applsci 13 09104 g018
Figure 19. The k factor vs. the angular position of the piezoelectric patch.
Applsci 13 09104 g019
Figure 20. The k factor vs. the angular extension of the piezoelectric.
Applsci 13 09104 g020
Figure 21. Fr/Ft percentage vs. angular position of the piezoelectric.
Applsci 13 09104 g021
Figure 22. Beam axial strain over piezo free strain vs. angular extension of the piezoelectric device.
Applsci 13 09104 g022
Figure 23. The k factor’s % of deviation vs. the adhesive shear modulus.
Applsci 13 09104 g023
Figure 24. Beam axial strain over piezo free strain vs. adhesive shear modulus.
Applsci 13 09104 g024
Figure 25. Displacement results obtained for the Loctite-Hysol-9394 resin.
Applsci 13 09104 g025
Figure 26. The k fatcor vs. adhesive thickness.
Applsci 13 09104 g026
Figure 27. The k factor vs. the shear modulus of the resin.
Applsci 13 09104 g027
Figure 28. Beam axial strain over the piezo free strain vs. Γ.
Applsci 13 09104 g028
Figure 29. Finite element model of the test specimen integrated with an ice accretion.
Applsci 13 09104 g029
Figure 30. Structural solicitation and ice interface stress level compared with material yield strength and detachment threshold (top) and structure safety factor (bottom) vs. frequency.
Applsci 13 09104 g030
Table 1. Main characteristics of the model.
ParameterValue
ArcmaterialPVC
elastic modulus (GPa)2.89
Poisson ratio0.41
yield strength (MPa)52
mean line radius (mm)75
thickness (mm)2.7
piezoelectricmaterialPK-11
elastic modulus (GPa)60
Poisson ratio0.35
thickness (mm)3.0
d31 (m/V)179 × 10−12
Table 2. Curvature test cases.
Internal Radii (m)Curvature
(1/m)
Angular Position of PZT (deg)Angular Extension of PZT (deg)
0.02540.00135.0041.37
0.03033.33112.5035.04
0.03528.5796.4330.40
0.04025.0084.3826.84
0.04522.2275.0024.02
0.05020.0067.5021.74
0.05518.1861.3619.86
0.06016.6756.2518.28
0.06515.3851.9216.93
0.07014.2948.2115.76
0.07513.3345.0014.75
0.08012.5042.1913.86
0.08511.7639.7113.07
0.09011.1137.5012.36
0.09510.5335.5311.73
0.10010.0033.7511.16
0.1059.5232.1410.64
0.1109.0930.6810.17
0.1158.7029.359.74
0.1208.3328.139.34
Table 3. Positions of the piezoelectric patch.
Internal Radii
(m)
Curvature
(1/m)
Angular Position of PZT (deg)Angular Extension of PZT (deg)
0.07513.331014.75
0.07513.331514.75
0.07513.332014.75
0.07513.333014.75
0.07513.334514.75
0.07513.335014.75
0.07513.336014.75
0.07513.336514.75
0.07513.337014.75
0.07513.337514.75
0.07513.338014.75
Table 4. Angular extensions of the piezoelectric patch.
Internal Radii
(m)
Curvature
(1/m)
Angular Position of PZT (deg)Angular Extension of PZT (deg)
0.07513.334510
0.07513.334514.75
0.07513.334520
0.07513.334530
0.07513.334540
0.07513.334550
0.07513.334560
0.07513.334570
Table 5. Adhesives and properties considered for the parameterization.
AdhesiveShear Modulus
(GPa)
Young’s Modulus (GPa)Poisson’s Ratio
Loctite-Hysol-93951.5434.940.6
3M Scotch-Weld Epoxy DP4901.54.50.5
Loctite-Hysol-93941.4614.2370.45
3M Scotch-Weld Structural AF 3109-21.032.690.31
3M 22160.3420.9580.4
Table 6. Adhesives and properties considered for the parameterization.
Adhesive Thickness (μm)Internal Radii
(m)
Curvature (1/m)PZT ang. Position (deg)PZT ang. Extension (deg)
80.00.07513.334514.75
90.00.07513.334514.75
100.00.07513.334514.75
110.00.07513.334514.75
120.00.07513.334514.75
Table 7. Outcomes of the analysis of the FE model of the curved beam with two piezoelectric actuators.
Tip Radial Displacement Produced by a Unitary Thermal Load (mm)Tip Radial Displacement Produced by Unitary Tangential Pin Forces (mm)Absolute Value of the Tangential Force Applied on the Outer Piezo (N)Absolute Value of the Tangential Force Applied on the Inner Piezo (N)
3.02 × 10−86.03 × 10−717.3317.33
Table 8. Transmission factor comparison.
Transmission Factor on Curved Beam (Internal Curvature Radius: 75 mm)Transmission Factor on Flat Beam, Theoretical Value, Equation (9)
2.89 × 10−33.13 × 10−3
Table 9. Main features of the experimental setup.
BeamMaterialPVC (see Table 1)
Mean radius (mm)76.35
Thickness (mm)2.7
Width (mm)30
Angular extension (deg)90
Constraint conditionCantilevered
Piezo actuatorMaterialPK-11 (see Table 1)
Dimensions (mm)20 × 20 × 3
Piezo transducersMaterialPIC-151
Young’s modulus (GPa)15.7
g31 (Vm/N)−10.1 × 10−3
Dimensions (mm)12 × 5 × 0.3
AdhesiveMaterialAraldite 420
Thickness (mm)0.1
Density (g/cm3)1.20
Young’s modulus at 23 °C (GPa)1.5
Shear modulus at 23 °C (GPa)0.73
Poisson ratio0.33
Tensile strength at 23 °C (MPa)29
Table 10. Adhesives and properties considered for the parameterization.
AdhesiveΓShear Modulus
(GPa)
Tip Displacement—Eq. Thermal Exp
(m)
Tip Displacement—Eq. Force
(m)
kΔk
(%)
Loctite-Hysol-939528.51.543−1.50 × 10⁻⁸−6.23 × 10−80.241−7.18
3M Scotch-Weld Epoxy DP49028.11.5−1.47 × 10⁻⁸−7.30 × 10−80.202−22.07
Loctite-Hysol-939427.71.461−1.46 × 10⁻⁸−8.01 × 10−80.182−29.80
3M Scotch-Weld Structural AF 3109-223.31.03−1.35 × 10⁻⁸−1.40 × 10−70.097−62.72
3M 221613.40.342−1.18 × 10⁻⁸−3.67 × 10−70.032−87.61
No adhesiveh-−1.61 × 10⁻⁸−6.23 × 10−80.259-
Table 11. Ice properties considered for the simulation [30,31].
ParameterValue
Tensile modulus (GPa)9.1
Density (kg/m3)917
Adhesion strength on plastic material (MPa)0.2
Disclaimer/Publisher’s Note: The statements, opinions and data contained in all publications are solely those of the individual author(s) and contributor(s) and not of MDPI and/or the editor(s). MDPI and/or the editor(s) disclaim responsibility for any injury to people or property resulting from any ideas, methods, instructions or products referred to in the content.

