Article

Characterization and Degradation of Ancient Architectural Red Sandstone in a Natural Erosion Environment

School of Resource and Safety Engineering, Central South University, Changsha 410083, China
*
Author to whom correspondence should be addressed.
Appl. Sci. 2023, 13(16), 9159; https://doi.org/10.3390/app13169159
Submission received: 19 July 2023 / Revised: 6 August 2023 / Accepted: 9 August 2023 / Published: 11 August 2023

Abstract

:
The properties and appearance of ancient architectural red sandstone will be damaged after being eroded by the natural environment for a long time. In order to investigate the weathering and erosion characteristics of the red sandstone structure of an existing ancient building, ultrasonic testing techniques, combined with scanning electron microscopy (SEM), X-ray diffraction (XRD) and X-ray computed tomography (X-CT), were used to analyze a building in Ganzhou. The variation in chemical substances contained in the red sandstone specimens according to phenology was analyzed by X-ray diffraction (XRD). The characteristic parameters of the CT grayscale images of the red sandstone were extracted and combined with the ultrasonic wave velocity values to comprehensively analyze the degradation characteristics of the red sandstone specimens, and a method to characterize the degradation degree of the red sandstone as a whole plane is proposed. We use the gray model (GM (1, 1)) to predict the surface degradation degree of red sandstone specimens, and gray relation analysis (GRA) to further analyze the correlation between the characteristic parameters of CT grayscale images of red sandstone and its degradation degree. The results show that in the natural erosion environment, dolomite and chlorite are generated on the exposed surface of the red sandstone, which can protect the internal sandstone to a certain extent. The degradation degree of the red sandstone specimens in the horizontal X and Y directions varies, and the proposed method of calculating the overall plane degradation degree of the red sandstone is feasible. The minimum average relative error of the surface degradation degree obtained from the gray prediction GM (1, 1) model is 1.4591%. There is a good correlation between the characteristic parameters of the red sandstone CT grayscale images and the degradation degree.

1. Introduction

Ancient architecture is a carrier of historical and cultural information and is the mark of the inheritance of the times. As a country with a long heritage, there are many ancient buildings in China representing different times and different spiritual styles, which are the witness of our historical development and the product of ancient people’s wisdom. Furthermore, they contain rich cultural value, the value of the times and the great national spirit [1,2,3,4]. Due to the natural environment and human factors, ancient buildings have been continuously eroded and destroyed since they were built. Recognizing that, today, protection of ancient buildings is carried out worldwide, as well as ensuring they are restored, reinforced and internally renewed. Due to the uniqueness of ancient buildings, there is a requirement that the protective efforts are compatible with appearance—structure, shape, volume, color and height—of the object under protection. Where necessary, the renovation of its exterior appearance, internal structural system, functional layout, interior decoration and damaged parts should be strictly based on the original, and for completely collapsed historical buildings, the site can be selected for restoration according to the actual functional use [5,6,7].
The red appearance of red sandstone is suited to China culture and is easy to mine, making it a common material for ancient buildings. However, red sandstone has high porosity, low strength and poor durability, making it more susceptible to erosion and damage from the natural environment than the materials used to construct other types of ancient buildings [8,9,10,11]. Most of the current studies on the characteristics of red sandstone have focused on the compressive strength, water content and damage characteristics of red sandstone, and most of the research methods are similar to those for other rocks.
Some scholars studied the properties of red sandstone via physical destructive experiments. For example, Jiang J et al. [12] took a section of red sandstone embankment as the object of study and prepared ten specimens for large-scale field shear tests to obtain thrust–displacement curves, damage modes and shear strength parameters for different moisture contents, compaction degrees and grain size distributions. Dong Z et al. [13] conducted thermal shock tests on red sandstone at different temperatures and numbers of cycles and systematically investigated its surface properties including color and roughness. The study showed that the apparent color of red sandstone is related to the chemical substances it contains, and oxidation of iron will make the sandstone red, while migration of calcium carbonate will make the sandstone white. Kim, E et al. [14] investigated the effect of different loading rates and water saturation on the fragmentation and energy absorption of red sandstone rocks with different pore sizes using dynamic compressive testing; the results showed that the surface red sandstone rock fragments sizes generally decreased with the increase in loading rate and water content. N. N. Sirdesai et al. [15] studied the law of change in the strength of red sandstone under different heat treatment conditions by preparing specimens and controlling the time and temperature of the heat treatment of red sandstone, and the results showed that surface heat treatment led to expansion of the minerals caused by changes in the pre-existing pores and microcracks and led to changes in the strength of the red sandstone. Yang Y et al. [16] investigated the dynamic mechanical properties of red sandstone at low temperatures by means of the Split Hopkinson Pressure Bar (SHPB) dynamic impact test. The effects of different low temperatures on the dynamic strength, damage variables and energy dissipation of red sandstone were analyzed based on damage and energy theory. The deterioration mechanism of dynamic mechanical strength of red sandstone at low temperatures was inferred by combining fracture morphology analysis. Guo S et al. [17] investigated the creep properties and damage mechanism of red sandstone at different water contents, studied the uniaxial creep of muddy red sandstone in dry and saturated conditions, and observed the samples using scanning electron microscopy. The mechanism of creep variation in muddy red sandstone with different water contents was studied from a microscopic point of view.
Some scholars have combined experimental and numerical simulations to conduct micro-destructive experimental studies. Khanlari, G et al. [18] conducted freeze–thaw cycling tests on red sandstone in the southwestern Qom province in central Iran to determine the ultrasonic velocity, porosity, and uniaxial compressive strength of cyclic specimens, and assessed the effect of freeze–thaw cycling on the durability of the red sandstone by using a decay function model; it was found that the distribution of the pore sizes plays a major role in the sandstone’s resistance to freezing and thawing cycles. Meng W et al. [19] used the X-ray diffraction technique and simultaneous analysis of infrared thermography to study the characteristics of red sandstone after heat treatment in terms of its stress–strain curve, deformation and damage forms, and found the temperature threshold for the change in damage forms of red sandstone. Jiang H et al. [20] studied the permeability and damage characteristics of red sandstone under the impact of hot and cold cycles, and further developed a permeability model for red sandstone based on statistical damage theory, which can be used for damage assessment, repair and strengthening of bridges. Zhang X et al. [21] investigated the damage characteristics of red sandstone and limestone through experimental tests and numerical simulations, and analyzed the damage characteristics and patterns of red sandstone and limestone through a combination of surface damage conditions, internal damage states and crack distribution. In addition to this, a number of scholars have also used some image processing methods to analyze the fractures, cracks and pores of red sandstone from a microscopic perspective. Liu Q et al. [22] used acoustic emission, scanning electron microscopy and differential thermal analysis–thermogravimetric analysis to analyze the microcrack development and particle quality changes after each cyclic heating and cooling, to study the change pattern of sandstone properties under cyclic heating condition.
With the development of non-destructive testing technology, the technique has been more and more widely used in rock research. W. Zhang et al. [23] used CT scanning and 3D reconstruction techniques to observe the internal crack state of red sandstone, and simulated the rock internal and external crack extension evolution using the PFC3D homogenization simulation model. H. Zhang et al. [24] used SEM and polarizing light microscopy (PLM) techniques to obtain pore photographs of red sandstone to explain the process of microstructure changes, especially the effect of temperature on pore characteristics and grain morphology distribution. Zhu Q et al. [25] obtained a red sandstone pore characteristics map using the scanning electron microscopy method and extracted the key parameters for evaluating fractal permeability, such as curvature fractal dimension, pore area fractal dimension and maximum pore area, from the segmented images using the image enhancement technique. Niu C et al. [26] measured the changes in the microstructure of red sandstone specimens after freeze–thaw cycles using the nuclear magnetic resonance (NMR) technique to study the change patterns of defects such as fracture surfaces and porosity.
Studies on the durability and degradation of sandstones by erosion have been continuously carried out due to their high porosity, low strength and poor durability. Ghobadi, MH et al. [27] investigated the effects of freeze–thaw (F-T) and salt crystallization (S-C) phenomena on the strength and durability of sandstones in the upper red strata by testing the variation in ultrasonic velocity (V (p)), weight loss (%) and point load index. Xu, HY et al. [28] studied the properties of fully weathered coastal red sandstone by predicting the shear strength of fully weathered red sandstone from in situ measured physical property parameters such as water content, fines content and relative compaction. M. Ludovico-Marques et al. [29] tested the compressive mechanical properties of different historical building sandstones in Portugal, demonstrating the central role of porosity in the compressive behavior of redundant sandstones, and developed an analytical model for predicting the compressive behavior based on the porosity of building stones. Amer, A et al. [30] used XRD and XRF methods to analyze in detail the petrography of red sandstones in the sedimentary environment of northern Kuwait, to study the variation pattern of the material contained in the sandstones in different parts.
In summary, for ascertain the current physical properties, durability and damage change law of red sandstone, a large number of studies have been conducted, mainly focusing on the environmental resistance of red sandstone, such as freeze–thaw cycles, hot and cold cycles, high temperature loading and so on. These have been investigated by way of experiments to study red sandstone in different environments, its performance and the damage change law. However, there is less research on the degradation of red sandstone under natural environmental erosion, especially on the red sandstone of existing ancient buildings. To address the degradation degree and characteristics of red sandstone for existing ancient buildings, we consider Qili ancient town and use samples of red sandstone from its ancient buildings to analyze the chemical mineral composition, weathering and corrosion degree. Since sampling is also a kind of damage to ancient buildings, we obtained specimens from the ancient wharf constructed at the same time as the local ancient building complex, which is more than 800 years old, and then used nondestructive testing methods, such as ultrasonar, SEM, XRD, and X-CT, to test the physicochemical properties of the red sandstone specimens. The characteristics of the degradation degree in different directions were analyzed using the characteristic parameters of the gray distribution map of the CT image, and an overall plane degradation degree was defined. Using the optimal GM (1, 1) gray model, we made a simulation prediction of the surface degradation degree using the overall plane degradation degree as the input, and the correlation between the overall plane degradation degree and the characteristic parameters of the gray distribution map of the CT image was investigated using the gray correlation analysis method.

2. Materials and Methods

2.1. Materials

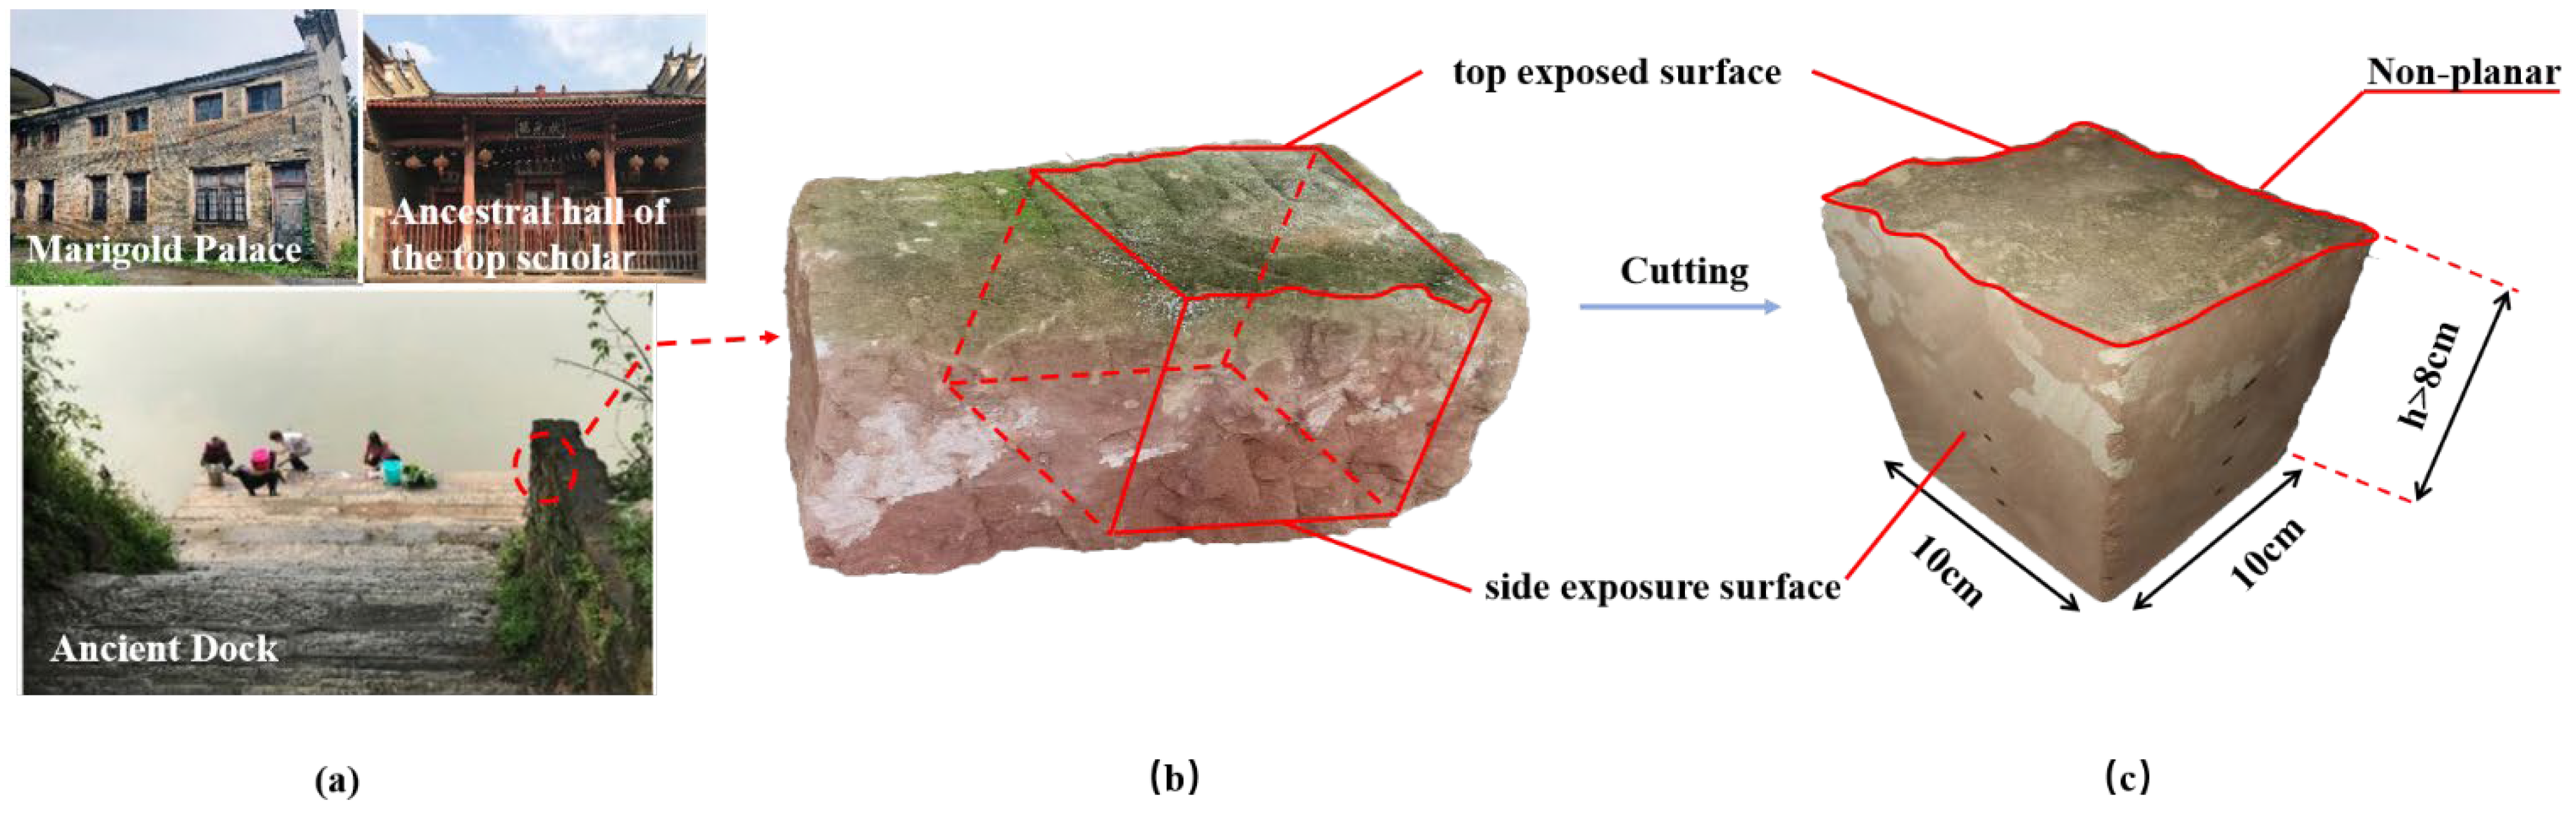
2.1.1. Background of the Project

The Qili Ancient Town Historical and Cultural Neighborhood is located in Shuitong Town, Ganzhou City, with a history of more than 800 years. In 1997, the People’s Government of Ganzhou City declared Qili town historical district to be a historical and cultural protection zone, and in 2002, the “Ganzhou Historical and Cultural City Protection Plan” identified Qili ancient town as one of the eight historical and cultural protection zones for the protection of ancient cities in Ganzhou City. Qili ancient town has been famous since ancient times, and it brings together the cultures and colors of many eras. Among them, porcelain kiln culture, religious temple culture, red culture and trade culture are inherited and carried forward here, with beautiful scenery, a rich humanistic atmosphere and many ancient architectural relics. In order to give full play to the tourism resources of Qili ancient town, there is a project underway to repair, improve and protect some of the ancient buildings. Because red sandstone is easy to mine and its red appearance fits in with Chinese culture, most of the historical sites and ancient building structures in the ancient town of Qili are mainly made of red sandstone. However, red sandstone has high porosity, low strength and poor durability, and it will degrade under natural environmental erosion, leading to structural instability and damage to the appearance of ancient buildings. Therefore, the degradation degree and characteristics of the existing red sandstone need to be studied to determine the degradation status of the red sandstone and provide a reference for the subsequent conservation work.

2.1.2. Material Preparation

A piece of red sandstone structure weathered and corroded under natural conditions was taken from the site of Qili ancient town, and a prismatic square red sandstone specimen S of 10 cm × 10 cm × h (10 cm > h > 8 cm) was processed for subsequent testing. The location of the red sandstone specimen acquisition and the cutting effect are shown in Figure 1. The specimen was taken from an ancient pier built at the same time as the Marigold Palace and the ancestral hall of the top scholar, more than 800 years ago.

2.2. Detection Methods
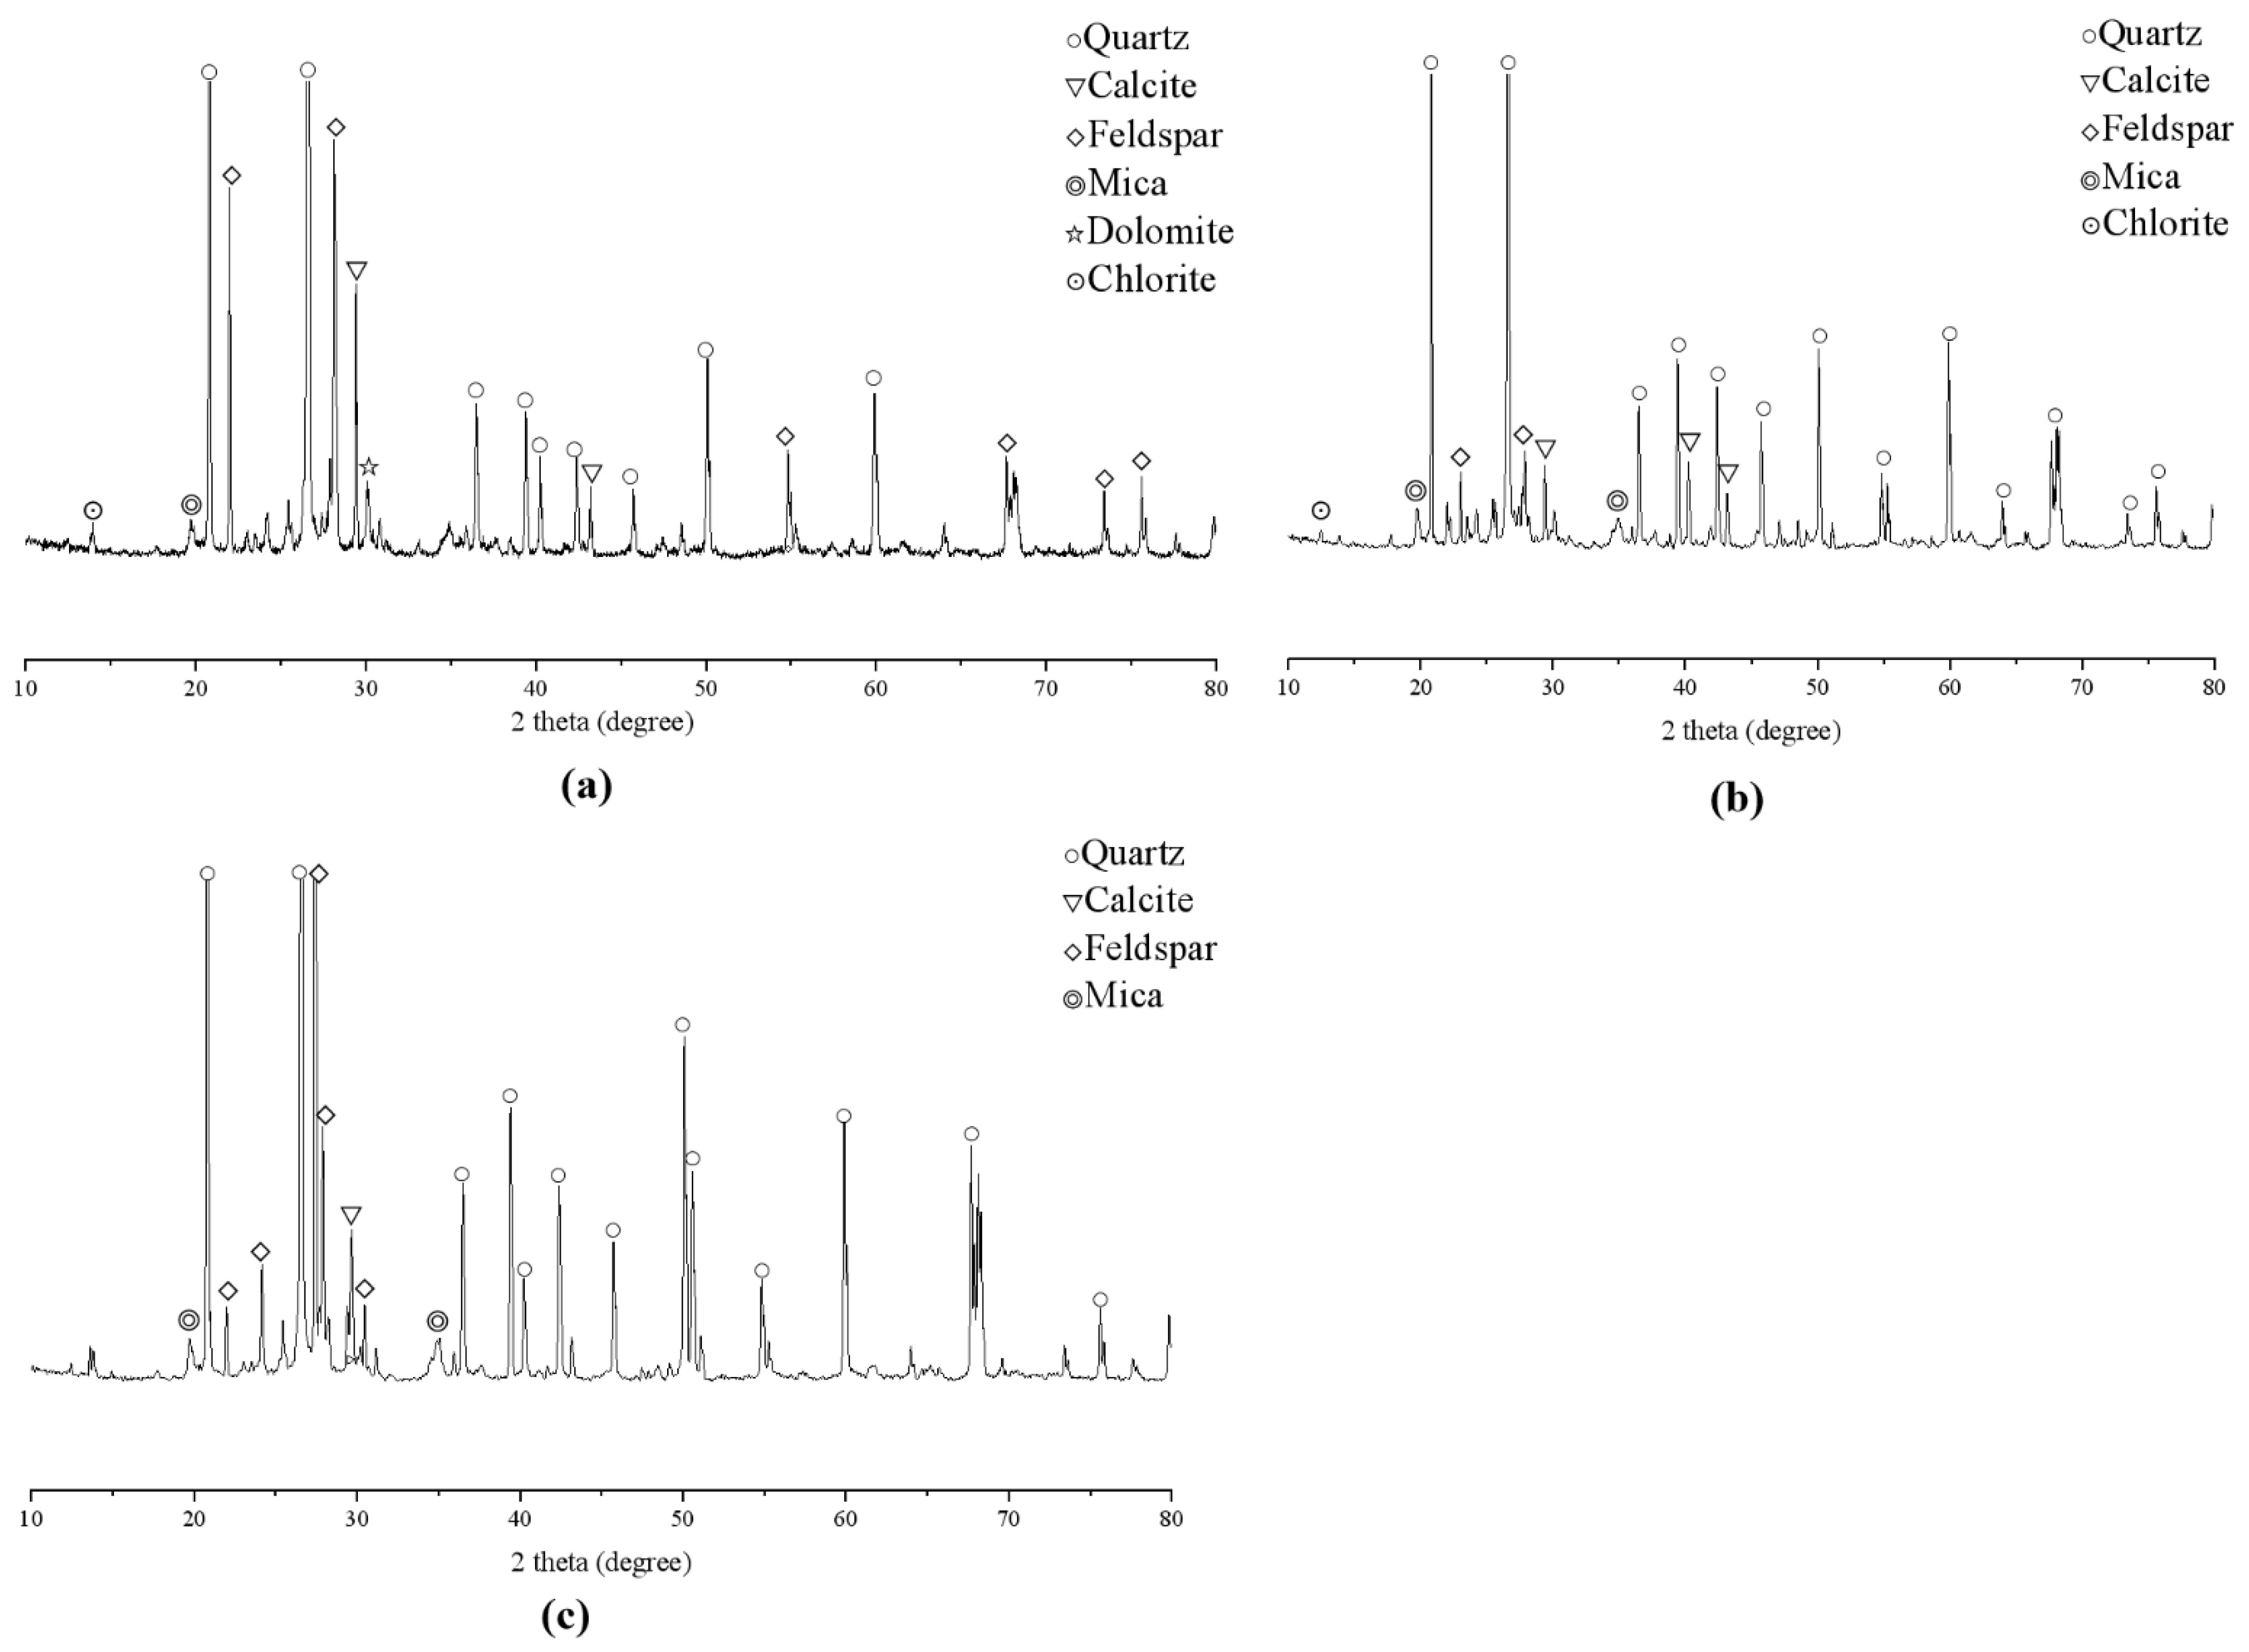
In order to comprehensively analyze the change pattern of the degree of degradation in the red sandstone test with the depth direction, and to study the characteristics of the degree of degradation in the horizontal direction and its possible patterns, we performed SEM, XRD, X-CT scanning and ultrasonic testing on specimen S to determine the changes in some physical and chemical properties of the red sandstone specimens at different levels, and to quantify the degradation degree of the red sandstone building structure in the field. Comprehensive analysis of the degradation degree of red sandstone specimens was conducted by combining image processing and ultrasonic wave values. Specifically, we carried out X-CT scanning of specimen S as a whole, SEM observation and XRD physical phase analysis of the surface corrosion layer, the bottom weakly weathered and slightly weathered layer parts of specimen S, and ultrasonic velocity detection of specimen S from different directions in layers and points.

2.2.1. SEM and XRD

SEM analysis was performed using scanning electron microscope model JSM-IT500LV of Changsha Mining and Metallurgy Institute Testing Company, with images acquired at 20 kV and 40 uA current, a working distance of generally 10 mm and image magnification from ×5 to ×300,000. XRD physical phase analysis was performed using X-ray diffractometer model D8 ADVANCEX of Changsha Mining and Metallurgy Institute Testing Company, with a WANT detector, better than 25% resolution, minimum step size of 0.0001 and maximum output power of 3 kW.

2.2.2. Ultrasonic Testing

Ultrasonic testing was conducted using the instrument HS-CS1H ultrasonic parameters tester, using a pair of measurement methods for ultrasonic velocity measurement, with the probe diameter of 2 cm and frequency of 1 MHz.
As shown in Figure 2, when conducting ultrasonic testing of red sandstone specimens, the side of the specimen is divided into two directional axes X and Y. Since the height of the top surface of specimen S varies in slope, the direction of the slope of the top surface of specimen S is designated as the X-axis, and the other direction is designated as the Y-axis. Four pairs of measurement points are distributed at equal intervals of 2 cm from the bottom up on the X-axis. Five pairs of measurement points are distributed at equal intervals from the bottom up on the X-axis, numbered x1 to x5, and the fifth measurement point cannot be detected. Five pairs of measurement points on the Y-axis were numbered from y1 to y5, and each pair of measurement points was measured in five groups, with three data in each group and the average value taken as the study data. The five pairs of measurement points corresponded to heights of 2, 4, 6, 8, and 10 cm, and the measurement point levels were L1 to L5.

2.2.3. X-CT Scanning

The CT scanner model inspeXio SMX-225CT from Shenzhen Vision Technology was used for the X-ray scan, with a maximum tube current of 1000 μA, a maximum tube voltage of 225 kV, a resolution of 0.4089922 mm, and 384 voxels. The results were sliced and reconstructed using visualization software to investigate the grayscale distribution of different layers.

2.3. Theoretical Basics

2.3.1. GM (1, 1) Gray Prediction Model

Gray theoretical models can be used to make fuzzy descriptions of the development pattern of things by building gray differential prediction models with a small amount of incomplete information. They use cumulative techniques to reduce the randomness of the dataset and thus increase the regularity of the system, and they are mostly used to make predictions on small data samples [31,32,33,34,35]. This is a first-order differential equation model with a single input variable, which overcomes the limitations of traditional methods and is thus suitable for the analysis of small data samples. In this study, due to the proposed buffer operator, the simulation and prediction accuracy of the GM (1, 1) model was improved, and four basic forms of GM (1, 1) model were formed, which are defined as follows:
Set the original sequence as:
X ( 0 ) = x 0 1 , x 0 2 , , x 0 n
Generate 1-AGO sequences:
X ( 1 ) = x 1 1 , x 1 2 , , x 1 n
where x 1 k = i = 1 k x 0 i , k = 1, 2, …, n
x ( 0 ) + a x 1 k = b
Equation (3) is the original form of GM (1, 1), where a is called the developmental coefficient response to the developmental dynamics of the behavior series estimates, and b is the amount of gray action, which reflects the relationship of data change. The original form of GM (1, 1) is in fact a difference equation, where the a and b parameter vectors a ^ = a b can be obtained using the least squares method
a ^ = B T B 1 B T Y
where B and y n , respectively, are calculated as follows:
B = x 1 ( 2 ) 1 x 1 ( 3 ) 1 x 1 ( n ) 1 ,   Y = x 0 2 x 0 3 x 0 n
Different GM (1, 1) models are obtained by using different solutions of the difference equation as the time–response equation, and the different time–response equations are shown as follows:
Time–response equation for the EGM model:
x ^ 1 k = x 0 1 b a e a k 1 + b a ;         k = 1 , 2 , , n
Time–response equation of the ODGM model:
x ^ 1 k = x 0 1 b a 1 1 + a k + b a
Time–response equation of the EDGM model:
x ^ 1 k = x 0 1 b a 1 0.5 a 1 + 0.5 a k + b a
Time–response equation of the DGM model:
x ^ 1 k = x 0 1 β 2 1 β 1 β 1 k + β 2 1 β 1
of which β 1 and β 2 , the parameter vectors of β ^ = β 1 β 2 , are similar to the estimators of (12), where B and Y are, respectively:
B = x 1 ( 1 ) 1 x 1 ( 2 ) 1 x 1 ( n 1 ) 1 ,   Y = x 1 2 x 1 3 x 1 n
The method is applicable to small data samples and the average relative error of the prediction effect can be obtained.

2.3.2. The Absolute Gray Correlation

The absolute gray correlation is a gray correlation analysis model defined based on the global perspective. The absolute gray correlation is analyzed according to the development trend, so there is no excessive requirement for the number of samples and no need for typical distribution laws. Its specific calculation process is as follows:
Step 1: Set system behavior data sequences:
X i = x i 1 , x i 2 , x i n         X j = x j 1 , x j 2 , x j n
Step 2: Calculate the zeroing of the starting point. For system sequence X i = x i 1 , x i 2 , x i n , its start-point zeroing value is x i 0 k = x i k x i 1 , so the resulting sequence of start-point zeroing is:
X i 0 = x i 0 1 , x i 0 2 , , x i 0 n   X j 0 = x j 0 1 , x j 0 2 , , x j 0 n
Step 3: Calculate the correlation degree order:
S i = 1 n X i 0 d t ,   S j = 1 n X j 0 d t ,   S i S j = 1 n X i 0 X j 0 d t
Then, the gray absolute correlation ε i j of the two series is said to be:
ε i j = 1 + S i + S i 1 + S i + S i + S i S j
Gray correlation analysis can measure the degree of association of factors between two systems based on the degree of similarity or dissimilarity of trends between the factors.

3. Analysis of Results

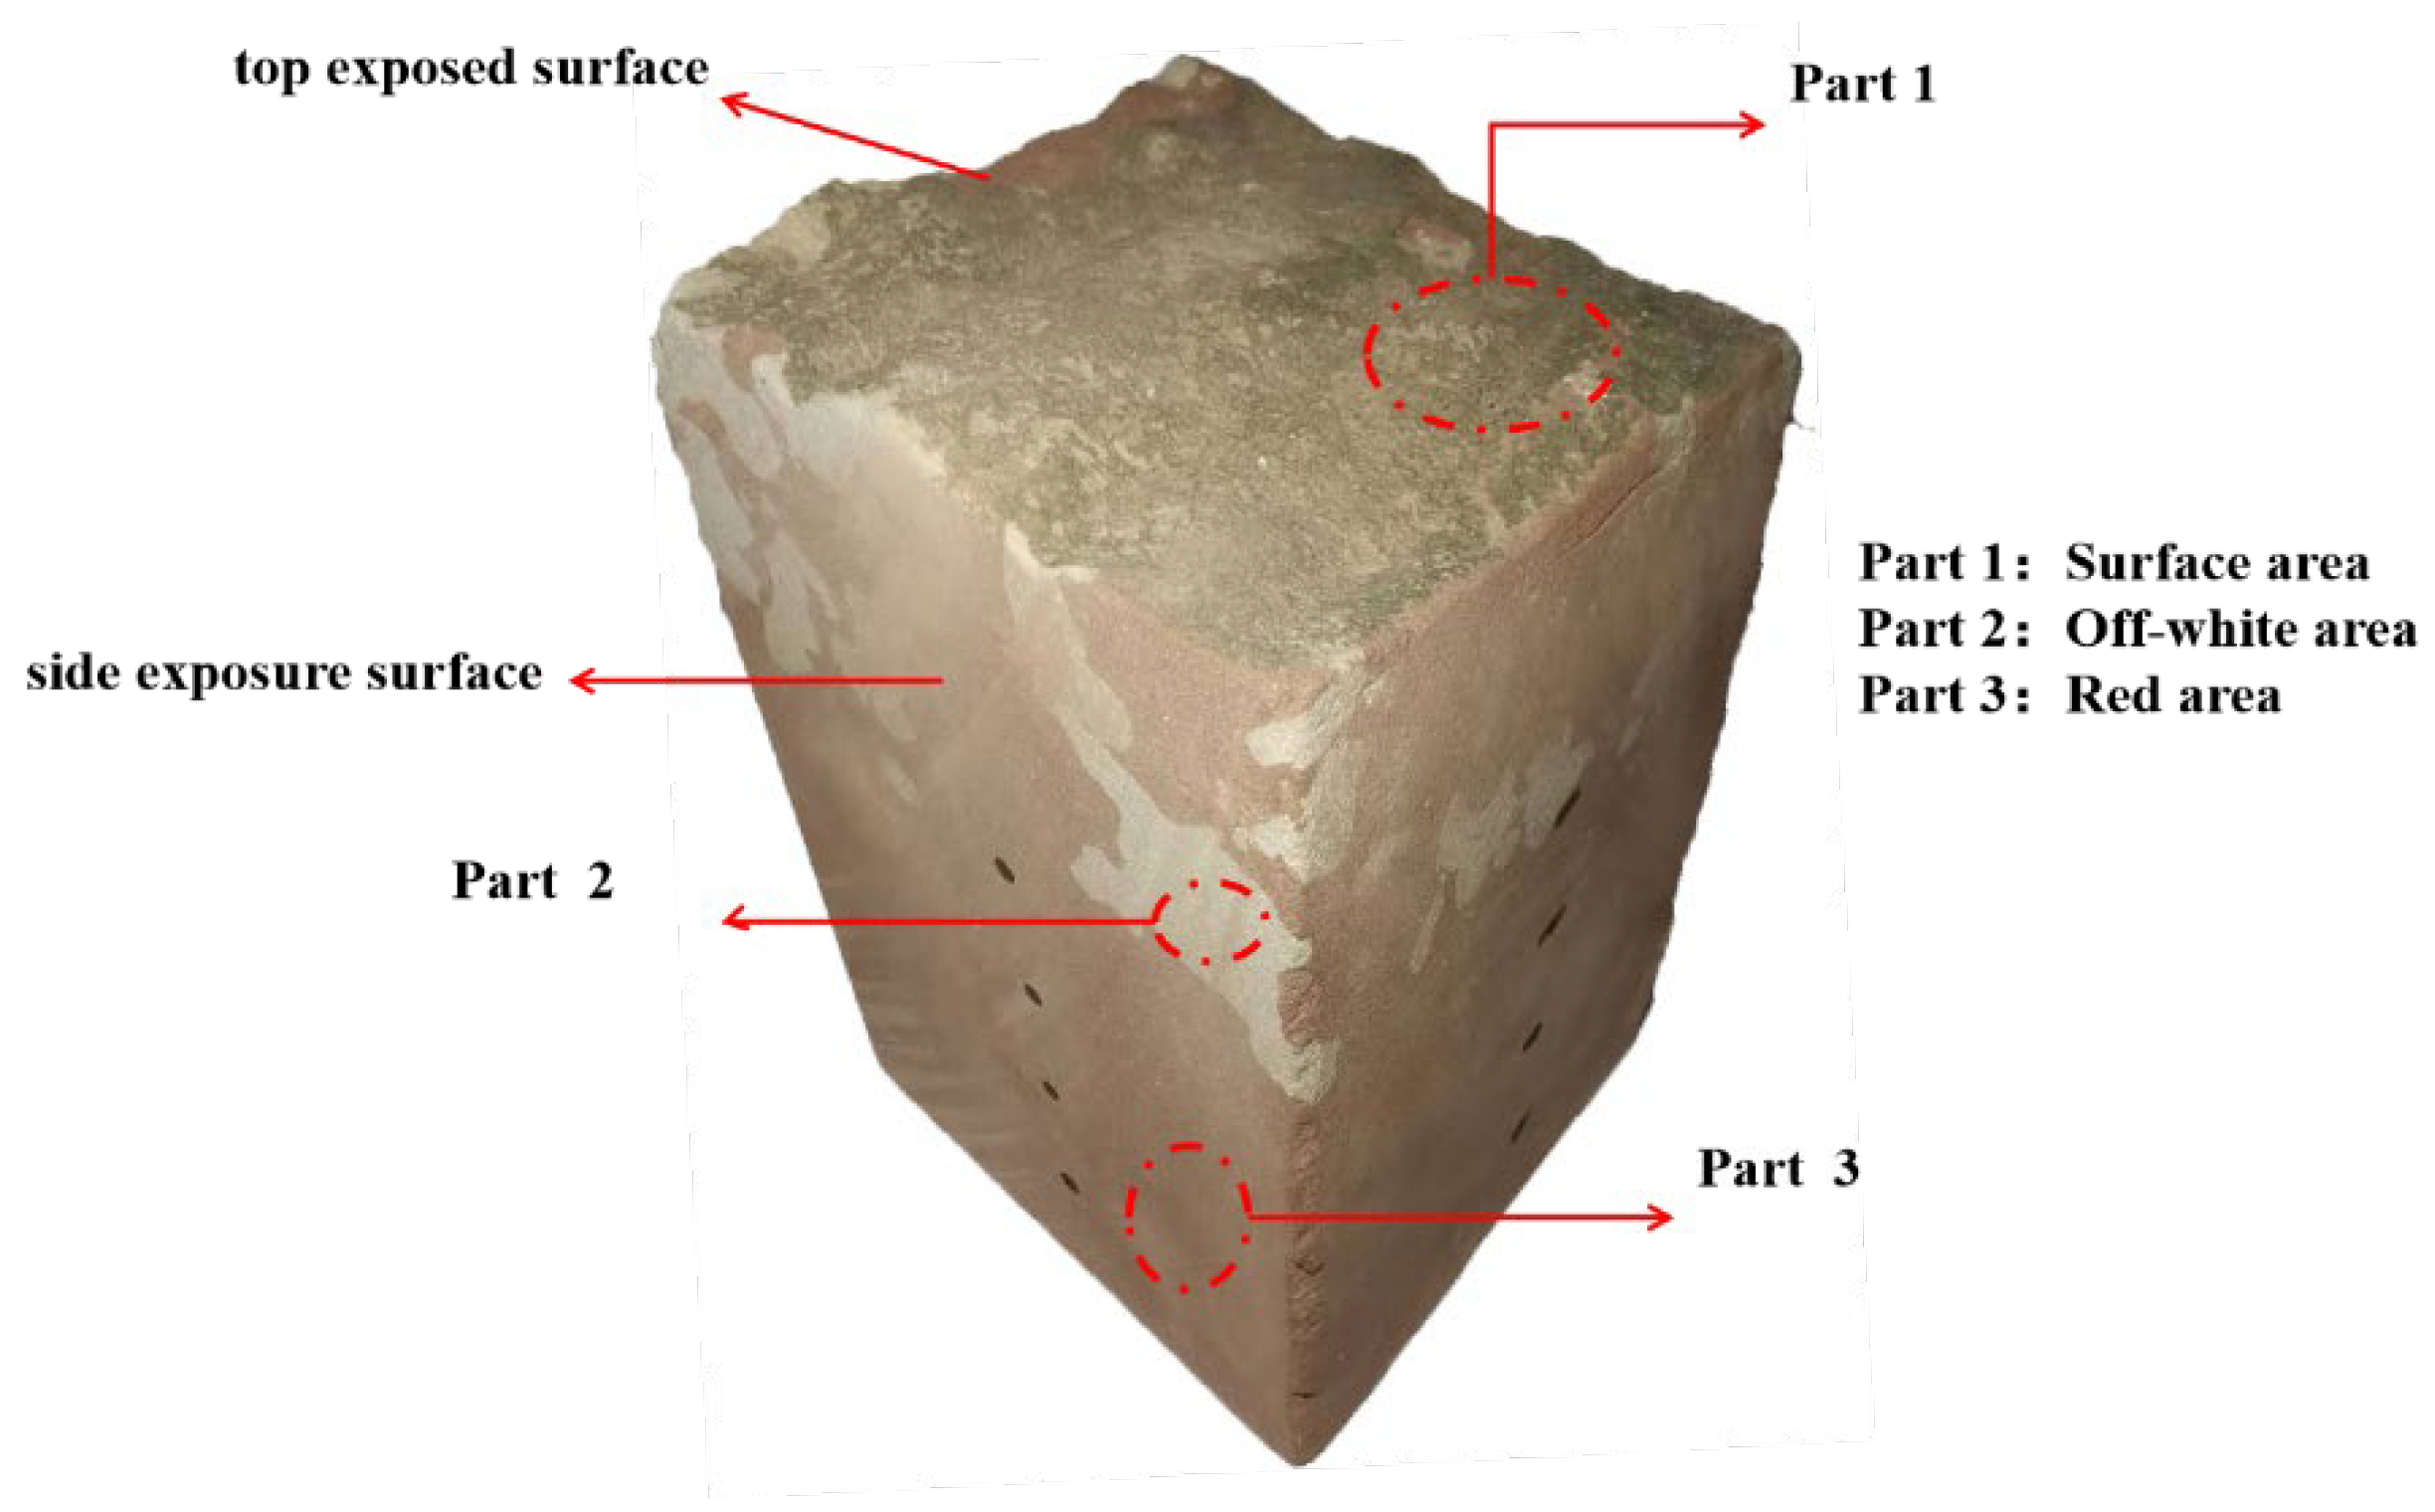
3.1. Microscopic Inspection and Analysis of Red Sandstone Specimens

As shown in Figure 1b, according to the apparent characteristics of the red sandstone blocks sampled in the field, it can be seen that, within a certain thickness range, the red sandstone blocks can be roughly divided into three major areas, which are characterized by: the surface weathering and corrosion layer of greenish-green, containing mosses and rock debris; the intermediate layer of red and white mixed, with greater material changes and differences; and the bottom layer of the performance of the reddish-brown darker color. In the latter, we noted the appearance of characteristics that are more consistent because the location deeper, meaning it only receives small environmental impacts. Accordingly, it can be considered that this layer is in the initial stage of unweathering. In order to understand the microscopic characteristics of the red sandstone in different areas, SEM microscopic examination and XRD physical phase analysis were carried out in the above three different areas. The sampling parts are shown in Figure 3.
Among them, Figure 4 shows the analytical results of XRD physical phase analysis, and Figure 5 shows the microelectron microscopy diagrams of Part 1 to Part 3. According to the results of SEM micro-detection as well as XRD physical phase analysis, the main substances and micro-distribution status of Part 1~Part 3 were statistically analyzed, and the statistical results are shown in Table 1.
It was determined that Part 1 is the exposed region in S specimen; its microstructure has a dissolved flocculent distribution, and the cracks and pores are distributed in a messy way. The substances contained in Part 3 have more chlorite and dolomite compared to Part 2, as shown in Figure 4a and Figure 5a. Part 2 is the gray-white region in the S specimen; its microstructure is slightly broken and messy compared to Part 3, and relatively complete compared to Part 1. In the ×1000-fold structure, the basal grain structure is found to be slightly corroded and degraded, and it contains more dolomite compared to Part 3, as shown in Figure 4b and Figure 5b. Part 3 is the reddish sandstone red region in the S specimen, which is located in a deeper area, furthest away from the surface, and it is the part with the smallest degradation degree. The particulate structure in this area is angular, without significant cracks, fissures and other defects, and the materials contained are mostly quartz, calcite, feldspar and mica, as shown in Figure 4c and Figure 5c.
From the microstructure of the three, we determined that the structural integrity of Part 1~Part 3 increases in order, and the material of Part 1 and Part 2 changes on the basis of Part 3. Where Part 1 is the exposed surface of the specimen, the original sandy particulate structure has been in external contact with acid rain, carbonation and other environmental and anthropogenic factors, resulting in weathering and corrosion autogenous formation of chlorite material. Chlorite is a silicate mineral, commonly found in iron, that appeared in a magnesium-rich ancient water media environment. A sandstone surface layer of chlorite forms early to fill the sandstone pore space, occupy the structure of the open pore channel, improve the non-homogeneity of the channel, block the internal minerals and the outside-world contact, reduce the cementing effect and reduce the permeability, and thus, to a certain extent, play a role in protecting the internal deep sandstone structure. From the viewpoint of material changes and microscopic fissure development, degradation is accompanied by the development of defects such as cracks, fissures and holes, as well as the transformation and generation of new materials. The deeper red sandstone has less contact with acid rain, sulfide and other erosive materials, its material changes and pores and cracks are less, and the degradation degree is smaller. Therefore, the degree of surface degradation of red sandstone specimens is larger than the degree of internal degradation, and it is related to the depth.

3.2. Analysis of Properties of Red Sandstone Specimens with Different Orientations

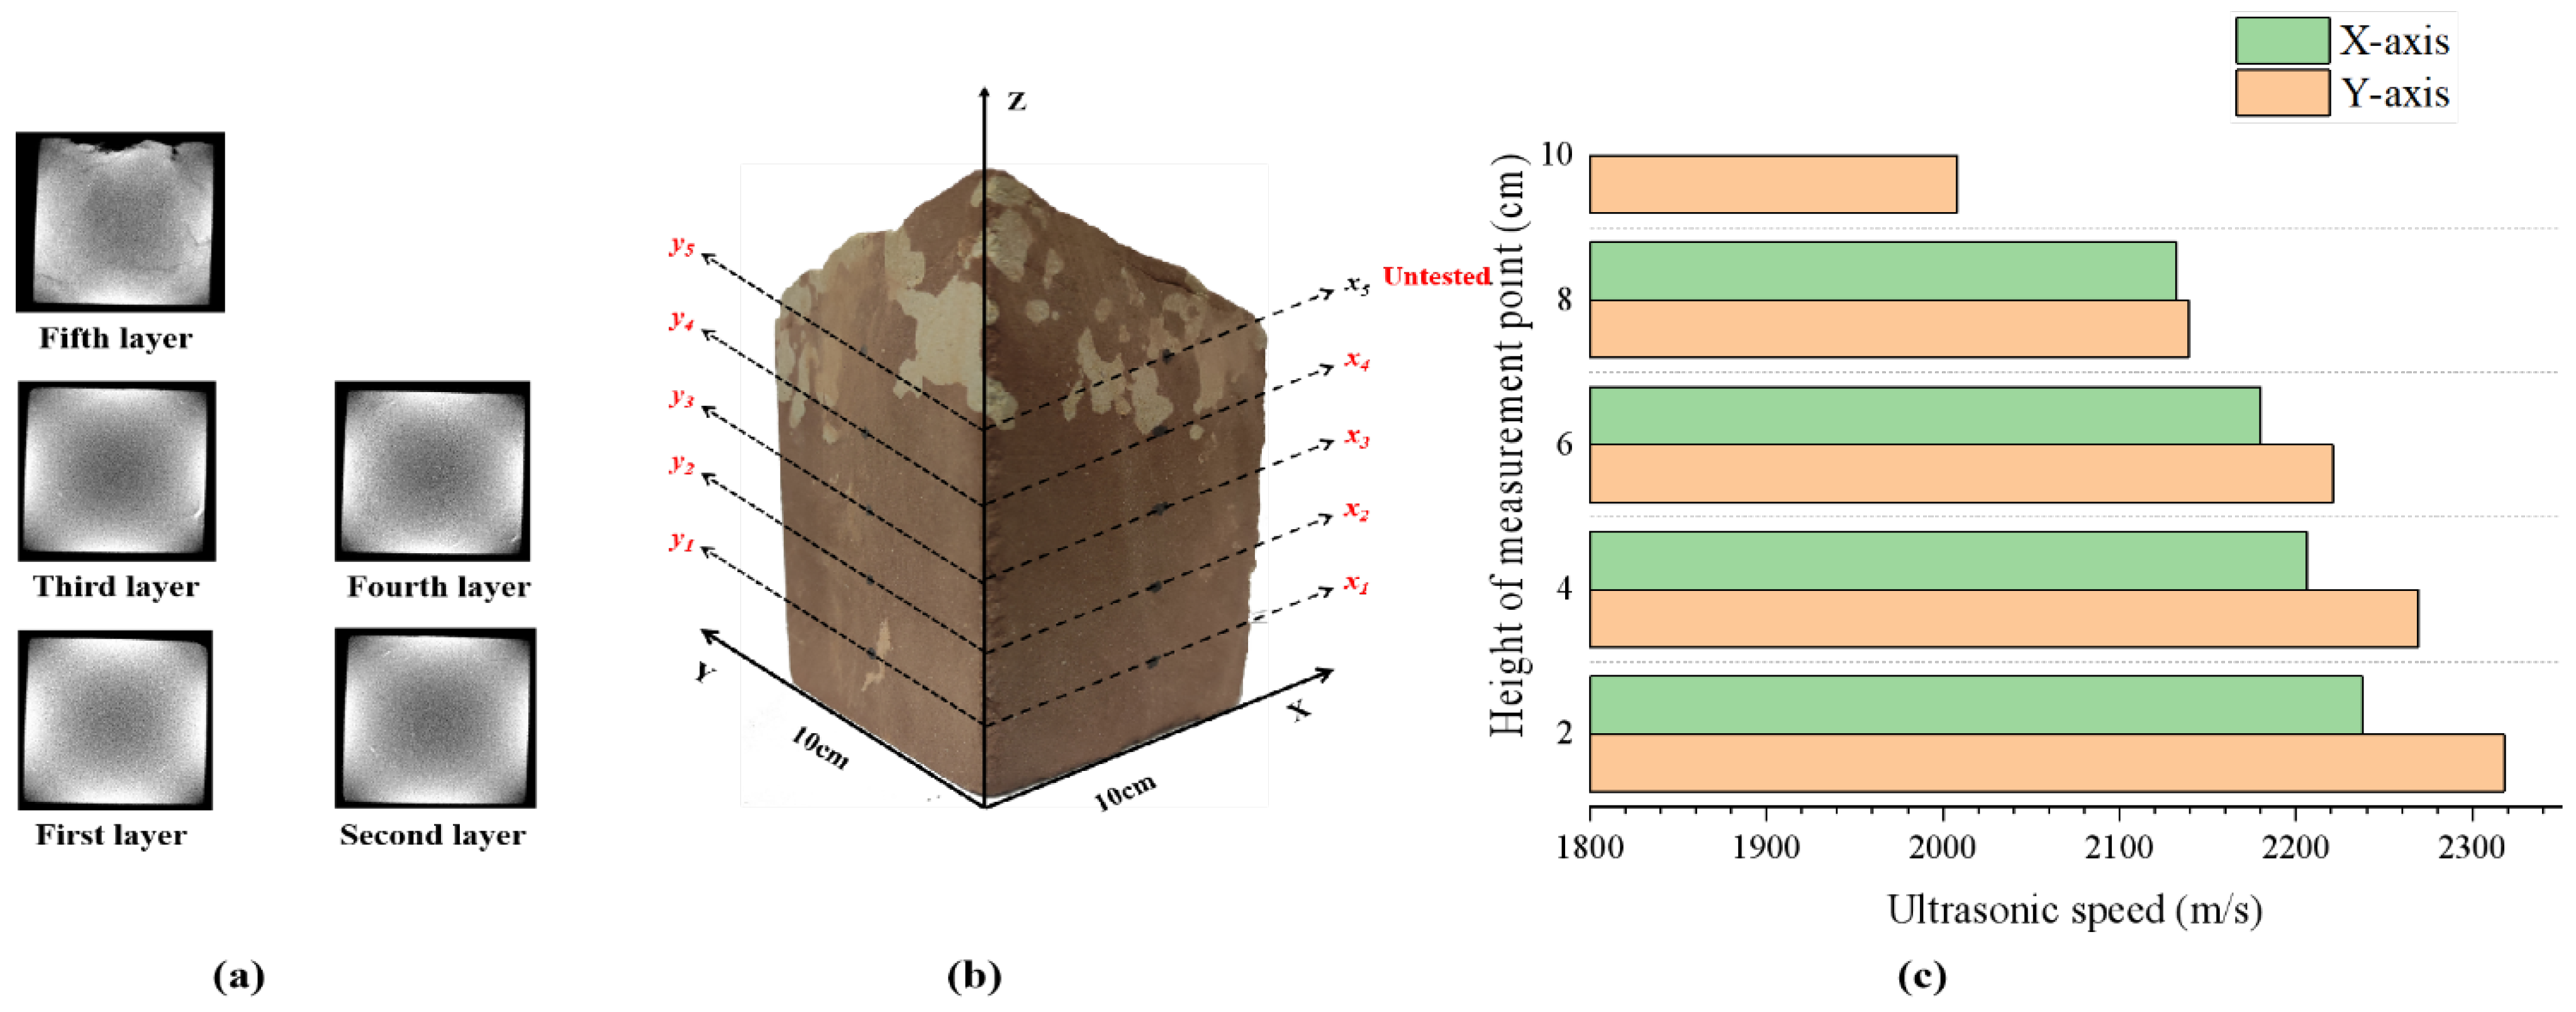
3.2.1. Ultrasonic Characterization of Red Sandstone Specimens

Ultrasonic testing results found that the ultrasonic wave velocity values of the red sandstone specimens on the X- and Y-axes decreased with the rise in the measurement point height, in which the ultrasonic wave velocity of the red sandstone specimens from the L1 layer to the L5 layer in the Y-axis direction decreased by 13.37%, and from the L1 layer to the L4 layer in the X-axis direction decreased by 4.74%. However, the ultrasonic wave velocity value in the Y-axis direction is always greater than that in the X-axis direction at the same layer, and the difference between the ultrasonic wave velocity values in the X- and Y-axis directions gradually decreases from the L1 to L4 layers. The difference between the ultrasonic wave velocity values in the two directions is 80 m/s at the L1 layer and 7 m/s at the L4 layer, as shown in Figure 6c. This shows that there is a difference in the erosion of red sandstone in the horizontal direction, and the deeper the location, the greater the difference. While ultrasonic waves can be used to define the degree of degradation, it is generally believed that the smaller the value of ultrasonic wave speed, the greater the degree of degradation, so it is considered that the degree of degradation in the X-axis direction is greater than the degree of degradation in the Y-axis direction at the same level. In order to verify the existence of the variability, we made the following use of the CT grayscale image of the red sandstone specimen for analysis.

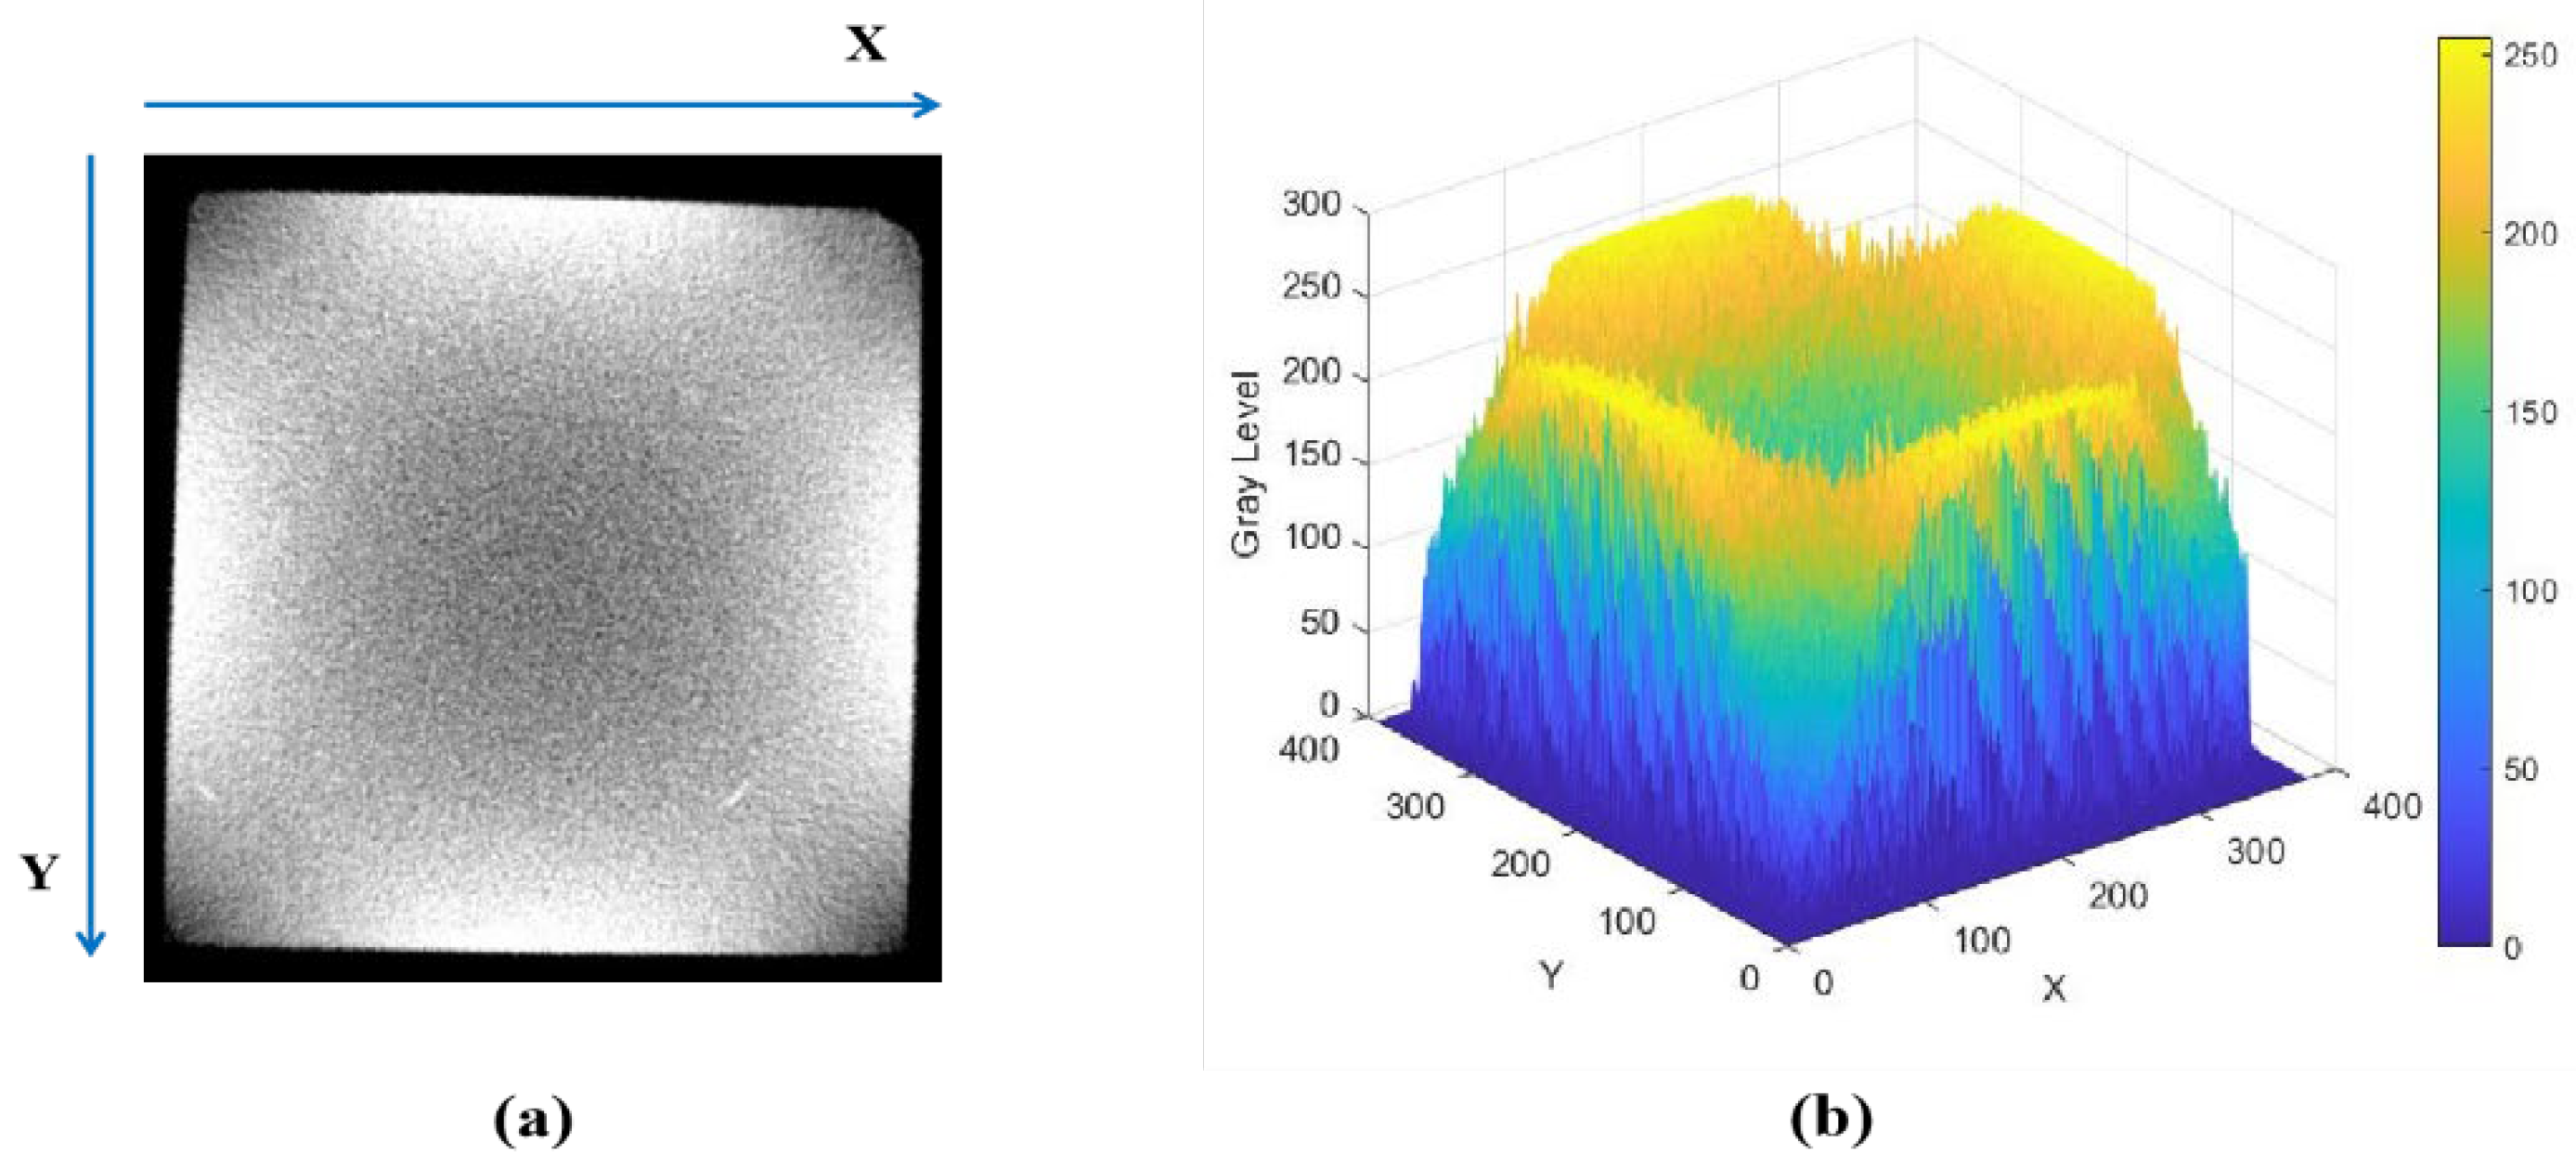
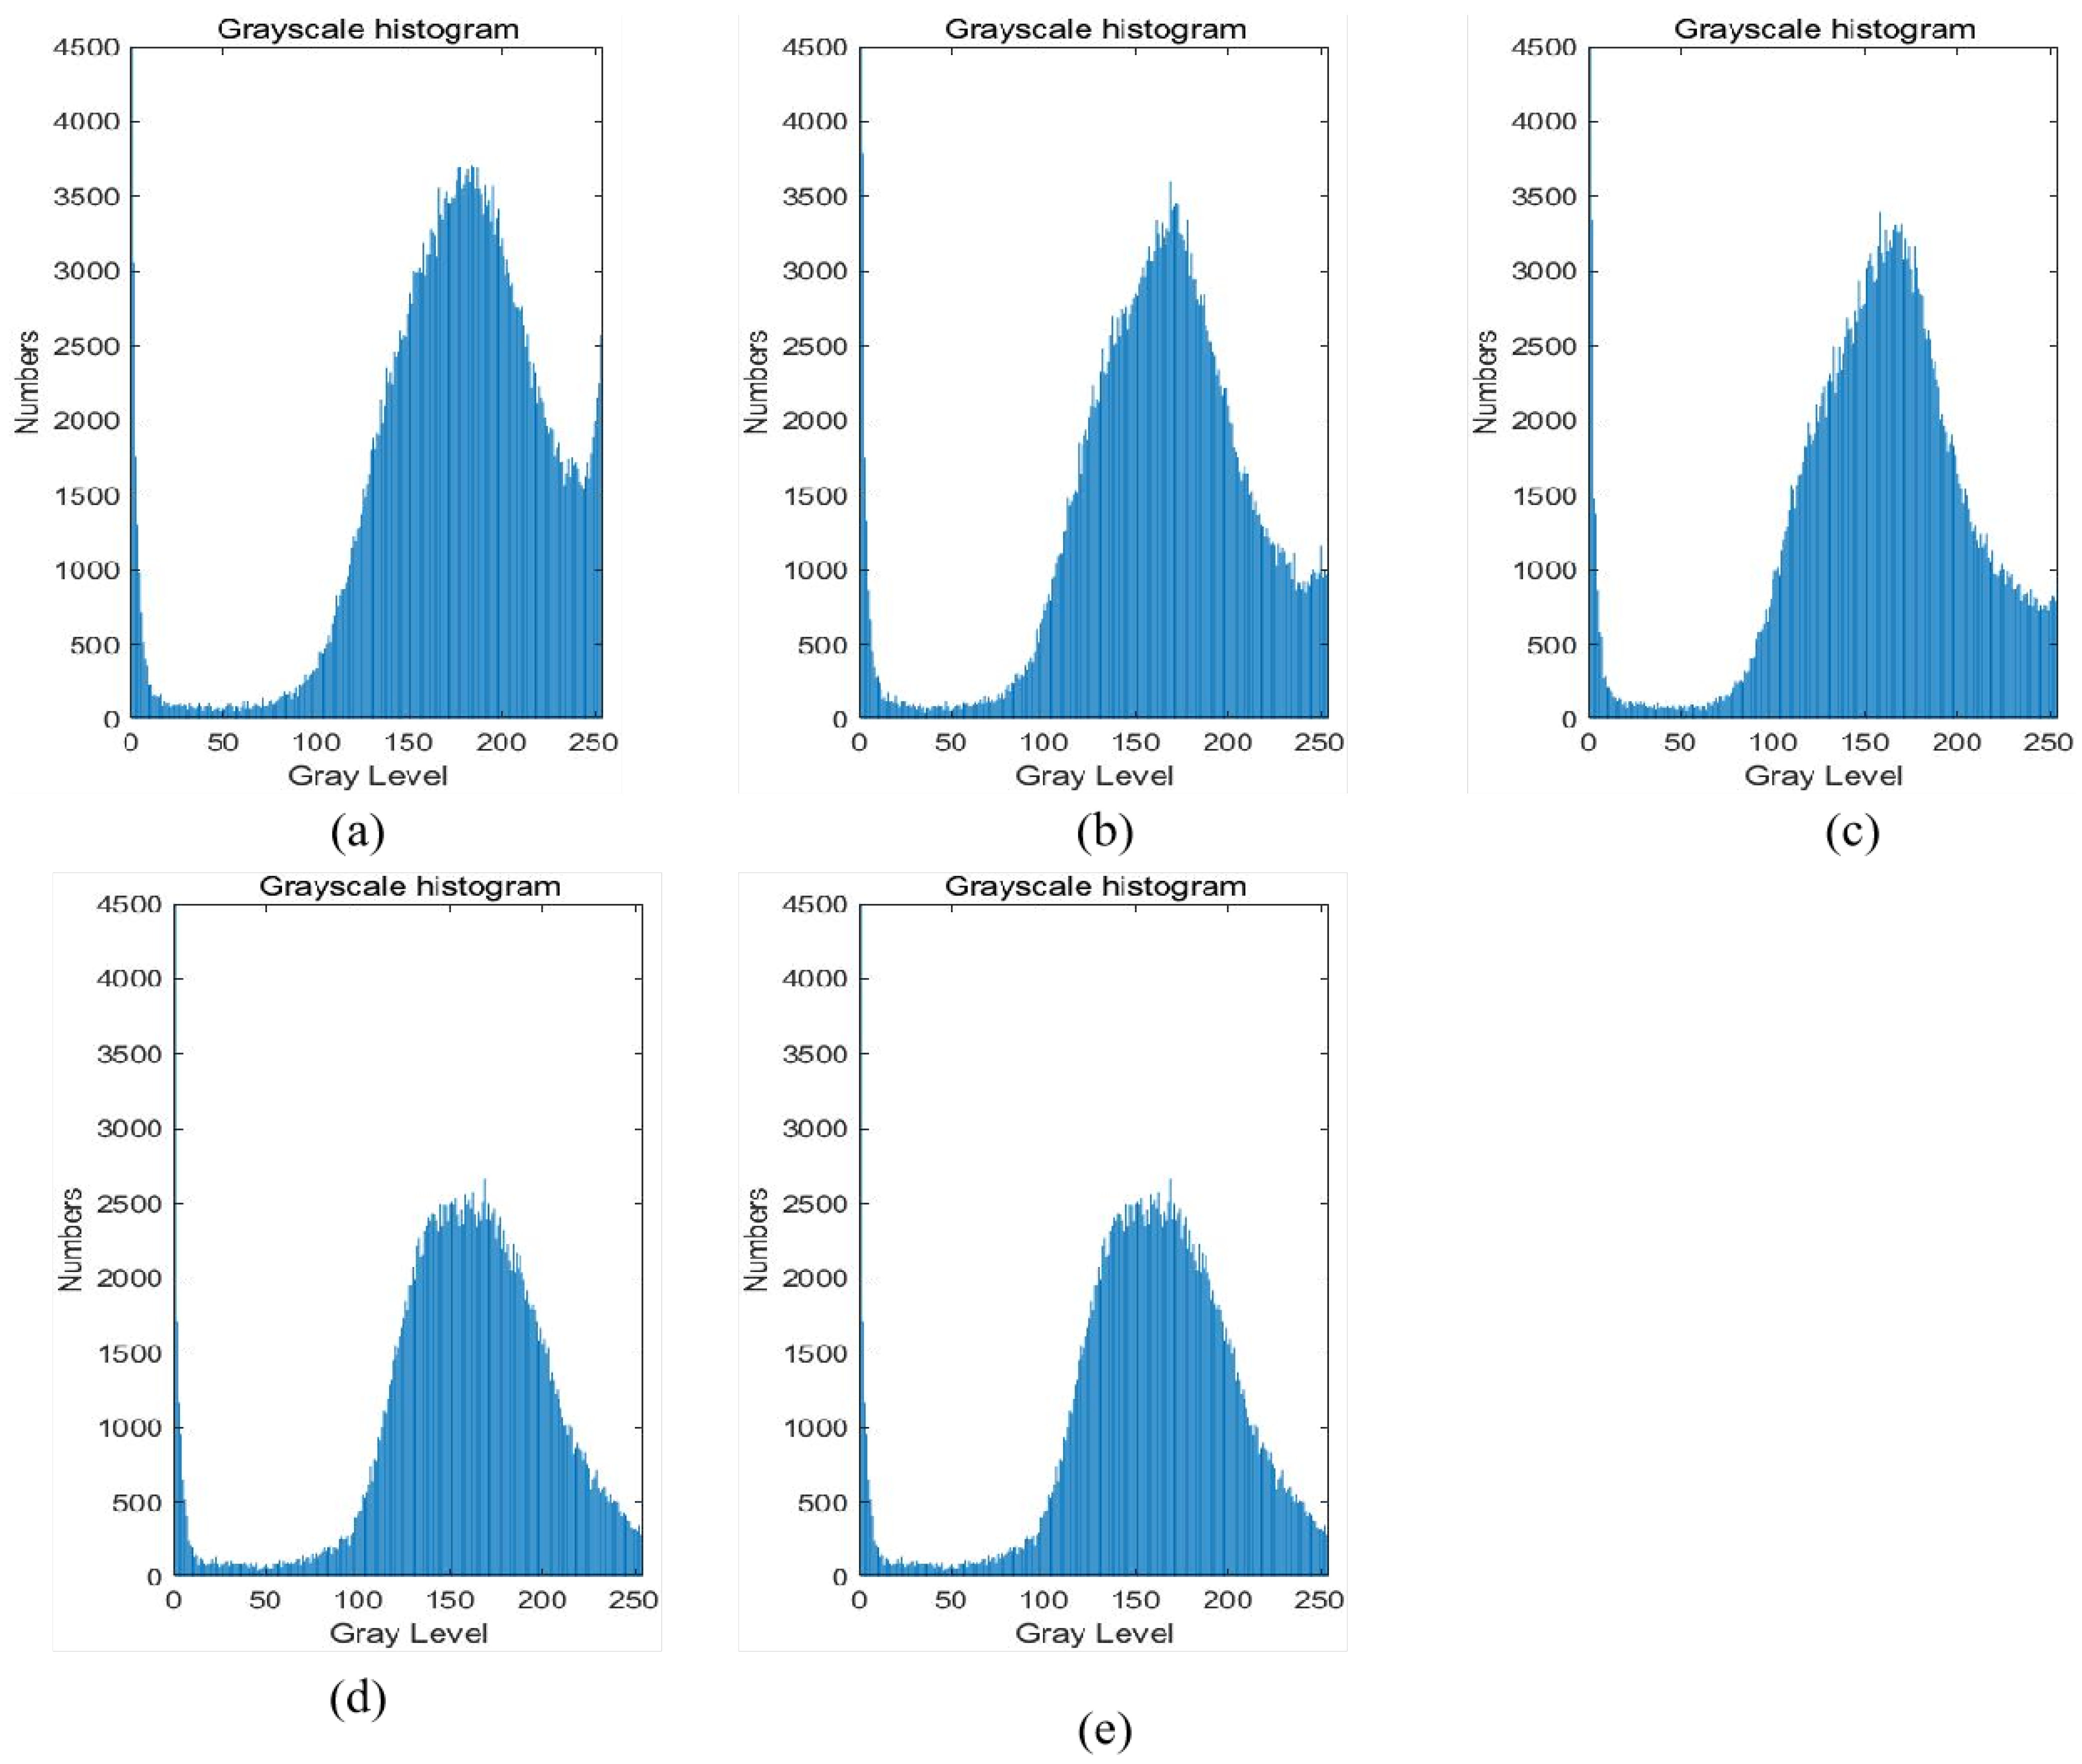
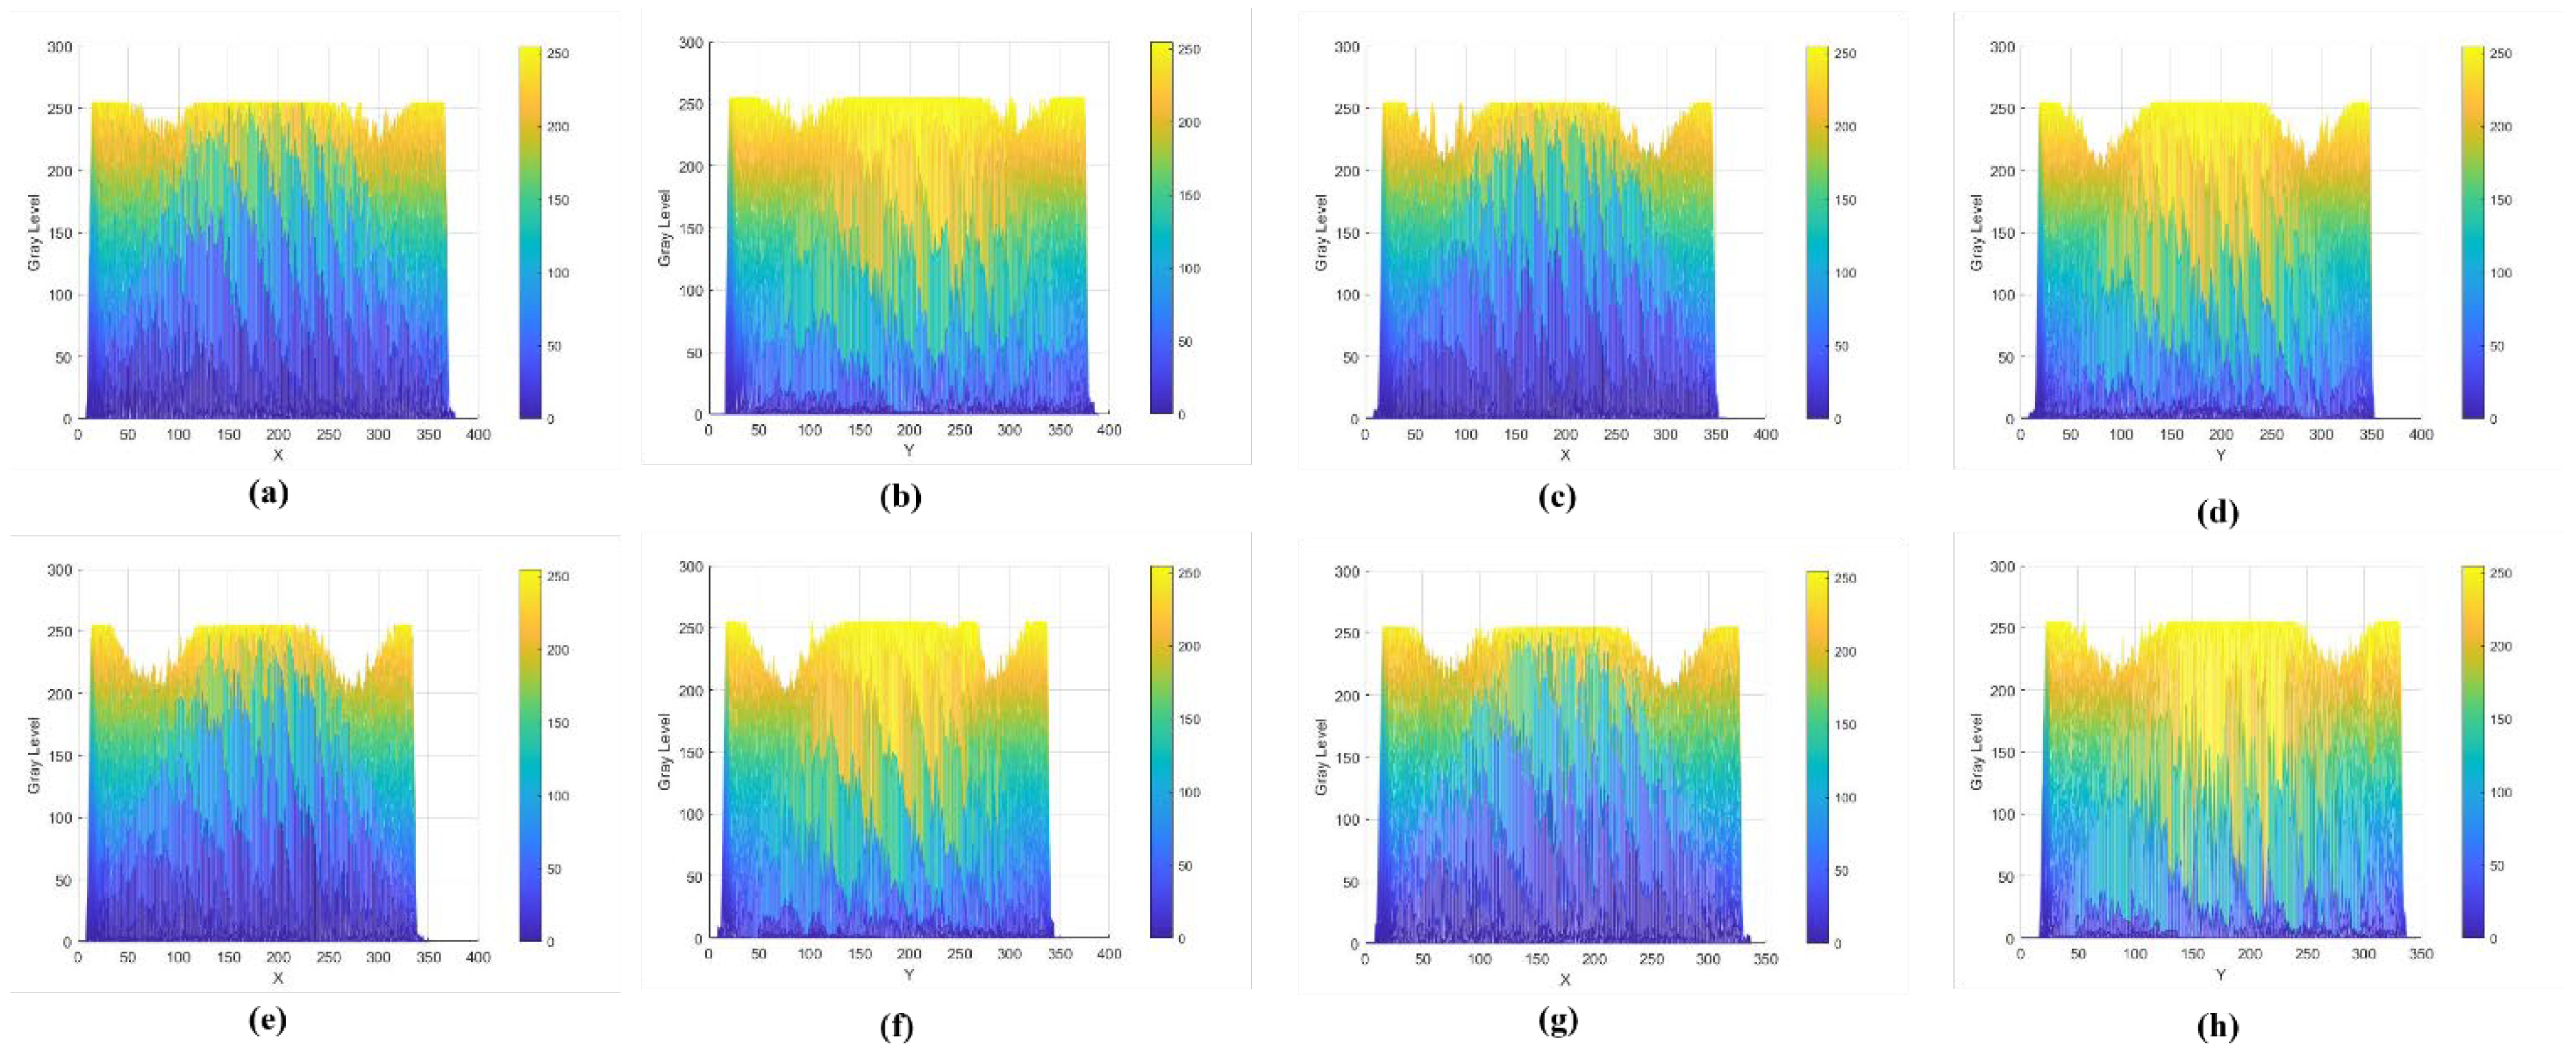
3.2.2. Differential Analysis of the Degradation Degree of Red Sandstone Specimens in Different Directions Based on CT Grayscale Images

(1)
Correlation analysis of longitudinal (Z direction) ultrasonic wave velocity values of red sandstone specimens with their CT grayscale distribution maps.
Since the red sandstone itself is not dense, the rock particles are small, the porosity is large, and the direct calculation of the porosity using CT is not accurate, we chose to utilize image processing to conduct a study on the degradation degree of the red sandstone. Specifically, the 365 slice images obtained by CT scanning of the red sandstone specimens were opened with visualization software, and the appropriate colormap was adjusted so the detailed features inside the slice images were relatively clear. The CT scanning images corresponding to the center positions of the five measurement points were selected as shown in Figure 6b, which were recorded as the first to the fifth layers from the bottom to the top, and the CT images obtained are shown in Figure 6a.
In order to characterize CT images more clearly, the grayscale distribution map is used to statistically study all pixel points and their possible patterns. A grayscale distribution map is a function of the distribution of gray levels in an image, producing a statistic of the distribution of gray levels in an image, and is widely used in image recognition and classification [36,37,38]. The grayscale distribution map is a statistical representation of all pixels in a digital image, according to the magnitude of their grayscale values and the frequency of their occurrence. Counting the brightness (gray level) of pixel points in the overall region can be used to portray and describe certain features of an image.
Analysis found that the first layer of the CT image grayscale distribution has a certain regularity, which appears in a distribution similar to an “X”. In the center and four corners of the middle part of the image, the grayscale level is smaller, while at the four sides and the nearby areas, the grayscale level is larger, as shown in Figure 7. However, this image can only show the grayscale distribution in different locations of the CT image. In order to investigate the relationship between grayscale and degradation degree, the grayscale histograms of each layer of the CT grayscale image were subsequently counted and the corresponding feature parameters were calculated as follows. In order to eliminate the influence of the boundary on the analysis effect, the grayscale distribution of layers 1–254 was statistically calculated and normalized in this study. The distribution density function was derived as p i = n i n , where i denotes the gray level, n denotes the sum of the pixel points of gray level from 1–254, n ( i ) is the number of pixels with a gray level of i , the numbers of pixel points of p i ∈ (0, 1), and i = 1 254 p ( i ) = 1 . The five CT images in Figure 6a were subjected to grayscale calculation and their grayscale distributions were counted, and the obtained histograms of grayscale distributions of the red sandstone specimens at each level are shown in Figure 8.
When calculating the histogram of grayness statistics, it was found that the distribution of CT grayness histograms of red sandstone specimens, from the first to the fifth layer, has a significant change. First, the overall trend of the grayness histogram from the first to the fifth layer is moving to the left, i.e., the overall grayness is decreasing, while the number of distributions with larger grayness levels from the first to the fifth layer is decreasing. The first, second, third and fourth layers all appear to be concentrated with high luminance, and their gray levels all show a trend of first decreasing and then increasing when they are greater than 200, but the fifth layer has an overall decreasing trend and no increasing trend. If the region with higher luminance is defined as the lossless region, it can be considered that from the first layer to the fifth layer, the lossless region is decreasing, and by the fifth layer most of the region has been eroded and the lossless region is significantly reduced. In order to further quantitatively describe the trend of the CT image, this paper extracts the seven basic features of the CT grayscale histogram in Figure 8, among which the average grayscale, standard deviation, third-order central moments, homogeneity, average amount of information, and maximum probability of grayscale level and other six features are the basic features of CT grayscale histograms, which can be used to express the basic information of the grayscale image and the overall distribution of the grayscale image. The characteristic parameters and calculation equations are shown in Table 2.
The correlation between the CT grayscale images of red sandstone and its degradation degree was investigated based on these feature parameters, and the calculation results of the characteristic parameters are shown in Table 3.
From the Z-axis direction, that is, from the analysis of the measurement point height, the ultrasonic wave velocity value of the red sandstone decreases with the rise in the height of the measurement point. The characteristic parameters of the CT grayscale histogram corresponding to it also change with certain regularity, in which the average grayscale, maximum probability grayscale level, and probability of the grayscale level being greater than 200 decrease with the rise in the height of the measurement point with a significant change trend, while the average amount of information and the third-order center moment have the opposite trend. Neither uniformity nor standard deviation changed significantly, probably due to the large amount of data and the existence of a certain pattern in their distribution. In general, the grayscale distribution of CT images and its features change with the height of the measurement points, along with the ultrasonic wave velocity values, which can generally be used to define the degree of degradation, so it can be assumed that there is a correlation between the CT grayscale image features and the degree of degradation. In terms of the average gray level, the maximum probability gray level, and the probability of a gray level greater than 200, the smaller the overall gray level of the CT grayscale image, i.e., the darker the image, the greater the degradation of the red sandstone specimen.
(2)
Specific analysis of the degree of degradation of horizontally oriented red sandstone specimens.
In the above analysis, it was found that there is a correlation between the characteristics of CT grayscale images and the degree of degradation of red sandstone in the longitudinal direction. However, the results of ultrasonic tests showed that there are different values of ultrasonic wave velocity in the horizontal direction in the same layer, so it can be understood that the erosion along different directions is different, i.e., the degree of degradation is different, and this section will apply the above analysis method to corroborate this conclusion.
For accurate comparison, the grayscale distribution maps of the CT images of each layer are projected onto the X–Z and Y–Z planes, respectively, with the X, Y, and Z directions consistent with the definitions in Figure 2. The projection of the X–Z plane characterizes the grayscale distribution along the X-axis direction and, to some extent, the propagation characteristics of the ultrasound waves. The Y–Z plane, on the other hand, characterizes the propagation of ultrasonic waves in the Y-axis direction. The differences in ultrasonic waves in the X and Y directions and the grayscale distribution under different layers are analyzed below. Since the top surface of specimen S is non-horizontal and inconsistent in height, only four ultrasonic wave data are collected in the Y direction, so only four sets of data are compared and analyzed here, i.e., the data corresponding to the L1 to L4 layers.
From the horizontal plane, when in the same level, the overall gray level of the gray distribution projection map on the X–Z plane is smaller than the projection on the Y–Z plane, and the gray level of the gray distribution projection map on the Y–Z plane is significantly more than that on the X–Z plane, as shown in Figure 9. The occurrence of degradation phenomena such as defects, cracks, and so on will result in the gray value of the CT image being decreased, so it can be assumed that the degradation in the X direction is larger than that in the Y direction when in the same level. Degradation is great, consistent with the conclusion drawn in Section 3.2.1, so it is considered that the gray value analysis of CT images is feasible.
The main reason for the different degrees of degradation in the two directions is that the red specimen was taken from the side wall of the pier, which has two exposed surfaces (the top exposed surface and the side exposed surface). Given the spatial location, the X direction is perpendicular to the side exposed surface, and the Y direction is parallel to the side exposed surface, as shown in Figure 2. According to the conclusions obtained from Section 3.1, and the general rule of erosion of rocks in natural conditions, along the X direction, there is erosion from the side exposed surface, while the Y direction has no erosion from the side exposed surface. There is erosion along the X direction, while there is no erosion from the exposed surface in the Y direction. Therefore, due to the greater erosion along the X direction, cracks, fissures, defects, etc., are developed along the X direction, so the ultrasonic wave propagates along the X direction in the ultrasonic measurement process and encounters more defects. Accordingly, the value of ultrasonic wave velocity in the X direction is smaller, which is manifested as a smaller overall grayscale of the grayscale distribution of the projection of the X–Z plane on the CT projection map.
In the longitudinal direction, the projection maps of the grayscale distribution in both the X–Z and Y–Z planes do not change significantly as the layer level rises, i.e., there is a certain bias in defining the degradation degree by using the data obtained in a single X direction or Y direction to define the degradation degree of the overall plane. In order to reduce the bias, this paper proposes a method to characterize the degree of degradation of the overall plane, as follows in Section 3.3.1.

3.3. Comprehensive Assessment of the Extent of Structural Degradation of Red Sandstone

3.3.1. Overall Planar Ultrasonic Wave Velocity Analysis and Degradation Degree Evaluation

In order to study the changing pattern of the degradation degree of red sandstone under natural environmental erosion, the loss of dynamic elastic modulus is used to define the degradation degree of red sandstone and analyze its change pattern with depth.
According to the relationship between the material dynamic modulus of elasticity Ed, density ρ, longitudinal wave speed v, and Poisson’s ratio μ:
E d = 1 + μ 1 2 μ ρ v 2 1 μ
Let k = 1 + μ 1 2 μ ρ 1 μ , then the above equation simplifies to
E d = k v 2
In this study, we found that there is a certain bias when using the ultrasonic wave velocity in the X or Y direction singularly to define the degradation degree of the overall plane, so it is proposed that a better approach is to characterize the degradation degree of red sandstone from both X and Y, and define the dynamic elastic modulus in X and Y directions, that is:
E d x = k v x i 2
E d y = k v y i 2
and characterize the degree of degradation in two directions, viz.:
d f x = E d x 0 E d x E d x 0 ,   d f y = E d y 0 E d y E d y 0
In order to achieve the calculation of the degradation degree of the overall plane, define a combined degradation degree   d f , which is expressed as:
d f = d f x 2 + d f y 2
If the first layer is used as the initial state, i.e., the initial ultrasonic wave velocity values are v x 1 and v y 1 , the final overall degradation degree is calculated by the formula:
d f i = v x 1 2 v x i 2 v x 1 2 2 + v y 1 2 v y i 2 v y 1 2 2
of which   v x 1   a n d   v y 1 are the ultrasonic velocities of the Li layer in the X- and Y-axis directions, respectively. d f x i ,   d f y i and d f i are the degradation degree of the Li layer in the X direction, Y direction and the overall plane, respectively. The calculated results are obtained as shown in Figure 10.
Figure 10 shows that the degree of degradation of red sandstone under natural environmental erosion has a certain positive correlation with the depth from the surface. It can be seen from the figure that the trend of degradation degree is accelerating; the closer to the surface, the faster the trend of degradation degree with depth, i.e., the weathering erosion rate is accelerating. The degradation degree in the X-axis upward is always smaller than that in the Y-axis upward, and the growth rate of the degradation degree in the Y-axis is also larger than that in the X-axis, so it can be judged that the red sandstone specimen is subject to different erosion degrees and erosion rates along different directions in the same plane, so characterizing the degradation degree of the red sandstone from two directions is appropriate.

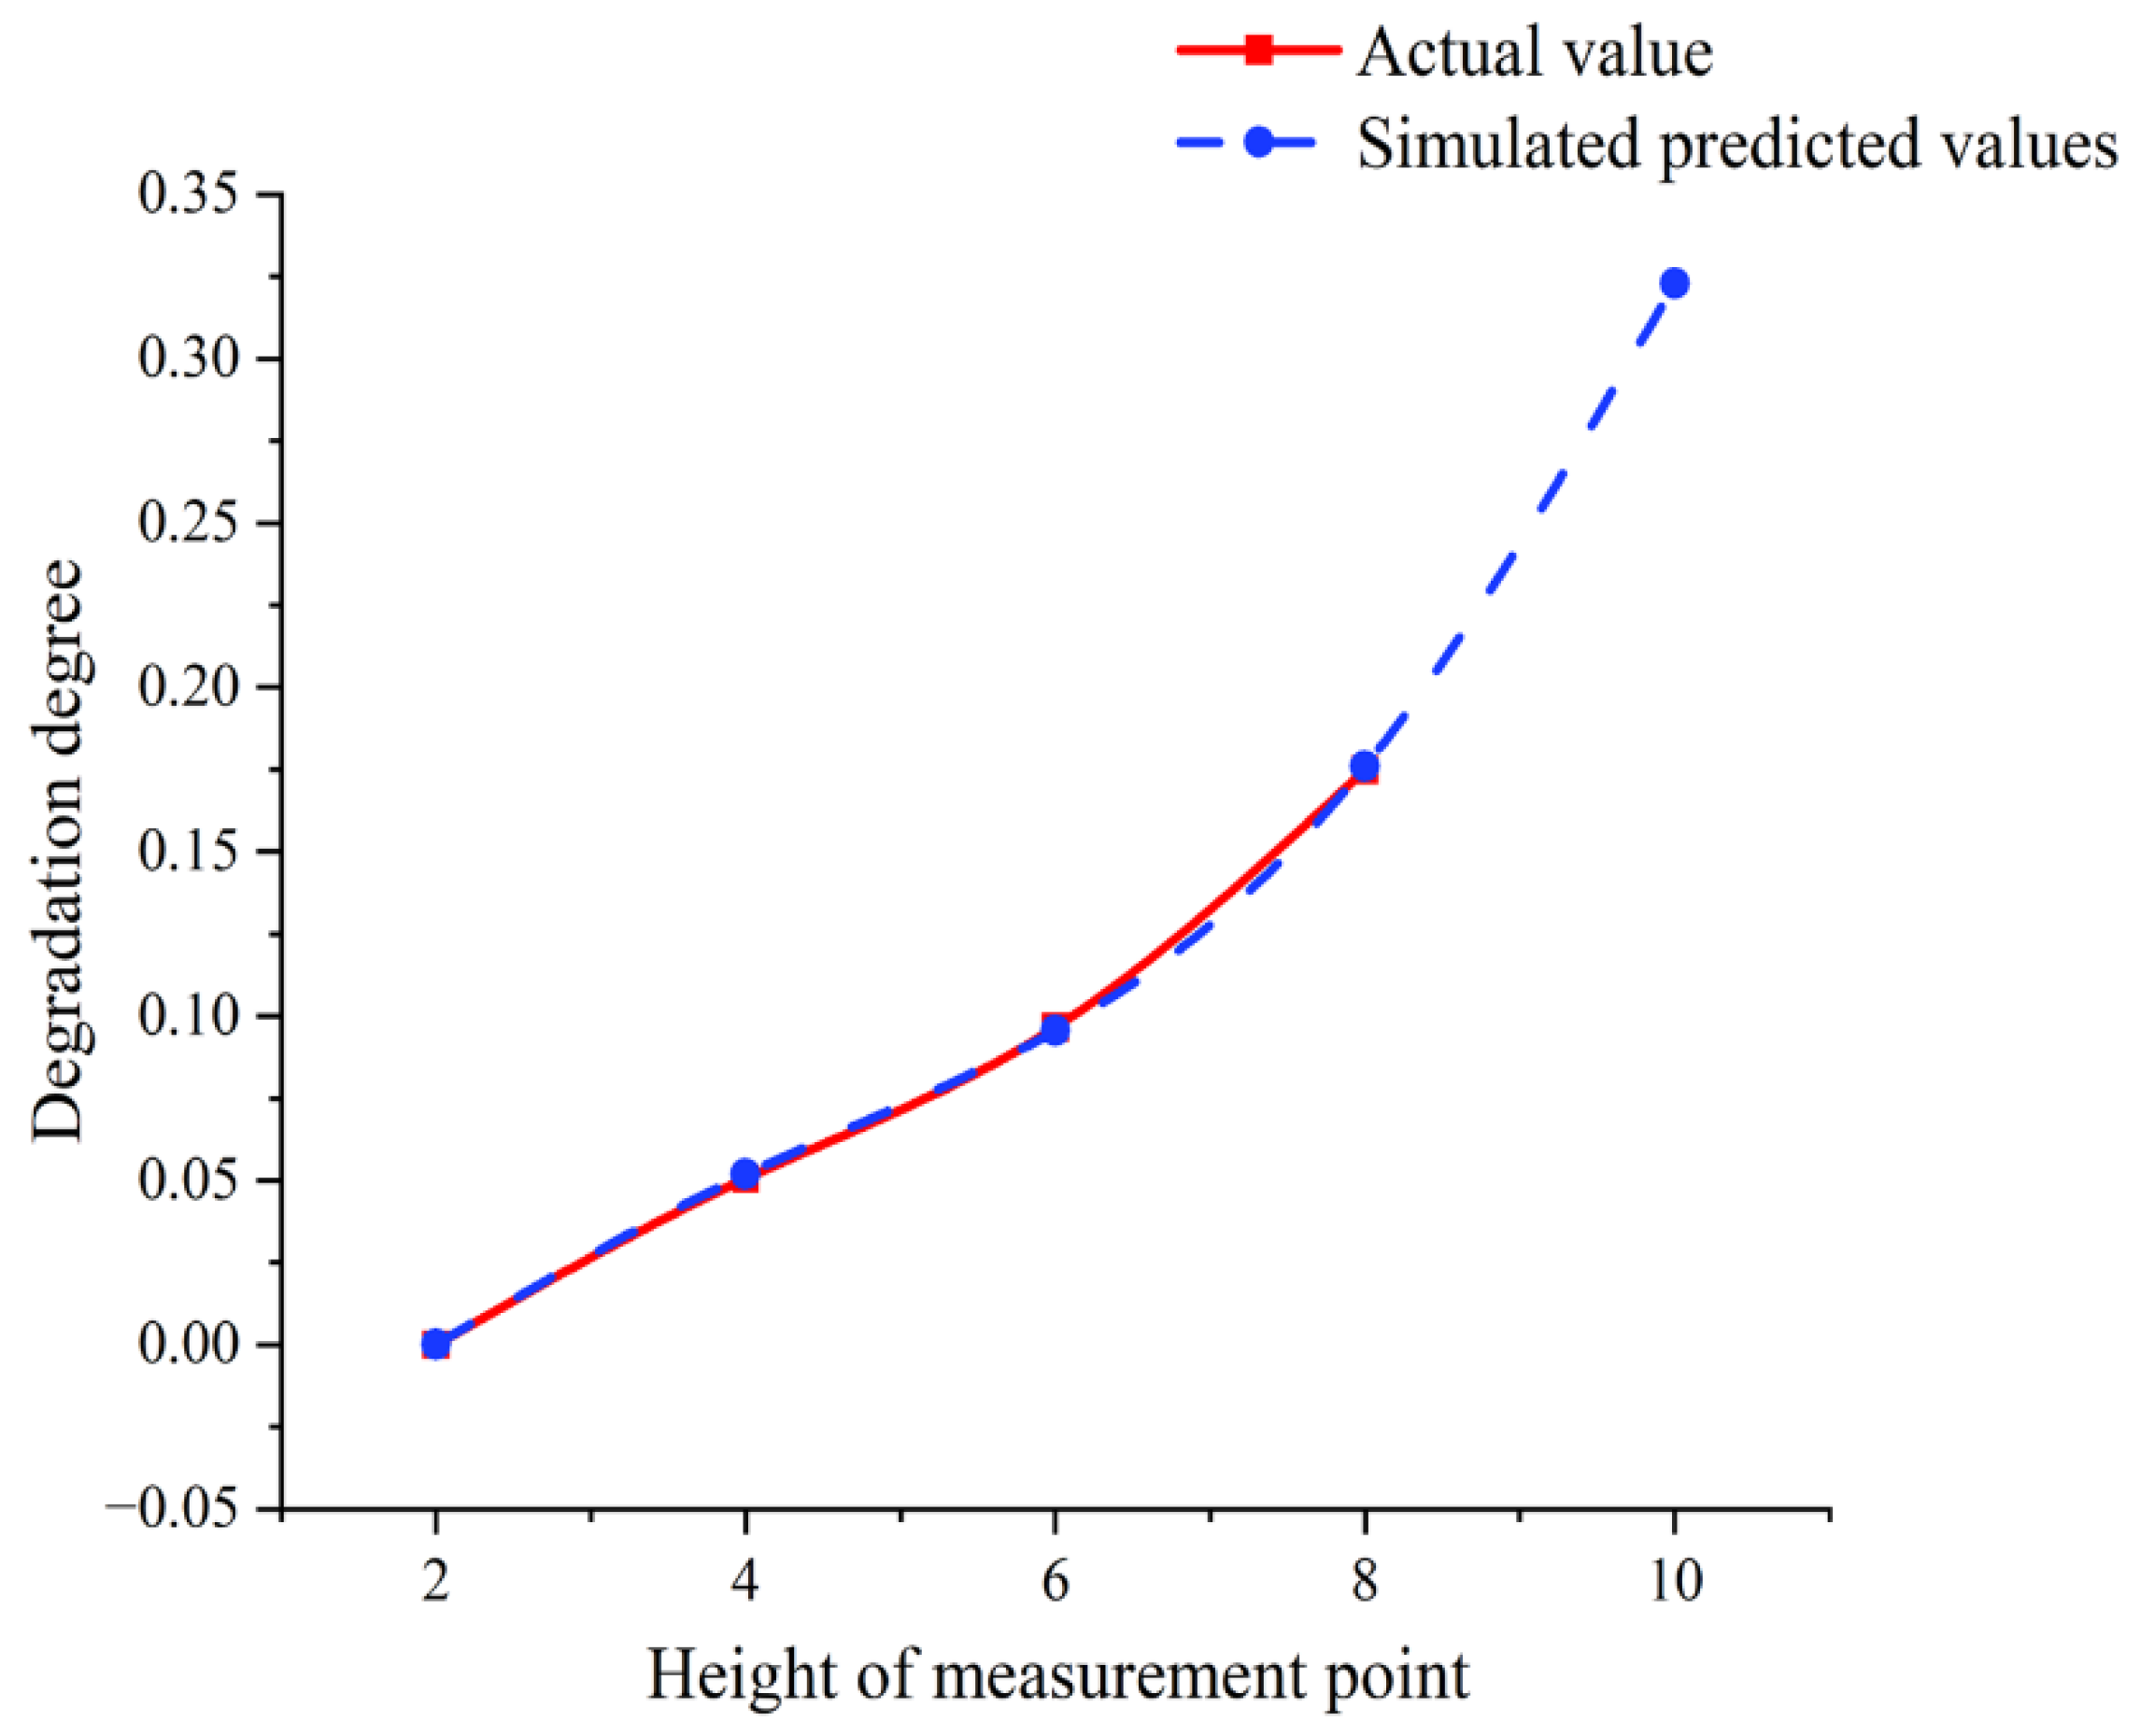
3.3.2. Analysis of Surface Degradation Degree of Red Sandstone Based on GM (1, 1) Gray Prediction Model

In this paper, we use the ultrasonic wave velocity values in two directions to characterize the degree of degradation, but ultrasonic inspection using a probe to collect the ultrasonic wave velocity parameters between the materials, subject to the operational limitations of its probe size, means points cannot be continuously picked, and the top bottom of the red sandstone specimen is a non-parallel surface, which means the ultrasonic wave velocity values at its boundary cannot be accurately detected. Furthermore, while the red sandstone surface is the most seriously affected by weathering corrosion, and thus there is the most research significance of this part of the object, it is also necessary to carry out research on the characteristics of the location performance. In the above, due to the existence of defects on the top of the specimen, meaning it was in a non-planar state, only for sets of data were obtained in the X direction, which was one less set compared to the Y direction. Accordingly, we used the GM (1, 1) gray prediction model to predict the degradation degree d f and we compared the calculation effect of different gray theoretical models, namely the Even GM (1, 1) model (EGM), the Original Difference GM (1, 1) model (ODGM), the Even Difference GM (1, 1) model (EDGM), and the Discrete GM (1, 1) model (DGM), and selected the optimal computational model to predict the degradation degree d f 5 of L5.
The calculation method is shown in Section 2.3.1. The results obtained by the four model predictions are shown in Table 4.
Through the calculation, it was found that the mean relative error of the Even GM (1, 1) model was large, and the mean relative error reached 4.9155% in predicting d f , so the prediction result of the model was not desirable. The average relative errors of the ODGM, EDGM and DGM models were not much different from one another and the prediction results were similar, but the average relative error of the EDGM model was the smallest, with an average relative error of 1.4591%. This model could be considered to have the best prediction effect and high accuracy, so it was selected as the final prediction model. The resulting expression is:
x ^ 1 k = 0.0616 × 1.8411 k 0.0616
The final predicted degradation degree of L5 was 32.39%, and the degradation degree in the X direction of the fifth layer was calculated as 20.67% by bringing in Equation (20). A comparison between the degradation degree obtained from the model analysis and the original value is shown in Figure 11.

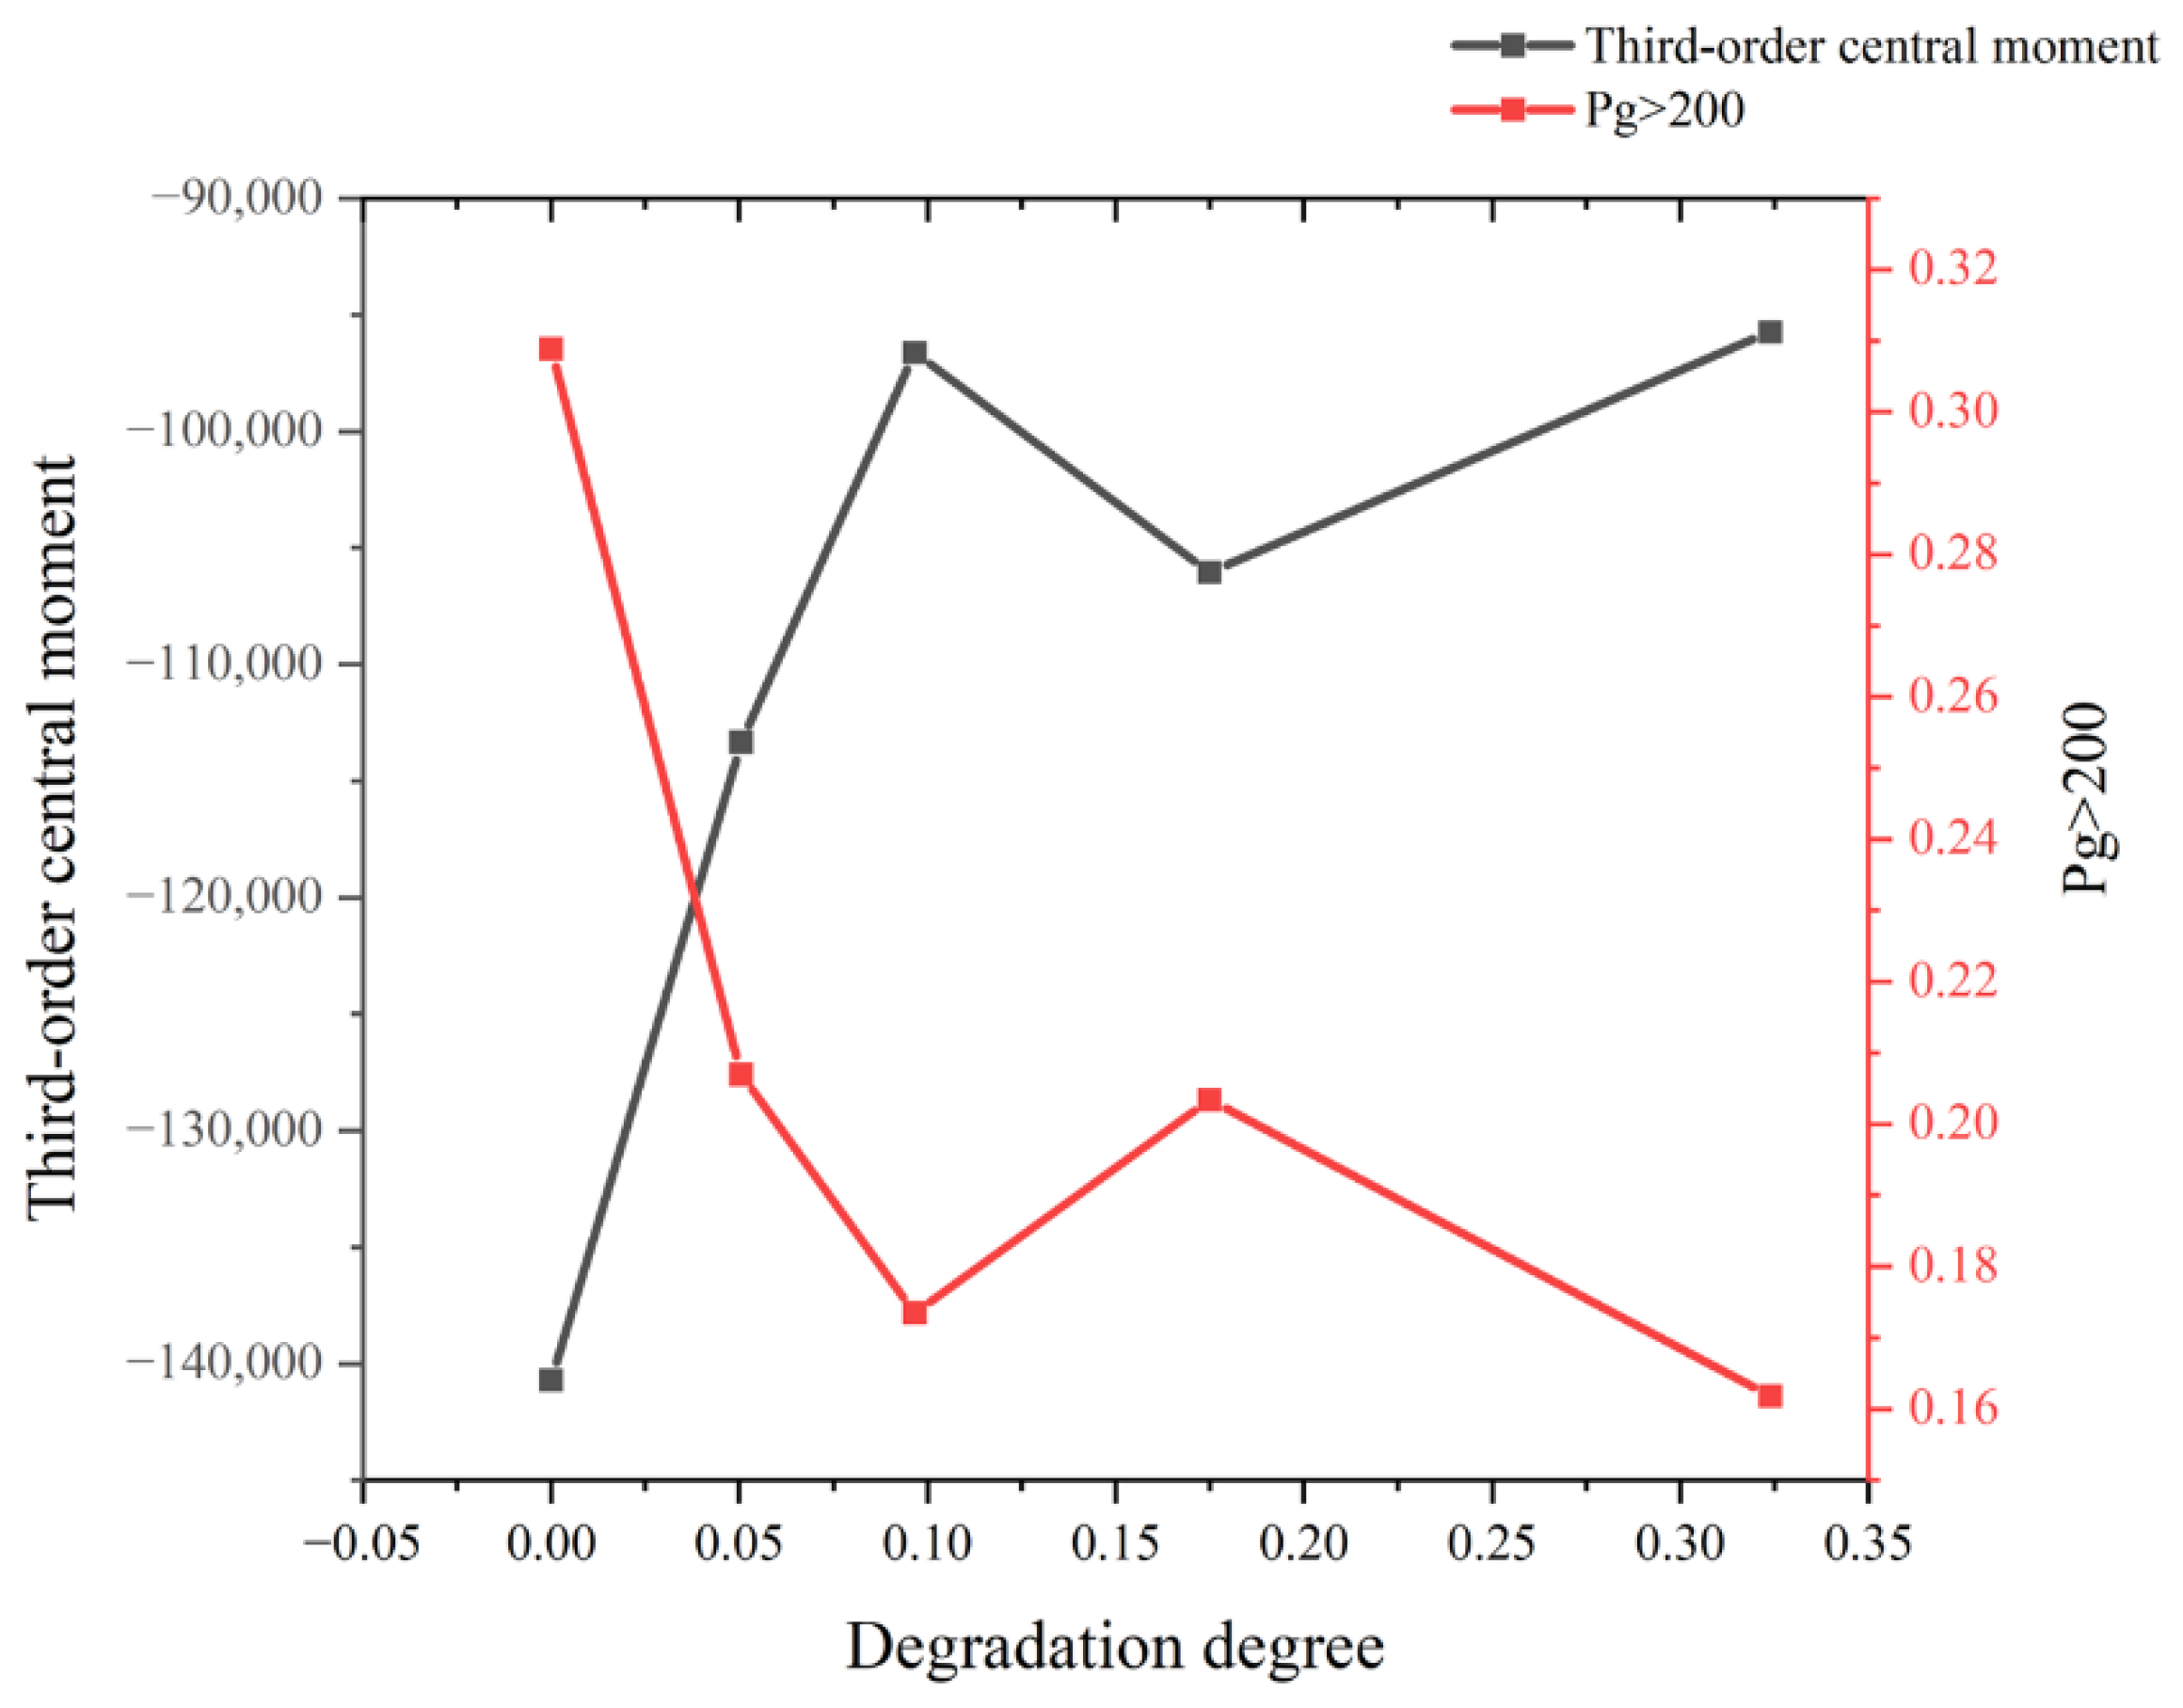
3.3.3. Correlation Analysis of the Degree of Red Sandstone Degradation with CT Grayscale Images

The work in Section 3.2 above shows that there is a correlation between the ultrasonic wave velocity values of the red sandstone specimens and their CT grayscale images, and this verifies the specificity of the degree of erosion in different directions when the red sandstone is in the same layer, and also defines the degradation degree of the overall plane of the red sandstone based on this. In order to further investigate the correlation between the CT grayscale images of the red sandstone specimens and the degradation degree, the correlation between the degradation degree and the characteristic parameters of the CT grayscale images is investigated.
The method adopted is gray relation analysis (GRA), which can measure the degree of correlation between the factors of two systems based on the similarity or dissimilarity of the development trend between the factors. In the process of system development, if the trend of two factors changes with consistency, i.e., the degree of synchronous change is higher, it can be said that the degree of correlation between the two is higher; on the contrary, it is lower. Since the degradation degree has been defined as the relative degradation degree in this paper, the degradation degree of the first layer is considered to be 0, so the calculation of the gray relative correlation degree cannot be carried out, and the gray absolute correlation degree is instead chosen to measure the correlation between the degradation degree of the red sandstone specimen and the CT grayscale image. The specific calculation method is shown in Section 2.3.2.
However, due to the different types of data in this paper and the large magnitude deviation of the data, the data are first processed dimensionless using normalization before performing the gray absolute correlation calculation.
In order to effectively verify the relationship between the CT grayscale distribution map of red sandstone and the overall planar degradation degree defined by ultrasound, all parameters in Table 3 are selected below. The real data of degradation degree obtained in Section 3.3.2 are used, and the data predicted using the EDGM model are calculated separately for absolute correlation, so as to find out the possible correlation between the CT grayscale image of red sandstone and the degradation degree, and also to verify the accuracy of the prediction model. The results obtained from the calculations are shown in Table 5.
It is calculated that there is a strong correlation between all the feature parameters of CT grayscale images and the defined degradation degree, in which the correlation between the third-order central moments of the feature parameters and the probability of a gray level greater than 200 and the true degradation degree reach 0.7935 and 0.8551, respectively, which show a strong correlation degree. The data also show that the correlation between the degradation degree values obtained from the simulation prediction and the feature parameters of the CT grayscale images is the same as for the true values, so it can be considered that the prediction model is highly accurate and its correlation with each feature parameter is greater than the correlation between the true values and the feature parameters, probably because the data obtained from the prediction simulation are more regular, while the true values have a little bit of randomness, so the correlation between the prediction simulation values and the feature parameters is higher. The correlations obtained from the prediction simulations also show a strong correlation between the two feature parameters, the third-order central moment and the probability of gray level greater than 200 (Pg > 200), and the degree of degradation, and since the basic properties of each feature parameter are characterizing the image features and their nature is correlated, it can be assumed that the two feature parameters, the third-order central moment and the probability of gray level greater than 200 (Pg > 200), can directly characterize the degree of degradation of the red sandstone from the image features.
From Figure 12 and the above analysis, it can be found that there is a strong correlation between the characteristic parameters of the CT grayscale image of the red sandstone and the degree of degradation, which can be used as a method to measure the degree of degradation of the red sandstone. Furthermore, there is a highly consistent pattern of change in the relationship between the third-order central moments and Pg > 200 and the degree of degradation. In the initial stage, the third-order central moments and Pg > 200 change drastically with the degradation, and as the degree of degradation increases, the rate of change in the two characteristic parameters is decreasing.
However, the opposite change occurs at the fourth layer, which may be due to the poor recognition of CT images taken at this layer or the presence of other forms of damage at the fourth layer rather than a single natural erosion. In general, there is a strong correlation in the characteristic parameters of CT grayscale images of red sandstone between third-order central moments and Pg > 200 and the degree of degradation. However, this study did not establish a better model to express the correspondence between the characteristic parameters of CT grayscale images of red sandstone and its degree of degradation due to the limitation of data volume, and it did not obtain a model to measure the degree of degradation of red sandstone using the characteristic parameters of CT grayscale images. Further work will be carried out in this area.

4. Conclusions

Basic physicochemical information on red sandstone specimens was obtained by using ultrasonic detection, microscopic electron microscopy (SEM), X-ray diffraction (XRD) and X-ray computed tomography (X-CT). Based on using the ultrasonic wave velocity and CT grayscale distribution map to analyze the specificity of the degradation degree of red sandstone in the horizontal direction, a method is proposed to calculate the degradation degree of the overall plane. The degradation degree of each level is calculated, and the degradation degree of L5 is predicted using the optimal gray prediction GM (1, 1) model. The relationship between the degradation degree and the characteristic parameters of the CT grayscale image is further investigated using the gray correlation method. The conclusions obtained are as follows:
(1) Microstructural analysis shows that the degradation of red sandstone specimens is accompanied by the development of defects such as cracks, fissures, and holes, as well as transformation and generation of new substances. The internal structure of red sandstone has white dolomite generated under weak weathering, while the surface sandstone structure under strong weathering all year round has dissolved flocculent sand grains with authigenic chlorite, which is able to fill the structural pores and protect the internal sandstone from further weathering and corrosion to a certain extent. The degree of degradation decreases with increasing depth.
(2) When analyzing the ultrasonic test results of the red sandstone specimens, it can be found that the ultrasonic velocity value is decreasing in the longitudinal direction from L1 to L5, and the erosion degree is different in the Y-axis and X-axis directions in the horizontal plane due to the spatial location. Combined with the CT grayscale images, it can be found that in the Z direction, there is a certain connection between the characteristic parameters of CT grayscale images and ultrasonic waves, and the root cause of the change in ultrasonic wave velocity values is the change in the degree of degradation, so the correlation between the characteristic parameters of CT grayscale images and the degree of degradation can be derived. It is further verified that the degradation degree is different in the X and Y directions when in the same layer, and thus a method to characterize the overall planar degradation degree of red sandstone specimens is required, as proposed in this paper.
(3) A method based on the gray GM (1, 1) model to predict the degree of degradation of layer L5 of a red sandstone specimen was proposed. Combined with the actual situation of this red sandstone specimen, in order to investigate the degradation of its surface layer relative to the un-weathered layer, four gray predictive GM (1, 1) models were used to predict the degradation of L5, and it was found that the mean relative error of the EDGM model was the smallest. The predicted degradation of the L5 layer was 32.39%.
(4) The correlation between the characteristic parameters of the CT grayscale images and the degree of degradation was analyzed using gray correlation theory. It was found that the correlation between the third-order central moments and Pg > 200 of the CT grayscale images of the red sandstone specimens and the true degree of degradation of the red sandstone specimens were 0.7934 and 0.8581, respectively, which further confirmed the good prediction effect of the EDGM model.
(5) The results of this paper show that there is a good correlation between the red sandstone CT grayscale image and the degree of red sandstone degradation, so it is practicable to characterize the degree of red sandstone degradation by using the features of a red sandstone CT grayscale distribution map. It is feasible to use this method to obtain a relationship model between the CT grayscale image and the degradation degree of red sandstone, and the surface degradation degree of existing ancient buildings can be obtained directly through CT scanning using this model, so as to achieve a non-destructive assessment of the degradation degree of the surface of existing ancient buildings. Although the research in this paper provides information on the relationship between CT image and degradation degree, the research method is theoretically applicable to other materials and ancient buildings, but the relationship model obtained is not universal—different models must be developed for different materials.

Author Contributions

Conceptualization, T.A. and K.C.; methodology, T.A.; software, K.C.; validation, X.M. and D.L.; resources, D.L.; data curation, T.A.; writing—original draft preparation, T.A.; writing—review and editing, D.L.; visualization, K.C.; supervision, X.M.; funding acquisition, D.L. All authors have read and agreed to the published version of the manuscript.

Funding

This research received no external funding.

Institutional Review Board Statement

Not applicable.

Informed Consent Statement

Informed consent was obtained from all subjects involved in the study.

Data Availability Statement

Data will be made available upon request.

Acknowledgments

Thanks to Zeng Shuisheng and Zhang Huailin of CCCC Qili Ancient Town (Ganzhou) Cultural Tourism Co., Ltd., Ganzhou, for providing us with the red sandstone materials at the project site of Qili Ancient Town as well as the historical information and investigation of Qili Ancient Town.

Conflicts of Interest

The authors declare no conflict of interest.

References

  1. Liu, D.; Jian, Y.; Tang, Y.; Cao, K.; Zhang, W.; Chen, H.; Gong, C. Comprehensive Testing of Sulfate Erosion Damage of Concrete Structures and Analysis of Silane Coating Protection Effect. Sensors 2022, 22, 7991. [Google Scholar] [CrossRef] [PubMed]
  2. Lin, G.; Wang, F.; Mi, Q. Preservation planning of the qingcheng ancient city wall. Open House Int. 2018, 43, 16–20. [Google Scholar]
  3. Kamh, G. Weathering at high latitudes on the carboniferous Old Red Sandstone, petrographic and geotechnical investigations, Jedburgh Abbey Church, Scotland, a case study. Environ. Geol. 2005, 47, 482–492. [Google Scholar] [CrossRef]
  4. Thatcher, M. Introduction: The state and historic buildings: Preserving ‘the national past’. Nations Natl. 2018, 24, 22–42. [Google Scholar]
  5. Qiao, G.; Li, T.; Chen, Y.F. Assessment and retrofitting solutions for an historical wooden pavilion in China. Constr. Build. Mater. 2016, 105, 435–447. [Google Scholar] [CrossRef]
  6. Liu, H. The Recovery and Conservation of a Historic District Post-earthquake A Case Study of Zhaohua in Sichuan Province in China. J. Asian Archit. Build. 2012, 11, 269–274. [Google Scholar]
  7. Cakir, H.K.; Aydin, D.; Arabulan, S. Adaptive reuse of open spaces in historical buildings. Int. J. Build. Pathol. 2020, 38, 703–719. [Google Scholar]
  8. Shen, F.; Tang, C.; Zuo, J.; Yu, R.; Zheng, T.; Niu, D. Water erosion control of undisturbed soil cores by near soil surface factors after 5-year vegetation restoration in red sandstone area from subtropical China. J. Soil. Sediment. 2023, 23, 1356–1369. [Google Scholar]
  9. Ma, D.; Duan, H.; Li, X.; Li, Z.; Zhou, Z.; Li, T. Effects of seepage-induced erosion on nonlinear hydraulic properties of broken red sandstones. Tunn. Undergr. Space Technol. 2019, 91, 102993. [Google Scholar] [CrossRef]
  10. Zhang, L.; Xiao, T.; Liu, H.; Ge, P.; Xia, J.; Dai, C.; Zhang, W.; Zhao, X. Effects of AM Fungi and Grass Strips on Soil Erosion Characteristics in Red Sandstone Erosion Areas in Southern China. Forests 2022, 13, 1351. [Google Scholar] [CrossRef]
  11. Wu, H.; Song, X.; Liu, F.; Li, D.; Zhang, G. Geophysical and geochemical characterization reveals topography controls on critical zone structure in a low hilly region. Earth Surf. Process. Landf. 2022, 47, 2796–2810. [Google Scholar] [CrossRef]
  12. Jiang, J.; Yang, G. Field tests on mechanical characteristics and strength parameters of red-sandstone. J. Cent. South Univ. Technol. 2010, 17, 381–387. [Google Scholar] [CrossRef]
  13. Dong, Z.; Sun, Q.; Ye, J.; Zhang, W. Changes in color and roughness of red sandstone at high temperatures. Bull. Eng. Geol. Environ. 2020, 79, 1959–1966. [Google Scholar] [CrossRef]
  14. Kim, E.; Garcia, A.; Changani, H. Fragmentation and energy absorption characteristics of Red, Berea and Buff sandstones based on different loading rates and water contents. Geomech. Eng. 2018, 14, 151–159. [Google Scholar]
  15. Sirdesai, N.N.; Singh, T.N.; Ranjith, P.G.; Singh, R. Effect of Varied Durations of Thermal Treatment on the Tensile Strength of Red Sandstone. Rock Mech. Rock Eng. 2017, 50, 205–213. [Google Scholar] [CrossRef]
  16. Yang, Y.; Zhang, N.; Wang, J. A Study on the Dynamic Strength Deterioration Mechanism of Frozen Red Sandstone at Low Temperatures. Minerals 2021, 11, 1300. [Google Scholar] [CrossRef]
  17. Guo, S.; Wen, S.; Guo, H.; Fu, H. The Creep Test Study and Macro-Detail Analysis of Argillaceous Red Sandstone in Different Water-Containing States. Adv. Civ. Eng. 2022, 2022, 9698675. [Google Scholar] [CrossRef]
  18. Khanlari, G.; Sahamieh, R.Z.; Abdilor, Y. The effect of freeze-thaw cycles on physical and mechanical properties of Upper Red Formation sandstones, central part of Iran. Arab. J. Geosci. 2015, 8, 5991–6001. [Google Scholar] [CrossRef]
  19. Wang, M.; Li, J.; Tan, H.; Wang, J.; Shi, Z.; Li, K. Study on fatigue characteristics and thermal damage mechanism of red sandstone under high temperature-cyclic load coupling. Int. J. Fatigue 2023, 168, 107405. [Google Scholar] [CrossRef]
  20. Jiang, H.; Jiang, A.; Zhang, F. Experimental investigation on damage and seepage of red sandstone subjected to cyclic thermal and cold treatment. Geoenergy Sci. Eng. 2023, 222, 211461. [Google Scholar] [CrossRef]
  21. Zhang, X.; Yao, W.; Wang, X.; Zhu, W.; Lu, Z.; Zhu, X.; Huang, H. Experimental and Numerical Investigation of the Damage Characteristics of Rocks under Ballistic Penetration. Appl. Sci. 2022, 12, 6120. [Google Scholar] [CrossRef]
  22. Liu, Q.; Qian, Z.; Wu, Z. Micro/macro physical and mechanical variation of red sandstone subjected to cyclic heating and cooling: An experimental study. Bull. Eng. Geol. Environ. 2019, 78, 1485–1499. [Google Scholar] [CrossRef]
  23. Zhang, W.; Chen, Y.; Guo, J.; Wu, S.; Yan, C. Investigation into Macro- and Microcrack Propagation Mechanism of Red Sandstone under Different Confining Pressures Using 3D Numerical Simulation and CT Verification. Geofluids 2021, 2021, 2871687. [Google Scholar] [CrossRef]
  24. Zhang, H.; Sun, Q.; Jia, H.; Dong, Z.; Luo, T. Effects of high-temperature thermal treatment on the porosity of red sandstone: An NMR analysis. Acta Geophys. 2021, 69, 113–124. [Google Scholar] [CrossRef]
  25. Zhu, Q.; Yang, W.; Yu, H. Study on the permeability of red sandstone via image enhancement. Fractals 2017, 25, 1750055. [Google Scholar] [CrossRef]
  26. Niu, C.; Zhu, Z.; Zhou, L.; Li, X.; Ying, P.; Dong, Y.; Deng, S. Study on the microscopic damage evolution and dynamic fracture properties of sandstone under freeze-thaw cycles. Cold Reg. Sci. Technol. 2021, 191, 103328. [Google Scholar] [CrossRef]
  27. Ghobadi, M.H.; Babazadeh, R. An investigation on the effect of accelerated weathering on strength and durability of Tertiary sandstones (Qazvin province, Iran). Environ. Earth Sci. 2015, 73, 4237–4250. [Google Scholar] [CrossRef]
  28. Xu, H.; Cai, L.; Shao, Z.; Wang, Z.; Li, Z.; Huang, C. Prediction of Shear Strength of Fully Weathered Coastal Red Sandstone: Influence of Water Content, Fine Content, and Relative Compaction. J. Coast. Res. 2021, 37, 827–841. [Google Scholar] [CrossRef]
  29. Ludovico-Marques, M.; Chastre, C.; Vasconcelos, G. Modelling the compressive mechanical behaviour of granite and sandstone historical building stones. Constr. Build. Mater. 2012, 28, 372–381. [Google Scholar] [CrossRef]
  30. Amer, A.; Al-Hajeri, M.; Najem, A.; Al-Qattan, F. Facies architecture of Lower Fars Formation at Jal Az-Zor escarpment, Kuwait. Arab. J. Geosci. 2019, 12, 502. [Google Scholar] [CrossRef]
  31. Hu, Y. Energy demand forecasting using a novel remnant GM (1, 1) model. Soft Comput. 2020, 24, 13903–13912. [Google Scholar] [CrossRef]
  32. Zeng, B.; Ma, X.; Shi, J. Modeling Method of the Grey GM (1, 1) Model with Interval Grey Action Quantity and Its Application. Complexity 2020, 2020, 6514236. [Google Scholar] [CrossRef] [Green Version]
  33. Mao, S.; Chen, Y.; Xiao, X. City Traffic Flow Prediction Based on Improved GM (1, 1) Model. J. Grey Syst. 2012, 24, 337–346. [Google Scholar]
  34. Meng, W.; Zeng, B.; Li, S. A Novel Fractional-Order Grey Prediction Model and Its Modeling Error Analysis. Information 2019, 10, 167. [Google Scholar] [CrossRef] [Green Version]
  35. Wei, B. An Improved T-GM (1, 1) and It’s Application. J. Grey Syst. 2018, 30, 186–193. [Google Scholar]
  36. Hao, D.; Li, Q.; Li, C. Histogram-based image segmentation using variational mode decomposition and correlation coefficients. Signal Image Video Process. 2017, 11, 1411–1418. [Google Scholar] [CrossRef]
  37. Wan, M.; Gu, G.; Qian, W.; Ren, K.; Chen, Q.; Maldague, X. Infrared Image Enhancement Using Adaptive Histogram Partition and Brightness Correction. Remote Sens. 2018, 10, 682. [Google Scholar] [CrossRef] [Green Version]
  38. Acharya, U.K.; Kumar, S. Directed searching optimized mean-exposure based sub-image histogram equalization for grayscale image enhancement. Multimed. Tools Appl. 2021, 80, 24005–24025. [Google Scholar] [CrossRef]
Figure 1. Field sampling and cutting of specimens: (a) historic sites and buildings, (b) red sandstone blocks, (c) prismatic square specimen S.
Applsci 13 09159 g001
Figure 2. Diagram of ultrasonic measurement points and probe locations.
Applsci 13 09159 g002
Figure 3. Apparent characteristics of red sandstone specimens and microscopic detection and analysis areas.
Applsci 13 09159 g003
Figure 4. Part 1~Part 3 XRD physical phase analysis: (a) Part 1 XRD, (b) Part 2 XRD, (c) Part 3 XRD.
Applsci 13 09159 g004
Figure 5. Part 1 to Part 3 SEM chart: (a) Part 1 (×100 and ×1000), (b) Part 2 (×100 and ×1000), (c) Part 3 (×100 and ×1000).
Applsci 13 09159 g005
Figure 6. Schematic diagram of CT images, measurement point distribution and ultrasonic test results: (a) CT images, (b) ultrasonic measurement point distribution, (c) ultrasonic test results.
Applsci 13 09159 g006
Figure 7. Original image and grayscale distribution of the first CT layer: (a) original image, (b) grayscale distribution.
Applsci 13 09159 g007
Figure 8. CT gray histogram of each layer of red sandstone specimen: (a) first layer (b) second layer, (c) third layer, (d) fourth layer, (e) fifth layer.
Applsci 13 09159 g008
Figure 9. Projection of the CT grayscale distribution in the X–Z and Y–Z directions at different layers: (a) first-layer X–Z plane, (b) first-layer Y–Z plane, (c) second-layer X–Z plane, (d) second-layer Y–Z plane, (e) third-layer X–Z plane, (f) third-layer Y–Z plane, (g) fourth-layer X–Z plane, (h) fourth-layer Y–Z plane.
Applsci 13 09159 g009
Figure 10. Degradation degree at each layer.
Applsci 13 09159 g010
Figure 11. Comparison of predicted and true values of degradation degree.
Applsci 13 09159 g011
Figure 12. Degradation degree versus third-order central moment and Pg > 200.
Applsci 13 09159 g012
Table 1. Major substances and microscopic distribution in different parts of red sandstone.
Main SubstancesMicroscopic Distribution
Part 1Chlorite, dolomite, quartz, calcite, feldspar and micaDissolved flocculent, fissure, disorderly pore distribution
Part 2Dolomite, quartz, calcite, feldspar and micaBroken and messy, with microscopic cracks
Part 3Quartz, calcite, feldspar and micaWell-angled micro-grain structure, no significant defects
Table 2. Equations for the calculation of characteristic parameters.
Feature NameCalculation Formula
Average gray level μ = p ( i )
Standard deviation σ = 1 μ 2 p i
Third-order central moment 1 μ 3 p i
Homogeneity p ( i ) 2
Average message size p ( i ) log p ( i )
Maximum probability gray level m a x i p ( i )
Probability of a gray level greater than 200 (Pg > 200) i = 200 254 p ( i )
Table 3. Calculation results of characteristic parameters.
First LayerSecond LayerThird LayerFourth LayerFifth Layer
Average gray level175162158160157
Standard deviation668676676688651
Third-order central moment−140,720−113,330−96,618−106,040−95,730
Homogeneity0.00680.00670.00670.00660.0072
Average message size2.22002.23452.23702.24262.2153
Maximum probability gray level187169158171169
(Pg > 200)0.30890.20700.17350.20340.1618
Table 4. GM (1, 1) model and prediction results.
GM (1, 1) ModelPredicted Value
of d f 5
Average Relative
Error
d f EGM0.29474.9155%
ODGM0.32411.4720%
EDGM0.32391.4591%
DGM0.32411.4802%
Table 5. Calculated correlation between feature parameters and degree of degradation for CT grayscale images.
Feature Parameters of CT Grayscale ImagesDegradation Degree
True Value + L5 Layer
Predicted Value
Simulated Predicted Values
Average gray level0.72680.7821
Standard deviation0.70350.7620
Third-order central moment0.79340.8409
Homogeneity0.70240.7625
Average message size0.70200.7599
Maximum probability gray level0.73390.7912
(Pg > 200)0.85810.8999
Note: A strong correlation between two factors is considered when the correlation degree > 0.8, a weak correlation between two factors when the correlation degree ∈ (0.5, 0.8), and no correlation between two factors when the correlation degree < 0.3.
Disclaimer/Publisher’s Note: The statements, opinions and data contained in all publications are solely those of the individual author(s) and contributor(s) and not of MDPI and/or the editor(s). MDPI and/or the editor(s) disclaim responsibility for any injury to people or property resulting from any ideas, methods, instructions or products referred to in the content.

