Article

Neighborhood Rough Fuzzy Penetration Control Method with Variable Precision Based on GMAW

Guangxi Key Laboratory of Ocean Engineering Equipment and Technology, Beibu Gulf University, Qinzhou 535100, China
*
Author to whom correspondence should be addressed.
Appl. Sci. 2023, 13(16), 9215; https://doi.org/10.3390/app13169215
Submission received: 16 July 2023 / Revised: 11 August 2023 / Accepted: 11 August 2023 / Published: 13 August 2023

Abstract

:
Considering the nonlinear, time-varying, and multivariate coupling nature of the welding process, achieving excellent control of the welding process can be challenging. In addition, welding experience varies from person to person, making it difficult to establish a uniform standard. In this work, rough set theory is introduced and applied to arc welding process modeling and quality control to achieve effective online control of weld penetration during welding. A variable precision neighborhood rough-fuzzy method is proposed to enhance the efficiency and adaptability of rough set theory for information processing in the welding process. By designing welding experiments with different gaps and currents, descriptors such as the tail area coefficient and the length-width ratio of the melt pool have been proposed to characterize the melt pool. Rough set theory has been used to extract decision classification rules for welding percolation state information, and clustering analysis, fuzzy logic, and min-max fuzzy methods have been introduced for knowledge modeling. The proposed variable precision neighborhood rough-fuzzy control model is verified via three sets of experiments, and the results show that the model has excellent stability and effectiveness.

1. Introduction

As an essential material joining technique, welding plays a highly significant role in industrial manufacturing, especially in automotive, aerospace, marine, and other widely used fields. Gas metal arc welding (GMAW) is widely used in industrial manufacturing operations because of its elevated welding efficiency and low cost. Welding is a typically complex process with extreme nonlinearity, time varying, interference, and multivariate coupling. In welding process control problems, the actual welding conditions and environment are continuously changing, which makes it difficult to summarize the welding experience and reproduce the excellent control results. Exploring intelligent methods for the control of penetration states is one of the main effective means.
The rough set (RS) method is a mathematical tool used to deal with incomplete knowledge and fuzzy concepts [1]. Since rough set theory was proposed by Pawlak [2] in 1982, it has been widely used in data mining, machine learning, and knowledge discovery. Several scholars have carried out effective studies based on rough set theory, joint fuzzy set theory, and other intelligent approaches. Suo et al. [3] proposed a variable precision fuzzy neighborhood rough set (VPFNRS) model based on a neighborhood rough set, introduced fuzzy theory, gave fuzzy rule acquisition and decision-making theory, and successfully applied it in satellite power systems, which verified the feasibility and accuracy of this method for fault diagnosis. E. Kanan et al. [4] used rough set principles to extract uncertain information and combined it with machine learning technology for risk prediction. Many scholars have also applied rough sets in the field of welding. Wang et al. [5] applied a rough set to the knowledge modeling of the pulse GTAW process of aluminum alloys. Li et al. [6] proposed a welding process modeling method based on variable precision rough sets in order to improve modeling stability and model effectiveness over classical rough set. Feng et al. [7] proposed a knowledge modeling method based on interval-valued fuzzy rough sets, which was effectively applied to predict welding deformation of Marine structures. Chady et al. [8] applied rough set theory to the problem of welding defect identification and effectively identified selected welding defects.
With the development of sensor technology, some characteristic information about the welding process can be easily obtained by the sensor. In welding, the penetration depth of the weld can reflect the quality of the welding [9], and the penetration depth of the weld is mainly affected by the welding process parameters (welding current, welding voltage, protective gas flow, wire feeding speed, etc.). The penetration depth cannot be measured directly but can only be obtained via prediction and estimation. Lv et al. [10,11] used acoustic sensors combined with neural network technology to predict the penetration state in the welding process, and by training a large number of data points, the prediction accuracy can reach 80%–90%. Beak et al. [12,13,14] used vision sensors to obtain molten pool images and used deep learning and neural network technologies to predict and identify weld penetration depth, in which the two-dimensional image of the molten pool surface was taken as an influential feature input. In the course of experimental validation, the model developed by Baek et al. [12] quantitatively predicted the penetration depth of tungsten gas shielded welding. The mean absolute error is 0.0596 mm, and R2 is 0.9974. Wang et al. [13] used ViT-B/16 model ImageNet for pre-training, and the validation accuracy was successfully improved by 4.45%. The transfer learning results show that the ViT model achieves a test accuracy of 98.11%.
This approach, starting with the monitoring of a molten pool by visual sensors, is inspired by the fact that some geometrical feature information in a molten pool image can indirectly reflect the penetration depth and subsequently the weld penetration state. By constructing a geometric information table of the surface properties of the molten pool, the rough set method is used to reduce the knowledge and extract the effective information, which is relevant for the input of the control system. In order to improve the effectiveness of fuzzy rules and reduce redundancy, the concept of variable precision was introduced, and a welding knowledge modeling method called variable precision neighborhood rough set (VPNRS) was proposed to extract effective rules from mixed information of knowledge system. At the same time, fuzzy theory can make up for the low precision caused by rough set (RS) control and eliminate the influence of redundant data in the control process. The effective rule and information are taken as input to the control system, and the desired range of conditionally varied weld current is output by the fuzzy control. Finally, we experimentally demonstrate the effectiveness and correctness of the variable precision neighborhood rough set fuzzy control method.
The remainder of the paper is organized as follows: In Section 2, the basic introduction to the neighborhood rough set of variable precision is given. In Section 3, fuzzy control is introduced, and the basic steps of the control method are given. In Section 4, welding validation experiments are conducted using the proposed method. The conclusions are given in Section 5.

2. Materials and Methods

Theory and Method of Variable Precision Neighborhood Rough Sets

The classical rough set is suitable for dealing with discrete datasets, but the discretization procedure alters the original properties of the attributes, which can have an impact on knowledge reduction. The neighborhood rough set (Neighborhood-RS) is proposed to solve this problem. By combining variable precision rough set (VPRS) with neighborhood rough set (Neighborhood-RS), a variable precision neighborhood rough set (VPNRS) knowledge modeling method is proposed. Here are the concepts of δ-neighborhood, upper and lower approximations, dependence degree, attribute reduction, and attribute importance in the variable precision neighborhood rough set.
Definition 1
([15]). Define an N -dimensional space Ω where Δ :   R N × R N R , then Δ is said to belong to a metric on R N , if Δ satisfies:
  • Δ ( x 1 , x 2 ) 0 , Δ ( x 1 , x 2 ) = 0 , if and only if  x 1 = x 2 , x 1 , x 2 R N ;
  • Δ ( x 1 , x 2 ) = Δ ( x 2 , x 1 ) , x 1 , x 2 R N ;
  • Δ ( x 1 , x 3 ) Δ ( x 1 , x 2 ) + Δ ( x 2 , x 3 ) , x 1 , x 2 , x 3 R N .
We call < Ω , Δ > the metric space, and the distance on the metric space can be expressed as follows: Δ ( x i , x j ) = ( k = 1 N | x i k x j k | p ) 1 / p .
If p = 1 , Δ is the Hamiltonian distance. For p = 2 , Δ is the Euclidean distance. If p = , Δ is expressed as Chebyshev distance.
Definition 2
([15]). A nonempty finite set  U = { x 1 , x 2 , , x n }  on a metric space  Ω , whose δ-neighborhood is denoted by: δ ( x i ) = { x | x U , Δ ( x , x i ) δ } , where x U , δ 0 .
Definition 3
([16]). Let A  and B be two nonempty finite sets, and if  I ( A , B ) = c a r d ( A B ) / c a r d ( A )  is denoted, then  I ( A , B )  is the degree to which  A  is contained in  B .
Definition 4
([16]). Given a decision system < U , A , D >, where U  is the sample set,  A  is the condition attribute, and decision attribute  D  divides  U into  n  equivalence classes: X 1 , X 2 , , X n , B A and generates the neighborhood relation n B  on U  with β ( 0.5 , 1 ] , then the upper and lower approximations of decision D  with respect to attribute subset  B  are respectively:
N B β ¯ ( D ) = i = 1 n n B ¯ ( X i ) = { x i | I ( δ B ( x i ) , X i ) > 1 β , x i U } , N B β _ ( D ) = i = 1 n n B _ ( X i ) = { x i | I ( δ B ( x i ) , X i ) β , x i U } .
Similar to the definition of classical rough set, the lower approximation  N B β ( D )  of attribute subset  B  is the positive region  P O S B β ( D ) , and the irrelevant region of attribute subset B  is the negative region.
Definition 5
([2]). Define the decision system < U , A , D >, where U  is the set of samples, and the dependency degree of decision attribute D with respect to condition attribute B = A is defined as follows:
γ B ( D ) = c a r d ( P O S B ( D ) ) c a r d ( U )
It follows that γ B ( D ) is monotone, and if B 1 B 2 A , then γ B 1 ( D ) γ B 2 ( D ) γ A ( D ) .
Definition 6
([2]). Given a decision system < U , A , D >, B A and a B , we call B an attribute reduction of A that satisfies the following two conditions:
(1)
γ B ( D ) = γ A ( D ) .
(2)
a B , γ B a ( D ) < γ B ( D ) .
Definition 7
([2]). Set decision system < U , A , D >, B A , a B , then the importance of attribute a relative to decision attribute D in attribute subset B is defined as follows:
S i g ( a , B , D ) = γ B ( D ) γ B a ( D )
The neighborhood radius δ directly affects the determination of the positive region, and the positive region is also screened after adding the concept of variable precision. The forward greedy reduction idea is adopted in rough set attribute selection [17], which has the advantage of ensuring that the attributes with large importance are reserved first, that is, the core is not reduced, the reduction efficiency is high, and the classification accuracy after reduction is high. Based on the above theory and definition, we can give the Algorithm 1 as follows:
Algorithm 1. Reduction based on VPNRS model
Input: Decision table ( U , A , D ) , δ , β
Output: Reduction set r e d , S i g
1: Initialize r e d = , S i g = 0
2:     a A , normalize each attribute a i data separately
3: for each a i A r e d d o
4:   for each x U d o
5:     Compute the lower approximation according to Definition 4
6:   end for
7:   Compute S i g ( a i , r e d , D ) according to Definition 7
8:   Select attribute a k with maximum values { S i g ( a i , r e d , D ) }
9:   if S i g ( a k , r e d , D ) > 0 then
10:      r e d = r e d a k
11:      S i g = S i g ( a k , r e d , D )
12:   else
13:      break
14:   end if
15: end for

3. Description of Fuzzy Control System

Rough-fuzzy control is a combination of rough-set and fuzzy logic. It mainly targets the knowledge model of complex plants and implements the control of complex processes via reasoning and decision-making. The variable precision neighborhood rough-fuzzy control method for the welding penetration state mainly includes the following steps:
Step 1. Establish a decision information system for penetration states.
Step 2. The molten pool representation information is normalized.
Step 3. VPNRS molten pool representation information selection and classification rule acquisition.
Step 4. Fuzzy control model for the characteristic parameters of the molten pool.
Step 5. Fuzzy control model inference and decision making.

3.1. Establishment of Characterization Information of Weld Pool

When welding the molten pool characterization data acquisition, the idea is to obtain the molten pool images using passive vision sensors via the image processing techniques of molten pool image processing: grayscale conversion, median filtering, image segmentation, edge detection, outer rectangle, and molten pool size measurement.

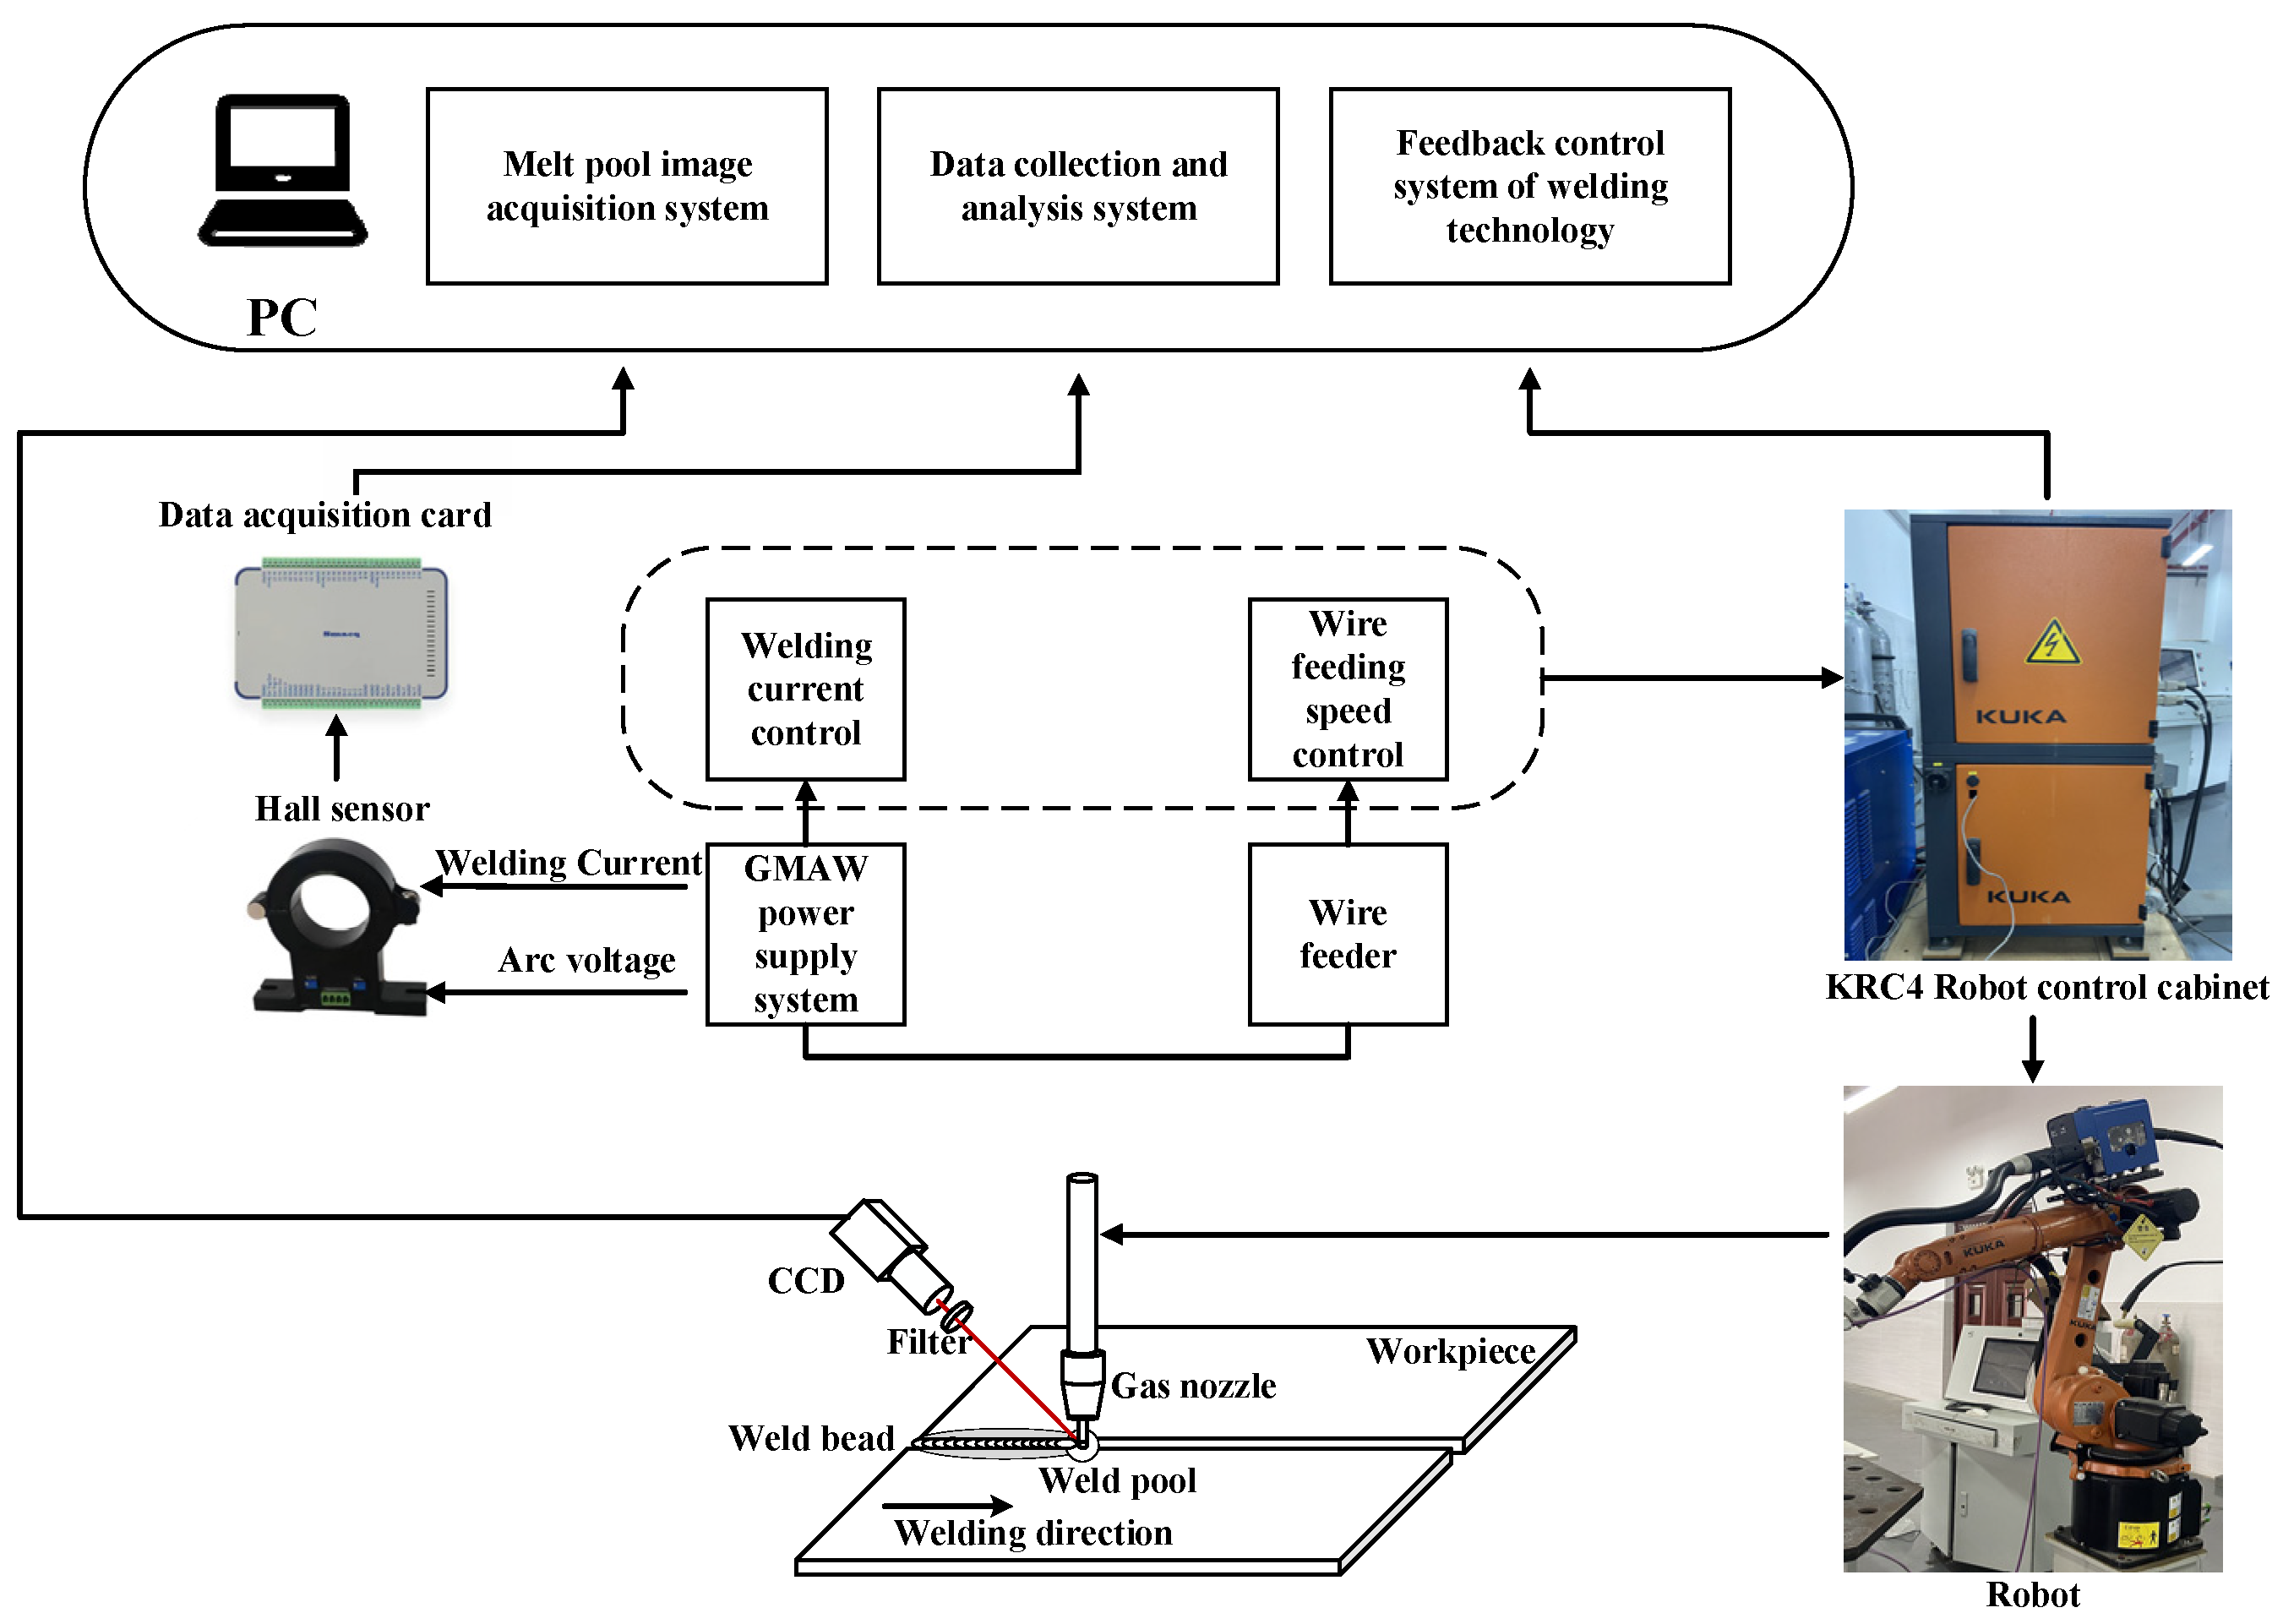
3.1.1. Experimental Data Acquisition System

As a hard conditioning facility, the visual sensing acquisition system is key to the overall approach and is used to collect images of the molten pool for subsequent feature extraction. The visual sensing system of the welding experiment designed in this paper mainly uses CCD (Charge Coupled Device) with an external trigger function to collect images. The camera is integrated with the water-cooled welding gun, and so is the shooting angle. Considering the influence of arc light on CCD image acquisition, a narrow band filter with a center wavelength of 660 nm and a bandwidth of ±10 nm is selected according to the specifications of CCD lens and the actual effect. A hall sensor and a data acquisition card are used to collect the current and voltage during welding. The overall structure of the experimental data acquisition setup is illustrated in Figure 1.

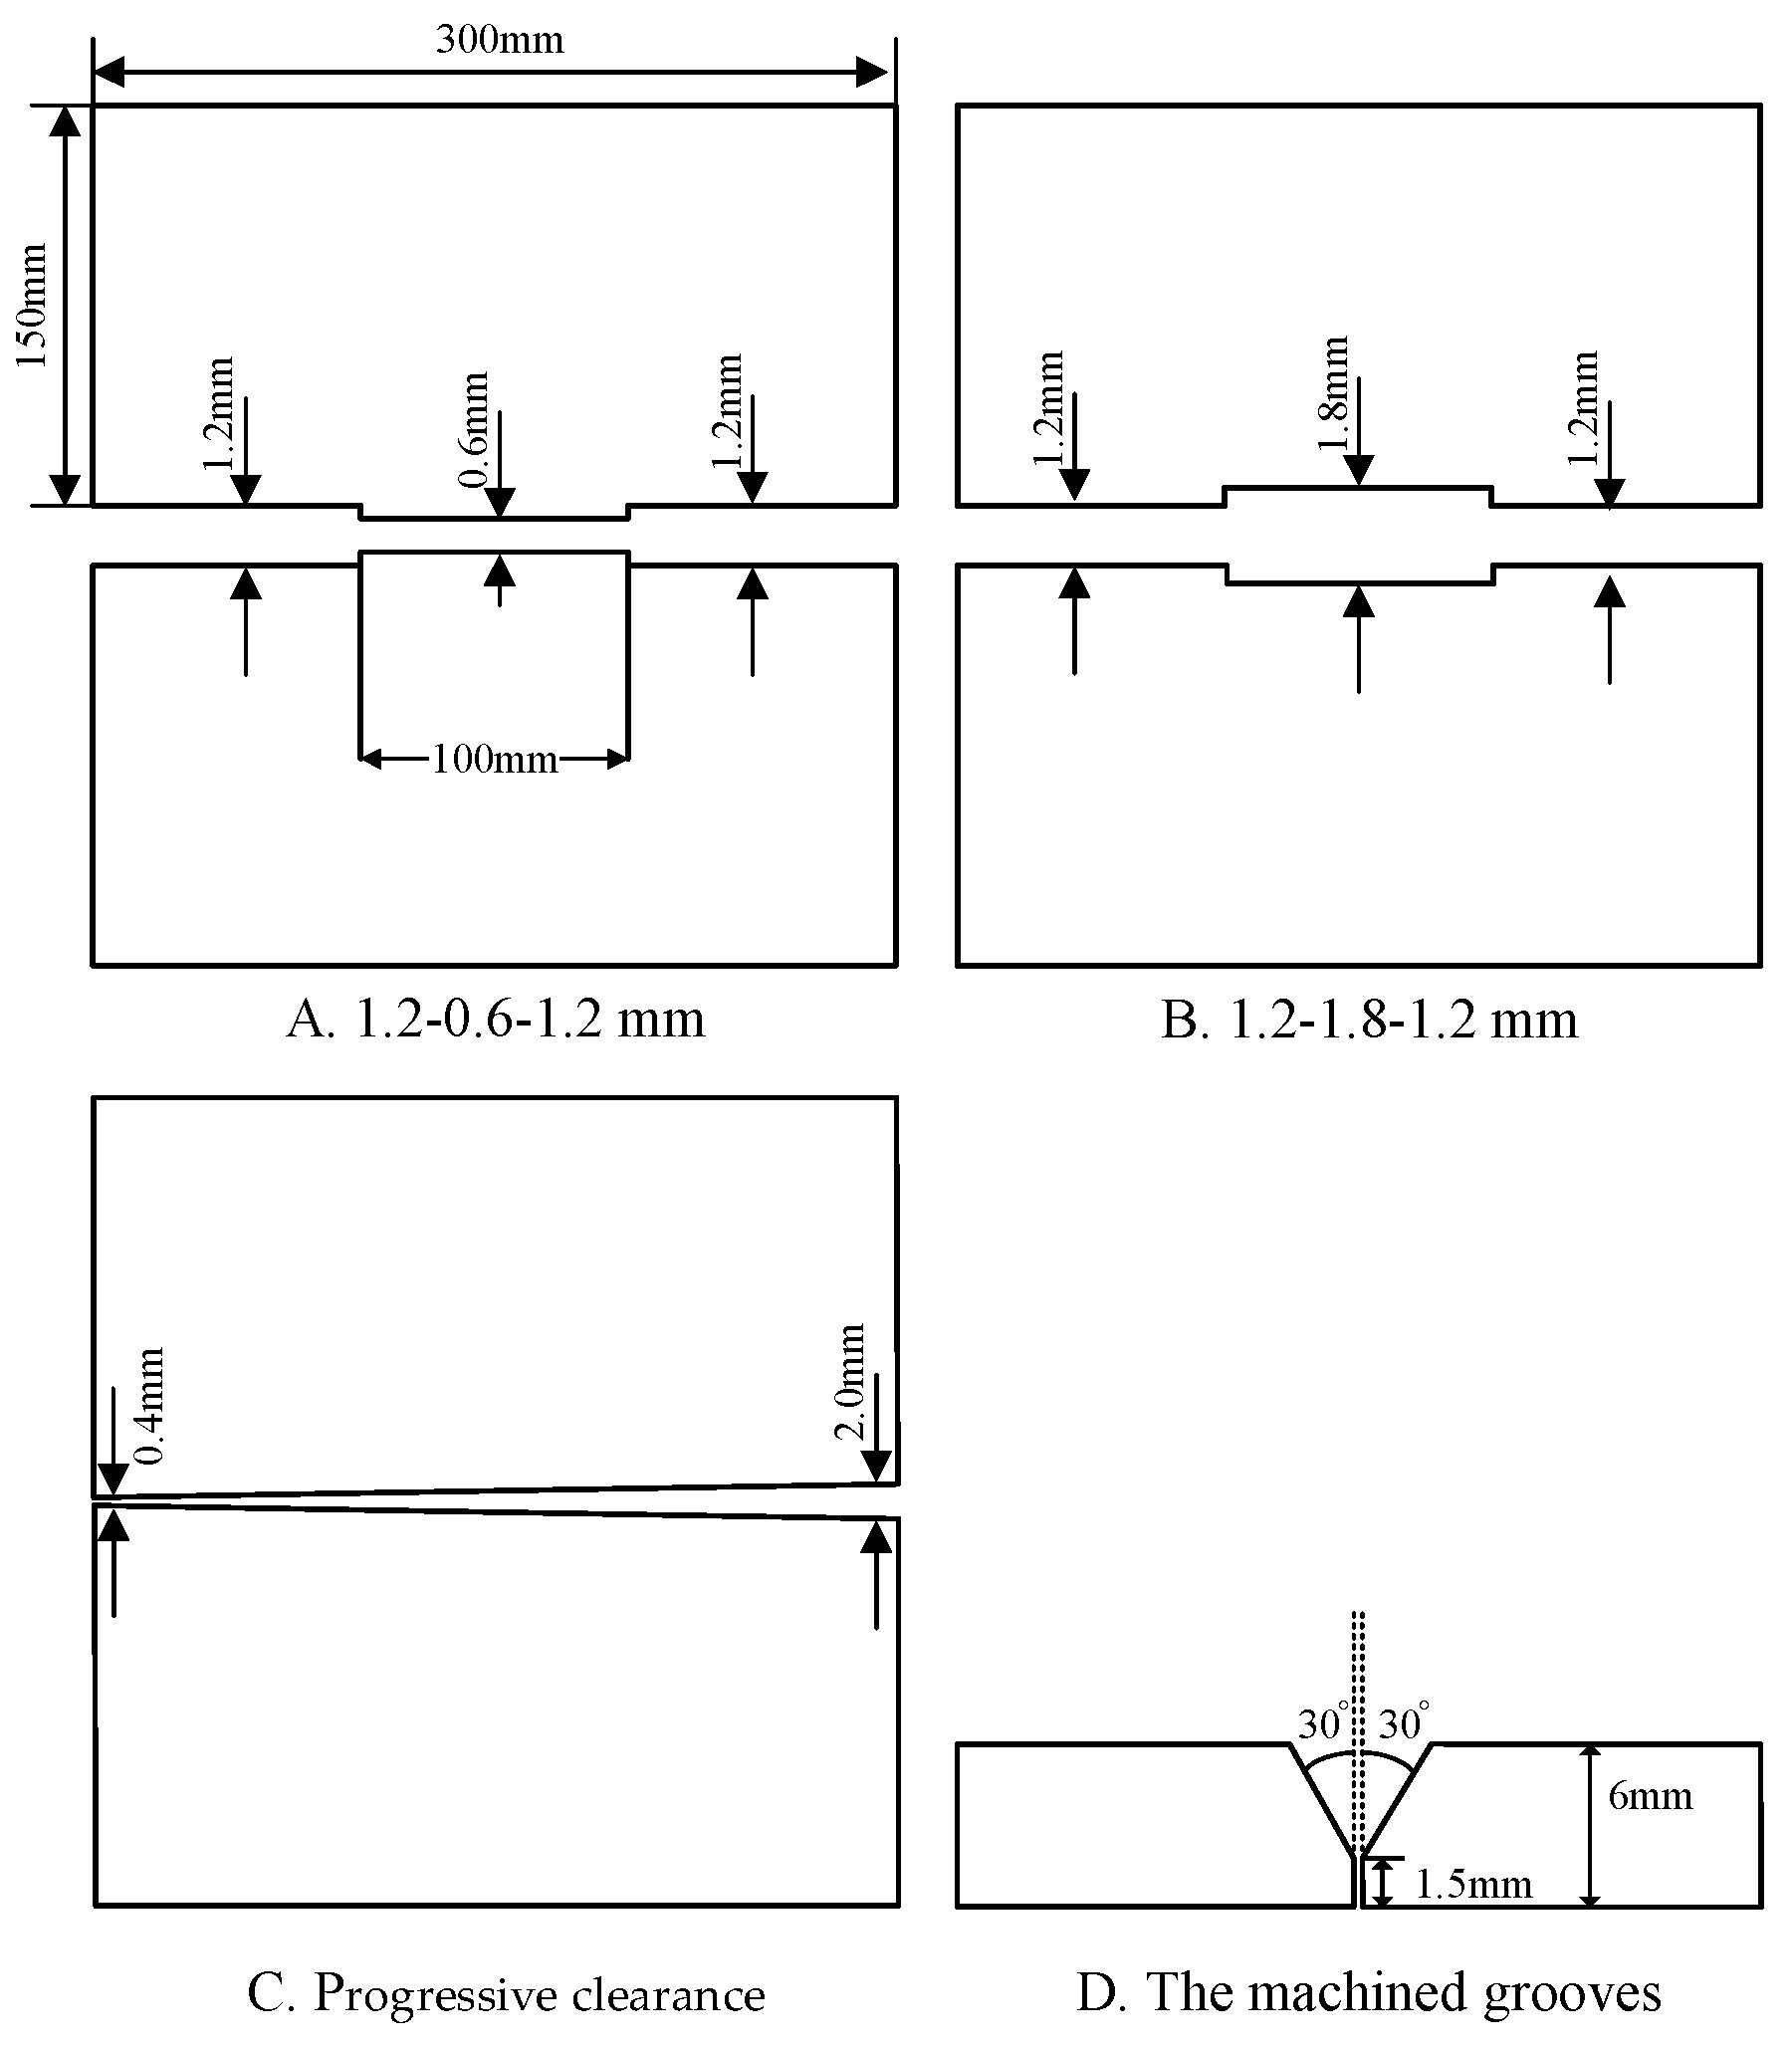
3.1.2. The Experiment of Representation Information Acquisition

In the welding characterization information acquisition test in this section, the diameter of the welding wire is 1.2 mm and the protection gas is 85% CO2 + 15% Ar. The specimen material is Q235 steel, and the specimen size is 300 mm × 150 mm × 6 mm. Flat plate variable gap butt welding forms were used to achieve single-edge welding and double-edge molding results before testing with an angle grinder to wash the oxide layer of the work surface, along with rust and steel laser cutting at the cutting site of the cut residue. During welding, the angle between the torch and the horizontal plane was 90°, and the dry elongation of the welding wire was 10 mm. The main welding parameters are given in Table 1.
Due to the fact that some of the geometrical features of the molten pool do not intuitively express the molten state of the pool, and that errors can arise in the control of the molten pool, rough set theory was introduced for experimental design. Under these welding process parameters, the welding current is I = {155, 165,185, 205, 215} A, the welding gap is {0.4, 0.7, 1.2, 1.7, 2.0} mm, and the vision sensor system is used to collect 25 groups of welding molten pool images. The continuous values of the conditional properties and the penetration states obtained after the procedure are shown in Figure 2.
During the welding process, the current is 155 A~215 A and the gap is 0.4 mm~2.0 mm. The penetration state is expressed as 0 for incomplete penetration, 1 for full penetration, 2 for over penetration, and 3 for burn through.

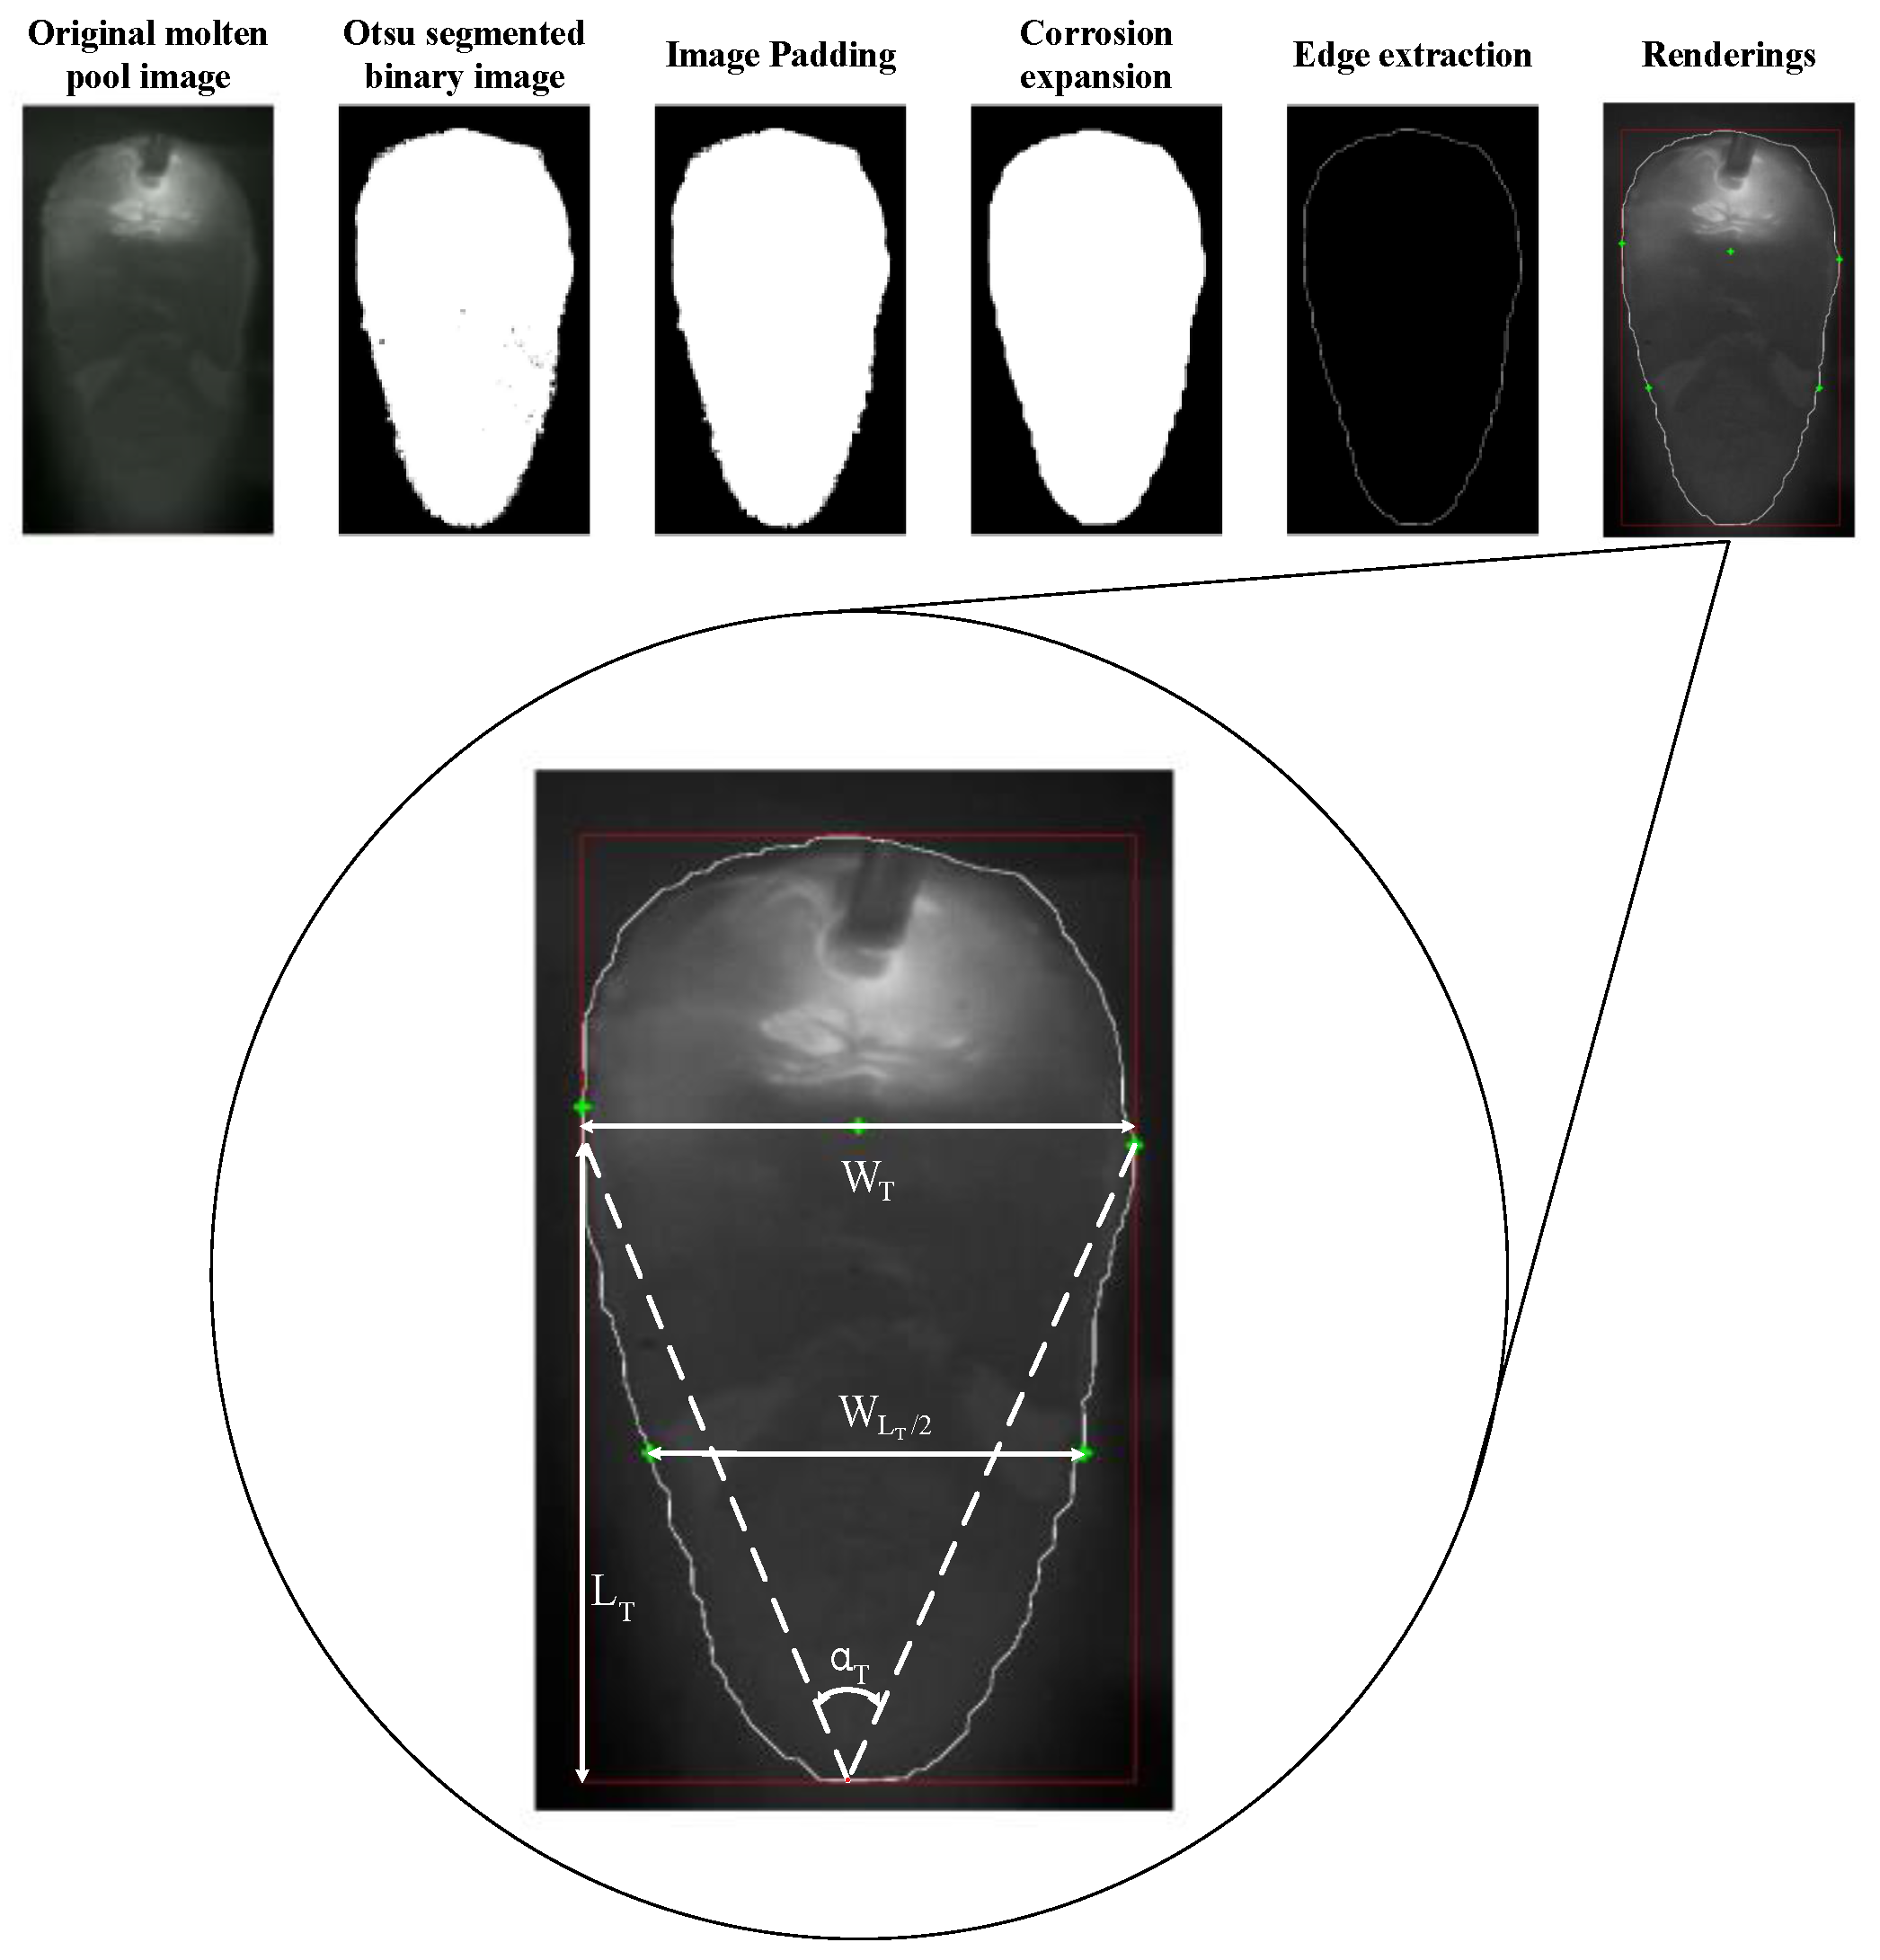
3.1.3. Representation Information Extraction

In traditional welding dynamic processes, it is impossible to directly observe the exact data of the weld pool. Therefore, visual monitoring is introduced in this paper to extract the weld pool data in the dynamic process of welding; the image processing algorithm is used to extract parameters such as the width of the weld pool, the length of the tail, the width of the tail, the area of the tail, the angle of the tail, and the area of the external rectangle. The rectangular area of the molten pool tail is defined as S R ( L T × W T ) . The molten pool tail length L T , molten pool tail width W T , molten pool tail length to width ratio R L W ( L T / W T ) , molten pool tail area S T , tail area coefficient C T S ( S T / S R ) , tail drag angle α T , and molten pool tail width coefficient C T W ( W T / W L T / 2 ) are selected as the geometric shape features of the molten pool. The image processing flow is shown in Figure 3.
In the experimental design, the variable gap-current welding data table can be obtained by image processing. Since there are two groups of welding penetration data in the table, welding penetration is not allowed to exist in the welding quality; therefore, we discard the two groups of data, as shown in Table 2.

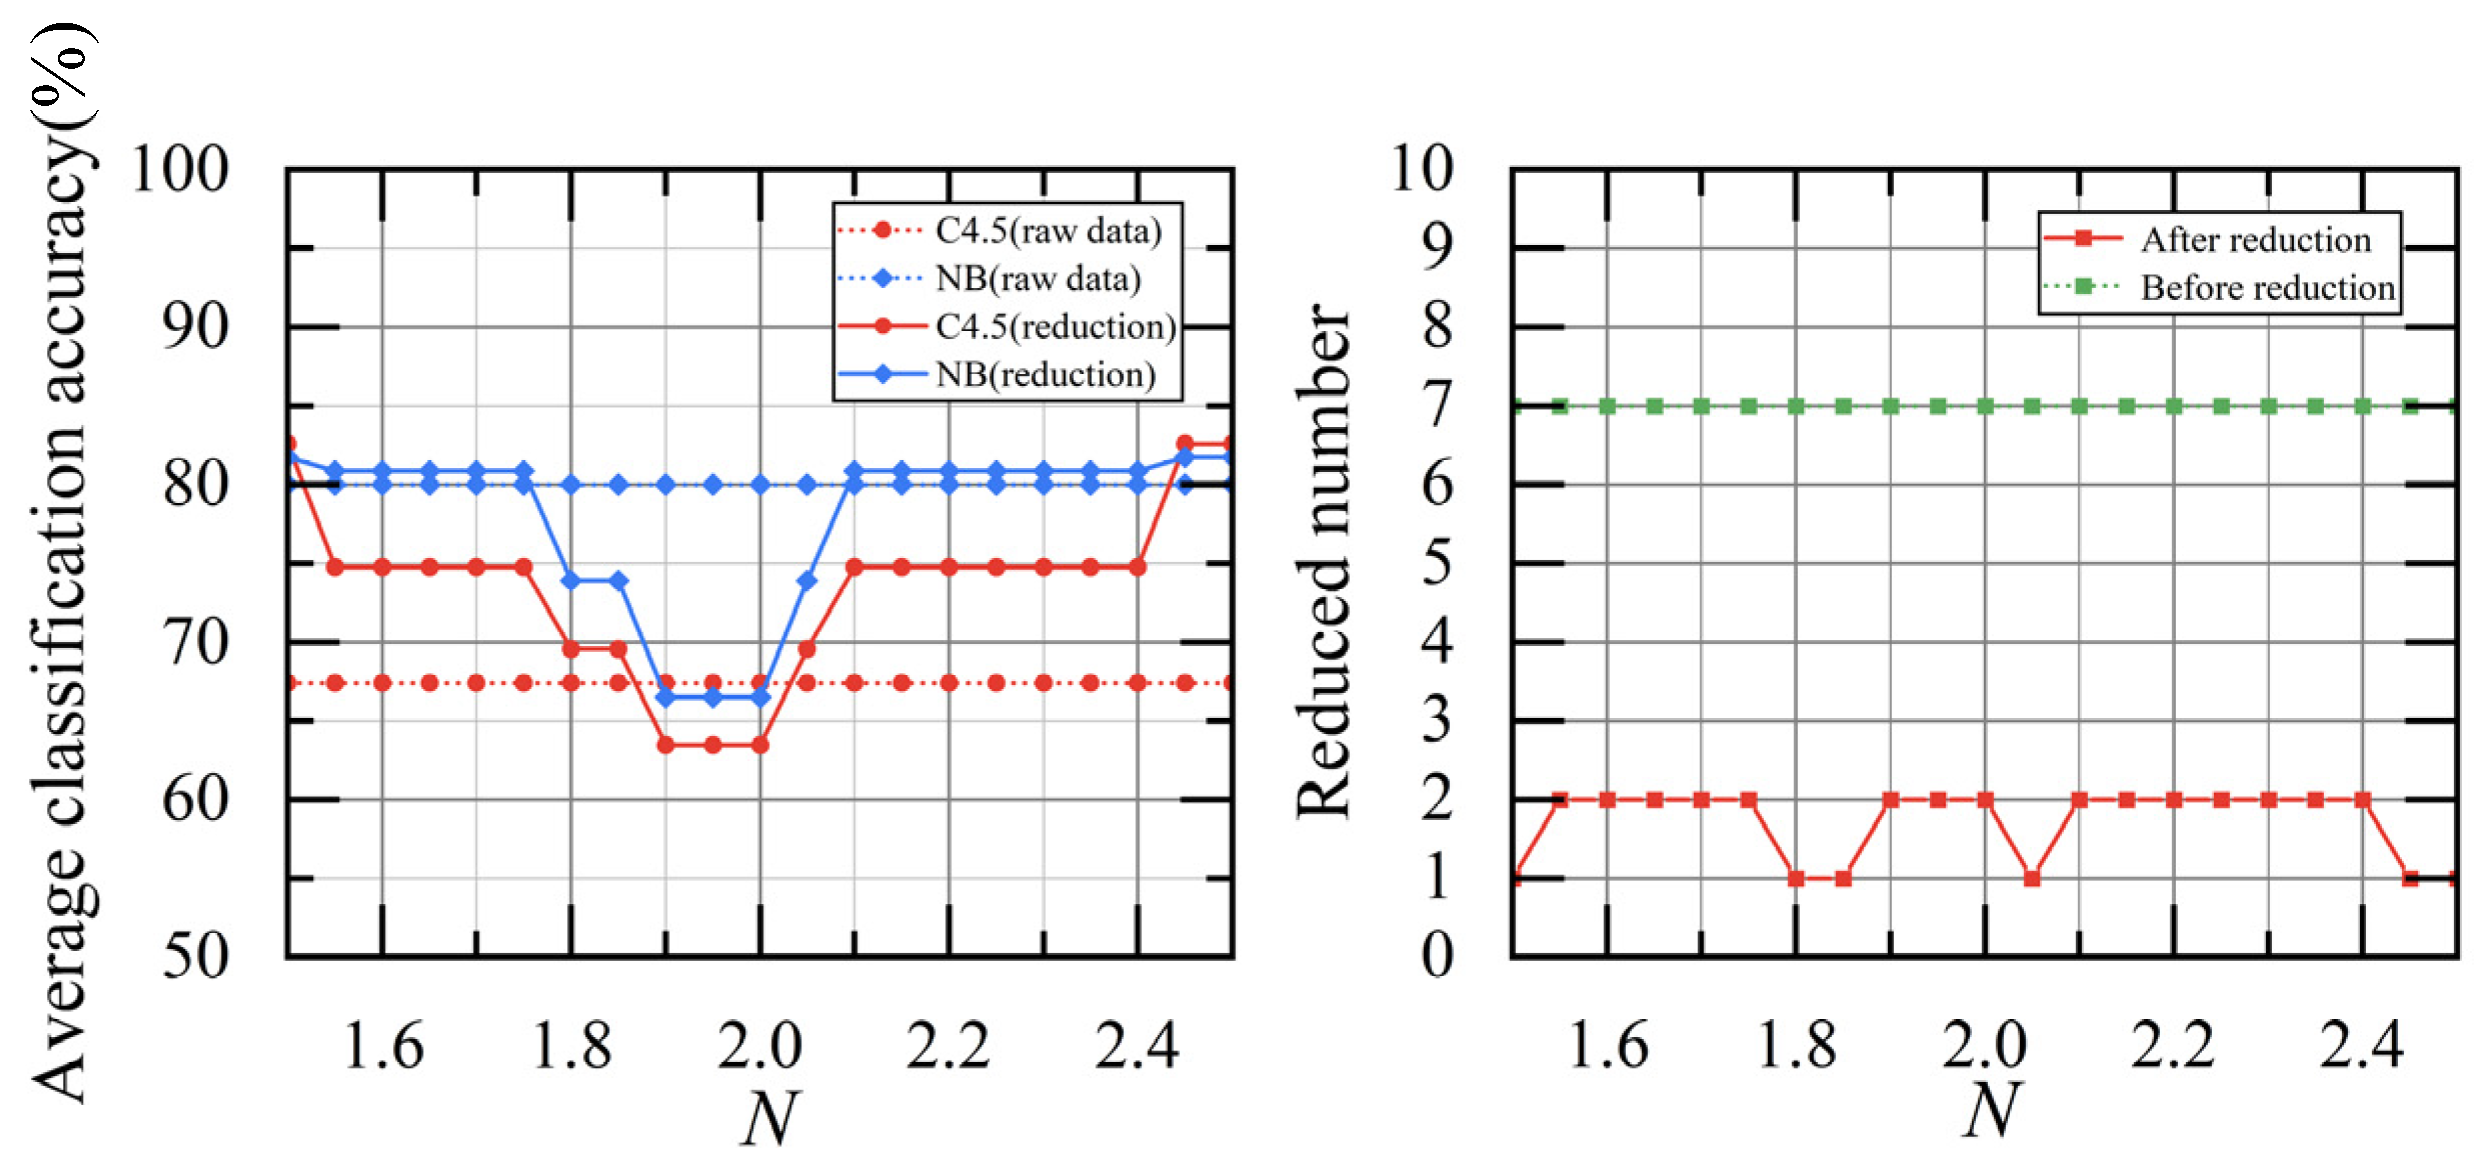
3.2. VPNRS Feature Extraction and Classification Rule Acquisition

In the neighborhood rough set, the size of the neighborhood is an important parameter in the neighborhood decision system. The size of the neighborhood determines the granularity of the domain information. Setting the neighborhood size threshold too high will cause the sample to be over-segmented, which will lead to less dependency of the decision attribute on the attribute. Standard deviation is a statistic that measures the dispersion of data. The smaller the standard deviation, the closer the data are to the mean. The larger the standard deviation, the further they are from the mean. The smaller the standard deviation, the smaller the neighborhood threshold needs to be. When the standard deviation is large, a larger threshold needs to be set. Therefore, S D / N is selected as the neighborhood δ size to set the threshold [18], where N is the control parameter. When processing data, it is necessary to normalize the data for each attribute separately. Normalizing the data does not affect the data distribution.
To verify the effectiveness of the VPNRS method, a description of the data in Table 2 is given in Table 3. Based on the sample number of data welding and the reduction output of the VPNRS algorithm, the appropriate parameter N range is set at [1.5–2.5], the step size is 0.05, and the variable precision threshold β is 0.8. In order to compare the classification ability of the selected features, the decision tree algorithm (C4.5) with elevated classification accuracy and the Naive Bayesian algorithm (NB) with stable classification are selected; the classification accuracy of 10-fold cross validation is used to evaluate the quality of the reduced features.
Welding data have seven condition attributes, all of which are numerical attributes. The reduction results corresponding to a different neighborhood radius δ are obtained by changing the parameter N and the classification accuracy of C4.5 and NB evaluation algorithms before and after reduction. As shown in Figure 4 (after data reduction and collation), the classification accuracy of the two algorithms for the original data is greater than 50%, which can be attributed to the high credibility of the experimental data.
In the selection of the neighborhood radius δ value, Hu et al. [17] specified the unique domain radius, while An et al. [19] selected different neighborhood radius δ sets for reduction combined with the actual situation; the effect of setting different neighborhood radius sets for reduction was better than the unique domain radius.
For the set of reductions obtained by the VPNRS algorithm, this paper hopes that the number of reductions is small and the effectiveness is high. Based on the reduction results, the amount of data shown in Figure 4, and the combination of the two evaluation algorithms, the better N parameter interval is set at [1.5,1.8], the number of attributes after reduction is 1–2, and the reduction condition attributes and importance within the range are shown in Table 4. Based on the analysis of the reduction condition attribute, importance degree, and accuracy rate of attribute classification in the range, N is set at 1.5; the minimum reduction set condition attribute 5, namely tail area coefficient C T S , is used as the input of the fuzzy control system.
Set X i = U / R e d , Y j = U / d to be the condition class and decision class derived by R e d and d for partitioning U , respectively. For any x i X i , y Y i , by discretizing the data in Table 2, the data of C T S characteristic parameters after discretization are shown in Table 5; the classification rules for determining the welding penetration state according to the C T S characteristic parameters are as follows:
D E C ( X i ) D E C ( Y j ) ( C o n f i j )
where D E C ( X i ) = c R e d ( c = c ( x ) ) , D E C ( Y j ) = ( d = d ( y ) ) , C o n f i j = | X i Y j | / | X i | is the rule confidence.
By discretizing the data, the penetration state and attribute C T S rules can be extracted:
Rule 1.
The area coefficient of the molten pool tail is large, and the weld is not fully penetrated ( C o n f = 1 ).
Rule 2.
In the area coefficient of the molten pool tail, the weld is thoroughly penetrated ( C o n f = 7 / 9 ).
Rule 3.
The area coefficient of the molten pool tail is small, and the weld is over-penetrated ( C o n f = 6 / 8 ).

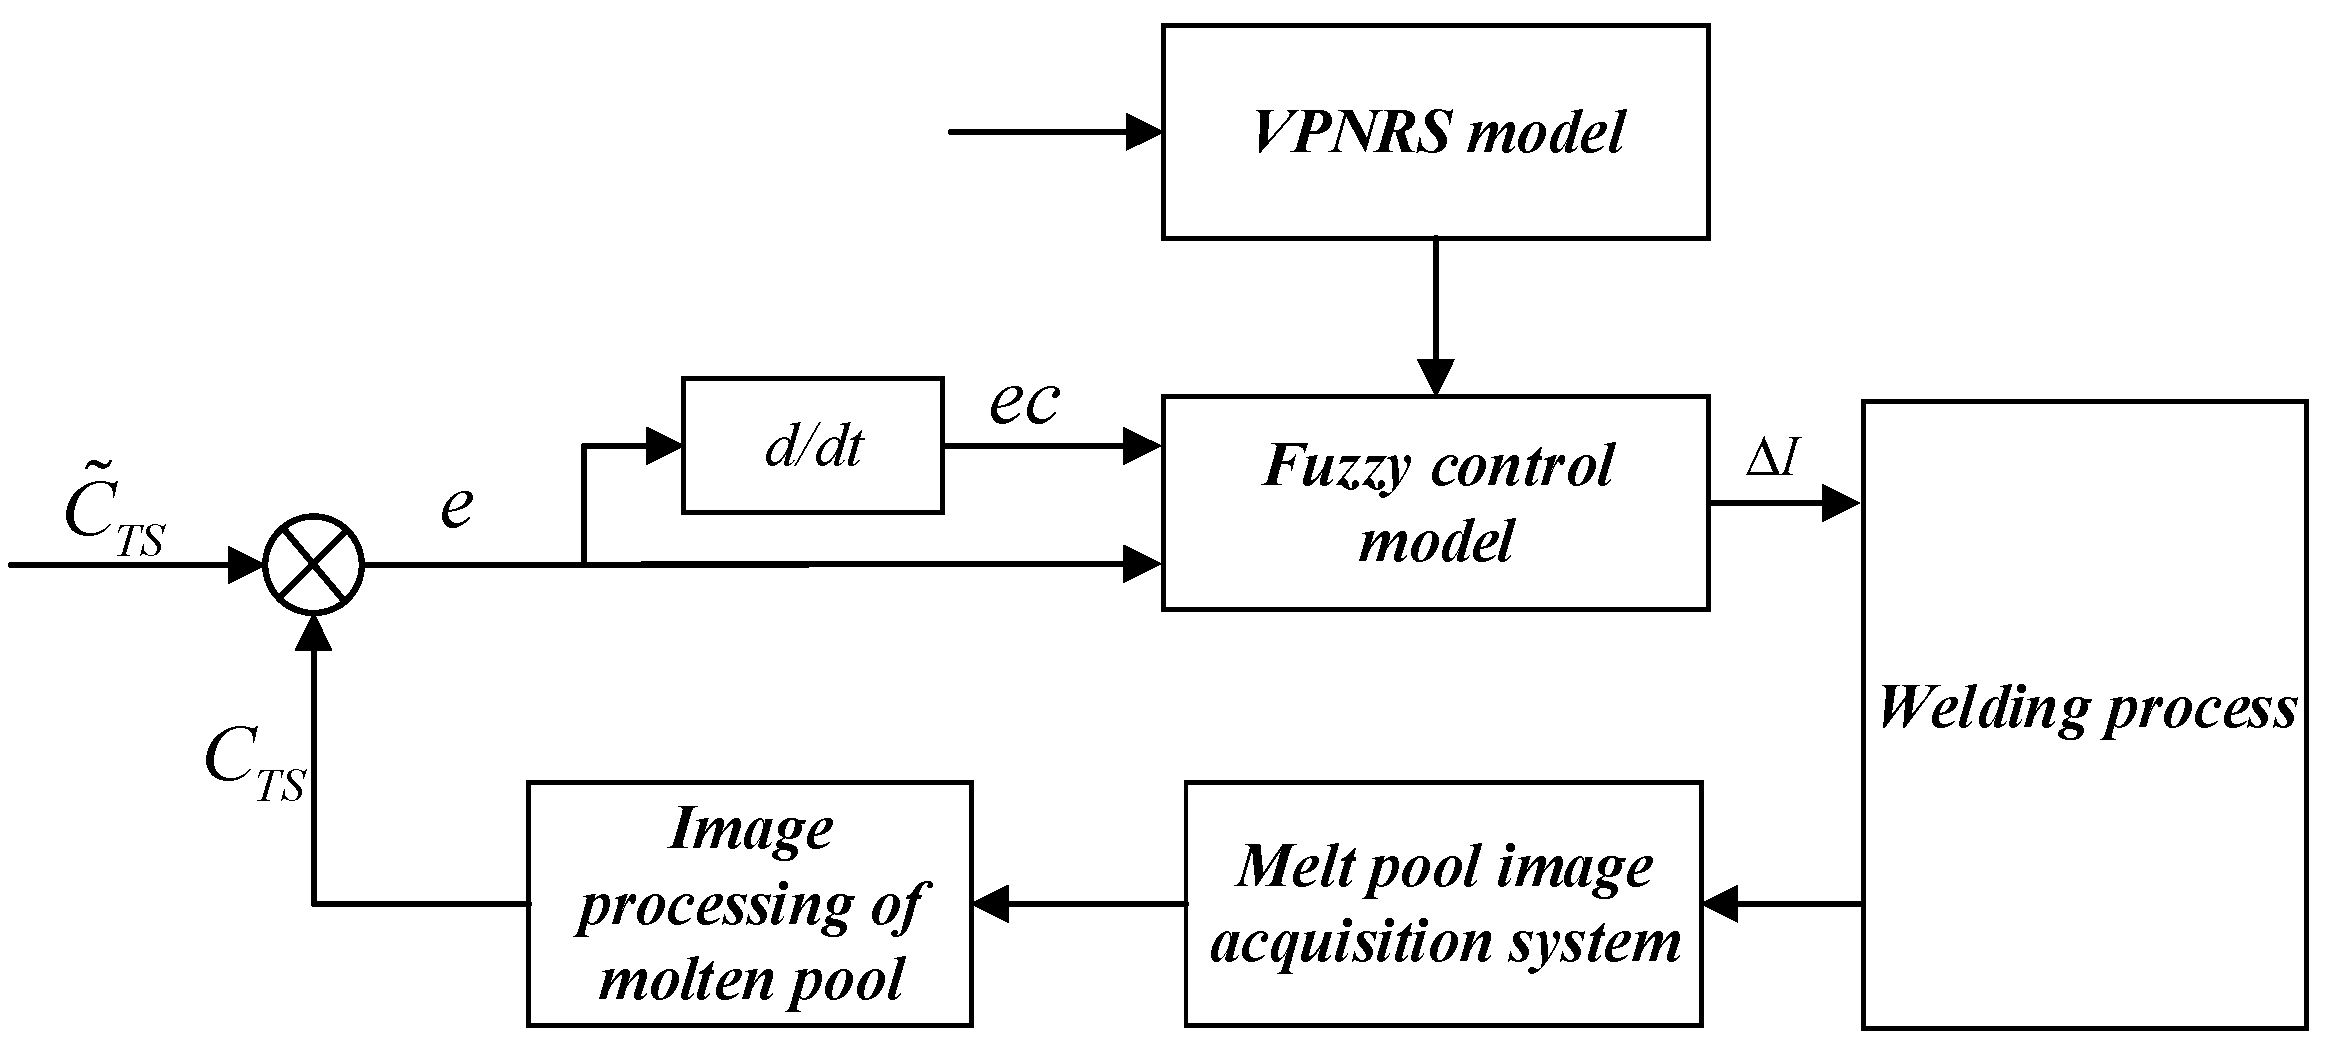
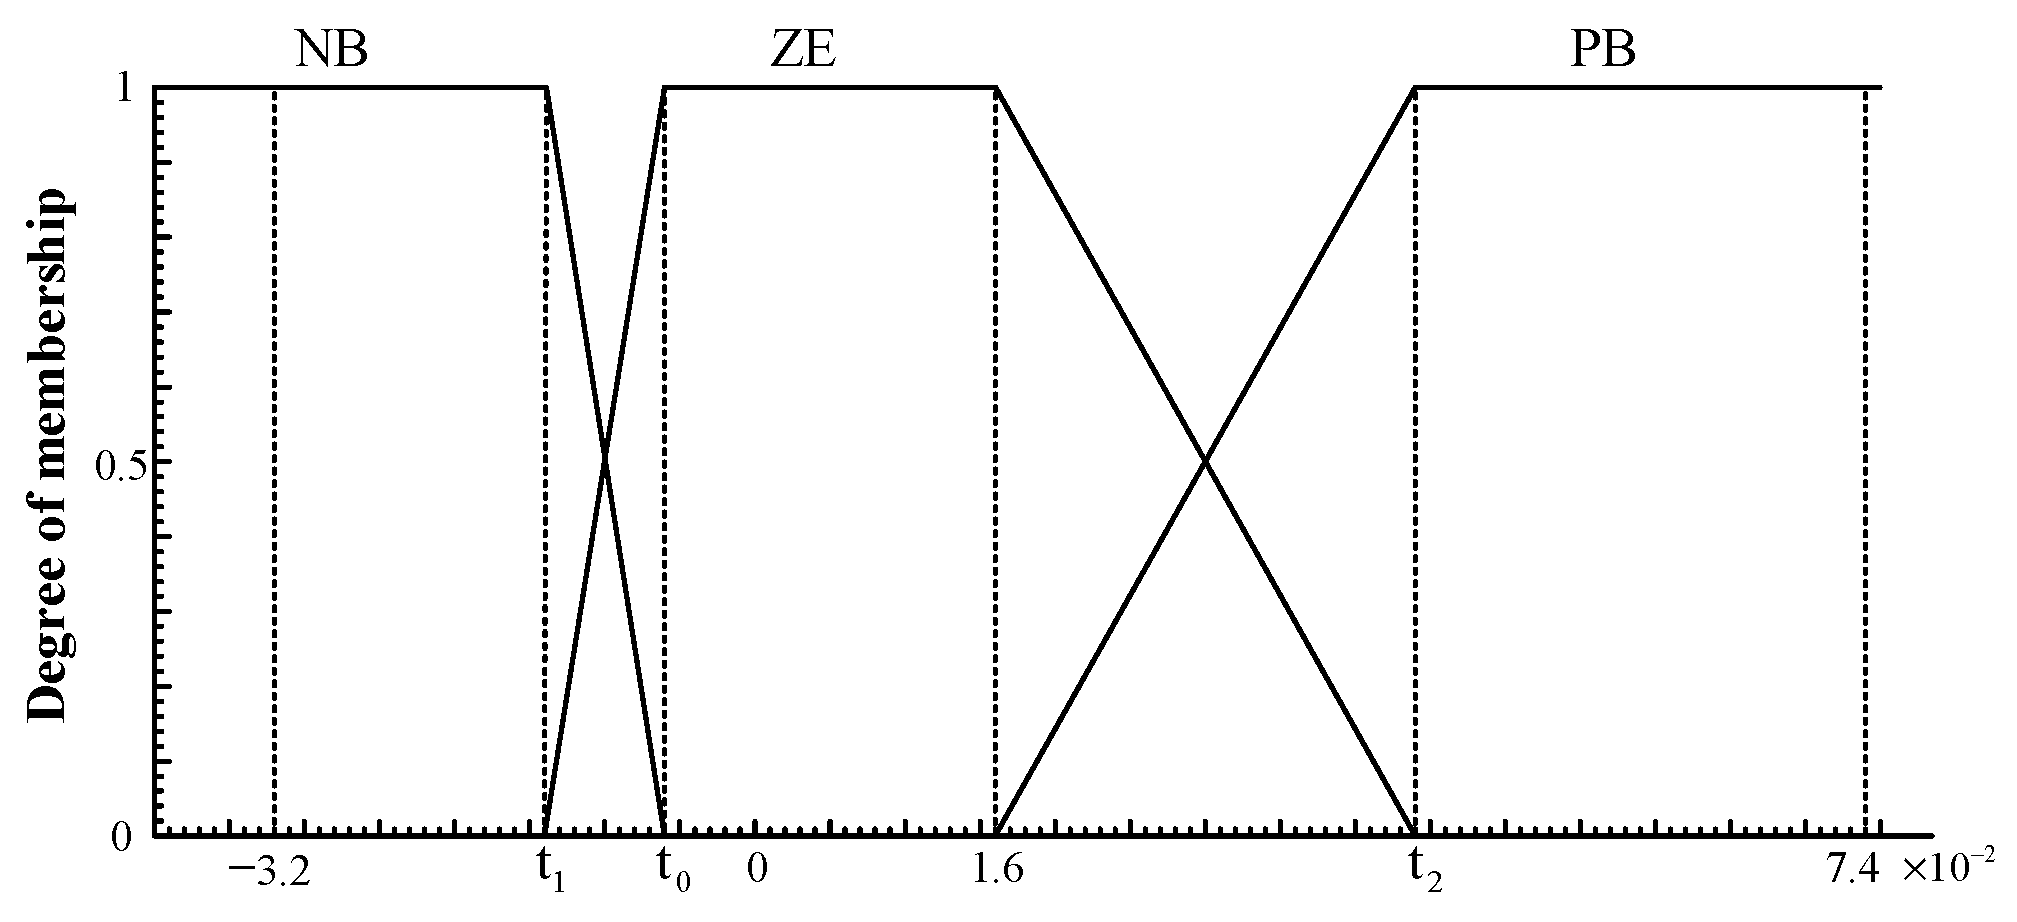
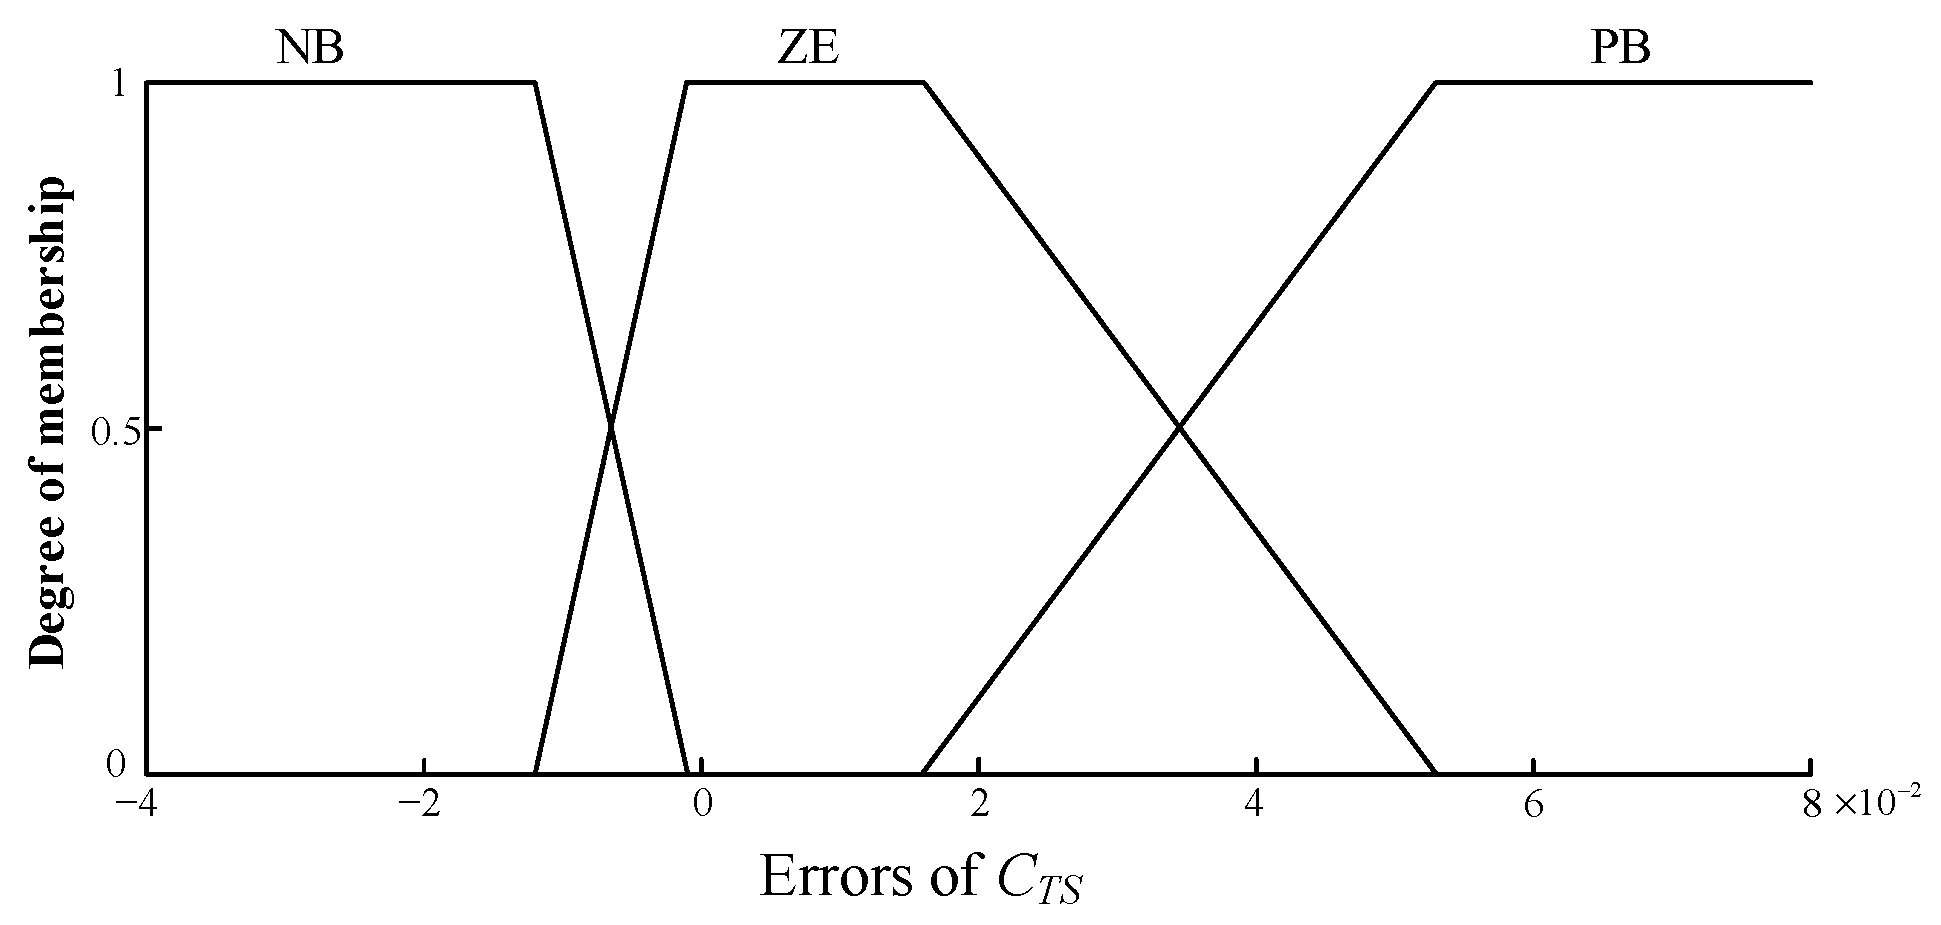
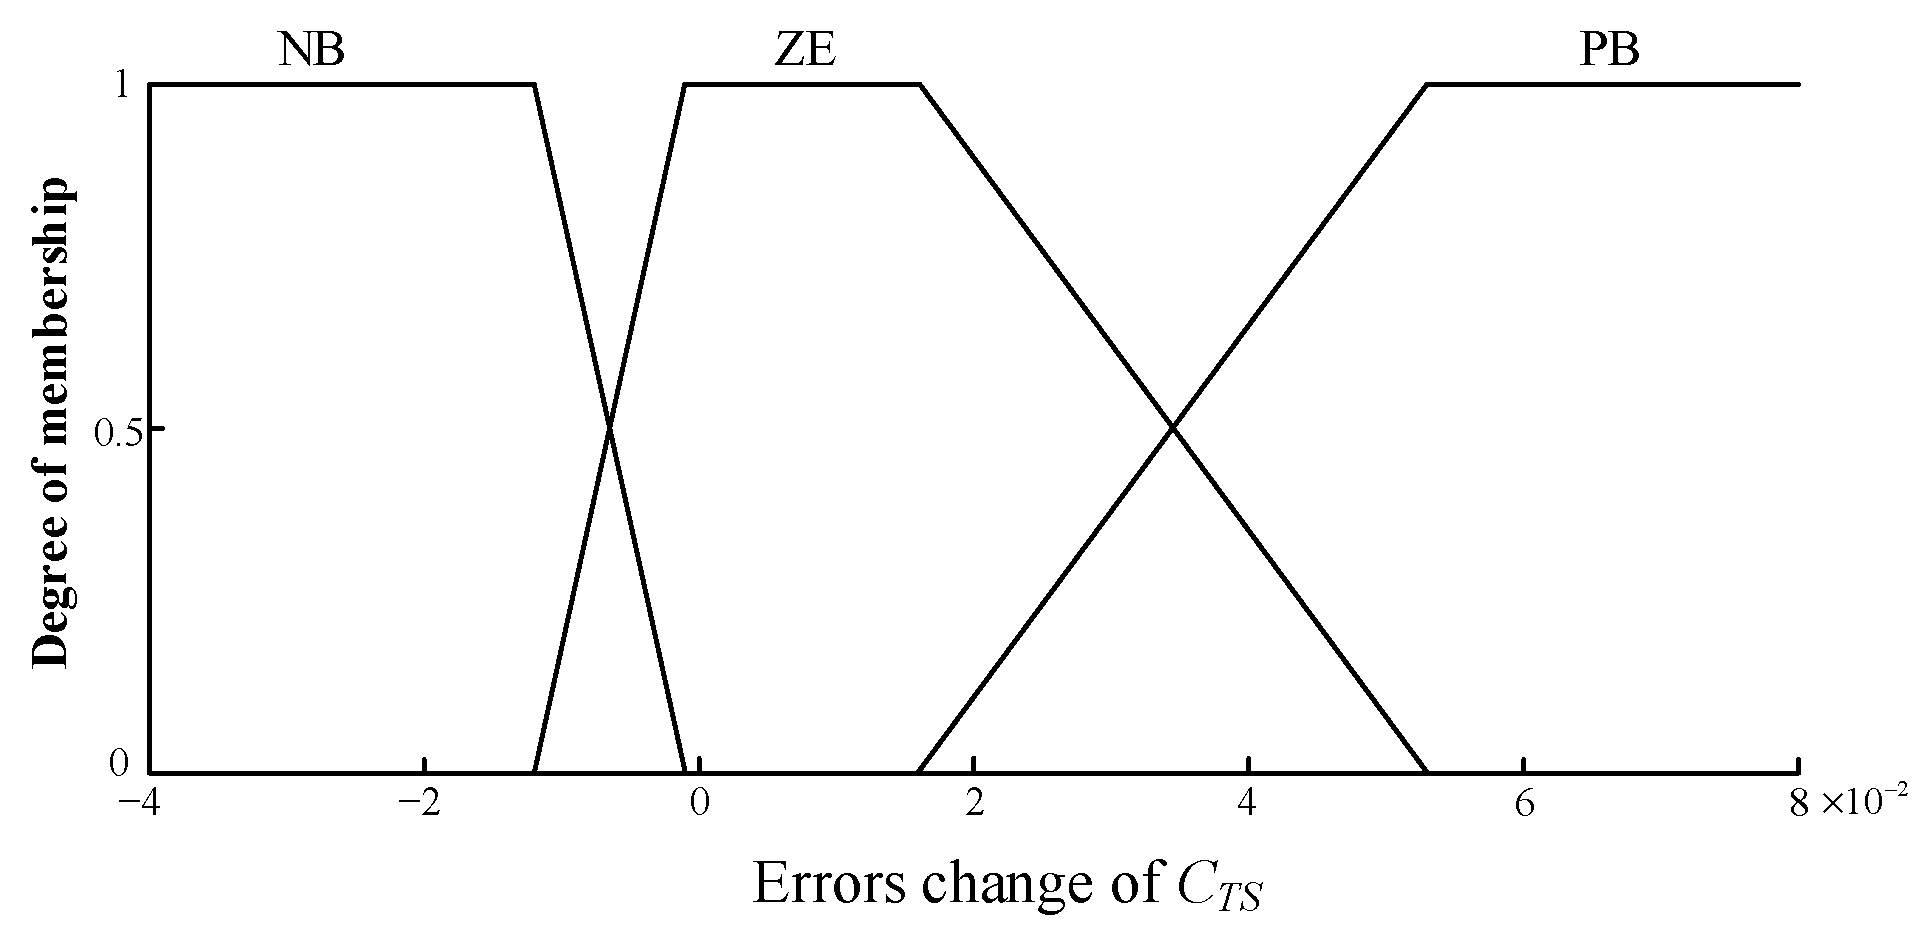
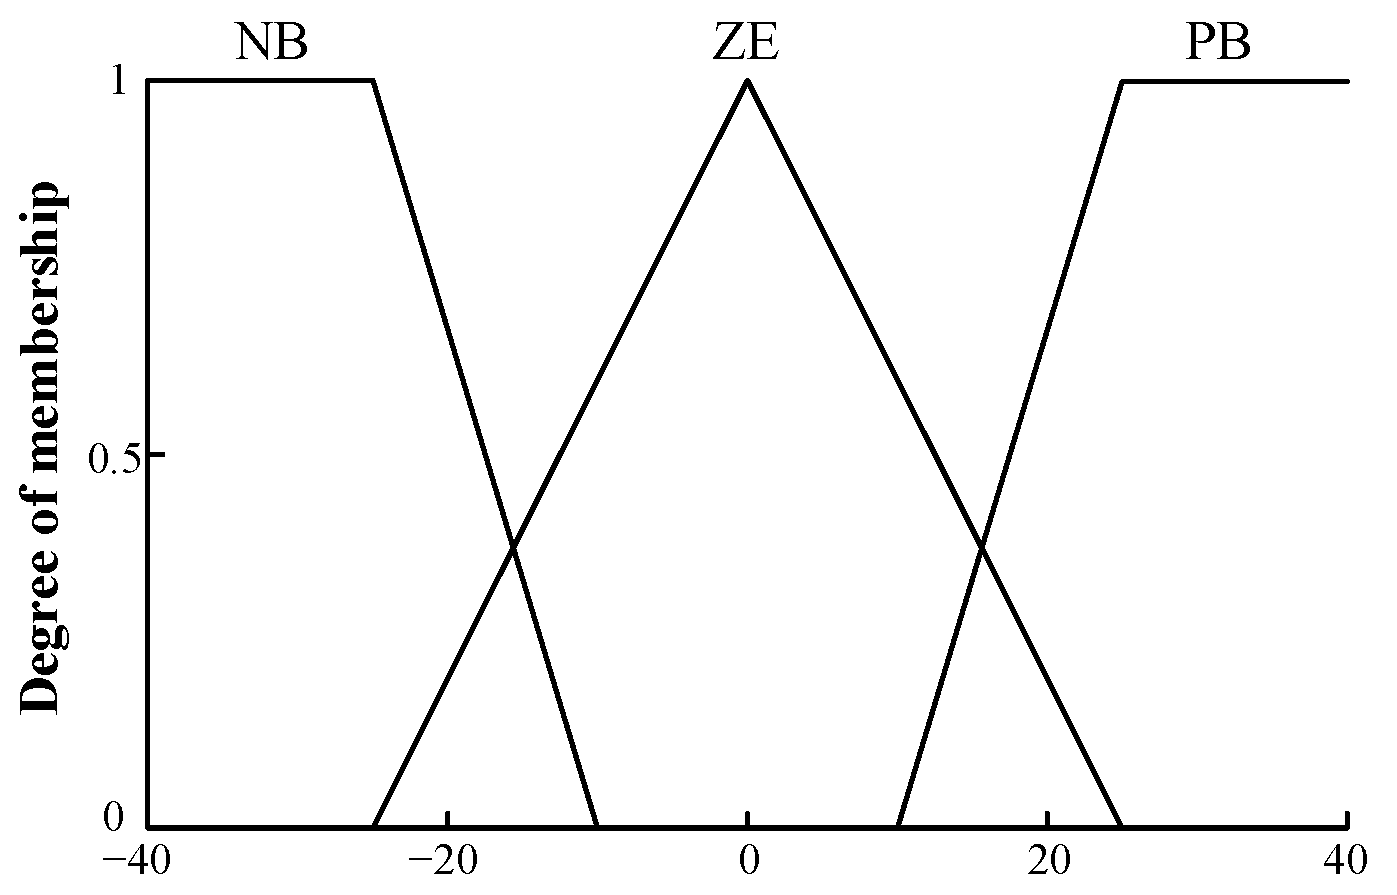
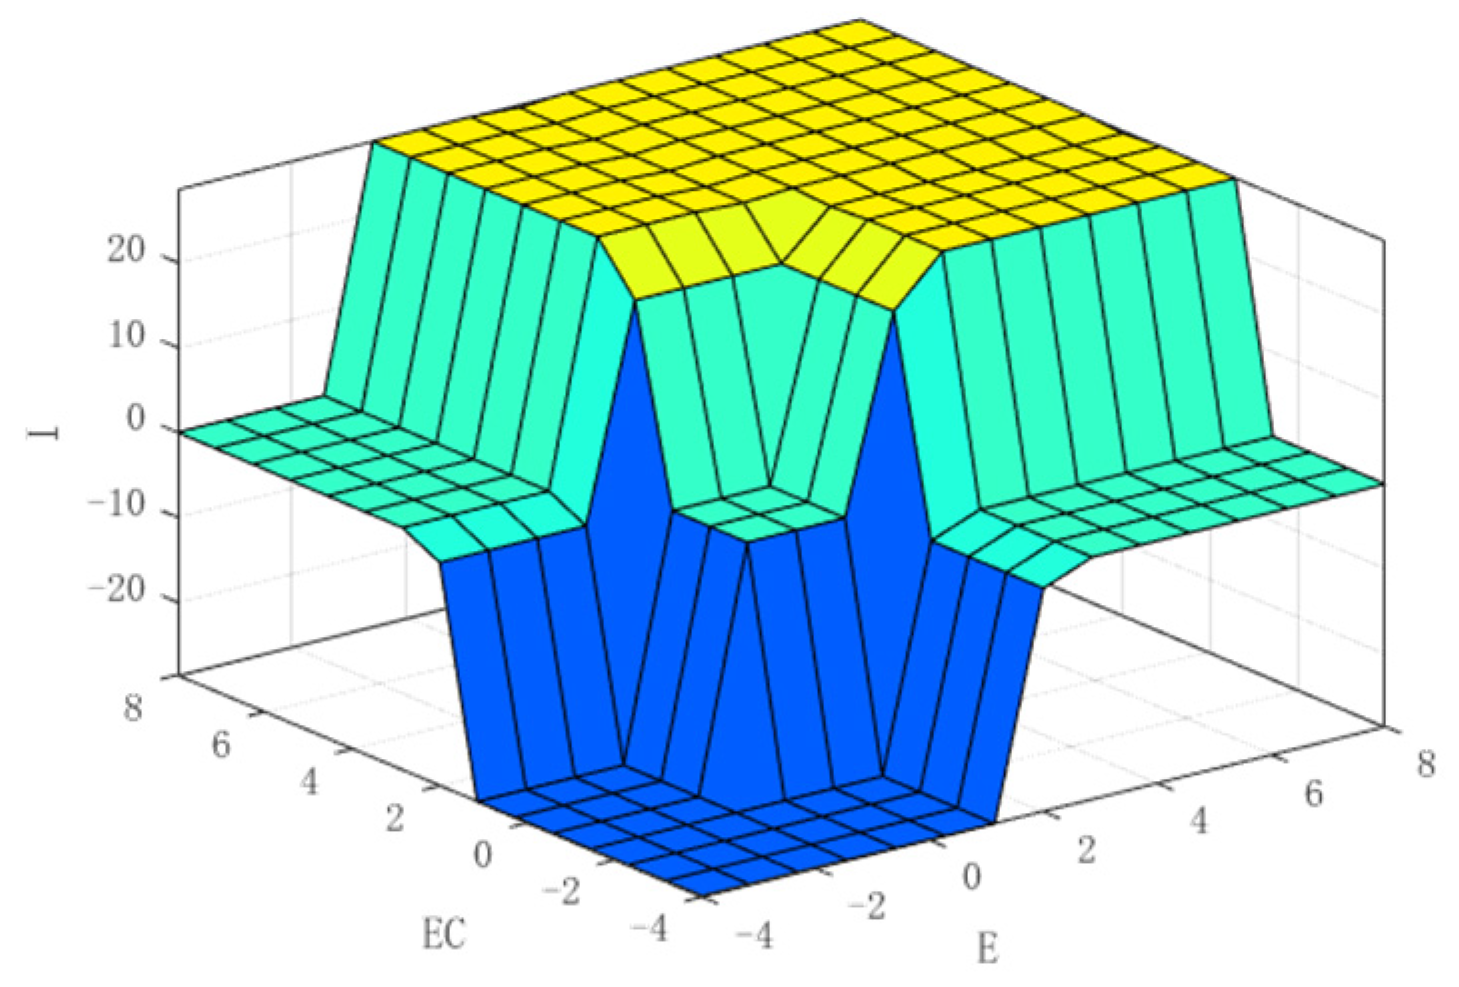
3.3. Establishment of Fuzzy Control System

Fuzzy control is an intelligent control method based on fuzzy set theory, fuzzy linguistic variables, and fuzzy approximate inference. At its core is the use of expert experience and rational countermeasures in a complex process. Mamdani fuzzy model, Sugeno fuzzy model, and Tsukamoto fuzzy model are three widely used fuzzy systems. In this paper, we use Mamdani’s method to build a fuzzy control system.
By observing the data in Table 2, a single variable fuzzy control model with the area coefficient of the molten pool as the controlled object can be established, as shown in Figure 5. The input variables are the error E and the error change rate E C of the area coefficient of the molten pool tail C T S , and the output variable is the welding current increment. The expressions of area coefficient error E and error change rate E C at the end of the molten pool are as follows:
E = C T S C ˜ T S
E C = E n E n 1
C T S is the measured value of the tail area coefficient of the molten pool, and C ˜ T S is the expected value of the tail area coefficient when the welding condition current is 185 A and the gap is 1.2 mm. E n and E n 1 are the elements in sequence E .
According to the data in Table 2, the area coefficient of the molten pool tail under different penetration states can be obtained, and the fuzzy subset on the error universe E and error change rate E C can be defined by establishing the optimization model of minimizing fuzzy entropy. From the measured values in Table 2, by calculating the error between the C T S measured value and the expected value C ˜ T S (the value obtained when the welding current is 185 A and the gap is 1.2 mm), each error class is as follows:
[ E ] N B = { 0.055 , 0.041 , 0.040 , 0.039 , 0.033 , 0.022 , 0.012 , 0.010 } ; [ E ] Z E = { 0.006 , 0.001 , 0.003 , 0.007 , 0.019 , 0.021 , 0.027 , 0.029 , 0.044 } ; [ E ] P B = { 0.050 , 0.053 , 0.071 , 0.078 , 0.088 , 0.100 } ;
The cluster centers of each error obtained by FCM clustering are as follows: e ¯ N B = 0.032 , e ¯ Z E = 0.016 , e ¯ P B = 0.074 .
Let the value range of error E be [ 0.060 , 0.11 ] ; the membership functions of E with respect to each fuzzy subset NB, ZE, and PB are trapezoidal fuzzy distributions, as shown in Figure 6. Based on the actual data volume, experience, and three undetermined parameters ( t 0 , t 1 , t 2 ), select the trapezoidal membership function with the best adaptability to the welding process. As shown, where t 0 ( 0.006 , e ¯ Z E ) , t 1 ( e ¯ N B , 0.01 ) and t 2 ( 0.05 , e ¯ P B ) .
To establish the appropriate fuzzy membership function, dozens of methods have been proposed to determine the membership function. The objectivity of the sharpness of things can be measured by the ambiguity of the fuzzy set. The smaller the fuzziness, the greater the grasp of the substance of the problem.
Based on the actual welding experiment data, the minimum fuzziness method is used to determine the membership function. Set E = { E 1 , E 2 , , E 22 } = { 0.055 , 0.041 , , 0.100 } E , use fuzzy entropy to evaluate the fuzziness of fuzzy sets, and establish the optimization model as follows:
min D ( N B , Z E , P B ) = 1 23 ln 2 i = 1 23 ( d ( N B ( E i ) ) + d ( Z E ( E i ) ) + d ( P B ( E i ) ) ) s . t
N B ( E ) = { 1 E t 1 t 0 E t 0 t 1 t 1 < E t 0 0 others
Z E ( E ) = { E t 1 t 0 t 1 t 1 < E t 0 1 t 0 < E e ¯ Z t 2 E t 2 e ¯ Z e ¯ Z < E t 2 0 others
P B ( E ) = { 1 E t 2 E e ¯ Z t 2 e ¯ Z e ¯ Z E < t 2 0 others
Among them:
d ( x ) = { x ln x ( 1 x ) ln ( 1 x ) , x ( 0 , 1 ) 0 , x = 0   or   1
To solve the optimization problem: t 0 = 0.001 , t 1 = 0.012 , t 2 = 0.053 . The membership function curve of error E is shown in Figure 7. Similarly, the fuzzy membership function of the error rate of change E C is shown in Figure 8. The fuzzy value distribution of the error rate of change E C is consistent with the error E distribution.
Set the range of Δ I to [ 40 , 40 ] A, define the fuzzy distribution of NB, ZE, and PB, and give the fuzzy membership function, as shown in Figure 9.
Based on the attribute C T S and percolation state rules, combined with the general operation experience of experts in controlling the shape and size of the molten pool, the nine fuzzy control rules based on the IF-THEN formalism are shown in Table 6. The input-output relationship can then be represented as a nonlinear surface, as shown in Figure 10.
3D space diagram after fuzzy inference relationship between E , E C , and Δ I , 3D space diagram after fuzzy inference.

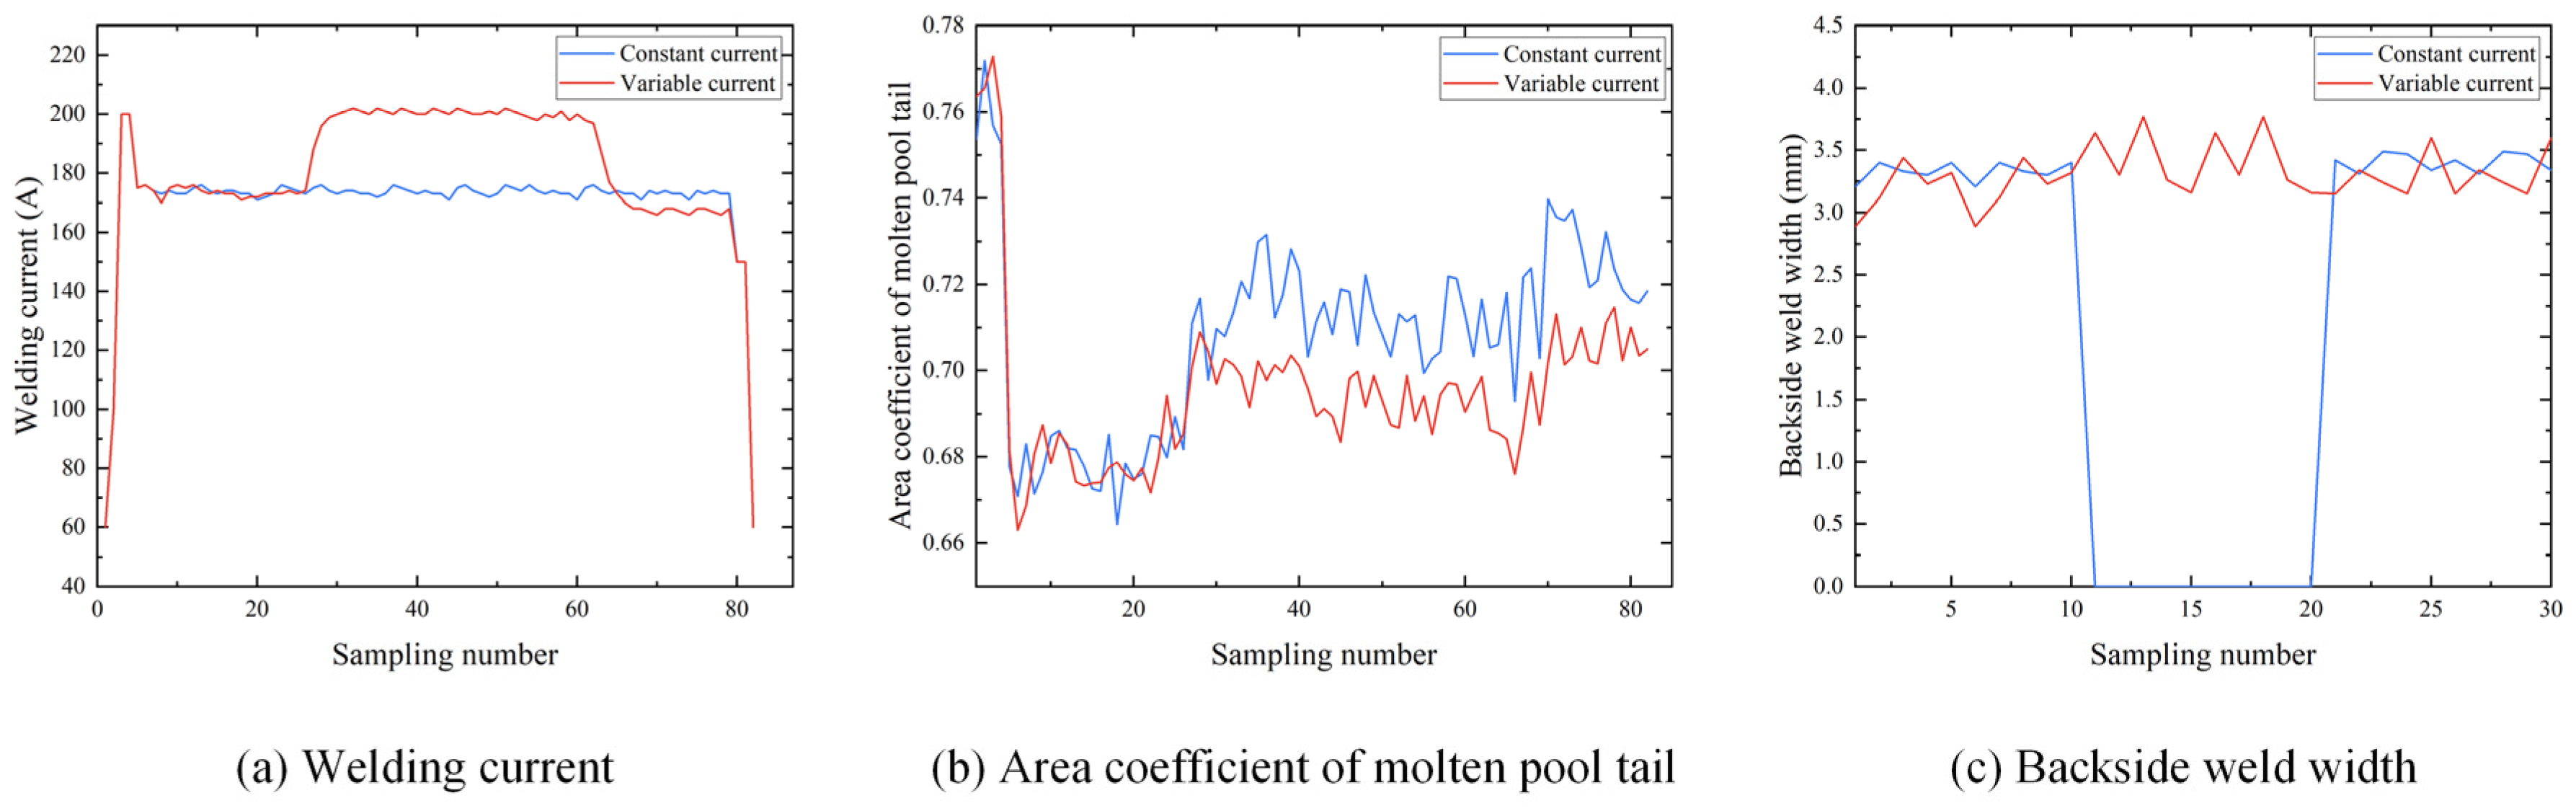
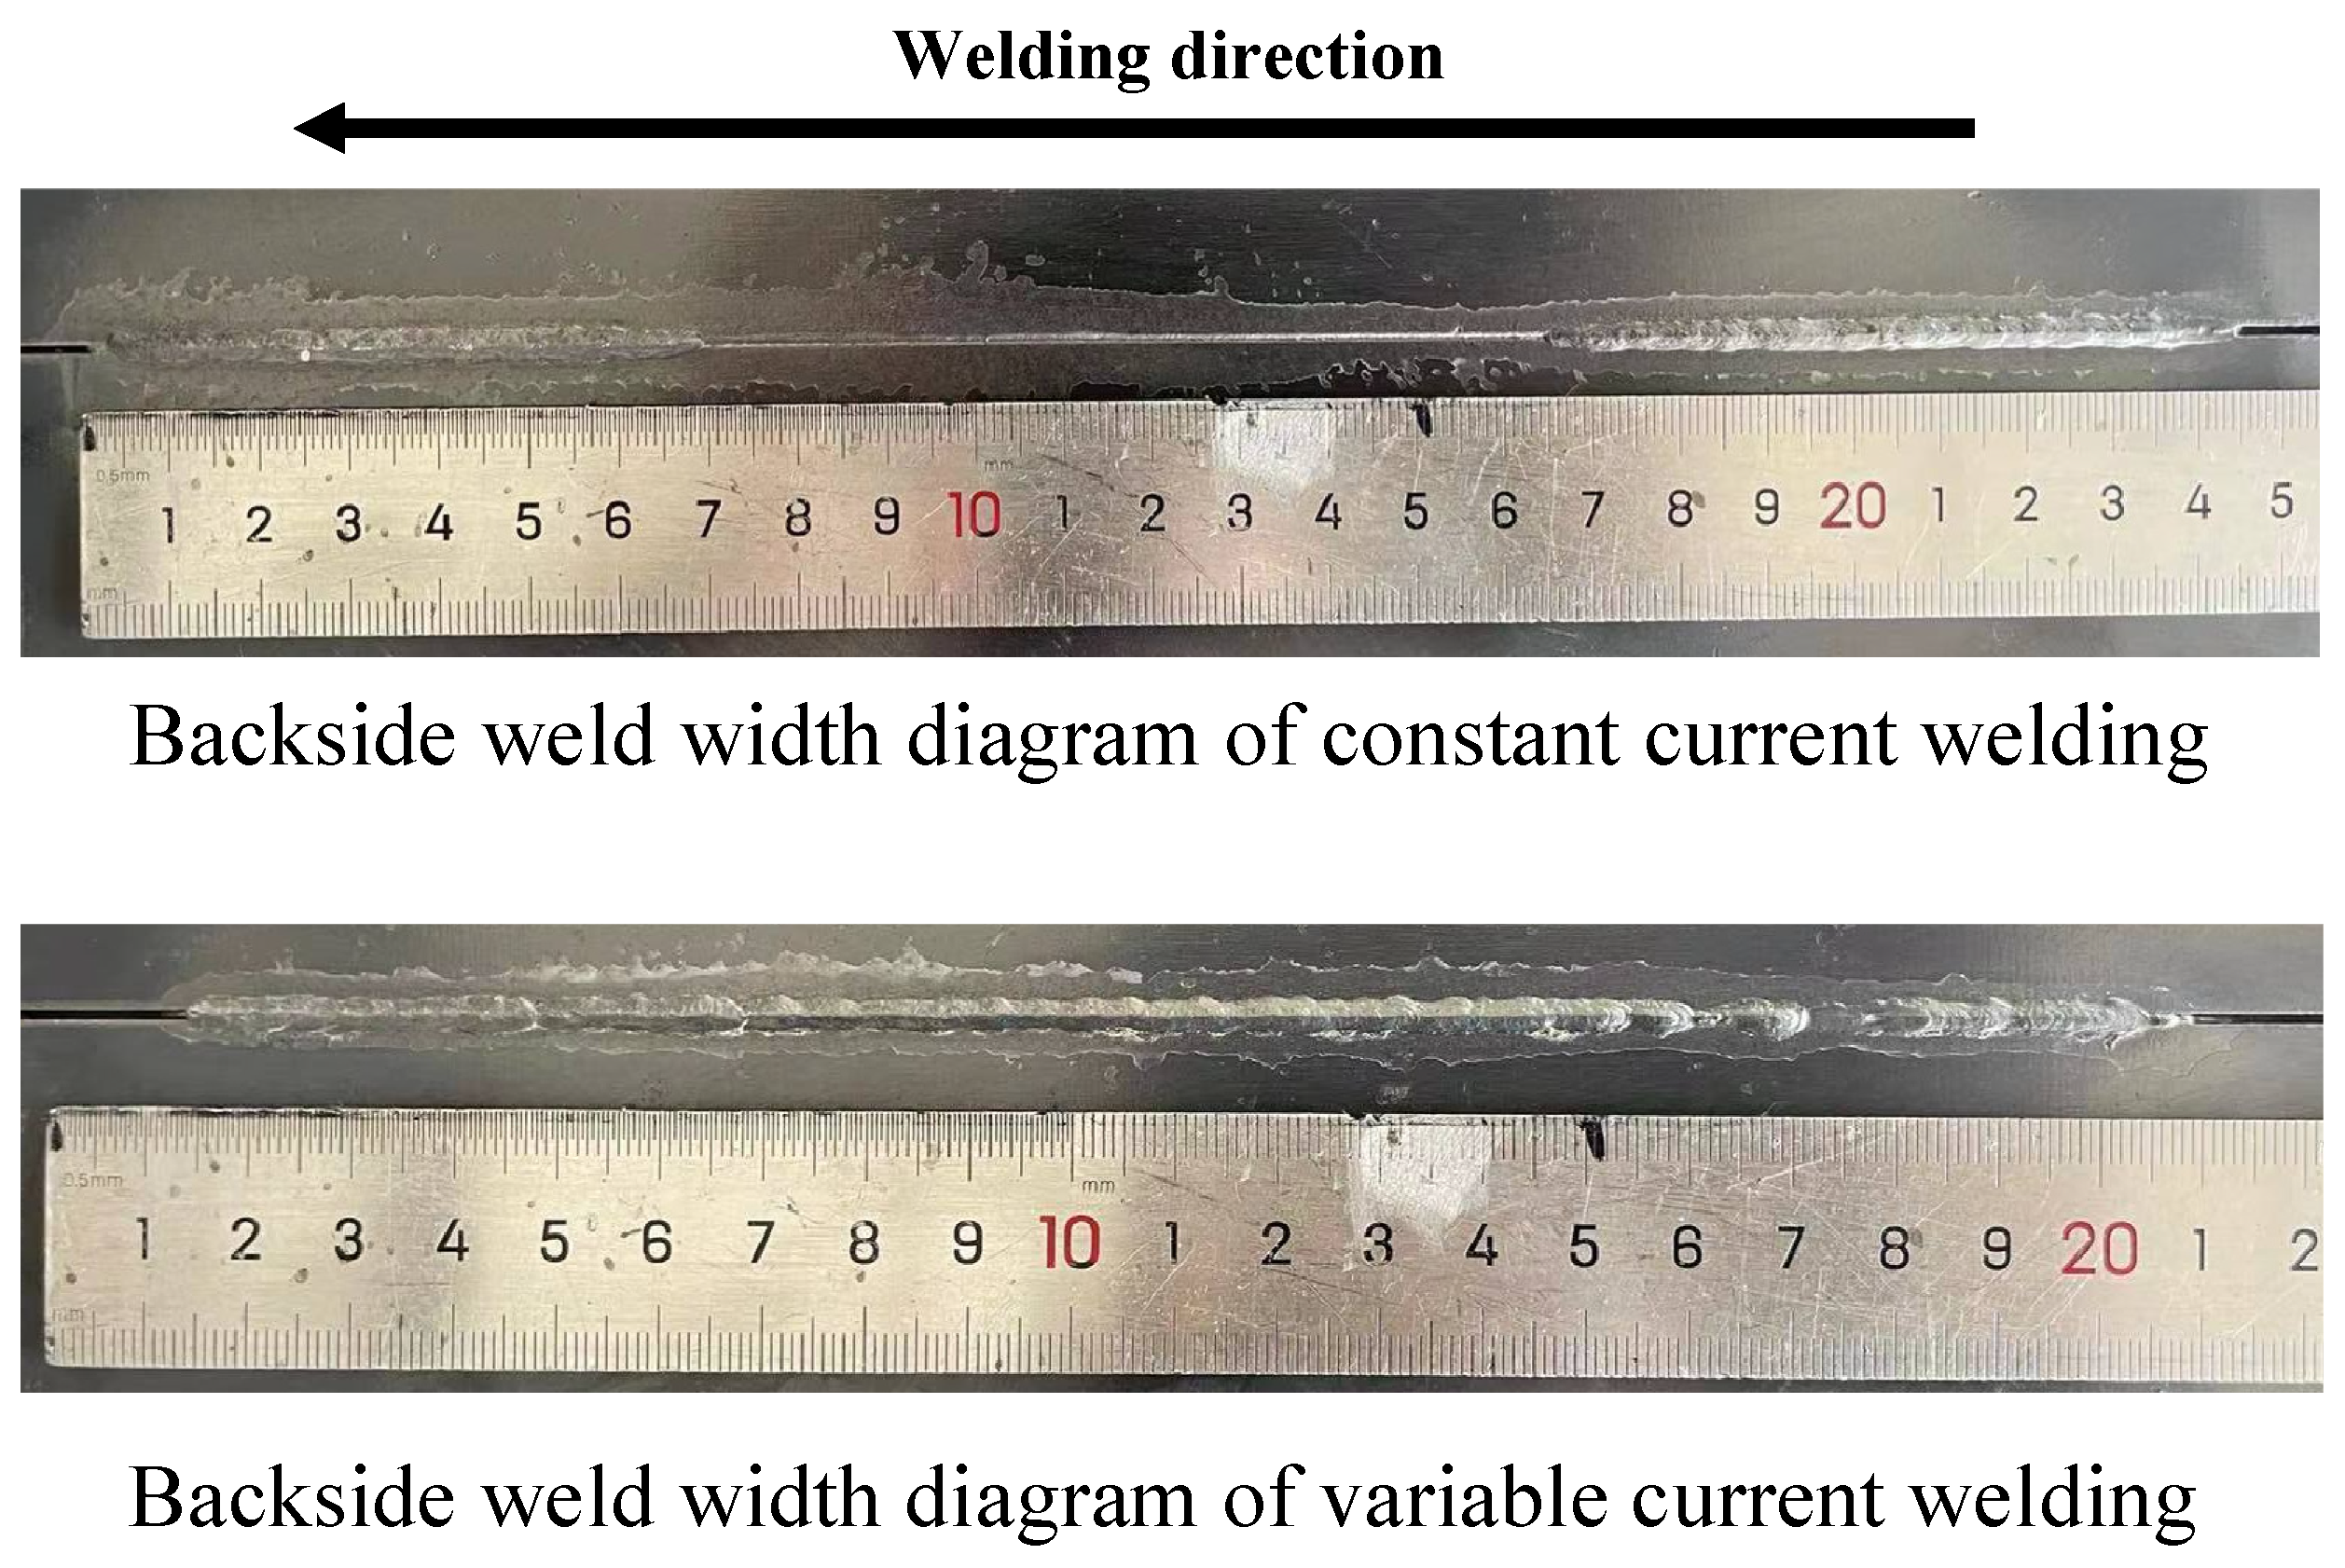
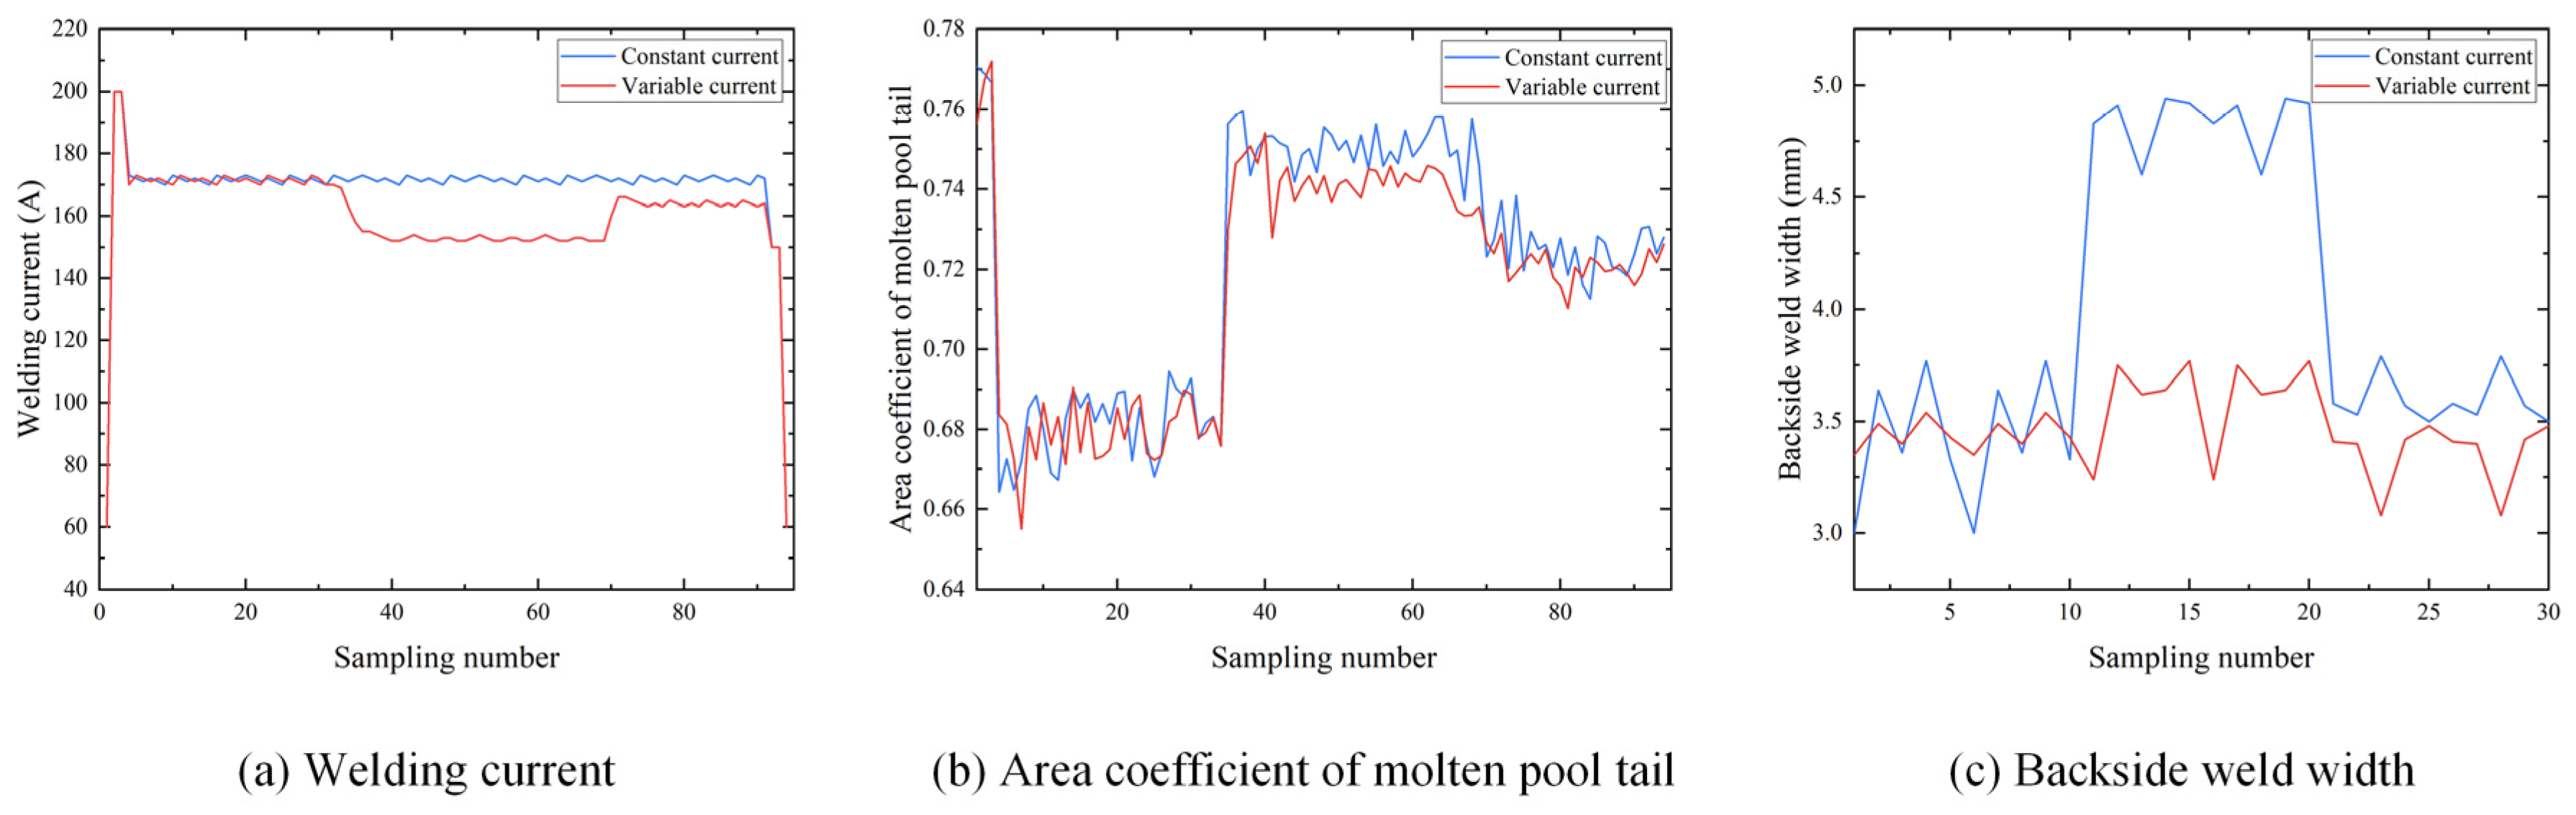
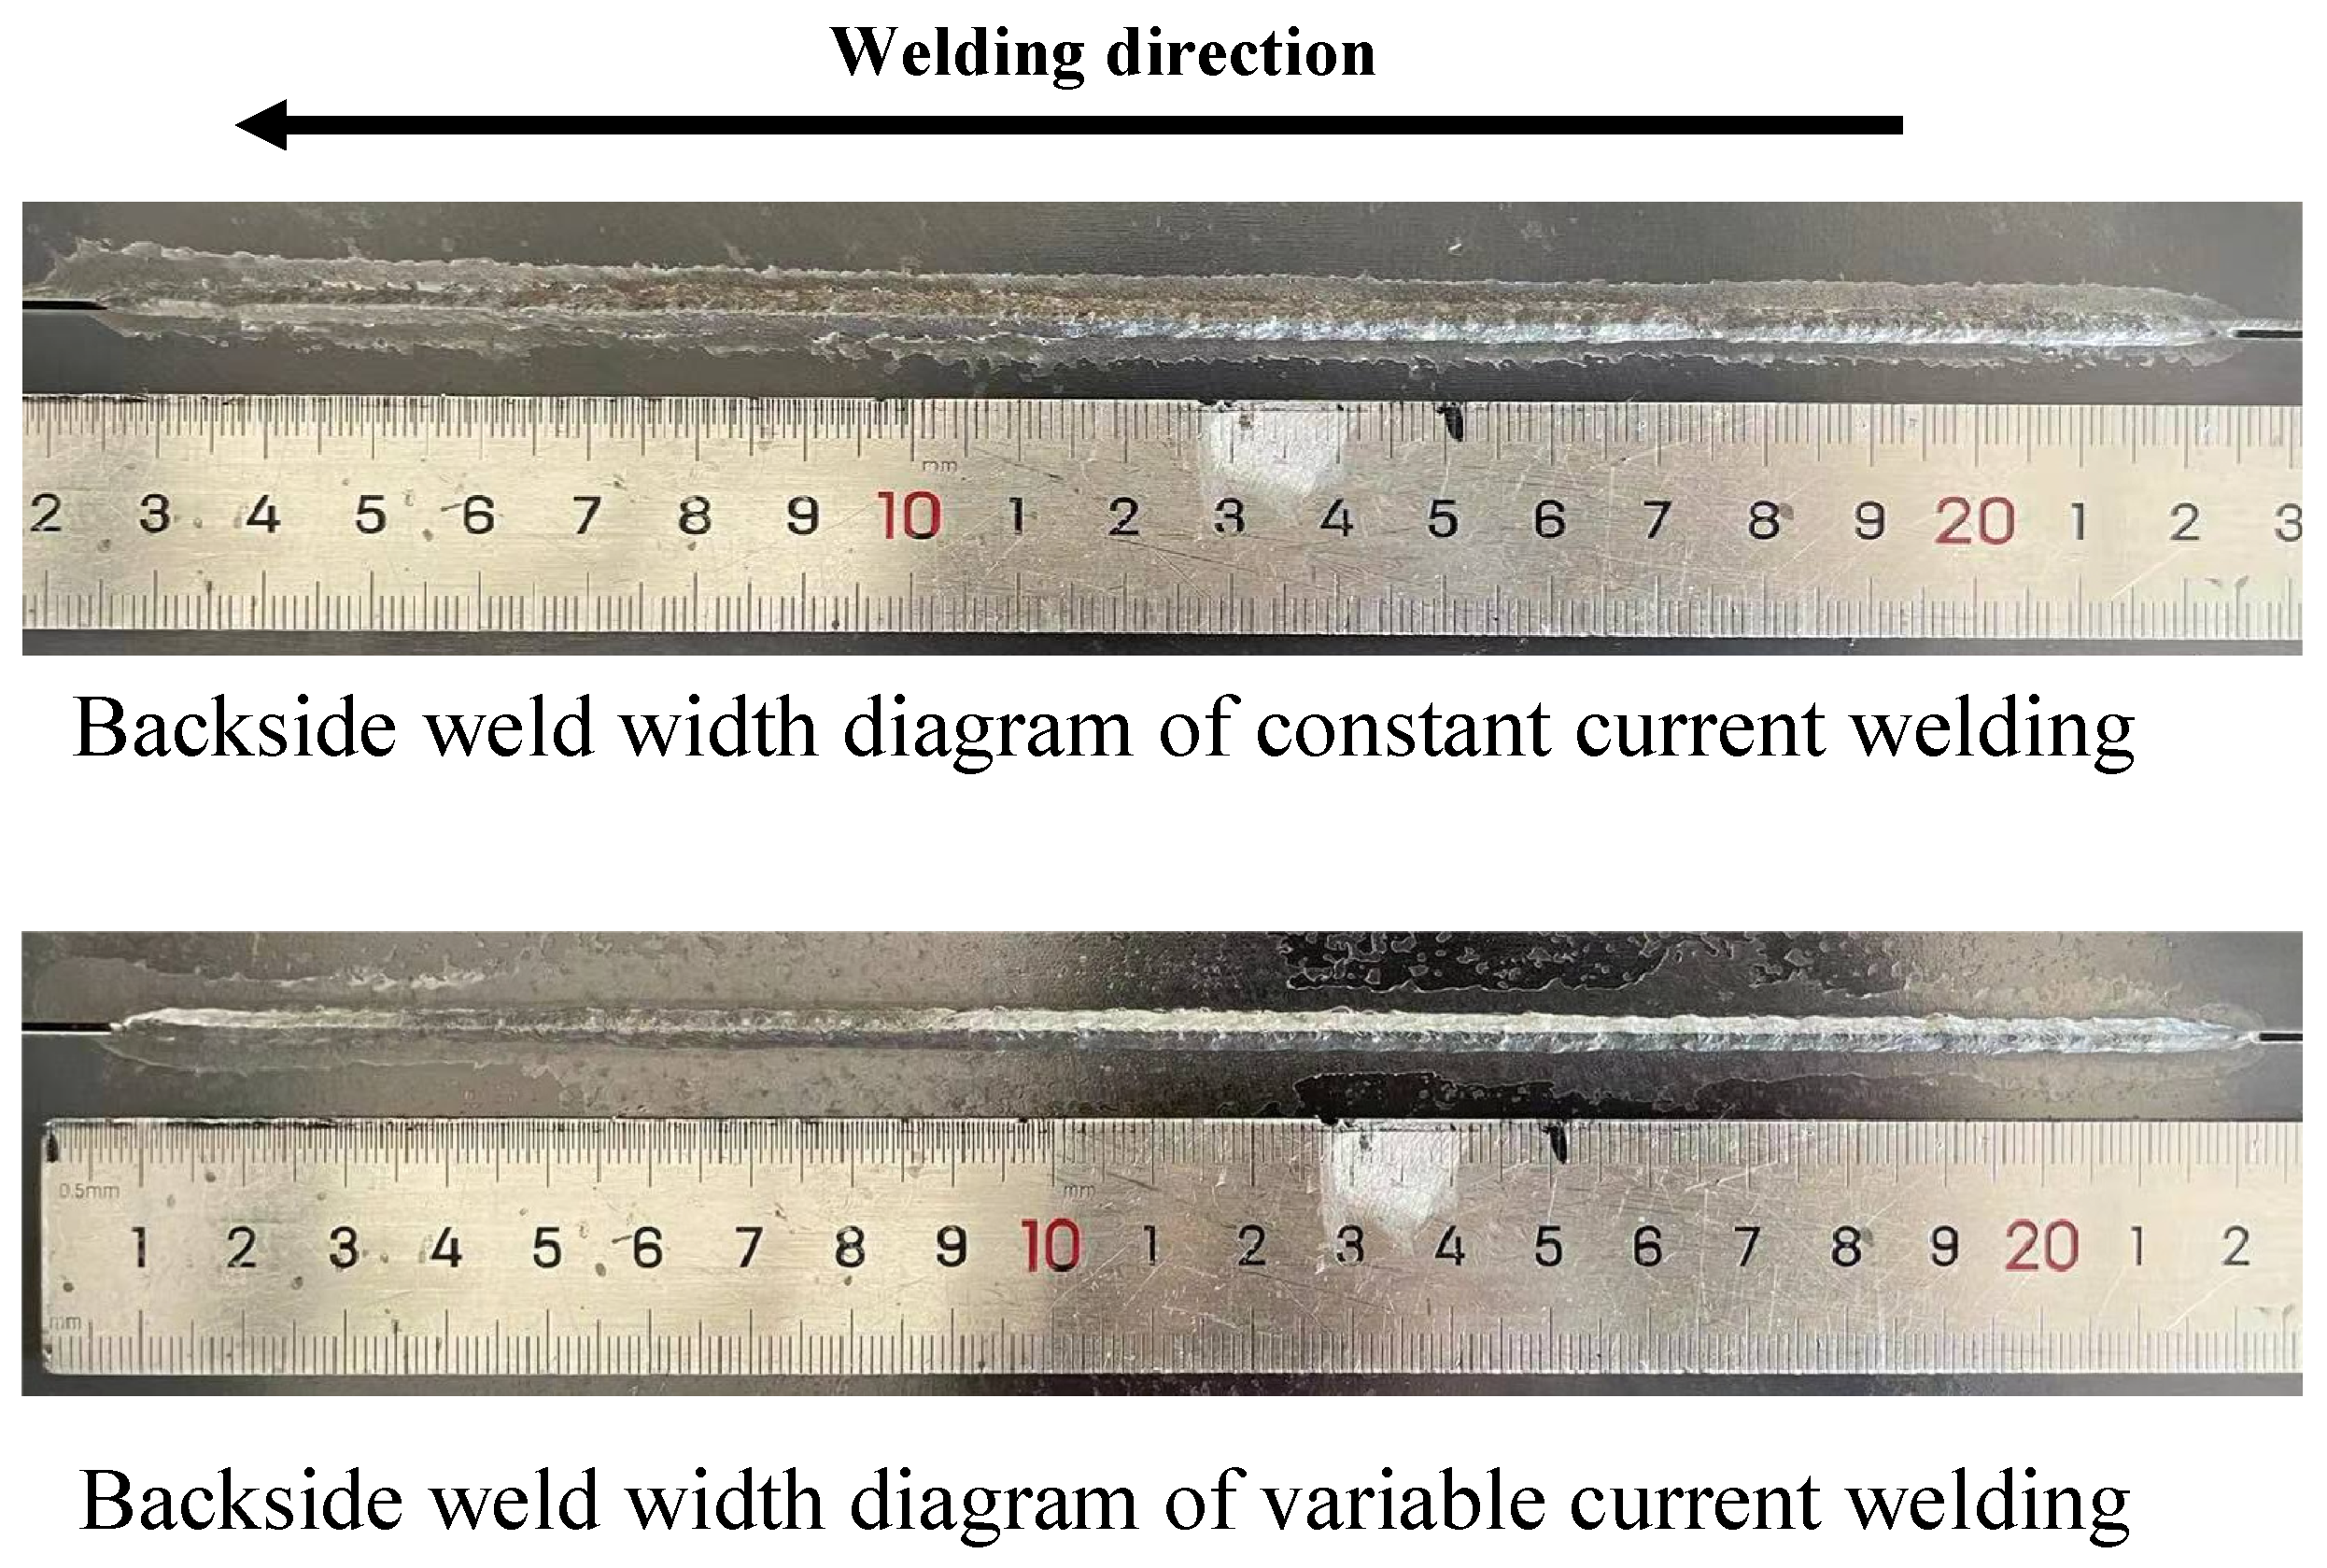
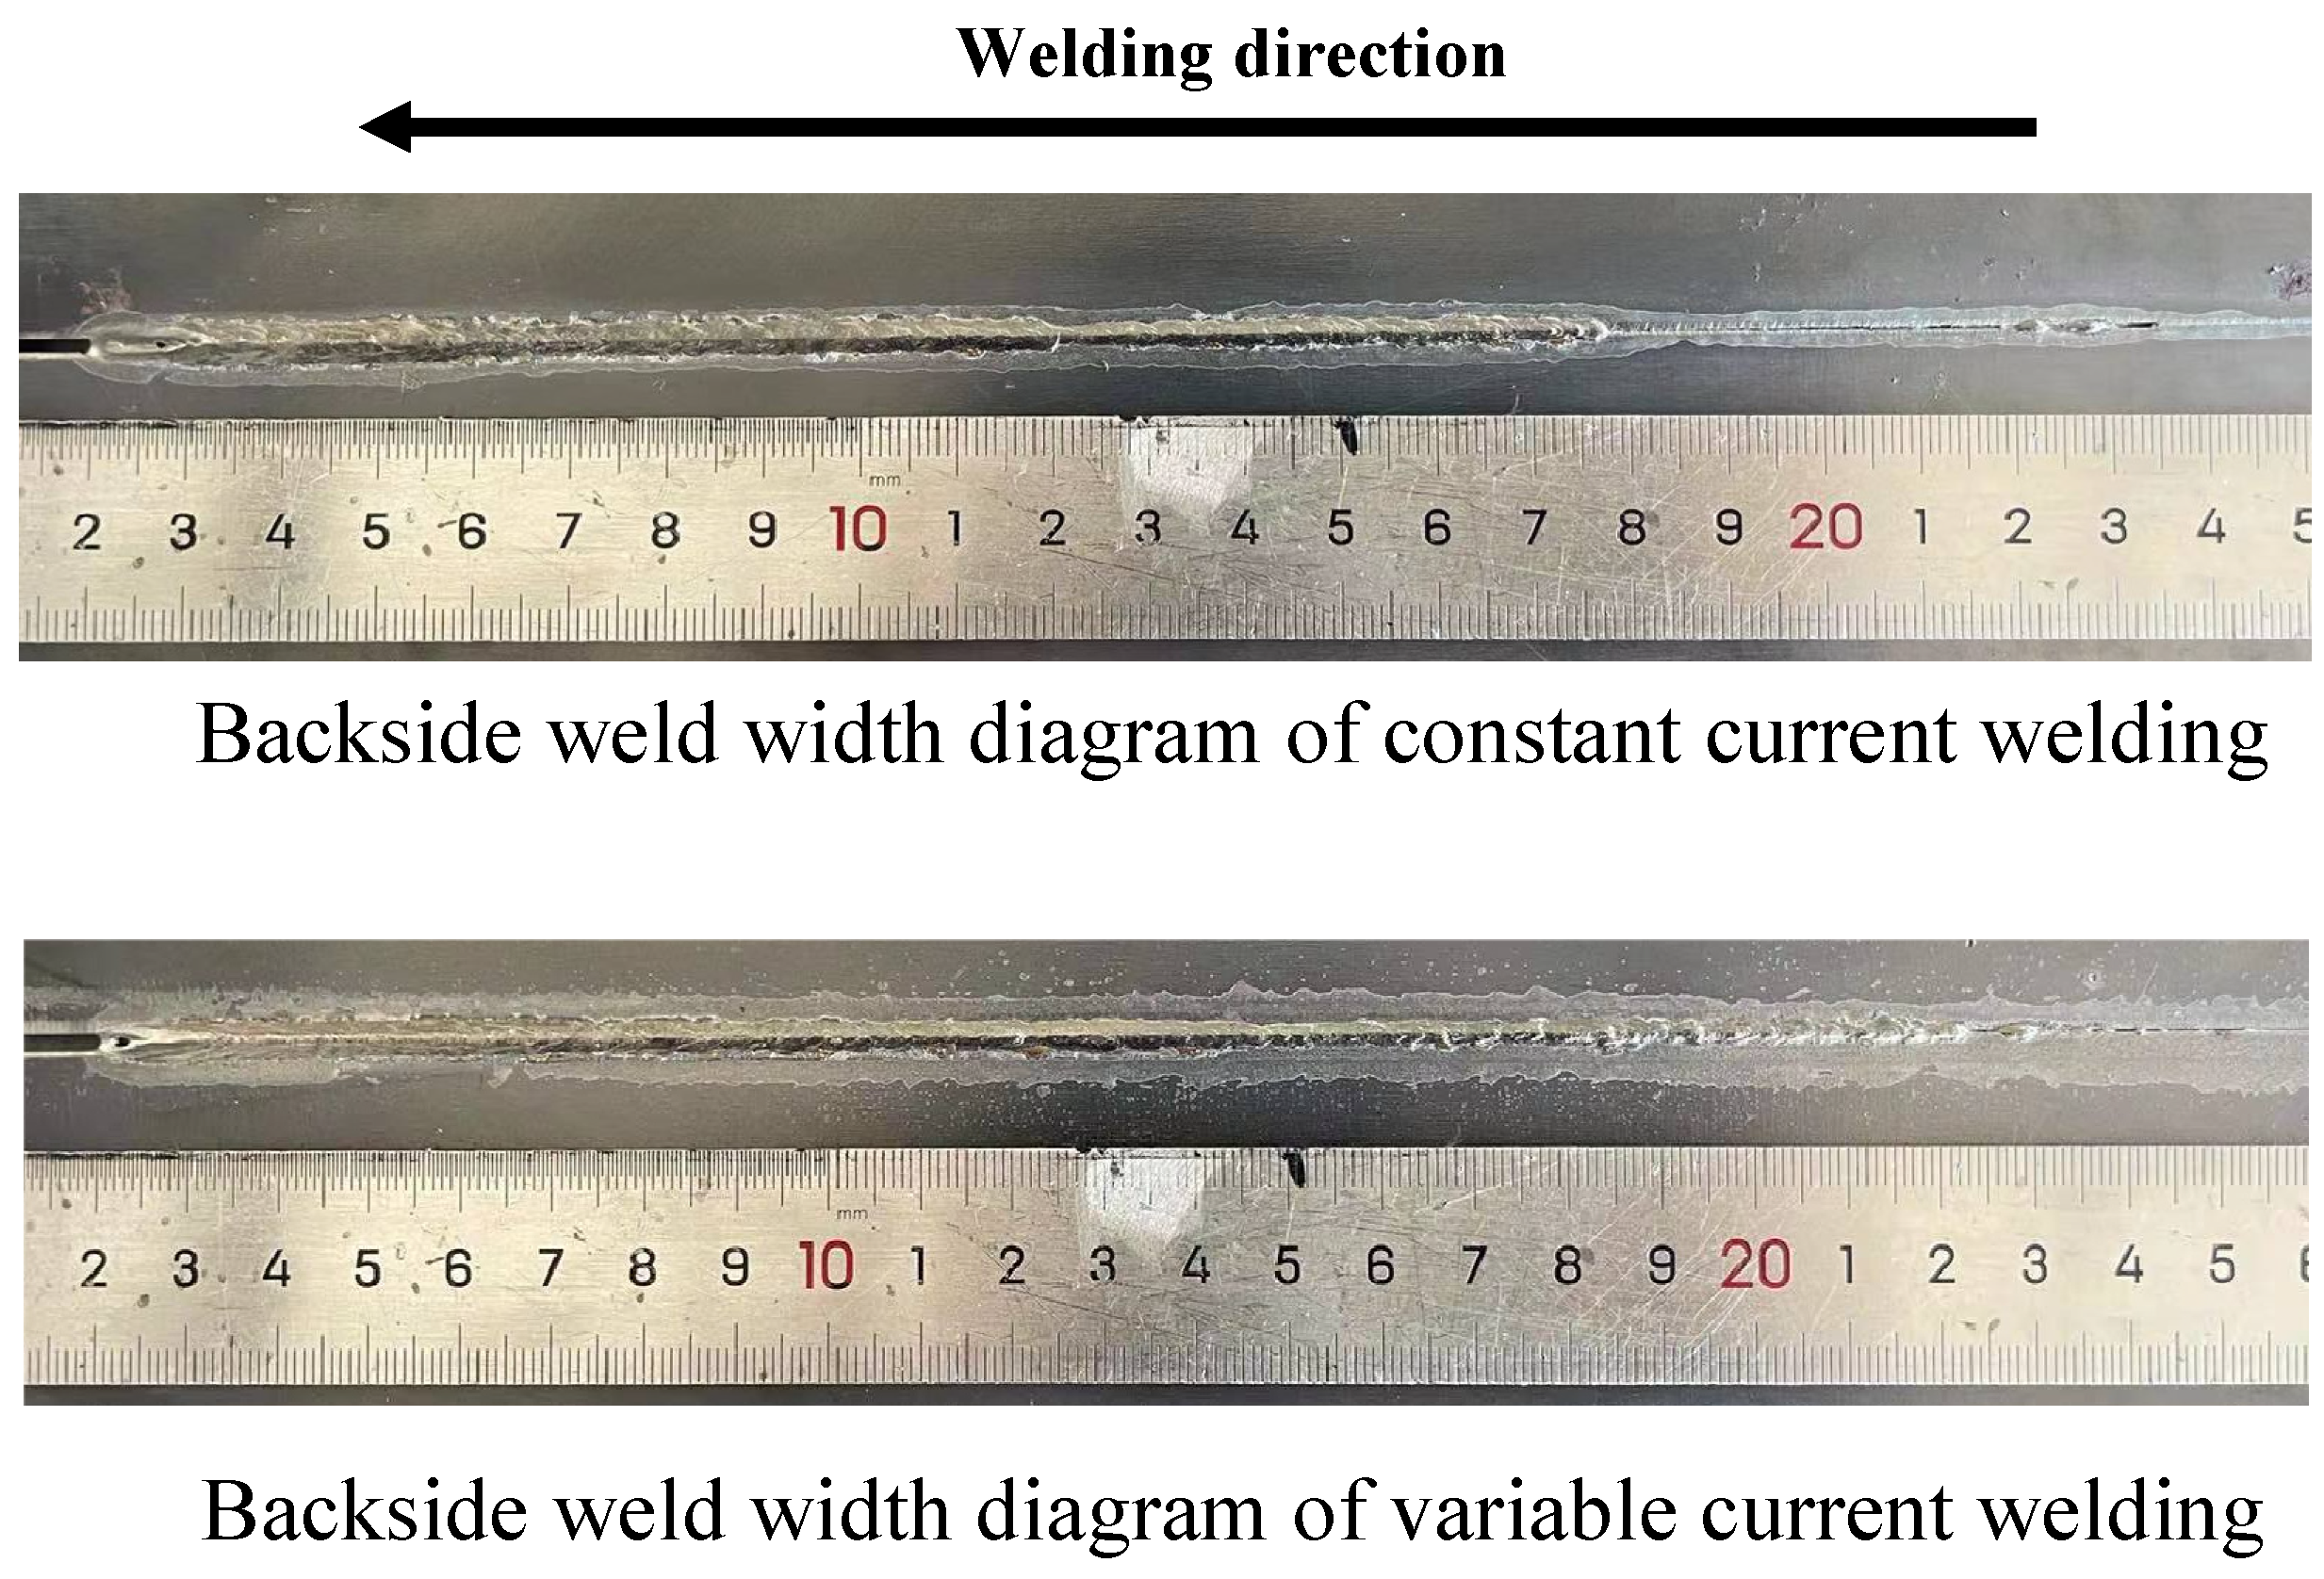
4. Experimental Verification and Analysis

In order to simulate the variation of the weld gap during the welding process, three sets of experiments were designed as penetration control objects for MAG welding and the variable precision neighborhood rough-fuzzy control model was validated. The experimental conditions were as follows: plate Q235 steel plate butt joint, plate thickness of 6 mm, a groove with a 60° Y-shape, a reserved dull edge of 1.5 mm, and a welding speed of 47 cm/min.
The three sets of experiments are classified according to the weld gap as 1.2-0.6-1.2 mm gap A, 1.2-1.8-1.2 mm gap B, and progressive gap C. D is a schematic of the plate machined grooves, blunt edges, etc.
The three sets of experiments classified according to the weld clearance: 1.2-0.6-1.2 mm clearance A, 1.2-1.8-1.2 mm clearance B, and progressive clearance C. D is a schematic of the machined grooves, blunt edges, etc. of the plates. The schematic diagram of specific specimens is shown in Figure 11. For each set of specimens, constant gauge process parameters and parameters after control adjustment were used as welding process parameters. After welding, the back weld width was measured to analyze the quality of the penetration.
Improper assembly or insufficient manual control of clearance accuracy during welding can lead to variations in plate clearance, and the welding itself and equipment parameters are not capable of completing the basic weld molding requirements for some specific extreme weld gaps. For this reason, 0.4 mm was chosen as the minimum encountered gap and 2.0 mm as the maximum encountered gap. Considering that there are errors such as plate assembly, material processing, and algorithm accuracy in the assembly process, the area coefficient C T S of the molten pool extracted by the algorithm will also change.
In Figure 12, Figures 14 and 16, we used three characteristic parameters to describe the changes in the welding process of different specimens, namely, the welding current (a) in the welding process, the area coefficient of the molten pool (b) in the welding process, and the backside weld width (c). As shown in Figure 12, taking the experiment of group A as an example, under constant current, there will be a phenomenon of non-penetration at the gap of 0.6 mm, and the area coefficient C T S of the molten pool tail changes up and down around 0.71. In the case of an s gap, the phenomenon of non-penetration occurs, and the current is adjusted by the variable precision neighborhood rough fuzzy controller (VPNRS-FC). The non-penetrating part was fully welded, the area coefficient of the weld pool tail was reduced to approximately 0.69, and the actual measured weld back width was controlled to be within the appropriate range. During the welding process, the temperature of the welding area is extremely elevated, and uneven expansion and contraction of the weld and other areas will occur [20]. The coefficient in the tail region changes due to the effect of weld heat accumulation, and the penetration effect deepens throughout the weld. The whole welding adjustment process was adjusted twice to take into account the effect of welding heat accumulation. For the first time, in order to enable rapid changes in the weld pool, a method beyond current adjustment was used to achieve faster penetration. Based on the first adjustment, the fine-tuning is carried out a second time to reduce the current adjustment. The control effect of the controller in the experimental welding process of group A is shown in Figure 13.
As shown in Figure 14, the welding experiment of group B is adjusted by the variable precision neighborhood rough-fuzzy controller. In view of the phenomenon of over-penetration and obvious increase in the width of the back of the molten pool in the 1.8 mm gap, the width of the back of the molten pool is uniform and the width coefficient of the tail of the molten pool is decreased to some extent by the adjustment of the controller, as shown in Figure 15. As shown in Figure 16 and Figure 17, for the welding experiment of variable clearance group C, the penetration part is adjusted to 80% by the variable precision neighborhood rough fuzzy controller, the backside melt width is uniformly formed, and the backside weld is properly formed.

5. Conclusions

Aiming at the problem that the penetration depth cannot be measured directly in the welding process, that is, the direct and effective control of the penetration state, a variable precision neighborhood rough-fuzzy control method is proposed. By establishing the characteristic information of the molten pool surface, we obtain the correspondence between the characteristic information and the weld penetration state. Rough set theory is used to extract the classification rules of the information reflecting the penetration state in the representation information data, and the fuzzy control model is established as the input, and the adjustment current is used as the output of the control model. The effectiveness of this approach is tested in experiments where different gaps are encountered.
For the non-linearity and complexity of the GMAW welding process, the concept of variable precision is added to the neighborhood rough set and combined with the fuzzy control method to obtain a refined geometry of the back of the arc weld. As for the control accuracy of the method, it mainly depends on the contour extraction algorithm of the image of the molten pool, and there is interference from arc light and smoke during welding. How to employ means to avoid the numerous interfering factors will be considered in the future. During the welding process, the gap changes due to different assembly gaps or complex external factors lead to failure of weld quality and excessive artificial errors. The VPNRS-FC method has the advantages of fast response speed and elevated welding quality effectiveness. This not only reduces the welding time but also improves the stability of the welding process.

Author Contributions

Data curation, H.Y. and X.H.; Formal analysis, X.Z.; Funding acquisition, Z.F., X.L. and Q.L.; Investigation, X.Z. and Z.P.; Methodology, X.X.; Project administration, Q.L.; Software, X.H.; Supervision, H.Y. and X.L.; Validation, X.X.; Visualization, Z.P.; Writing—original draft, X.X.; Writing—review and editing, Z.F. All authors have read and agreed to the published version of the manuscript.

Funding

This work is supported by the National Natural Science Foundation of China via grants (51969001 and 52261044); Graduate Education Program Project of Guangxi (YCSW2023515).

Institutional Review Board Statement

Not applicable.

Informed Consent Statement

Not applicable.

Data Availability Statement

Data can be obtained by contacting the author Xiaohong Xiang([email protected]).

Conflicts of Interest

The authors declare no conflict of interest.

References

  1. Tsumoto, S. Rough Sets: Past, Present and Future. J. Jpn. Soc. Fuzzy Theory Syst. 2001, 13, 552–561. [Google Scholar] [CrossRef] [PubMed] [Green Version]
  2. Pawlak, Z. Rough sets. Int. J. Comput. Inf. Sci. 1982, 11, 341–356. [Google Scholar] [CrossRef]
  3. Suo, M.; Tao, L.; Zhu, B.; Miao, X.; Liang, Z.; Ding, Y.; Zhang, X.; Zhang, T. Single-parameter decision-theoretic rough set. Inf. Sci. 2020, 539, 49–80. [Google Scholar] [CrossRef]
  4. Kannan, E.; Ravikumar, S.; Anitha, A.; Kumar, S.A.P.; Vijayasarathy, M. Analyzing uncertainty in cardiotocogram data for the prediction of fetal risks based on machine learning techniques using rough set. J. Ambient Intell. Humaniz. Comput. 2021, 1–13. [Google Scholar] [CrossRef]
  5. Wang, B.; Chen, S.; Wang, J. Rough set based knowledge modeling for the aluminum alloy pulsed GTAW process. Int. J. Adv. Manuf. Technol. 2005, 25, 902–908. [Google Scholar] [CrossRef]
  6. Li, W.H.; Chen, S.B.; Wang, B. A variable precision rough set based modeling method for pulsed GTAW. Int. J. Adv. Manuf. Technol. 2008, 36, 1072–1079. [Google Scholar] [CrossRef]
  7. Feng, Z.-Q.; Liu, C.-G.; Huang, H. Knowledge modeling based on interval-valued fuzzy rough set and similarity inference: Prediction of welding distortion. J. Zhejiang Univ. Sci. C 2014, 15, 636–650. [Google Scholar] [CrossRef]
  8. Chady, T.; Sikora, R.; Misztal, L.; Grochowalska, B.; Grzywacz, B.; Szydłowski, M.; Waszczuk, P.; Szwagiel, M. The Application of Rough Sets Theory to Design of Weld Defect Classifiers. J. Nondestruct. Eval. 2017, 36, 40. [Google Scholar] [CrossRef] [Green Version]
  9. Luo, H.; Devanathan, R.; Wang, J.; Chen, X.; Sun, Z. Vision based neurofuzzy logic control of weld pool geometry. Sci. Technol. Weld. Join. 2002, 7, 321–325. [Google Scholar] [CrossRef]
  10. Chen, C.; Xiao, R.; Chen, H.; Lv, N.; Chen, S. Arc sound model for pulsed GTAW and recognition of different penetration states. Int. J. Adv. Manuf. Technol. 2020, 108, 3175–3191. [Google Scholar] [CrossRef]
  11. Lv, N.; Xu, Y.; Li, S.; Yu, X.; Chen, S. Automated control of welding penetration based on audio sensing technology. J. Mater. Process. Technol. 2017, 250, 81–98. [Google Scholar] [CrossRef]
  12. Baek, D.; Moon, H.S.; Park, S.-H. In-process prediction of weld penetration depth using machine learning-based molten pool extraction technique in tungsten arc welding. J. Intell. Manuf. 2022, 1–17. [Google Scholar] [CrossRef]
  13. Wang, Z.; Chen, H.; Zhong, Q.; Lin, S.; Wu, J.; Xu, M.; Zhang, Q. Recognition of penetration state in GTAW based on vision transformer using weld pool image. Int. J. Adv. Manuf. Technol. 2022, 119, 5439–5452. [Google Scholar] [CrossRef]
  14. Yu, R.; Han, J.; Zhao, Z.; Bai, L. Real-Time Prediction of Welding Penetration Mode and Depth Based on Visual Characteristics of Weld Pool in GMAW Process. IEEE Access 2020, 8, 81564–81573. [Google Scholar] [CrossRef]
  15. Hu, Q.-H.; Yu, D.; Xie, Z. Numerical Attribute Reduction Based on Neighborhood Granulation and Rough Approximation. J. Softw. 2008, 19, 640–649. [Google Scholar] [CrossRef]
  16. Wang, J.-Y.; Zhou, J. Research of reduct features in the variable precision rough set model. Neurocomputing 2009, 72, 2643–2648. [Google Scholar] [CrossRef]
  17. Hu, Q.H.; Zhao, H.; Yu, D.R. Efficient symbolic and numerical attribute reduction with neighborhood rough sets. Moshi Shibie yu Rengong Zhineng/Pattern Recognit. Artif. Intell. 2008, 21, 732–738. [Google Scholar] [CrossRef] [Green Version]
  18. Zhang, D.-W.; Wang, P.; Qiu, J.-Q.; Jiang, Y. An improved approach to feature selection. In Proceedings of the 2010 International Conference on Machine Learning and Cybernetics, Qingdao, China, 11–14 July 2010; pp. 488–493. [Google Scholar] [CrossRef]
  19. An, R.M.; Suo, M.L. Astronautics, Application of attributes reduction and weights calculation through neigh-borhood rough set. Comput. Eng. Appl. 2016, 52, 160–165. [Google Scholar] [CrossRef]
  20. Deo, M.V. Minimization of bowing distortion in welded stiffeners using differential heating. In Minimization of Welding Distortion and Buckling: Modelling and Implementation; Michaleris, P., Ed.; Elsevier: Amsterdam, The Netherlands, 2011; pp. 169–185. [Google Scholar] [CrossRef]
Figure 1. Image acquisition system.
Applsci 13 09215 g001
Figure 2. Penetration state of variable gap-current welding.
Applsci 13 09215 g002
Figure 3. Image processing process of molten pool.
Applsci 13 09215 g003
Figure 4. Comparison chart of average classification accuracy and reduction.
Applsci 13 09215 g004
Figure 5. Fuzzy control model for the area coefficient of molten pool tail.
Applsci 13 09215 g005
Figure 6. Fuzzy distribution of membership function for errors of C T S .
Applsci 13 09215 g006
Figure 7. Membership function of C T S errors.
Applsci 13 09215 g007
Figure 8. Membership function of errors change of C T S .
Applsci 13 09215 g008
Figure 9. Fuzzy distribution of membership function for Δ I .
Applsci 13 09215 g009
Figure 10. 3D space diagram after fuzzy inference, representing the relationship between E , E C , and Δ I .
Applsci 13 09215 g010
Figure 11. Diagram of machined specimen.
Applsci 13 09215 g011
Figure 12. Comparison chart of group A.
Applsci 13 09215 g012
Figure 13. Comparison of welding effects of group A specimens.
Applsci 13 09215 g013
Figure 14. Comparison chart of group B.
Applsci 13 09215 g014
Figure 15. Comparison of welding effects of group B specimens.
Applsci 13 09215 g015
Figure 16. Comparison chart of group C.
Applsci 13 09215 g016
Figure 17. Comparison of welding effects of group C specimens.
Applsci 13 09215 g017
Table 1. Experiment welding parameters.
Specimen MaterialQ235
Shielded gas85% CO2 + 15% Ar
Specimen size (mm3) 300 × 150 × 6
Gas flow ( L / min ) 15
Wire diameter ( mm )1.2
Welding wire elongation ( mm )10
Welding speed ( cm / min )47
Assembly clearance (mm)0.4–2.0
Welding voltage (V)20.5
welding current (A)155–215
Welding modePulse welding
Table 2. Variable gap-current welding data sheet.
U L T W T R L W S T C T S α C T W d
x 1 203.5227.41.055734,264.20.74034458.385820.8179820
x 2 227.1246.41.1190840,2200.71839856.955220.7947920
x 3 287.22791.2430255,542.40.69310651.836220.76560
x 4 388.2303.21.28024 77,677.80.6594842.67060.7033280
x 5 380.7294.61.29466 70,471.80.62797242.305620.662991
x 6 209.2230.40.90887 35,064.80.72783457.693780.7942460
x 7 228.2241.60.94455 39,214.60.71126855.798980.7814720
x 8 284.5276.81.02794 54,3640.6903551.88640.7529020
x 9 349.9286.61.22096 63,152.80.62968644.541320.6538021
x 10 356.5286.81.24315 61,489.80.60146443.823760.6399822
x 11 198.2195.41.2192425,912.60.66924652.57640.721671
x 12 229222.61.3287833,9770.6665551.841380.7080121
x 13 285.1256.21.3828447,002.40.64329248.412720.6606641
x 14 356.1272.41.30719 58,891.80.6068441.881940.6204082
x 15 393.9264.21.49169 62,3630.59937.073920.60632
x 16 225.5192.21.17430 29,6410.68395246.160060.7003761
x 17 264.5207.41.27540 36,261.80.66096242.828360.6855341
x 18 306.1223.21.37139 43,6650.63898440.074140.6568822
x 19 397.1240.21.65288 57,2500.59976233.693620.6104342
x 20 448.5244.21.83692 64,0100.58512230.56130.586982
x 21 222.7184.41.4597626,5970.64733245.059560.6778621
x 22 250210.81.5208833,429.40.63387445.737740.6623221
x 23 323.8222.41.7703635,481.560.61792637.939560.6214882
Table 3. Data description.
Data SetAbbreviationSamplesNumerical FeaturesClassesMean SD
1Variable
gap-current
Welding
Welding23730.284346
Where Mean SD represents the average standard deviation of each condition attribute.
Table 4. Reduction set and significance under different N .
DataNRedSignificance
Welding1.550.0435
1.5550.0435
60.0435
1.650.05
60.05
1.6550.0435
60.0435
1.750.087
60.0435
1.7550.087
60.0435
1.850.087
60.0435
Table 5. Information table of fusion state decision of C T S after discretization.
U C T S d
x 1 30
x 2 30
x 3 30
x 4 20
x 5 11
x 6 30
x 7 30
x 8 30
x 9 11
x 10 12
x 11 21
x 12 21
x 13 21
x 14 12
x 15 12
x 16 21
x 17 21
x 18 22
x 19 12
x 20 12
x 21 21
x 22 21
x 23 12
Table 6. Control rules for the area coefficient of molten pool tail.
Δ I E
NBZEPB
ECNBNBNBZE
ZENBZEPB
PBZEPBPB
Disclaimer/Publisher’s Note: The statements, opinions and data contained in all publications are solely those of the individual author(s) and contributor(s) and not of MDPI and/or the editor(s). MDPI and/or the editor(s) disclaim responsibility for any injury to people or property resulting from any ideas, methods, instructions or products referred to in the content.

