Article

Mechanical Characteristics Analysis of Composite Rubber Elements in Elastic Cam of Large Coal Cake Tamper

School of Mechanical Engineering, Dalian Jiaotong University, Dalian 116028, China
*
Author to whom correspondence should be addressed.
Appl. Sci. 2023, 13(16), 9247; https://doi.org/10.3390/app13169247
Submission received: 10 July 2023 / Revised: 11 August 2023 / Accepted: 12 August 2023 / Published: 14 August 2023

Abstract

:
The phenomenon of coal cake collapse is often caused by the unstable operation of the elastic cam in a large coal cake tamper. Aiming at this problem, the mechanical characteristics of the composite rubber elements during cam rotation are studied. A rubber piecewise-function constitutive model is established based on phenomenological theory, and different rubber constitutive model coefficients are obtained according to rubber test data. A contact simulation model between the elastic cam and the tamping hammer friction plate is established to obtain the stress–strain law of the composite rubber elements and the pressure-displacement curve of the elastic cam. The stiffness test platform of the elastic cam is designed, and the differences in results between the test and the simulation are discussed. The results show that the stress–strain curve of rubber has a nonlinear increasing trend and the error between the proposed piecewise function and the test value is less than 2%. As the cam displacement increases from 1 mm to 10 mm, the cam pressure increases from 7715 N to 40,000 N. The simulation results of the rubber stress–strain relationship using the piecewise-function constitutive model are closer to the test data than the simulation results using the elastic modulus as a constant, and the error is less than 6.18%.

1. Introduction

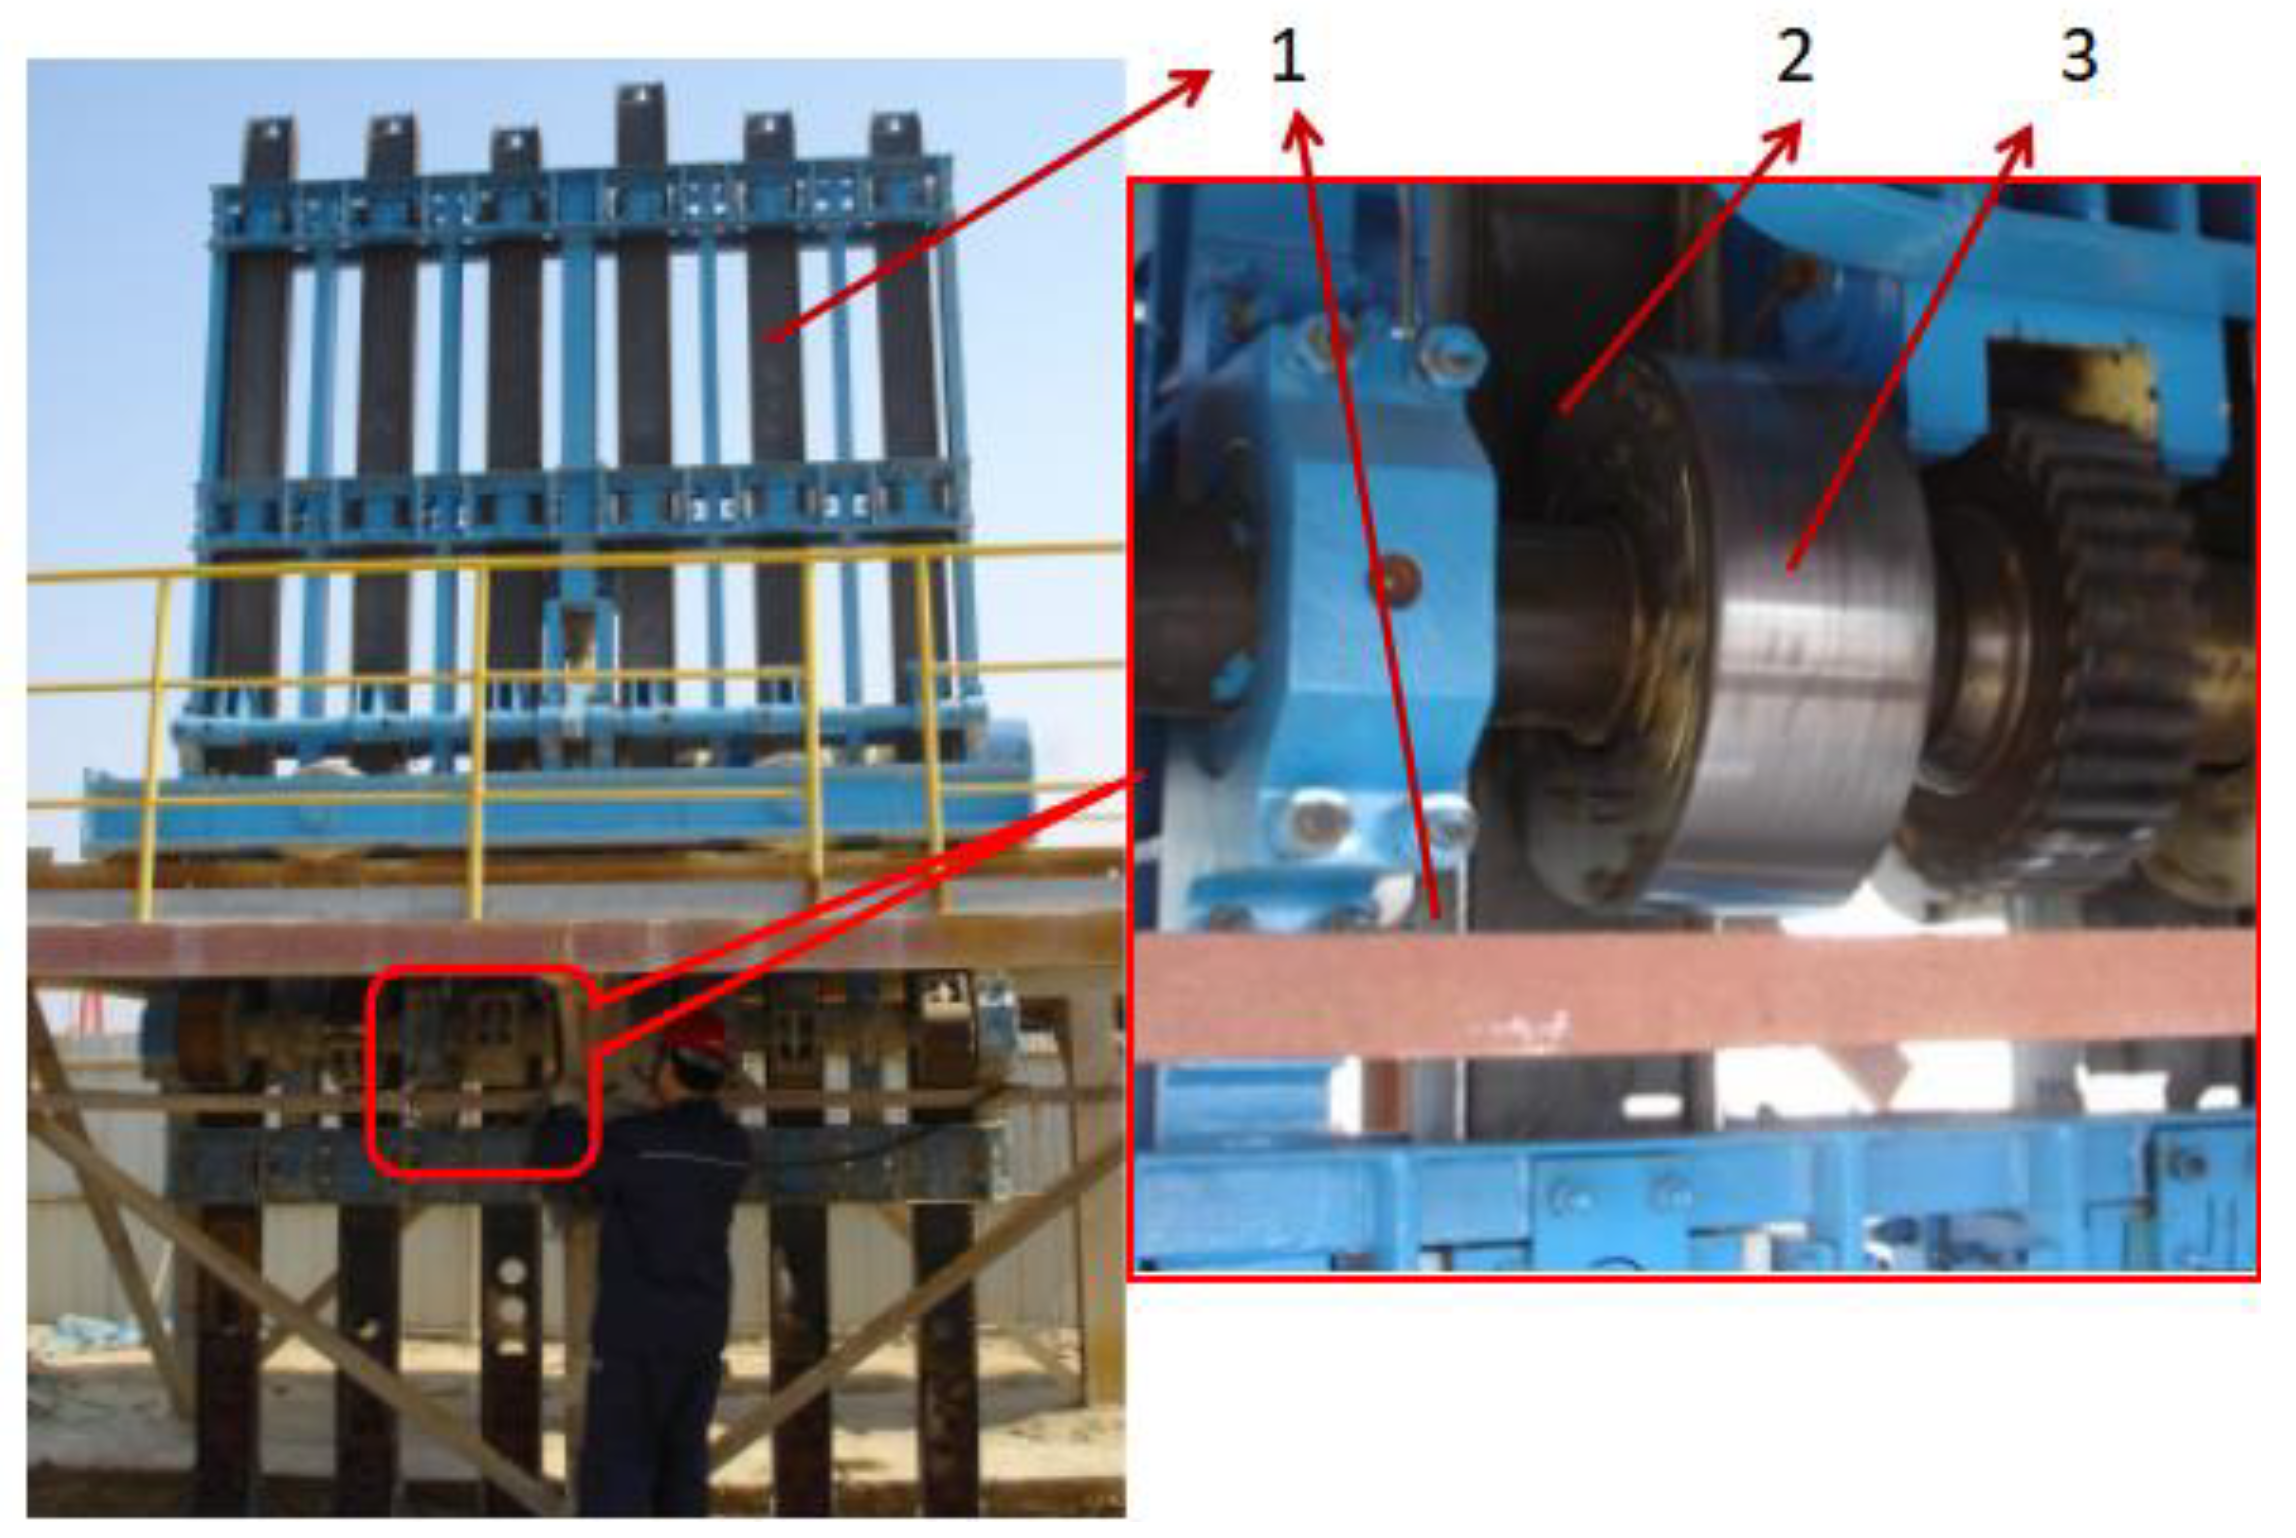
The coal cake tamper of the coke oven (as shown in Figure 1) is a special type of equipment for tamping loose coal in the tamping box. By the continuous impact of the hammer, loose coal is compacted to form coal cakes with a specific pile density. The coal cake’s tamping quality directly affects coke production quality. The tamping hammer lifting device, which drives the tamping hammer, is a critical part of the coal cake tamping machine in the coke oven. Its principle is that a group of symmetrical rotating elastic cams intermittently clamp the tamping hammer to achieve the upward throwing and free falling of the hammer. The increasing demand for coal cake volume in large-scale coke ovens necessitates a higher quality and efficiency of coal cake tamping. This entails an increase in both the frequency and height of tamping, resulting in a more complex working load. After prolonged service, the cam elastic element often exhibits cracks and experiences elastic failure (as shown in Figure 2a), resulting in inadequate lifting force and subsequent collapse of the coal cake (as shown in Figure 2b).
The causes of these issues include unstable lifting force caused by constant variations in the contact point of the elastic cam, irregular changes in cam stiffness, as well as alterations in large deformation force during clamping. However, current research primarily focuses on the arrangements of tamping machine structures and mechanisms, while studies on the rubber elements mainly investigate how different fillers affect their constitutive behavior and predict mechanical properties related to their formation.
Regarding the tamping machine structure and pulverized coal tamping molding, scholars have carried out a considerable amount of research in recent years. Sun et al. [1] established mathematical models of the maximum positive pressure and maximum drag moment of the cam mechanism, carried out a dynamic analysis on the cam mechanism of the tamping hammer, and obtained the dynamic regulation of the tamping hammer lifting device. Peng [2] analyzed the problem from the perspective of SCP machine control and proposed corresponding optimization measures. Fan [3] optimized the frame structure of the tamping machine. Gabriel et al. [4,5] summarized the elastic–plastic regulation of pulverized coal under a certain blending ratio during the tamping process through a scale model experiment. It was concluded that the density and strength of briquettes after tamping molding were related to the tamping work. Dash et al. [6] studied the effect of ash content on the density and strength of coal briquettes after tamping to improve the yield of coal briquettes after tamping, and finally obtained the optimal coal mix ratio. Kim et al. [7] established a three-dimensional model of pulverized coal based on the discrete element method, studied the influence of pulverized coal pores on coke strength, and provided a reference for improving the stacking performance of pulverized coal. These studies are mainly focused on the structure of the tamping machine, the lower frame and the layout of the camshaft phase difference, and the ratio of coal powder and the strength of the coal cake itself. However, the influence of the mechanical properties of the elastic cam itself on the extrusion force between the cam and the tamping hammer is seldom studied.
In terms of the finite element simulation method of rubber and cam, Perez et al. [8] used finite element modelling simulations to predict wear in the cams processed. Guo et al. [9] proposed an adaptive p-version finite element method in their paper for the solution of 3D cam problems, and they solved the concrete-like particle-reinforced composite problems with that method. Maitland et al. [10] used finite element simulation to improve forward motion on cross-slopes compared with single- or double-cantilever spring designs. Louay et al. [11] calculated the bending deflection of the cam profile numerically and verified it for bending deflection at the point of contact by the finite element analysis method. Wang et al. [12] obtained the deformation and stress of the rubber components and the cord reinforcements by FE simulation to judge the rationality of tire construction design. Limrungruengrat et al. [13] obtained predictions of the temperature, cure level distribution in the rubber part, and press force during a curing process from a developed finite element analysis. These studies have mainly used the finite element method to analyze structural wear, strength, and stiffness, and few have applied it to constitutive coefficient simulation and automatic search of the material properties of rubber materials.
In studies of rubber elements constitutive models, most scholars have focused on rubber’s molecular mechanical properties and composite materials’ properties. Besdo et al. [14] presented a new phenomenological inelastic constitutive model for rubberlike materials and demonstrated its good correspondence to cyclic measurements for both uniaxial tension and simple shear tests up to large deformations. Kumar et al. [15] researched a phenomenological model for the viscoelastic behavior of natural rubber and its mechanical behavior. He et al. [16] developed a fitting algorithm that can realize the automatic fitting optimization and determination of the parameters of all SEFs reviewed. This algorithm could quantitatively assess the ability of each SEF to reproduce the experimental data of both unfilled and highly filled rubber nanocomposites. Annarasa et al. [17] proposed a one-dimensional constitutive model for elastomeric materials and captured the changes in constitutive behavior and energy dissipation associated with the Mullins effect. Jha et al. [18] proposed a novel phenomenological constitutive modeling framework that incorporates damage and residual stress capabilities for solids. Yuan et al. [19] first attempted the analysis of the constitutive relations of filled rubber by calculating amplification factors related to stress and strain distributions. Liu et al. [20] established a constitutive model of rubber compound material with the shear strain energy of cord/rubber and compiled the subprograms involved in a constitutive model of anisotropic hyper-elastic materials. The subprograms were used to form an effective prediction method for the deformation behavior of cord/rubber composites. Zhao et al. [21] proposed an optimization algorithm for model parameters fitting and predicted the mechanical behaviors of rubber–cord composites using the developed model. Kurzina et al. [22] studied the elastic hysteretic properties of various polymer-damping composite materials. Dong et al. [23] studied the mechanical properties of complex fabric–rubber composite under different temperatures based on macroscopic and meso-structural characterization. Khodadadi et al. [24] investigated the impact performance of composite panels consisting of plain-woven Kevlar fabric and rubber matrix. And they investigated the deformation and damage mechanism of fabric and composite under impact loading. All in all, most scholars have studied the influence of different rubber fillers on the rubber constitutive structure and the prediction of rubber-forming mechanical properties. However, few scholars have studied a large deformation constitutive model of rubber under different theories and the mechanical properties of composite rubber structures.
Given the aforementioned issues, in conjunction with the operational characteristics of the hammer-lifting device and the rubber test data, this paper establishes a large deformation constitutive model of rubber based on phenomenological theory and derives distinct coefficients for the rubber constitutive model. Additionally, a simulation model is presented to investigate the mechanical characteristics of composite rubber elements during cam rotation. The resulting variations in elastic cam pressure and compression displacement are determined, while also designing an elastic cam stiffness test and discussing discrepancies between experimental and simulated results. The innovations of this paper are as follows:
(1) A constitutive model of the large deformation of rubber based on phenomenological theory is proposed to obtain the relationship between stress and strain under large deformation of rubber. The comparison error between rubber stress based on this method and test data is less than 2%.
(2) A mathematical model of the change of cam compression displacements in lifting the tamping hammer is presented by analyzing the motion characteristics of the elastic cam and the tamping hammer. By establishing a finite element model of the elastic cam and simulating the loading under the contact condition, the variation regulation of the cam pressure with different compression displacements is obtained. And the distribution regulation of the stress and displacement of the composite rubber elements inside the cam is obtained.
(3) A method for measuring the stiffness of the elastic cam is presented, and the test platform is designed and built. Finally, the stiffness curve of the elastic cam is obtained. Experiments verify the correctness and rationality of the simulation results of the elastic cam. The error between cam simulation stiffness and test stiffness is less than 6.18%.
The rest of this paper is organized as follows. Section 2 introduces the calculation method for compression displacement of composite rubber elements in cam rotation. The establishment of the nominal stress and elongation function based on the large deformation of rubber and the determination of different rubber constitutive model coefficients based on test data are introduced in Section 3. The simulation analysis of the mechanical properties of composite rubber elements is presented in Section 4. The stiffness test for elastic cams is introduced in Section 5. Finally, Section 6 summarizes the conclusions of this paper and Section 7 presents the prospect of this research work.

2. Change Analysis of Compression Displacement of Composite Rubber Elements in Cam Rotation

The tamping hammer lifting device is mainly composed of cams, composite rubber elements, friction plates, and tamping hammer rods. Since the tamping hammer lifting device has a symmetrical structure, to simplify the model and shorten the analysis time, a unilateral cam was selected for force analysis, as shown in Figure 3. Each cam is mainly composed of a cam plate, rubber elements, fixed circular plate, intermediate rib plate, double-headed stud, and circular skeleton. When the cam plate is subjected to the load, the force is directly transmitted to the fixed circular plate on both sides. Then, the force is transmitted to one end of composite rubber elements by the fixed circular plate. Finally, the force is transmitted to the internal rib plate through the composite rubber elements. The composite rubber elements refer to the 20 rubber elements that an elastic cam contains. The tamping action is produced by the cam pair rotating relatively opposite on both sides of the tamping hammer to generate extrusion friction to lift the tamping hammer. In the process of cam rotation, the displacement and radial force of the composite rubber elements are continuously changing, which is related to the contact state between the cam profile and the friction plate of the hammer rod.
In Figure 3, when the cam rotates to the arc DA, the cam does not squeeze the hammer and the composite rubber elements do not deform. Meanwhile, the composite rubber elements will not provide pressure to the cam. As the cam continues to rotate and the contact point of the cam profile and the friction plate is on arc AB, the cam begins to squeeze the tamping hammer, and the composite rubber elements begin to deform, providing pressure to the cam. However, the pressure provided at this time does not reach the maximum. When the contact point between the cam profile and the friction plate is on arc BC, the displacement of composite rubber elements reaches the maximum and provides the maximum pressure to the cam. As the cam continues to rotate, when the contact point between the cam profile and the friction plate is on arc CD, the displacement of the composite rubber elements gradually decreases, and its pressure also gradually decreases. Finally, when the cam rotates to the arc DA section, the displacement of composite rubber elements is zero again, and the pressure provided is also zero. Therefore, the motion process of the tamping lift hammer is divided into four stages: initial contact—stable extrusion—imminent separation—complete separation, as shown in Figure 4. Studying the stress state of the cam and its internal rubber elements in a circle is to study the change of compression displacement Xi at each moment when the cam arc ABCD and friction plate contact; the force changes of the composite rubber elements are caused by the Xi change, as shown in Figure 5.
As shown in Figure 3, in section AB, the compression displacement of Xi during cam movement is:
X i = R i X 0
where X0 is the distance between the center of the intermediate rib of the cam and the edge of the friction plate of the tamping hammer.
As shown in Figure 5, according to the sine theorem in △O1O2Ai, it can be seen that:
R 1 sin ( θ 0 θ i ) = l 1 sin O 2 A i O 1 = R i sin A i O 2 O 1
So, in section AB:
R i = R 1 sin ( θ 0 θ i ) sin 180 θ 0 + θ i arcsin [ l 1 R 1 sin ( θ 0 θ i ) ]
Similarly, it can be obtained, in section BC:
R i = l 1 + R 1
in section CD:
R i = R 1 sin ( θ i θ 0 θ 01 ) sin 180 θ i + θ 0 + θ 01 arcsin [ l 1 R 1 sin ( θ i θ 0 θ 01 ) ]
By substituting Equations (3)–(5) into Equation (1), the cam compression Xi of different arc sections of the cam plate is:
X i = R 1 sin ( θ 0 θ i ) sin 180 θ 0 + θ i arcsin [ l 1 R 1 sin ( θ 0 θ i ) ] X 0 l 1 + R 1 X 0 R 1 sin ( θ i θ 0 θ 01 ) sin 180 θ i + θ 0 + θ 01 arcsin [ l 1 R 1 sin ( θ i θ 0 θ 01 ) ] X 0 0 0 θ i < θ 0 θ 0 θ i θ 0 + θ 01 θ 0 + θ 01 θ i 2 θ 0 + θ 01 2 θ 0 + θ 01 < θ i < 2 π
Positive cam pressure FN is:
F N = j = 1 N k j X i
where kj is the stiffness of the rubber element, N/mm.
The unilateral friction force Ff of the tamping hammer is:
F f = μ F N
where µ is the coefficient of friction.
According to Newton’s second theorem:
F f m c g / 2 = m c a c / 2
where mc is the tamping hammer quality, kg; ac is the acceleration of tamping hammer motion, m/s2.

3. Establishment of Constitutive Rubber Model of Elastic Cam Based on the Phenomenological Theory

3.1. Establishment of Nominal Stress and Elongation Function Based on Large Deformation of Rubber

The statistical thermodynamic constitutive model of rubber only applies to the slight deformation of rubber. However, rubber’s most important mechanical feature is that it can produce large elastic deformation. In order to describe the stress–strain behavior of rubber under considerable strain, most research and engineering applications have focused on using continuum mechanics methods to conduct phenomenological analysis of rubber under considerable strain [25]. The phenomenological theory does not study the microstructure and molecular mechanism of rubber but rather observes the macroscopic stress–strain relationship of rubber by the experimental method, finding the expression of strain energy stored in the rubber elastomer, and on this basis, establishing the theory. Based on the continuum mechanics of phenomenological theory, two primary expressions exist for the strain energy function of rubber’s constitutive model. One is the strain energy function expressed by the principal elongation, such as the Ogden model, the other is the strain energy function expressed by the strain invariant, such as the Mooney–Rivlin (M-R) model.
(1)
Nominal Stress and Elongation Function based on the Ogden Rubber Constitutive Model
Ogden strain energy function W is expressed as principal elongation [26]:
W = i = 1 N μ i α i ( λ 1 α i + λ 2 α i + λ 3 α i 3 )
where λ i is the elongation in three directions, and α i and μ i are material constants and are not limited to integers. According to the incompressible characteristics of rubber volume, there is λ 1 λ 2 λ 3 = 1 .
The nominal stress can be obtained directly by the deflection of strain energy function W with respect to the elongation ratio:
σ n o m _ i = W λ i p λ i 1
where p is the undetermined Lagrange multiplier, which can be determined by the boundary conditions.
Based on rubber uniaxial tensile test:
λ 1 = λ λ 2 = λ - 1 2 λ 3 = λ - 1 2 σ 2 = σ 3 = 0
By substituting the Equation (10) into Equation (11) and combined with Equation (12), we derive:
σ nom = i = 1 N μ i ( λ α i - 1 - λ 1 2 α i - 1 )
Expanding Equation (13), when N = 1, the strain energy function is called the Ogden1-order model, and the nominal stress σ n o m :
σ nom = μ 1 ( λ α 1 - 1 - λ 1 2 α 1 - 1 )
When N = 2, the strain energy function is called the Ogden2-order model, and the nominal stress σ n o m :
σ nom = μ 1 ( λ α 1 - 1 - λ 1 2 α 1 - 1 ) + μ 2 ( λ α 2 - 1 - λ 1 2 α 2 - 1 )
When N = 3, the strain energy function is called the Ogden3-order model, and the nominal stress σ n o m :
σ nom = μ 1 ( λ α 1 - 1 - λ 1 2 α 1 - 1 ) + μ 2 ( λ α 2 - 1 - λ 1 2 α 2 - 1 ) + μ 3 ( λ α 3 - 1 - λ 1 2 α 3 - 1 )
Through uniaxial tensile test, coefficients α i and μ i can be obtained respectively.
(2)
Nominal Stress and Elongation Function based on the M-R Rubber Constitutive Model
The simplified formula of strain energy function derived by Mooney–Rivlin is as follows [27]:
W M - R = C 10 I 1 3 + C 01 I 2 3
where I1 and I2 are the basic strain invariants, and the nominal stress σ n o m :
σ nom = 2 1 - λ - 3 λ C 10 + C 01
Then, C10 and C01 can be obtained by uniaxial tensile test data.

3.2. Acquisition of Rubber Uniaxial Tensile Test Data

According to the ISO 37-2017 standard [28], the rubber uniaxial tensile test adopted 12 dumbbell-shaped rubber specimens, as shown in Figure 6a. The narrow part of the specimens was selected as standard thickness type 1, and the main parameters, such as the length of the specimens, are shown in Table 1. The uniaxial tensile test was carried out on an AI-3000 universal tensile machine, as shown in Figure 6b. During the test, the axial loading speed of the upper and lower grippers was set at 500 mm/min, the strain rate of rubber was 0.333 s−1, and the sampling frequency of the test intensifier was 1 Hz. After repeated stretching 10 times, the changes in force and time were continuously monitored.
Considering the dispersion and accuracy of the test results, uniaxial tensile tests were carried out on 3 rubber specimens in each group, and the rubber specimens were stretched by 100%, 300% constant elongation, and 8 MPa elongation to obtain the stress under different elongations. Finally, the average value of all the results was taken as the test result, and the tensile data for the rubber specimens at average temperature were obtained, as shown in Figure 7.
Substitute the test results into the following equation:
σ n o m = 9.8 F A 0
where F is tensile force, kgf.
λ = L 0 + V 0 t L 0 = 1 + ε
where V0 is the axial loading speed, mm/s; t is the tensile time, s.
According to Equations (19) and (20), the relevant stress and strain curves were converted, and the test data are shown in Figure 8.

3.3. Determination of Different Rubber Constitutive Model Coefficients

The stress and strain results of the rubber test were input into the Abaqus software material physical properties interface in the form of an array. The Ogden1-order, Ogden2-order, Ogden3-order, and M-R methods were selected for fitting evaluation, and the corresponding solving coefficients based on the different evaluation methods were displayed on the evaluation interface, as shown in Table 2, where the variance S2 is the average square of the difference between the fitted and test values. The solution coefficients based on the model coefficients in Table 2 were substituted into Equations (14)–(16), and Equation (18), respectively. The stress–strain curves of the different rubber constitutive models are presented in Figure 8.
The test data are shown in Figure 8. By comparing the results of the different rubber constitutive models with test data, the relationship between strain and stress in the M-R constitutive model tends to increase linearly. The relationship between strain and stress of the Ogden1-order, Ogden2-order, and Ogden3-order constitutive models is nonlinear under the condition of large deformation. With the increasing rubber strain, the stress of the Ogden3-order is closer and closer to the test value, and the deviation of M-R stress from the test value increases. As shown in Figure 9, when the strain is less than 4, the fitting error of the Ogden1-order is lower than that of M-R, Ogden2-order, and Ogden3-order, and is less than 5%. The one with the greatest error is the M-R stress fitting value, whose error reaches up to 23%. When the strain is greater than 4, the Ogden3-order stress value has the lowest error, and the error is less than 3%. Therefore, the function of nominal stress and strain is characterized by strain equal to 4 as the dividing point, in other words, the abscissa coordinates corresponding to the point where the four curves intersect, and the error is the least at the dividing point of the piecewise function.
The nominal stress–strain of the rubber constitutive model is simulated as a piecewise function:
σ nom = μ 1 1 + ε α 1 - 1 - 1 + ε 1 2 α 1 - 1 ( ε 4 ) μ 1 1 + ε α 1 - 1 - 1 + ε 1 2 α 1 - 1 + μ 2 1 + ε α 2 - 1 - 1 + ε 1 2 α 2 - 1 + μ 3 1 + ε α 3 - 1 - 1 + ε 1 2 α 3 - 1 ( ε > 4 )
Introduce a step function:
H ( t ) = 1 ( t > 0 ) 0 ( t 0 )
Let t = ε − 4, substitute it into Equation (22), and then substitute the result into Equation (21):
σ nom = μ 1 1 + ε α 1 - 1 - 1 + ε 1 2 α 1 - 1 + μ 2 H ( ε 4 ) 1 + ε α 2 - 1 - 1 + ε 1 2 α 2 - 1 + μ 3 H ( ε 4 ) 1 + ε α 3 - 1 - 1 + ε 1 2 α 3 - 1
The fitting curve based on Equation (23) is shown in Figure 10. This curve is highly coincident with the stress–strain curve obtained by the test in this curve. The stress increases gradually with the increase in strain and it shows nonlinear changes. The error of the stress value of the curve and the stress test value is less than 2%, the variance is 0.0219, and the test curve and the piecewise function curve coincide.

4. Simulation Analysis of Mechanical Properties of Composite Rubber Elements

4.1. Establishment and Simplification of Simulation Model of Composite Rubber Elements

As the whole structure of the elastic cam extruding and lifting the tamping hammer was geometrically symmetrical, a unilateral cam was selected for simulation analysis to improve the computation rate. The simplified finite element model is shown in Figure 11. The cam plate, fixed circular plate, intermediate rib plate, and press plate were discretized using a C3D8R hexahedral element, and the total number of grids was 65,000. The rubber elements were discretized using a C3D8RH hexahedral hybrid element, and the total number of grids for the 20 rubber elements was 246,160. The cam inner and outer plate element type was C3D8R, and the total number of grids was 64,500. In addition to the rubber material, the piecewise-function rubber constitutive data were brought into the finite element model, and the material properties of other parts are shown in Table 3.
As shown by the rubber element on the right in Figure 11, the cylindrical hole of the rubber element on the middle rib plate side and the stud of the middle rib plate were set to bind contact constraints. The lower circular plane of the rubber element and the intermediate rib plate were provided with binding contact constraints. The cylindrical hole of the rubber element on the fixed circular plate side and the stud of the bolt on the fixed circular plate were set to bind contact constraints. The upper circular plane of the rubber element and the fixed circular plate were provided with binding contact constraints.
In the finite element loading model of the elastic cam, the usual hard contact was set between the cam plate and the press plate, and the tangential contact was set with no friction property. The inner surface of the intermediate rib plate was coupled with the cam center, and all degrees of freedom at the coupling point were restricted.
In the load setting, all degrees of freedom except U1 were restricted on the shaft hole surface of the outer fixed circular plate of the cam, and the position of the shaft hole of the intermediate rib plate of the cam was fully constrained. At the coupling point RP1, different displacements in the direction of U1 were set, and degrees of freedom in other directions were restricted. The analysis step type was static general, and the analysis step duration was set to 1s. The deformation process of the cam extrusion of the friction plate of the tamping hammer was simulated, and the changing characteristics of the cam pressure on the composite rubber elements under different cam compression displacements were obtained.

4.2. Stress and Displacement Analysis of the Rubber Element

Firstly, the stress and strain analysis of the single rubber element was performed, and the single rubber element was divided into the same element type and number of grids as in the figure on the right in Figure 11. All degrees of freedom were restricted for the cylindrical hole of the rubber element connected to the middle rib plate. Two planes of the rubber element were constrained by displacement in U3 direction only. The degrees of freedom except in U1 direction were restricted at the cylindrical hole of the rubber element connected to the fixed circular plate. The compression displacement in the direction of U1 of the cylindrical hole of the rubber element connected to the fixed round plate was 3 mm. The analysis step type was static general, and the analysis step duration was set to 1 s. The stress and the displacement distribution of a single rubber element at 3 mm were obtained.
Figure 12a shows the stress nephogram of the rubber element at a compression displacement of 3 mm. It can be seen from Figure 12a that the stress of the rubber element was mainly distributed around the cylindrical hole connected with the fixed circular plate, and the stress gradually decreased from the right half of the inner part of the cylindrical hole to the right end.
The reason for this result is that the stiffness of the bolt is greater than the stiffness of the rubber element, and when the bolt squeezes the rubber element, the top of the bolt compresses the cylindrical hole surface at the bottom of the rubber element as the bolt moves. With the increase in bolt pressure, the relative dislocation of the cylindrical holes at both ends of the rubber element becomes more significant, and the support reaction also increases.
Figure 12b shows the stress nephogram of the rubber element in section view when the compression displacement of the rubber element was 3 mm. According to Figure 12b, the maximum stress of the rubber element was 1.717 MPa, the maximum stress position was on the dividing line of the upper and lower semicircle of the cylindrical hole of the bolt, and the main bearing area was within about 160° of the radiation area of the lower half surface of the cylindrical hole. The reason is that when the elastic cam is rotating the extrusion tamping hammer, with the change in the actual contact radius, the bolt on the cam fixed round plate will transfer the force to the elastic element inner hole, and in the extrusion transition area of the rubber element cylindrical hole there will appear stress concentration.
In actual working conditions, each time the cam rotates, its rubber elements will undergo a process of extrusion and deformation recovery; therefore, the rubber elements are subjected to alternating stress in duty-cycle operation, and these rubber elements are prone to fatigue failure. The location of fatigue failure in the rubber element is mainly in the contact range of 160° between the cylindrical hole of the rubber element and the bolt of the fixed circular plate, and at the two stress concentration positions of the bolt hole it is the most significant.
Figure 13 shows the stress nephograms of the rubber elements at different times. With the increase in time, the stress also increased continuously. The maximum stress was mainly concentrated on both sides of the cylindrical hole circumference, and the main load-bearing area was below the cylindrical hole circumference. At 0.25 s, 0.5 s, 0.75 s, and 1 s, the corresponding maximum stress was 0.355 MPa, 0.761 MPa, 1.216 MPa, and 1.717 MPa, respectively.
As can be seen from the displacement nephogram of the rubber element under a downward compression displacement of 3 mm in Figure 14, the rubber deformation was mainly concentrated in the lower half of the cylindrical hole of the rubber element, and gradually expanded downward. The rubber element was tilted to the lower right, and the two cylindrical holes inside were relatively misaligned. The rubber deformation caused by the dislocation provided a reliable lifting force for the tamping device, thus ensuring the lifting of the tamping hammer. The downward dislocation of the rubber element is caused by the contact between the cylindrical hole surface on the left side of the rubber element and the bolt on the intermediate rib plate of the cam, and the right bolt hole surface is connected with the bolt on the fixed circular plate on the outside of the cam.
This is because, in the actual rotation process of the cam, with the contact between the cam and the friction plate on both sides of the hammer rod, the fixed circular plate of the cam will move in the same direction with the bolt. The bolt on the fixed circular plate provides pressure to the hole surface of the rubber element, and the other end of the rubber element is fixed on the intermediate rib plate of the cam. The joint action of the cam’s inner and outer plate bolts causes the dislocation of the rubber element.

4.3. Influence of Displacement of Composite Rubber Elements on Cam Pressure

Figure 15 shows the stress nephograms of composite rubber elements under different compression displacements. It can be seen from the figure that the maximum stress of the composite rubber elements under 3 mm, 5 mm, 7 mm, and 9 mm displacements were 0.725 MPa, 1.114 MPa, 1.528 MPa, and 1.979 MPa, respectively. With the increase in the compression displacement of the cam, the overall stress on the rubber element gradually increased. The trend and values of the stress distribution for each of the 20 rubber elements inside the cam were the same, indicating that the stress distribution for all the rubber elements was relatively even.
This is because the outside cylindrical holes of the 20 rubber elements are all fixed with the bolts of the fixed circular plate on the outside of the cam. The material stiffness of the fixed circular plate and the bolt stiffness are much higher than that of the rubber element. When the cam plate is under pressure, because the relative deformation of the fixed circular plate and the bolt is very small, it can be regarded as a rigid body, so they move in the direction of the cam plate pressure as a whole. This results in the force direction of the outer cylindrical hole of the rubber element in contact with the bolt, and the size is basically the same.
As can be seen from the displacement nephograms of the composite rubber elements under different compression displacements in Figure 16, the maximum displacement of the composite rubber elements under the pressures of 3 mm, 5 mm, 7 mm, and 9 mm were 4.082 mm, 6.127 mm, 8.175 mm, and 10.23 mm, respectively. With the increase in the compression displacement of the cam, the displacement of the rubber element also increased gradually, and the maximum displacement was concentrated on the connection surface between the rubber element and the outer fixed circular plate of the cam. The deformation distribution trend and values for each of the 20 rubber elements inside the cam were the same, indicating that the deformation for all the rubber elements was relatively even during the deformation process of the composite rubber elements, which could provide stable positive pressure for the elastic cam.
This is because the diameter of the middle hole of the fixed circular plate on the outside of the cam is larger than that of the cam intermediate rib plate fixed shaft, as shown in Figure 3a. Therefore, when the fixed circular plate on the outside of the cam is under pressure, the fixed circular plate drives the outside cylindrical holes of the 20 rubber elements to shift in the pressure direction as a whole. And because the material stiffness and bolt stiffness of the fixed circular plate are much greater than the stiffness of the rubber element, the relative deformation of the fixed circular plate and bolt is small, so the lateral deformation of the rubber element is basically the same, and the value is basically the same.
Figure 17 shows the stress nephograms of a cam under different compression displacements. As can be seen from Figure 17, the maximum stress was mainly distributed in the local position of the contact between the press plate and the cam, and the stress was much lower than the allowable stress of the cam material. The maximum contact stress between the cam and the press plate increased from 33.75 MPa to 113.5 MPa with compression increasing from 3 mm to 9 mm.
This is because, with the cam under increasing compression displacements, the displacement of the rubber elements inside the cam is also increasing, and the elastic force provided by the elastic elements is also greater, making the contact pressure between the cam and the press plate increase.
Figure 18 shows the pressure change of the elastic cam under different compression displacements. With the increase in the displacement of the composite rubber elements, the pressure it provided to the cam also gradually increased, and the relationship between the displacement and the pressure of the cam was approximately linear. When the displacement is 1 mm, the cam pressure is about 7715 N; when the displacement is 5 mm, the cam pressure is 22,909 N; when the displacement is 10 mm, the cam pressure is 40,000 N. It can provide sufficient lifting force when the displacement is in the range of 3~5 mm and the cam pressure is in the range of 15,300 N~23,000 N.

5. Stiffness Test of Elastic Cam

5.1. Test Setup

To further study the mechanical characteristics of the elastic cam of the tamper, the pressure and compression displacement of a single cam was measured by the test method, for which a test platform was designed and built. The test platform mainly included the main frame, loading cylinder, pressure sensor, loading balance plate, elastic cam specimen, displacement sensor, fixed shaft, u-shaped support, pad, dynamic and static test analyzer DH3817, etc., as shown in Figure 19.
The elastic cam was threaded through the shaft, and both ends of the shaft were placed on the u-shaped support. The center of the cam plate of the elastic cam was located just below the loading application point; the cam was at 0°. In order to simulate the contact state between the cam and the tamping hammer rod in the working process, a loading balance plate with high stiffness was set at the loading application point. The balance plate distributes the external force evenly on the edge of the cam. In the loading process, this plate was tangent to the upper edge of the cam, and its displacement was the same as that of the upper edge of the cam. It could also be used as the reference surface for the displacement signal acquisition.
A pressure sensor (SK118) was installed on the loading cylinder to improve the accuracy of the pressure readings. Pressure sensors were used to measure pressure and collect continuous dynamic signals. The displacement sensor (GT2) was used to measure the cam displacement, and the detection accuracy of the displacement sensor was 0.01 mm. Three aspects of displacement were monitored, namely, the displacement of the upper edge of the cam, the displacement of the lower edge of the cam, and the displacement of the camshaft, to measure the displacement of the cam accurately. The displacement of the upper and lower edges of the cam reflected the position change of the cam during the compression process. The purpose of monitoring the displacement of the camshaft was to detect the displacement of the u-shaped support. The displacement of the upper edge of the cam was monitored by four corners of the loading balance plate. The error caused by the uneven installation of the loading balance plate could be eliminated by installing four displacement sensors. Two displacement detection points were set on the surface of the lower edge of the cam to detect its displacement. Two displacement detection points were set inside the u-shaped points on both sides to measure the displacement of the camshaft.

5.2. Signal Acquisition

The test adopted the manual hydraulic loading mode, which was slow in loading speed and belonged to the static load mode. To reflect the slight changes in pressure and displacement, the acquisition frequency was set at 50 Hz.
The test was divided into two stages: preloading and measurement. The preloading stage was to eliminate the displacement error caused by the displacement sensor’s installation gap and each part’s gap. Since the loading balance plate and the upper edge of the cam were detached before loading, it had a particular gap from the upper edge of the cam. The displacement sensor of the lower edge of the cam could always contact the lower edge of the cam, so in the preloading stage, the lower edge of the cam was set as reference. When it produced a small amount of displacement, it was considered that each part had been compacted. At that moment, the preloading was stopped, and this state was taken as the reference zero point. The measurement test in the second stage was carried out on this basis.
In the test, the compression axis was located in the central position of the cam boss for the pressure test, and a total of 20 load tests were carried out. In the large amount of data collected, the displacement and pressure values under the specified displacements were selected for analysis. The method for selecting data was to select average displacement values of multiple sampling points (generally in the range of 50–100) within a specific range of the specified displacement (such as the displacement difference in the range of 0.01–0.03 mm). The range of sampling points was adjusted so that its average value reached satisfactory accuracy. Then, the average pressure of corresponding sampling points was calculated as the corresponding value of displacement and pressure. Finally, the pressure–displacement test curve was drawn as shown in Figure 20.
As shown from the test curve in Figure 20, the cam pressure presented an increasing linear trend with the combined elastic cam displacement increasing, and the pressure value increased from 7500 N to 39,540 N. When the pressure displacement was 1 mm, the cam pressure was about 7500 N; when the pressure displacement was 5 mm, the maximum pressure of the cam was about 23,439 N. It could provide sufficient lifting force when the cam displacement was in the range of 3~5 mm and the cam pressure was in the range of 16,384~23,439N. Although the strain and the stress of the single rubber element are nonlinear, the compression displacement of the composite rubber element is linearly increased because of the forced deformation of the two ends of the rubber element from the fixed round plate and the intermediate rib of the cam.

5.3. Comparative Analysis of Test and Simulation Results

As shown in Figure 20, the experimental results were compared both with simulation results using the rubber piecewise-function constitutive model and with simulation results using the rubber elastic modulus E as a constant value. As the elastic cam’s compression displacement increases, the cam’s positive pressure increases, but as the compression displacement of the cam continues to increase, the simulation results using the rubber piecewise-function constitutive model are closer to the test data.
The error analysis in Figure 21 shows that the positive pressure error between the test and the simulation with rubber elastic modulus E as a constant value is between 5.16% and 13.89%, while the positive pressure error between the test and the simulation of the rubber stress–strain relationship with piecewise-function constitutive values is between 0.25% and 6.18%. The simulation accuracy of the rubber stress–strain relationship with the piecewise-function constitutive values is improved by 55.5%, and the simulation results are closer to the actual results.

6. Conclusions

A rubber piecewise-function constitutive model based on phenomenological theory was established to obtain the mechanical properties of composite rubber elements during cam rotation in this paper. The simulation model of the contact between the elastic cam and the friction plate of the tamping hammer was established. The stress–strain regulation of the composite rubber elements in the elastic cam under different pressure was studied, and the curves of the compression displacement and positive pressure of the cam were obtained. The stiffness test of the elastic cam was carried out, and the difference between the test results and the simulation results was discussed. Finally, the following conclusions are drawn:
(1)
The stress–strain curve of rubber shows a nonlinear increase, which could be seen from the tensile test and constitutive simulation. The stress–strain relationship based on different rubber constitutive conditions has an obvious demarcation point when the strain is 4. The stress–strain curve of rubber based on piecewise function has a high coincidence with the curve obtained by the experiment, and its error is less than 2%.
(2)
The simulation results of composite rubber elements mechanical properties show that the cam pressure increases linearly from 7715N to 40000N as the cam compression displacement increases from 1mm to 10mm. The deformation trend and size of 20 rubber elements inside the cam are the same, and the deformation of rubber elements increases.
(3)
The results of the elastic cam test show that, with the increase in compression displacement, the positive pressure of the cam increases, and the simulation results of the rubber stress–strain relationship with piecewise-function constitutive value are closer to the test data, between 0.25–6.18%, so the simulation accuracy is improved by 55.5%. The simulation results are close to the actual results.

7. Prospect of Research Work

The paper developed a rubber constitutive model using piecewise function to describe the mechanical properties of composite rubber elements during cam rotation, which will be helpful in the mining industry to control the lifting height to avoid coal cake collapse.
In future work, we will focus on the damage evolution of rubber and the prediction of cam life.

Author Contributions

L.H. and Z.S. conceived the idea of this work; L.H. and S.Z. conducted the experiment; data curation, L.H.; original draft preparation, L.H.; review and editing, Z.S. and Y.L. All authors have read and agreed to the published version of the manuscript.

Funding

This research was funded by the National Natural Science Foundation of China (No.51675075) and the Dalian Science and Technology Innovation Fund (No. 2021JJ12GX009).

Institutional Review Board Statement

Not applicable.

Informed Consent Statement

Not applicable.

Data Availability Statement

The data used to support the findings of this study are available from the corresponding author upon request.

Conflicts of Interest

The authors declare no conflict of interest.

References

  1. Sun, N.X.; Center, T. Dynamic Analysis and Study of Eight Tamping Hammer Unit of 6.25m Tamping Machine. Mech. Eng. Auto. 2017, 3, 95–96+98. [Google Scholar] [CrossRef]
  2. Fan, H.L. Force Analysis of Tamping Machine Frame. Shanxi Metall. 2018, 41, 35–38. [Google Scholar]
  3. Liu, J.B. Stamping Power Promotion of Stamping Machine for Coke Oven Production. Mech. Manag. Dev. 2016, 2, 91–93. [Google Scholar]
  4. Gabriel, K.P.; Rodrigo, M.; De, C.; Arno, K.; Luís, M. Contact Parameter Estimation for Dem Simulation of Iron Ore Pellet Handling. Powder Technol. 2013, 248, 84–93. [Google Scholar]
  5. Abel, F.; Rosenkranz, J.; Kuyumcu, H.Z. Stamped Coal Cakes in Cokemaking Technology: Part 1-A Parameter Study on Stampability. Ironmak. Steelmak. 2013, 36, 321–326. [Google Scholar] [CrossRef]
  6. Dash, P.S.; Krishnan, S.H.; Sharma, R.; Banerjee, P.K. Laboratory Scale Investigation on Maximising Utilisation of Carbonaceous Inerts in Stamp Charging to Improve Coke Quality and Yield. Ironmak. Steelmak. 2013, 34, 23–29. [Google Scholar] [CrossRef]
  7. Kim, S.Y.; Sasaki, Y. Simulation of Effect of Pore Structure on Coke Strength Using 3-dimensional Discrete Element Method. Isij Int. 2010, 50, 813–821. [Google Scholar] [CrossRef] [Green Version]
  8. Perez, C.J.; Irigoyen, R.L.; Bonel, J.P.; Iriarte, J.L.; Perez, D.S.; Arbizu, I.P. Experimental and FEM Analysis of Wear Behaviour in AA5083 Ultrafine-Grained Cams. Metals 2020, 10, 479. [Google Scholar] [CrossRef] [Green Version]
  9. Guo, R.Q.; Xiao, Y.X. An Adaptive P-FEM for Three-dimensional Concrete Aggregate Models. Int. J. Model. Simul. Sci. Comput. 2020, 11, 2050004. [Google Scholar] [CrossRef]
  10. Maitland, M.E.; Allyn, K.J.; Ficanha, E.M.; Colvin, J.M.; Wernke, M.M. Finite Element Simulation of Frontal Plane Adaptation Using Full-Foot, Split-Toe, and Cam-Linkage Designs in Prosthetic Feet. JPO 2022, 34, 14–21. [Google Scholar] [CrossRef]
  11. Louay, S. Yousuf, Deflection Calculation of Cam Profile Due to a Hertzian Contact Pressure. J. Mech. 2021, 37, 149–160. [Google Scholar]
  12. Wang, Y.L.; Li, Z.; Li, Z.; Wang, Y. Finite Element Simulation of Radial Tire Building and Shaping Processes Using an Elasto-viscoplastic Model. Cmes-Comp. Model Eng. 2023, 135, 1187–1208. [Google Scholar]
  13. Limrungruengrat, S.; Chaikittiratana, A.; Pornpeerakeat, S.; Chantrasmi, T. Thermo-Mechanical Finite Element Simulation and Validation of Rubber Curing Process. J. Mech. Sci. Technol. 2022, 36, 3039–3046. [Google Scholar]
  14. Besdo, D.; Ihlemann, J. A Phenomenological Constitutive Model for Rubberlike Materials and Its Numerical Applications. Int. J. Plast. 2003, 19, 1019–1036. [Google Scholar] [CrossRef]
  15. Kumar, D.; Lateefi, M.M.; Sarangi, S. A Phenomenological Model for the Viscoelastic Behaviour of Natural Rubber. In Proceedings of the IOP Conference Series: Materials Science and Engineering, Bengaluru, India, 16–18 August 2019. [Google Scholar]
  16. He, H.; Zhang, Q.; Zhang, Y.R.; Chen, J.F.; Zhang, L.Q.; Li, F.Z. A Comparative Study of 85 Hyperelastic Constitutive Models for Both Unfilled Rubber and Highly Filled Rubber Nanocomposite Material. Nano Mater. Sci. 2022, 4, 64–82. [Google Scholar] [CrossRef]
  17. Annarasa, V.; Popov, A.A.; De, F. A Phenomenological Constitutive Model for the Viscoelastic Deformation of Elastomers. Mech. Time-Depend. Mater. 2020, 24, 463–479. [Google Scholar] [CrossRef]
  18. Jha, N.K.; Merodio, J.; Reinoso, J. A General Non-Local Constitutive Relation for Residually Stressed Solids. Mech. Res. Commun. 2019, 101, 103421. [Google Scholar] [CrossRef]
  19. Yuan, B.; Zeng, F.L.; Cui, J.Z.; Wang, Y.S. Molecular Simulation Guided Constitutive Modeling of Filled Rubber: Bridging Structural Parameters to Constitutive Equations. Polymer 2022, 254, 125090. [Google Scholar]
  20. Liu, H.J.; Cui, H.T.; Zhang, H.J. A Constitutive Model of Flexible Composites Used in Bump of Particle Separator. J. Propul. Technol. 2019, 40, 1869–1875. [Google Scholar]
  21. Zhao, Z.H.; Mu, X.H.; Du, F.P. Constitutive Model Research for Rubber-Cord Composites Used in Rubber Track. Mater. Today Commun. 2020, 23, 100937. [Google Scholar]
  22. Kurzina, E.G.; Kolmakov, A.G.; Aksenov, Y.N.; Kurzina, A.M.; Bogachev, A.Y.; Semak, A.V. Comparison of the Composite Materials Intended for Damping Elements for the Infrastructure of Rail Transport and Rolling Stock. Russ. Metall. 2019, 4, 448–452. [Google Scholar] [CrossRef]
  23. Dong, Y.F.; Yao, X.F.; Yan, H.; Yuan, L.; Yang, H. Macro- and Mesoscopic Mechanical Properties of Complex Fabric Rubber Composite under Different Temperatures. Compos. Struct. 2019, 230, 111510. [Google Scholar] [CrossRef]
  24. Khodadadi, A.; Liaghat, G.; Ahmadi, H. Impact Response of Kevlar/rubber Composite. Compos. Sci. Technol. 2019, 184, 107880. [Google Scholar] [CrossRef]
  25. Huang, J.L.; Jie, G.J.; Liu, Z.W. FEA of Hyperelastic Rubber Material Based on Mooney-Rivlin Model and Yeoh Model. China Rubber Ind. 2008, 55, 467–471. (In Chinese) [Google Scholar]
  26. Ogden, R.W. Large Deformation Isotropic Elasticity: On the Correlation of Theory and Experiment for Compressible Rubberlike Solids. Proc. Math. Phys. Eng. Sci. 1972, 328, 567–583. [Google Scholar] [CrossRef]
  27. Mooney, M.J. A Theory of Large Deformation. J. Appl. Phys. 1940, 11, 582–592. [Google Scholar] [CrossRef]
  28. ISO 37-2017; International Standard. Rubber, Vulcanized or Thermoplastic-Determination of Tensile Stress-Strain Properties. ISO: Geneva, Switzerland, 2017.
Figure 1. Coal cake tamper: 1. tamping hammer; 2. friction plate; 3. elastic cam.
Applsci 13 09247 g001
Figure 2. Problems on the work site: (a) cracked cam rubber elements; (b) coal cake collapse.
Applsci 13 09247 g002
Figure 3. Schematic diagram of force and composition of elastic cam: (a) cam and friction plate force diagram; (b) cam structure diagram: 1. composite rubber elements; 2. cam intermediate rib plate fixed shaft; 3. cam plate; 4. tamping hammer friction plate; 5. double stud; 6. circular frame; 7. fixed circular plate.
Applsci 13 09247 g003
Figure 4. Schematic diagram of the relative motion process between the cam and the tamping hammer of the tamping hammer lifting device: (a) initial contact; (b) steady extrusion; (c) imminent separation; (d) complete separation; 1. tamping hammer rod; 2. friction plate; 3. cam; 4. composite rubber elements.
Applsci 13 09247 g004
Figure 5. Schematic diagram of geometric relation of the compression force of cam plate.
Applsci 13 09247 g005
Figure 6. Uniaxial tensile testing machine and specimens: (a) rubber specimens; (b) testing machine.
Applsci 13 09247 g006
Figure 7. Curve of rubber tensile time and force.
Applsci 13 09247 g007
Figure 8. The results of different rubber constitutive models compared with test data.
Applsci 13 09247 g008
Figure 9. Error analysis between the results of different rubber constitutive models and test data.
Applsci 13 09247 g009
Figure 10. Comparison of rubber constitutive piecewise function with test data.
Applsci 13 09247 g010
Figure 11. The diagram of finite element loading model of elastic cam.
Applsci 13 09247 g011
Figure 12. Stress nephogram of the rubber element: (a) stress of the rubber element; (b) stress of the rubber element in section view.
Applsci 13 09247 g012
Figure 13. Stress nephograms of rubber element at different times: (a) 0.25 s; (b) 0.5 s; (c) 0.75 s; (d) 1 s.
Applsci 13 09247 g013aApplsci 13 09247 g013b
Figure 14. Displacement nephogram of rubber element: (a) displacement of rubber element; (b) displacement of rubber element in section view.
Applsci 13 09247 g014
Figure 15. Stress nephograms of composite rubber elements under different compression displacements: (a) 3 mm; (b) 5 mm; (c) 7 mm; (d) 9 mm.
Applsci 13 09247 g015
Figure 16. Displacement nephograms of composite rubber elements under different compression displacements: (a) 3 mm; (b) 5 mm; (c) 7 mm; (d) 9 mm.
Applsci 13 09247 g016
Figure 17. Stress nephograms of a cam under different compression displacements: (a) 3 mm; (b) 5 mm; (c) 7 mm; (d) 9 mm.
Applsci 13 09247 g017
Figure 18. Pressure change of elastic cam under different compression displacements.
Applsci 13 09247 g018
Figure 19. Test platform of elastic cam: 1. main frame; 2. loading cylinder; 3. pressure sensor SK118; 4. loading balance plate; 5. elastic cam specimen; 6. displacement sensor GT2; 7. fixed shaft; 8. u-shaped support; 9. pad; 10. dynamic and static test analyzer DH3817.
Applsci 13 09247 g019
Figure 20. Comparison of simulation model and test data curves.
Applsci 13 09247 g020
Figure 21. Errors of test data and simulation data based on different constitutive models.
Applsci 13 09247 g021
Table 1. Main parameters of the specimen.
Specimen NameSpecimen Length L0 (mm)Width (mm)Thickness (mm)Cross Area A0 (mm2)
NR70 vulcanized rubber 25   ±   0.5 6 0 + 0.4 2   ±   0.2 ~12
Table 2. Coefficients under different constitutive models.
Constitutive Model NameSolution CoefficientsVariance S2
Ogden1-orderµ = 1.097, α = 2.5080.296
Ogden2-orderµ1 = 1.552, α1 = 2.608, µ2 = −0.814, α2 = −5.7340.11
Ogden3-orderµ1 = 1.524, α1 = 2.528, µ2 = 5.16 × 10⁻⁸, α2 = 9.22, µ3 = −0.757, α3 = −5.2560.0246
M-RC10 = 1.26, C01 = −1.04 2.786
Table 3. Material properties of each part of elastic cam.
NameModulus of Elasticity (MPa)Poisson’s RatioDensity (kg/mm3)
cam plate2.03 × 1050.37.85 × 10−6
fixed circular plate2.03 × 1050.37.85 × 10−6
cam internal rib plate2.03 × 1050.37.85 × 10−6
press plate0.5 × 1050.351.44 × 10−6
Disclaimer/Publisher’s Note: The statements, opinions and data contained in all publications are solely those of the individual author(s) and contributor(s) and not of MDPI and/or the editor(s). MDPI and/or the editor(s) disclaim responsibility for any injury to people or property resulting from any ideas, methods, instructions or products referred to in the content.

