Abstract
Medical coding plays an essential role in medical billing, health resource planning, clinical research and quality assessment. Automated coding systems offer promising solutions to streamline the coding process, improve accuracy and reduce the burden on medical coders. To date, there has been limited research focusing on inpatient diagnosis coding using an extensive comprehensive dataset and encompassing the full ICD-10 code sets. In this study, we investigate the use of language models for coding inpatient diagnoses and examine their performance using an institutional dataset comprising 230,645 inpatient admissions and 8677 diagnosis codes spanning over a six-year period. A total of three language models, including two general-purpose models and a domain-specific model, were evaluated and compared. The results show competitive performance among the models, with the domain-specific model achieving the highest micro-averaged F1 score of 0.7821 and the highest mean average precision of 0.8097. Model performance varied by disease and condition, with diagnosis codes with larger sample sizes producing better results. The rarity of certain diseases and conditions posed challenges to accurate coding. The results also indicated the potential difficulties of the model with long clinical documents. Our models demonstrated the ability to capture relevant associations between diagnoses. This study advances the understanding of language models for inpatient diagnosis coding and provides insights into the extent to which the models can be used.
1. Introduction
Medical coding is the process of assigning standardised codes to diagnoses, procedures, treatments, tests and other services [1,2]. It involves converting extensive clinical information into alphanumeric codes that represent specific medical conditions, interventions and related data [2]. This task is complicated and time-consuming, requiring expertise and attention to detail [3]. These codes are essential for various purposes, including reimbursement, clinical research, service analysis and quality assessment [2].
The main system for coding diagnoses in health care is the International Classification of Diseases (ICD) [4,5,6], which provides codes for diagnosing diseases and other health conditions. Medical coders play a crucial role in the coding process. They review patient records, including doctor’s notes, laboratory test results, radiology reports and other relevant documentation, to extract the necessary information for assigning the appropriate codes [1,2,3]. Medical coders must have a thorough understanding of medical terminology, anatomy, physiology and coding guidelines to ensure accurate and consistent coding [3].
The ICD is a comprehensive system maintained by the World Health Organization (WHO) [4,5,6]. Over time, the ICD has been revised periodically to ensure accuracy and relevance in recording medical conditions and procedures. The current version is ICD-11 [6], published on 1 January 2022, and its widespread adoption is a gradual process. Most countries currently use ICD-10 [5] and some countries still use ICD-9 or even ICD-8 [4]. Each subsequent revision of ICD brings expanded code sets that capture a broader range of diagnoses and procedures. ICD-10 includes an extensive range of codes organised into 22 chapters with subclassifications that allow additional details such as cause, manifestation, severity, anatomical site and type of disease to be specified [5]. Some countries have implemented modifications to accommodate their specific needs and healthcare practices, such as the ICD-10-AM (Australian Modification) and the ICD-10-TM (Thai Modification).
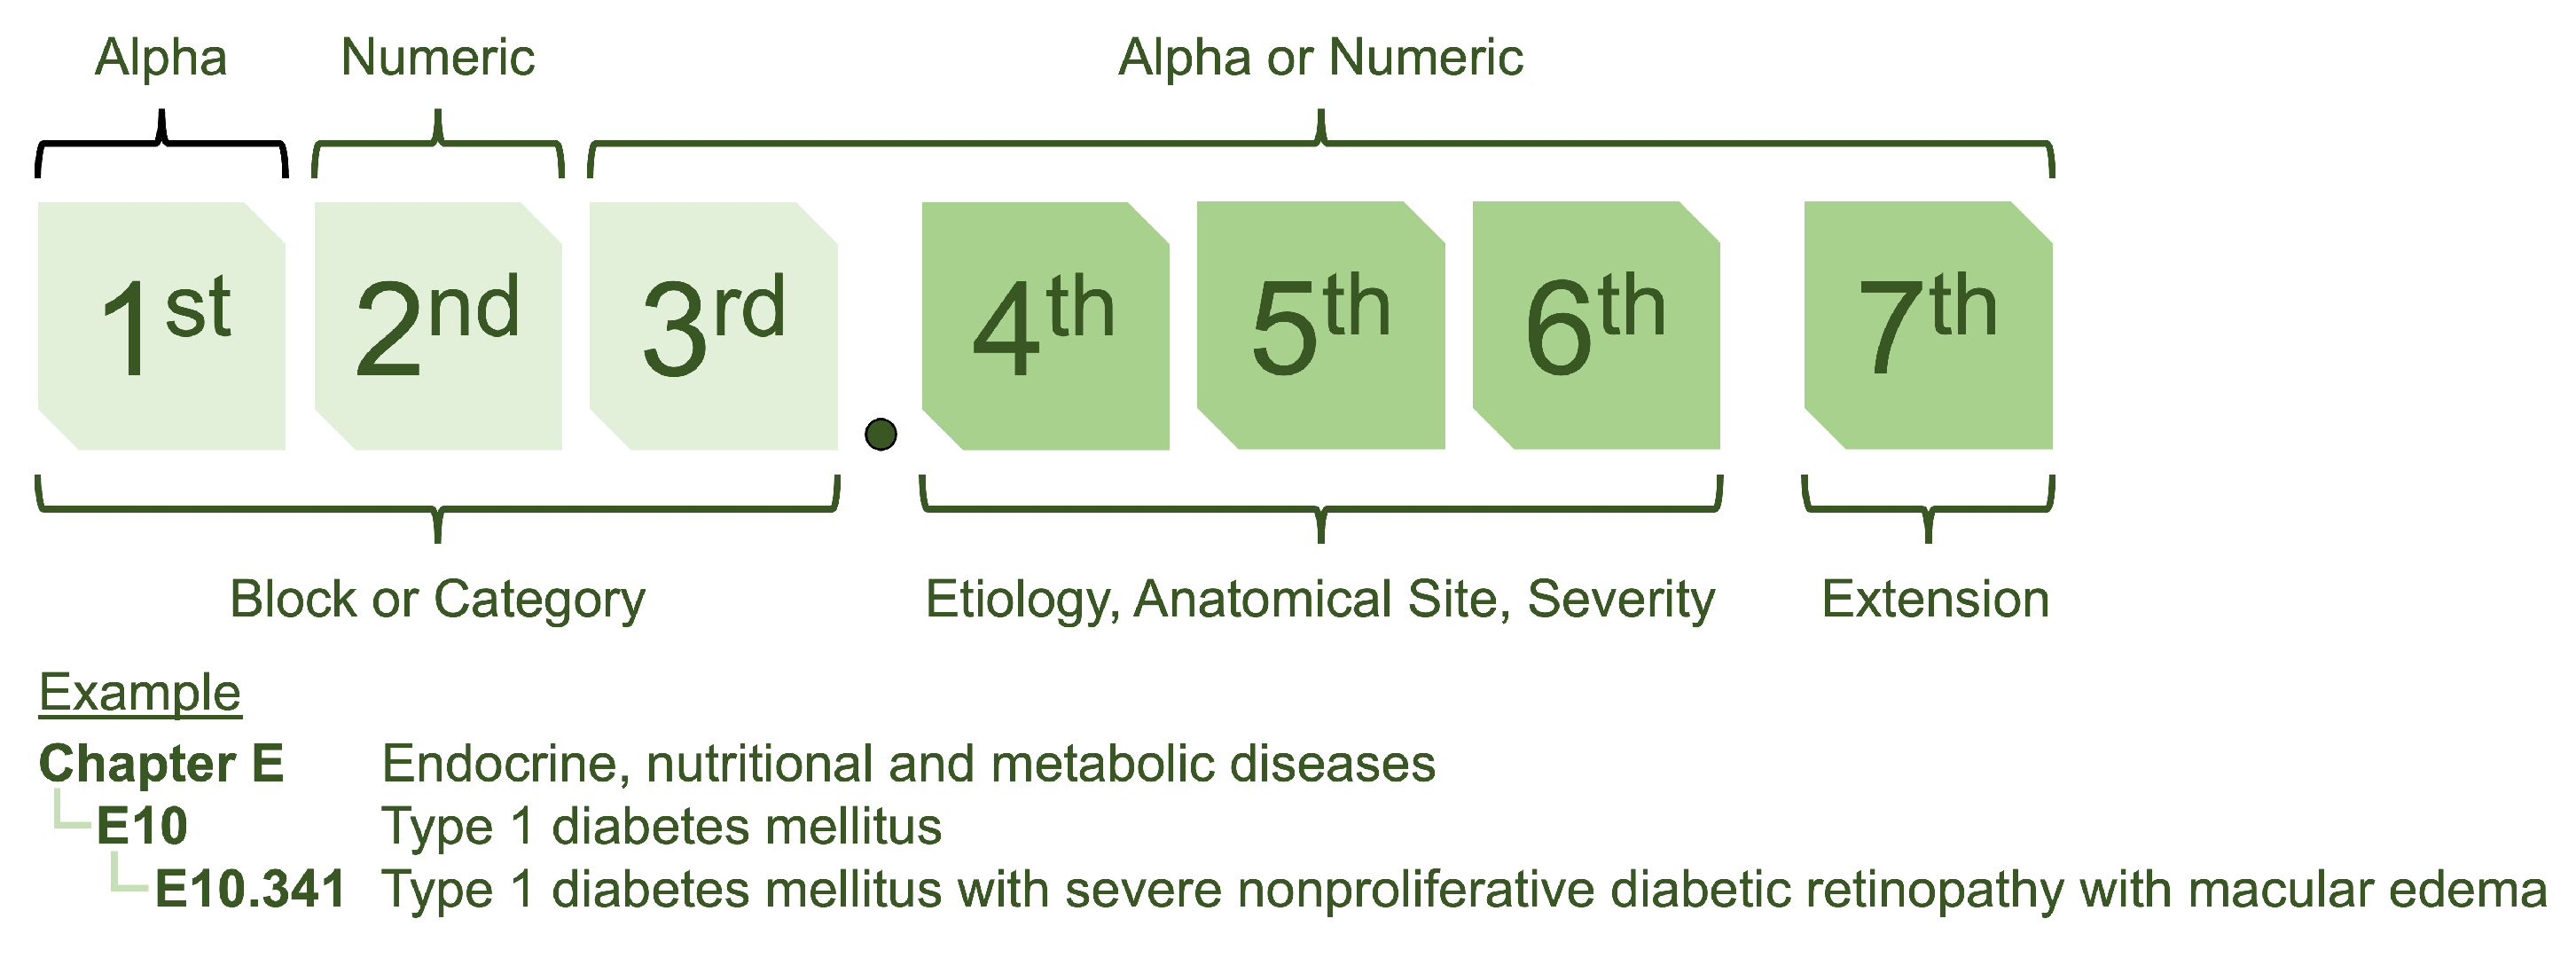
The structure of ICD-10 is designed to provide a systematic approach to coding (see Figure 1) [5]. It utilizes a seven-character format, with the first three characters referred to as “blocks” and providing a general classification of the type of disease. The following four characters represent sub-classifications allowing for more precise identification and categorisation.

Figure 1.
The ICD-10 coding structure is a hierarchical system with alphanumeric codes. The first three characters represent the general classification of the type of disease, while additional characters indicate more specific details such as location and severity.
Accurate medical coding is essential for reimbursement and contributes to data analysis, resource allocation, clinical research and data sharing between healthcare providers [2]. The increasing workload due to the growing number of patient records makes medical coding an intensive task [3]. Advanced technologies such as artificial intelligence (AI) and natural language processing (NLP) can automate or semi-automate coding, reducing the burden on human coders and improving efficiency [7,8]. For example, AI-powered systems can analyse clinical records such as doctor’s notes and medical records, as well as historical coding data, to suggest appropriate codes based on the documented information [8]. They can also compare coded information with clinical documentation to identify discrepancies or potential errors, ensuring coding integrity and compliance with coding guidelines.
The application of NLP in medical coding has attracted much attention in recent years [7,8,9,10,11,12,13,14,15,16]. In 2001, Chapman et al. [9] introduced a rule-based algorithm that uses regular expressions to identify diseases in discharge summaries. In 2007, Crammer et al. [10] proposed a combined learning system from three different learning techniques for ICD-9-CM code assignment. More recently, the field has shifted from rule-based techniques to machine learning methods. Hasan et al. [11] compared Convolutional Neural Networks (CNN) and Support Vector Machine (SVM) models for ICD classification. The authors suggested that CNN performed well on diagnosis codes with many training examples, while SVM performed better than CNN on diagnosis codes with few training examples. Moons et al. [12] used a multiple-view CNN with regularised label-dependent attention. Xu et al. [13] used a multimodal model integrating data from multiple modalities to predict ICD-10 codes. In a non-English context, Boytcheva [14] used SVM for ICD classification of Bulgarian medical records. Yu et al. [15] used a multilayer bidirectional recurrent neural network (RNN) for ICD classification in a Chinese dataset. Almago et al. [16] used an ensemble multi-label text classification algorithm for Spanish hospital summaries. They suggested that when the class distribution is extreme, using an ensemble approach that takes coding frequency into account may lead to better results.
A language model is an AI model that learns the statistical patterns, relationships and structures of language. It is typically pre-trained using large amounts of textual data so that it can develop a deep understanding of language structures and semantics. During pre-training, the language model is exposed to unlabelled text and learns to predict masked words, next words, or sequences of words in sentences. This process enables the model to grasp grammar, syntax and semantic relationships between words. The pre-trained language model can then be fine-tuned using labelled data for specific language comprehension tasks, such as text generation, completion, translation, sentiment analysis and question answering.
BERT (Bidirectional Encoder Representations from Transformers) [17] is a language model that has revolutionised NLP through its ability to understand and capture the semantic meaning and context of words and sentences. BERT has shown remarkable performance on various NLP tasks. BERT was originally trained on 3.3 billion English words from Wikipedia and has been extended to multilingual domains such as mBERT [17] and XLM [18], as well as domain-specific languages, such as BioBERT [19] and ClinicalBERT [20], which were pre-trained on biomedical data. Recently, Amin et al. [21] and Biseda et al. used BioBERT and ClinicalBERT, respectively, for ICD-10 classification using the MIMIC dataset [22]. ClinicalBERT outperformed BioBERT in terms of performance. Silvestri et al. [23] used XLM for ICD-10 classification, focusing on the Italian context. Lopez-Garcia et al. [24] used mBERT for automatic clinical coding in the Spanish context. In addition, Remmer et al. [25] used KB-BERT for ICD classification in the Swedish context. However, these studies cannot be directly compared because of the different methods and datasets. Each study used a different approach. Some studies specifically analysed the block level of the ICD code or focused only on some of the most common codes from the extensive range of over ten thousand ICD-10 codes. To date, due to the public availability of clinical data, there have been relatively few studies that have harnessed the power of large institutional datasets that include the full ICD-10 code sets. In this context, the full performance potential of language models for automatic ICD-10 coding remains largely untapped.
This study aimed to explore the potential of using language models to support coding of inpatient diagnoses. We investigated how language models can be used to analyse clinical records and extract relevant diagnosis codes. For our study, we used our extensive clinical data, which spans 6 years and includes 230,645 inpatient admissions and 8677 diagnosis codes. Our goal was to address two important questions: (1) How accurate can a language model-based algorithm for ICD-10 classification be when clinical data of one institution are utilized? and (2) To what extent can the algorithm be used? We investigated the performance of the algorithm on different types of diagnoses, including common diseases and rare and complex cases. We explored the scope of the algorithm and identified specific areas where it might excel or encounter challenges. This can provide valuable insights into whether automatic or semi-automatic coding of diagnoses is ready for application in hospital information systems (HIS).
This study makes notable contributions to inpatient diagnosis coding by investigating the effectiveness of language models on a comprehensive dataset spanning a six-year period with the full ICD-10 code sets. We examined both general-purpose language models and a domain-specific language model. Our results illustrate the competitive performance of the language models and highlight their potential to improve coding accuracy. We analysed the performance of the models on different diagnostic codes, providing insights into the impact of sample size on coding accuracy. We used co-occurrence analysis to ensure that the models were able to capture relevant associations between diagnoses. We also identified factors that influence performance, including disease rarity and document length. This work highlights the need for larger datasets, class imbalance strategies, multi-hospital collaboration and integration of multidimensional data to improve automatic coding systems.
2. Materials and Methods
2.1. Dataset
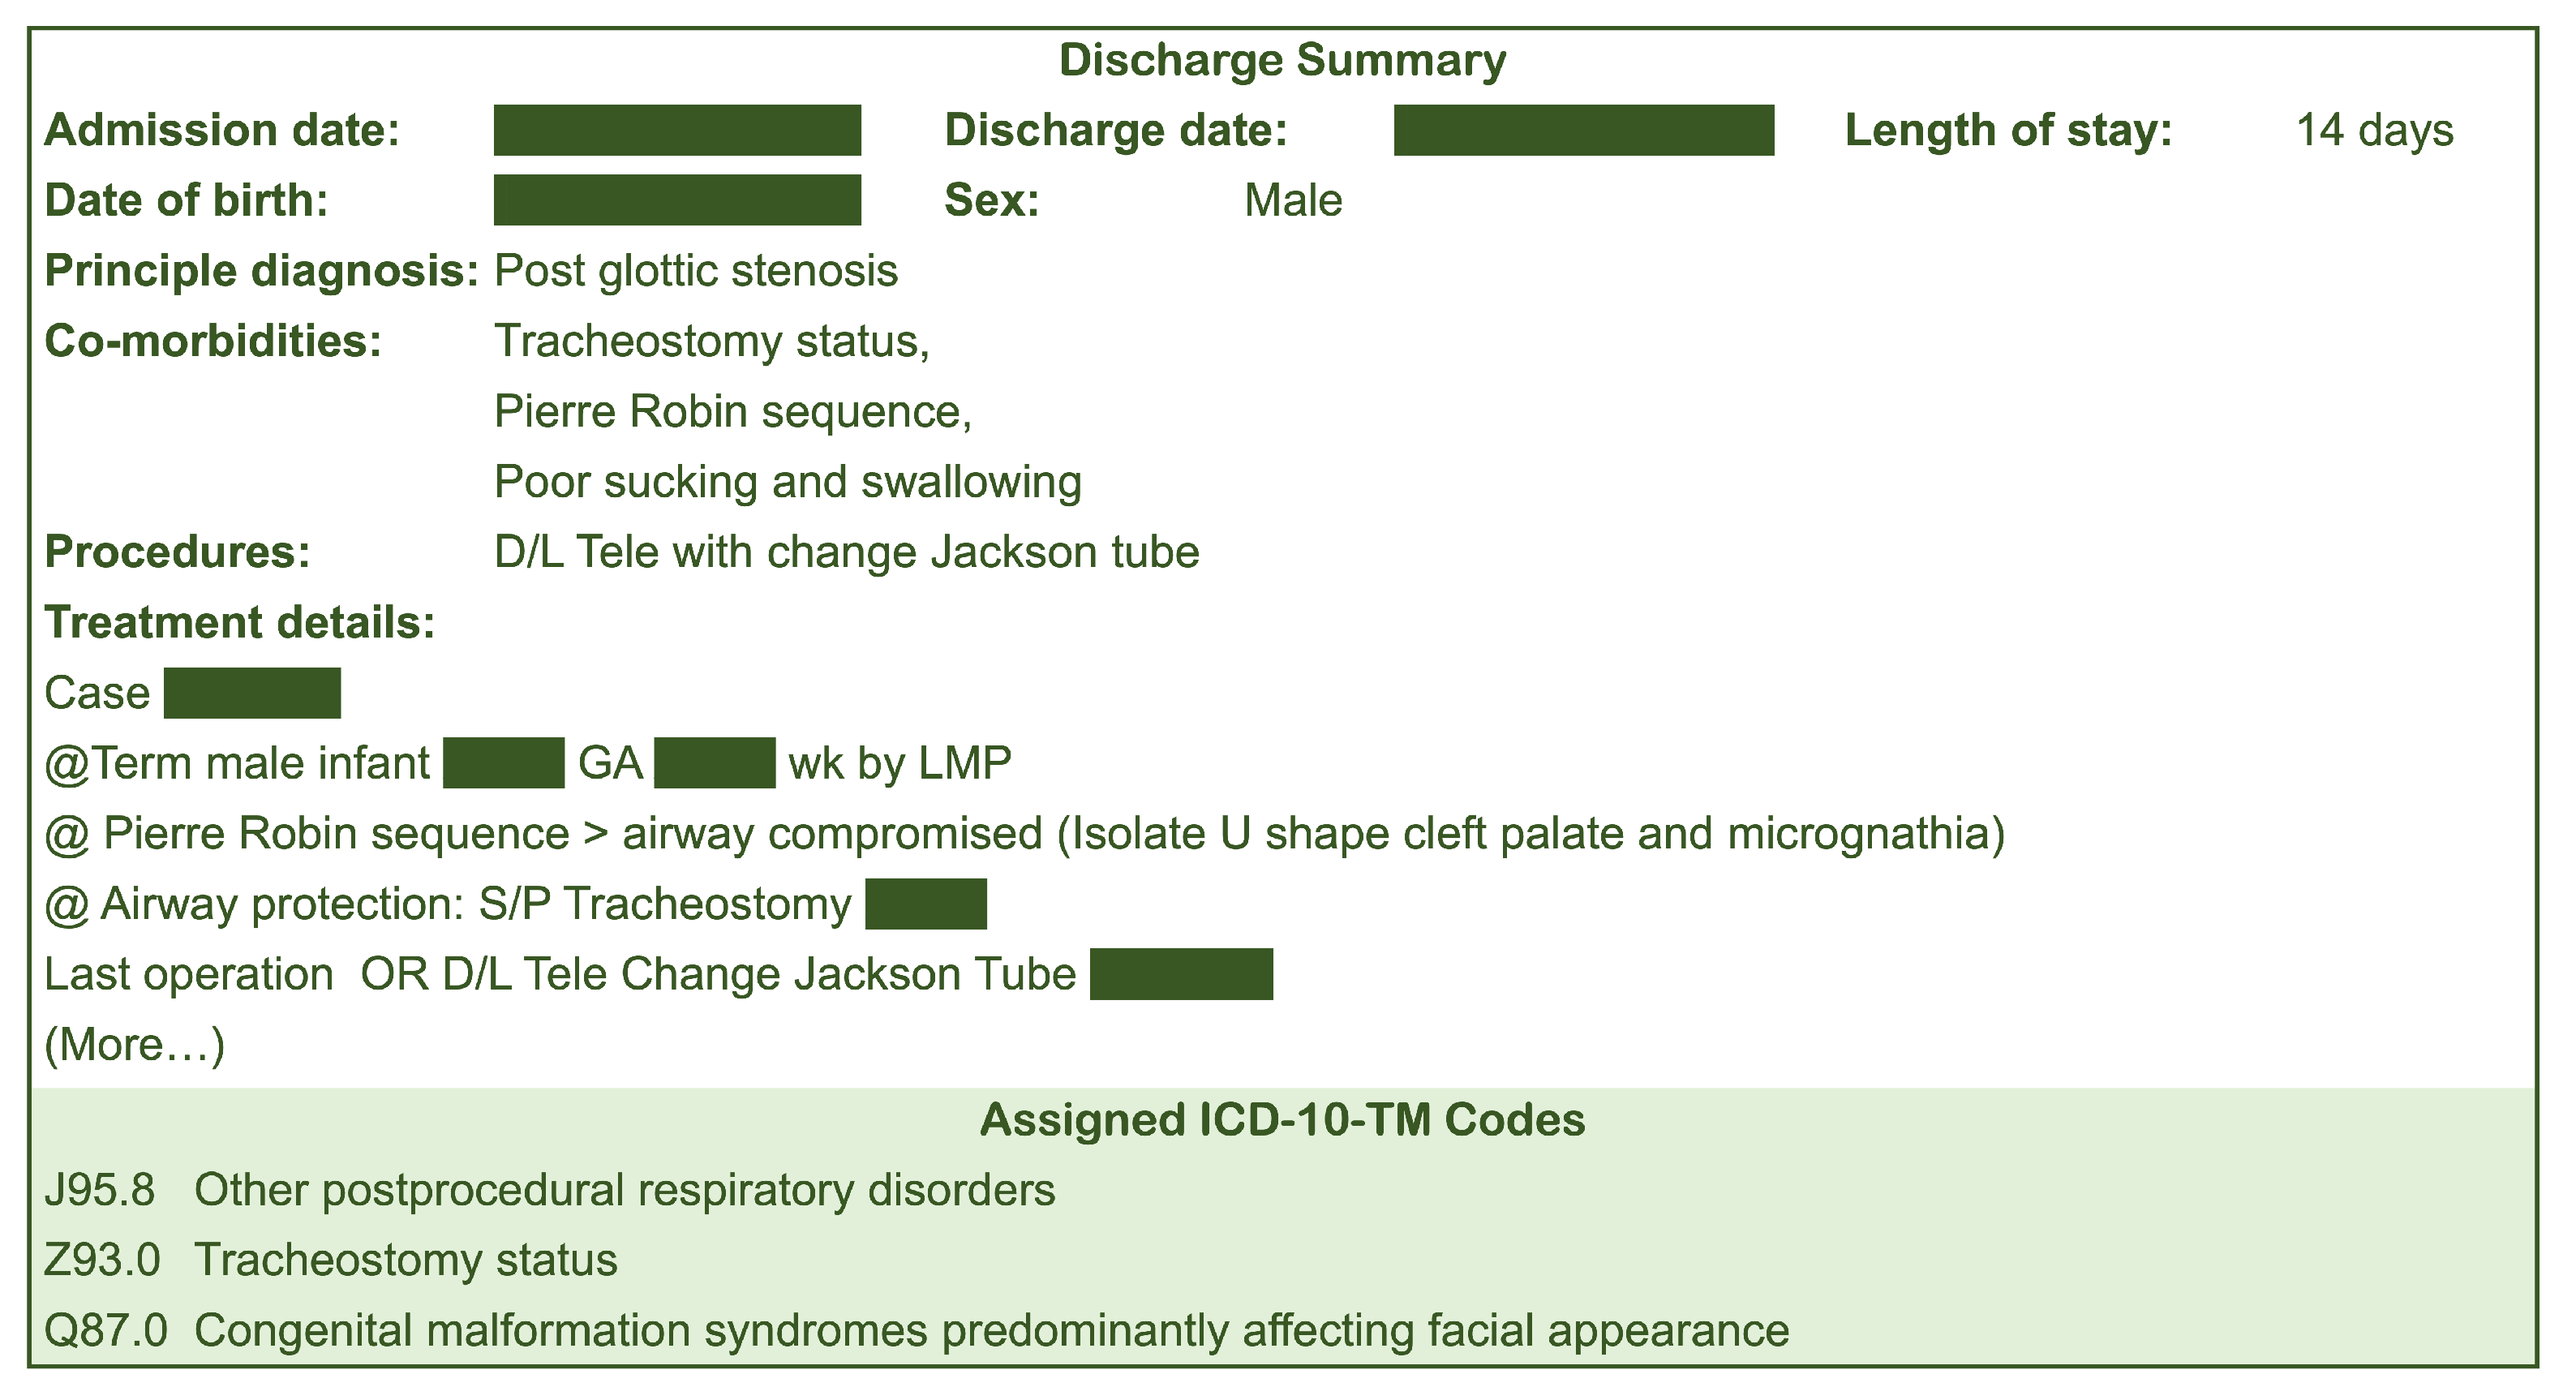
Our study used discharge summaries and corresponding ICD-10 assignments of patients admitted and discharged from Songklanagrind Hospital, Thailand, between 1 January 2017 and 31 December 2022 (6 years). We included inpatient admissions with a length of stay of more than one day. It is worth noting that the full implementation of ICD-10 coding standard at the institution started in mid 2016. Ethical approval for our study was obtained from the Office of Human Research Ethics Committee, Faculty of Medicine, Prince of Songkla University (REC.65-120-38-2). All ICD-10 codes were assigned by physicians and professional clinical coders according to the Thailand’s ICD-10-TM coding standard. Figure 2 shows an example of a discharge summary.
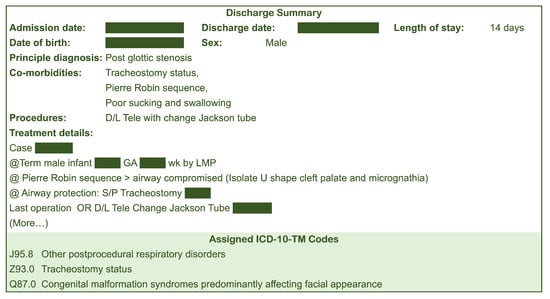
Figure 2.
Example of a discharge summary.
2.2. Data Exploration
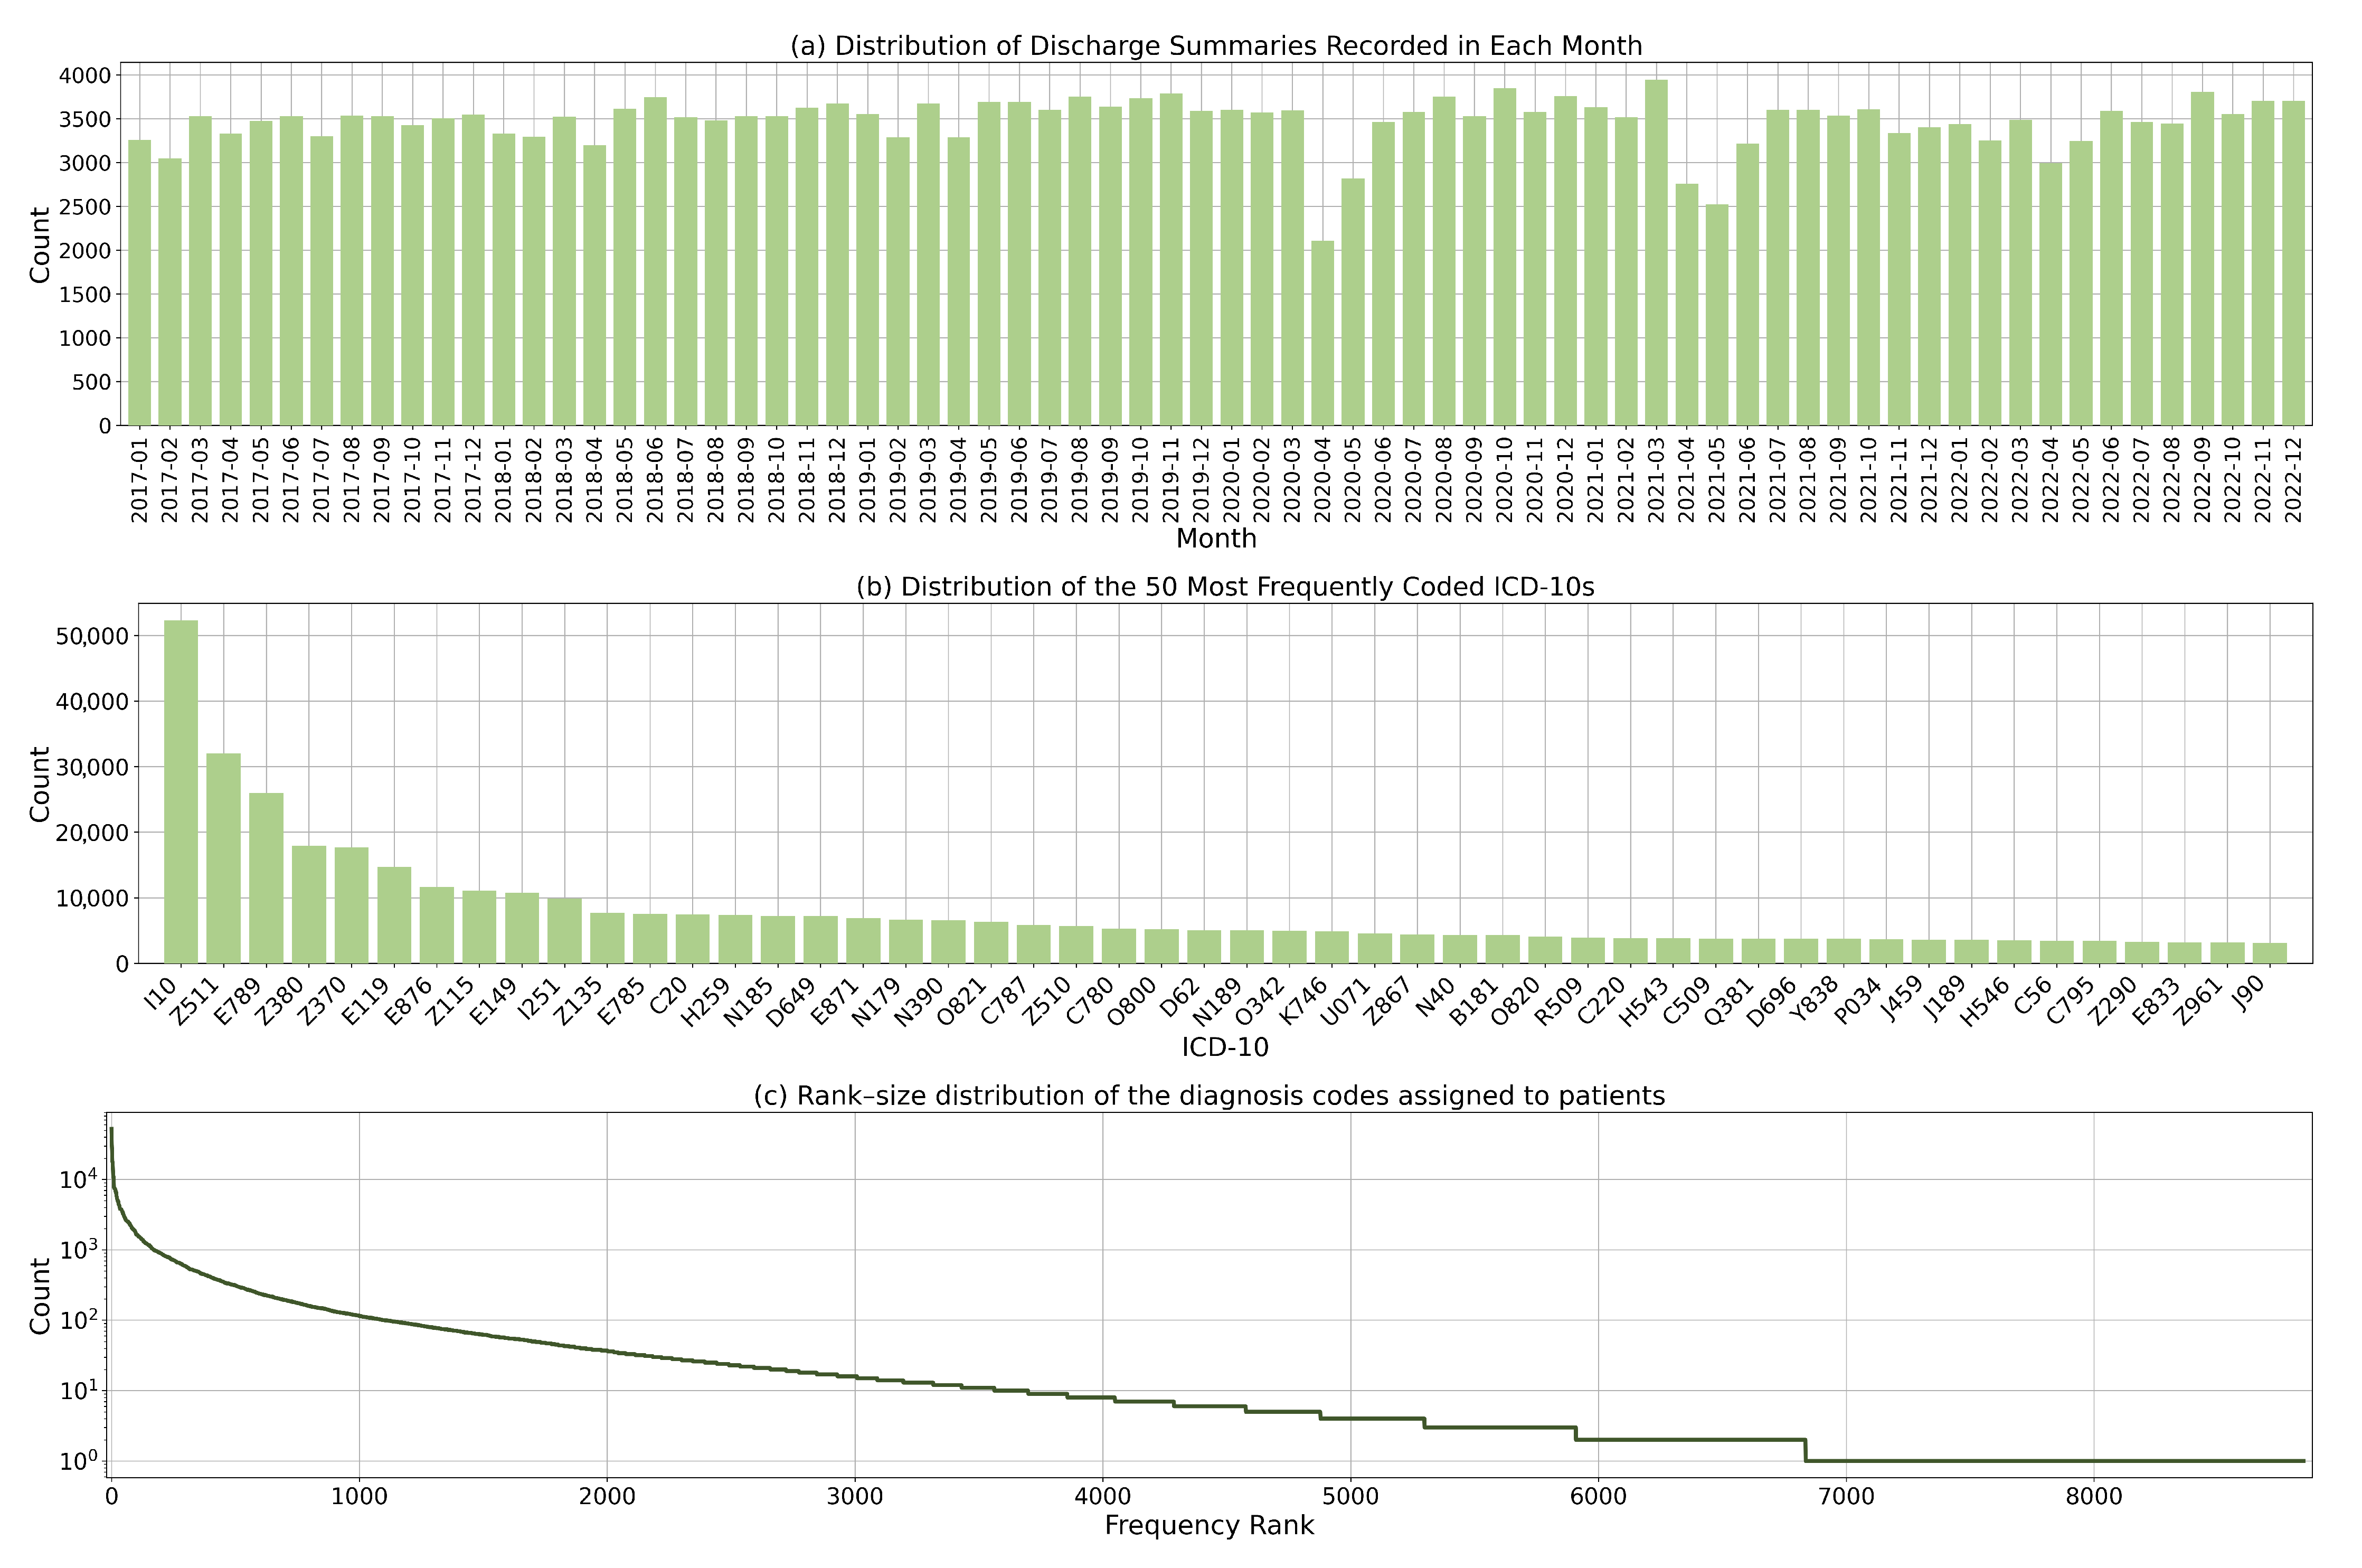
Our dataset contains 230,645 inpatient admissions and 8677 diagnosis codes. The average number of codes assigned per discharge summary is 4.1. Figure 3a illustrates the distribution of discharge summaries over time. On average, there are approximately 3200 inpatient admissions per month. The number of admissions fluctuates during the period when the COVID-19 lockdown policies were introduced. This was as a result of reduced elective procedures and delayed non-urgent admissions. Figure 3b presents the distribution of the 50 most frequently coded ICD-10 codes. The distribution shows a considerable degree of skewness and dispersion, which is due to the varying prevalence of diseases and the fine-grained nature of ICD-10 codes.

Figure 3.
Dataset statistics: (a) Distribution of discharge summaries by month; (b) Distribution of the 50 most commonly coded diagnosis codes; and (c) Rank-size distribution of the diagnosis codes.
Figure 3c shows the rank size distribution of the ICD-10 codes. Some codes were less frequently utilised due to the rarity of the corresponding diagnoses. This highlights the heterogeneity of disease prevalence and the complex coding landscape in which certain conditions are more prevalent and consequently more frequently coded. This dispersion in the use of codes also reflects the diverse range of conditions found in the study population.
2.3. Data Preparation
For each inpatient discharge summary, we used four main fields: principle diagnosis, co-morbidities, procedures and treatment details. We concatenated all fields to create a single document (see Figure 1). The average number of characters per document is 1669. For each document, we removed newline characters. We kept punctuation characters and symbols because they often contain important meanings, such as measurement values. As our institution is based in Thailand, the clinical text used in this study is a mixture of English and Thai words. English terminology is used for diseases, procedures and medicines, while Thai is used for surrounding clinical context. Thai texts are usually written without spaces between words. Word segmentation allows us to separate the text into individual word units. We segmented the Thai text into individual word units using the dictionary-based maximal matching algorithm in the PyThaiNLP library [26]. The same strategy was used the pre-training of the language models used in the study [17,27].
Consequently, we divided our dataset into two parts. The first part includes clinical records of patients admitted and discharged between 2017 and 2021, which were further randomly split into a training and validation set in a 90:10 ratio (172,437 and 19,160 admissions, respectively). The second part comprises clinical records of patients admitted and discharged in 2022, which was then served as a test set (39,048 admissions). This results in the walk-forward test set to ensure that the algorithms were validated in the same way as when they were deployed in HIS.
2.4. Language Model Finetuning
We formulated our problem as a multi-label classification task, where each instance can be assigned multiple labels simultaneously. In our case, the labels represent different ICD-10 codes that we aim to predict for a given document. We evaluated three pre-trained language models:
- Multilingual BERT [17] or mBERT is a variant of the BERT model pre-trained on a multilingual corpus. It captures contextual information from words and sentences using a transformer architecture. Through training with different languages, the model learns to understand and generate representations for multiple languages. Multilingual BERT has been used in various NLP applications due to its ability to process multiple languages with a single model.
- Multilingual E5 [27] is a version of the E5 model that supports multiple languages. It was trained using a simple contrastive training approach. The training data for this model were collected from various sources on the Internet, resulting in an extensive text dataset. Multilingual E5 is a versatile embedding model that can be easily used for various tasks where a representation of text data is required.
- MEDPSU-RoBERTa is our institutional language model with the RoBERTa architecture that was pre-trained on a comprehensive dataset of over 80 million clinical documents from Songklanagarind Hospital, Thailand. We adhered to pre-training guidelines, following the standard approach detailed in the original RoBERTa paper [28] with the transformer library [29]. In this way, MEDPSU-RoBERTa has been tailored to captures the nuances of clinical language allowing it can understand and analyse medical texts with a high degree of accuracy and precision.
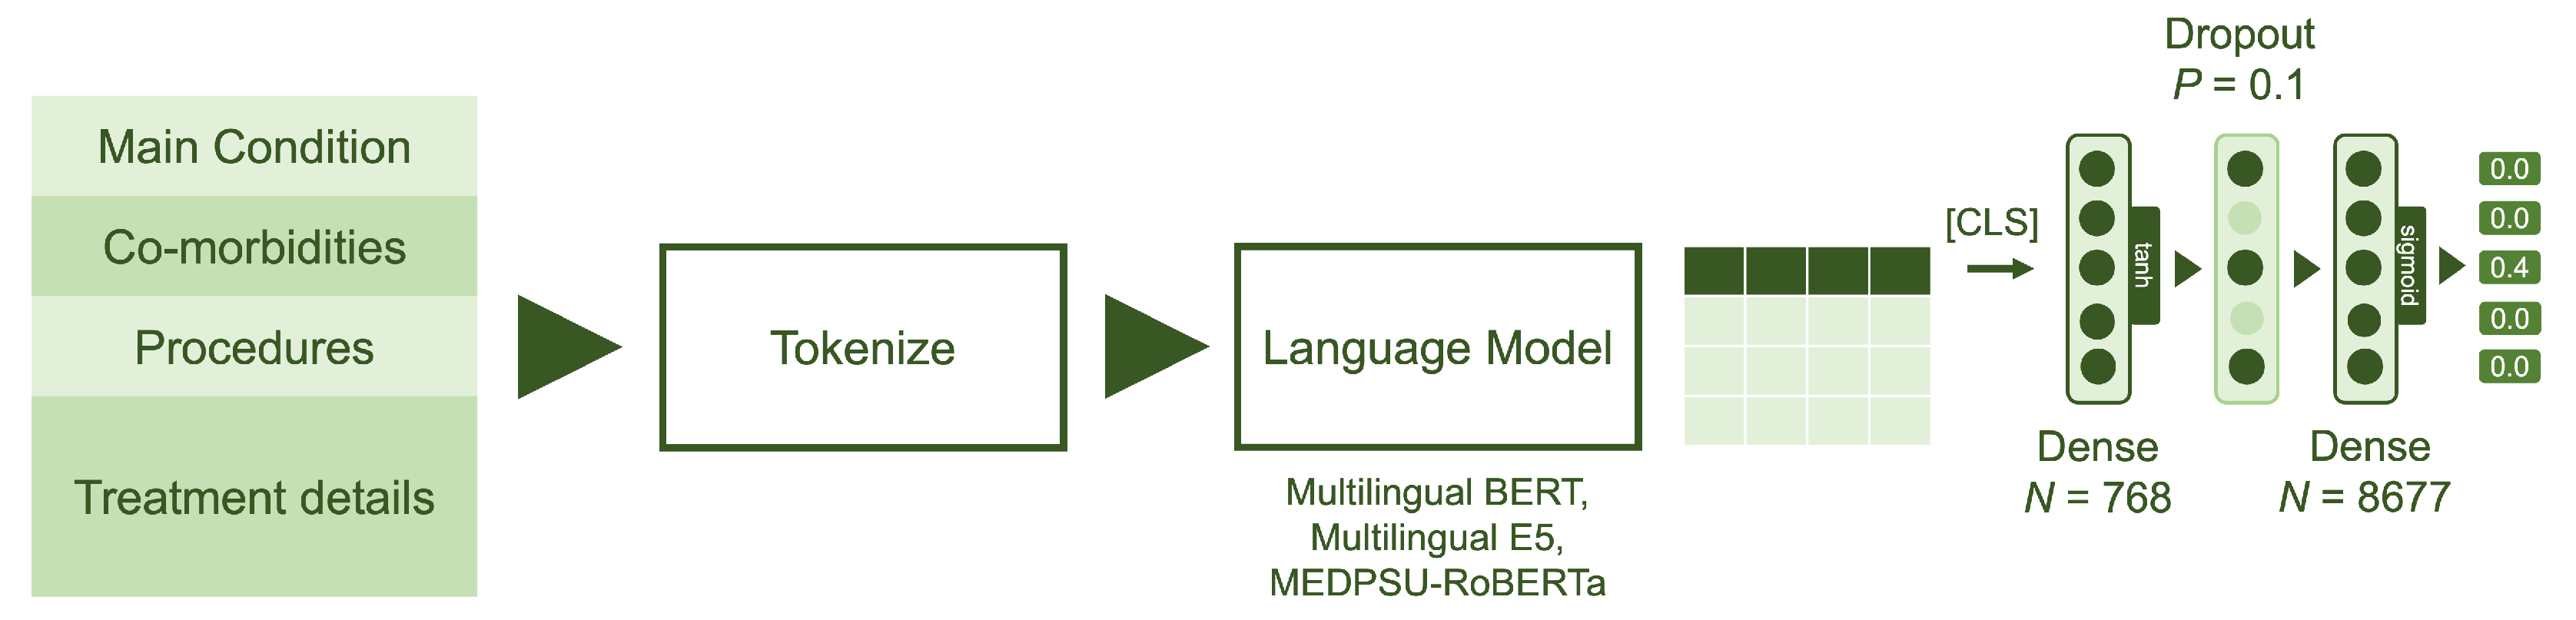
For each pre-trained language model, we removed the layers corresponding to the language model head, which are originally responsible for text generation. We then extended the pre-trained language models by using the output of the last hidden states for the [CLS] classification token and passing it through a classification head consisting of two dense layers (see Figure 4).

Figure 4.
Model architecture: The model utilizes data from four main fields: principal diagnosis, co-morbidities, procedures and treatment details. The language models were fine-tuned with two dense layers, each with output sizes of 768 and 8677, respectively. Sigmoid activation was employed to obtain the multilabel probabilities.
Given that represents the output of the last hidden state for the [CLS] classification token as a 768-dimensional vector, the output of the classification head can be calculated as:
where is the first dense layer with 768 hideen units, tanh is a hyperbolic tangent activation function, D is a dropout layer with a probability of 0.1 and is the final dense layer with 8677 outputs, representing the output of the model containing raw prediction values. The sigmoid function is then applied to these raw prediction values to obtain probabilities, , in the range of 0 and 1.
Focal loss was used during the fine-tuning process to address the issue of imbalanced data. It addresses the problem of negative samples dominating the training process by assigning higher weights to difficult or misclassified samples. This weighting scheme thus emphasises the learning of hard-to-classify samples and reduces the influence of easy samples, resulting in better handling of class imbalances during training.
Given is the binary ground truth and is the predicted probability of the true class. The individual focal loss is define as
where is the class weight assigned to each class label in order to balance their contribution to the loss calculation and the focusing parameter that controls the degree of emphasis on hard-to-classify samples.
In the case of training over multiple samples with multiple labels, the focal loss can therefore be formulated as:
where N is the number of samples, C is the number of classes, is the predicted probability of class j for sample i and represents the class weight for class j. In our implementation, we calculated the class weights based on the class distribution within each mini-batch during training. This allows us to dynamically adjust the class weights based on the current mini-batch, which can be beneficial if the class distribution varies greatly across different mini-batches. We used to place strong emphasis on hard-to-classify samples.
Our models were fine-tuned using the AdamW optimiser with a learning rate of , a weight decay of and a batch size of 24 samples for 200,000 iterations (27.9 epochs). The optimiser iteratively updates the model parameters based on the gradients calculated from the loss function, which measures the discrepancy between the predictions and the ground truth. Throughout the training process, we closely monitored the loss value and the micro F1 score to ensure that the loss was decreasing and to prevent overfitting.
For the baseline approach, we employed TF-IDF (Term Frequency-Inverse Document Frequency), which is a widely used technique for text representation and analysis.
This study was performed on a 32-core workstation with 128 gigabytes of memory and an NVIDIA GeForce RTX 4090 24GB graphics card. We used Python v3.10, CUDA v11.7, PyTorch v2.0.1, PyThaiNLP v.4.0.2, pandas v.2.0.1, swifter v1.3.5, scikit-learn v1.2.2 and transformers v4.29.2.
2.5. Evaluation Metric
To evaluate the performance of the models, we used several evaluation schemes. First, we used common metrics for binary classification, including precision, which measures the proportion of correctly predicted positive instances out of all instances predicted as positive; recall, which measures the proportion of correctly predicted positive instances out of all true positive instances; and F1 score, which is the harmonic mean of precision and recall. To account for imbalanced datasets, we used micro-average scores so that equal weight is assigned to each instance to ensure a fair score for all classes.
Second, to specifically address multi-label classification, two additional metrics are commonly used: exact match ratio, which measures the proportion of instances where all predicted labels exactly match the true labels, and mean average precision, which calculates the average precision across all instances and labels, taking into account the order of the predicted labels. These metrics provide valuable insights into the accuracy and quality of multi-label predictions. To assess whether the differences in performance between the methods were statistically significant, we used bootstrapping and the Friedman test [30], a non-parametric test used to compare multiple methods across multiple dependent variables. If the differences between the methods were statistically significant, the next step was to use the post hoc Nemenyi test [31] to identify the methods that showed notable differences in performance. The significance level was set at 0.05.
Finally, to evaluate the models in providing recommendations, the other two metrics are used: recall@5 and precision@5. Recall@5 calculates the proportion of classes that are successfully predicted among the top 5 predicted classes, thus measuring the model’s ability to capture relevant recommendations. Precision@5, on the other hand, measures the proportion of correctly predicted classes among the top 5 recommendations, thus focusing on the accuracy of the suggestions. These metrics are valuable when the user is presented with a limited number of recommendations and the goal is to maximise both the relevance and accuracy of the suggestions.
3. Results
All models were trained and validated using the training and validation data spanning the years 2016 to 2021. All performance measures presented in the table were calculated based on the predictions made by the models using the test data collected in the year 2022. This approach ensures an unbiased evaluation of the models’ performance on unseen data and provides a realistic assessment of their generalisation capabilities.
Table 1 shows a comparison of the performance metrics of the different models. The model finetuned from MEDPSU-RoBERTa, our institutional pre-trained language model, achieved the highest precision, highest recall, highest F1 score, highest exact match ratio, highest mean average precision, highest recall@5 and highest precision@5 compared to the other models. However, there is a slight difference in performance between the MEDPSU-RoBERTa, Multilingual BERT and Multilingual E5 models on various metrics. The running time for each model is impressively low. The basic model TF-IDF takes 17.29 ms to process one document, and the more advanced models such as Multilingual BERT, Multilingual E5 and MEDPSU-RoBERTA achieve even faster processing times of 4.66 ms, 4.76 ms and 4.81 ms, respectively.

Table 1.
Performance scores of all models calculated from the test set.
Looking at precision, recall and F1 score, the three models show relatively similar performance. The values for precision range from 0.8423 to 0.8439, for recall from 0.7149 to 0.7299 and for F1 score from 0.7735 to 0.7821. These results show that all three models have comparable abilities in detecting positive cases and minimising false positives and false negatives. For metrics such as exact match ratio, mean average precision, recall@5 and precision@5, the differences among the models are relatively small.
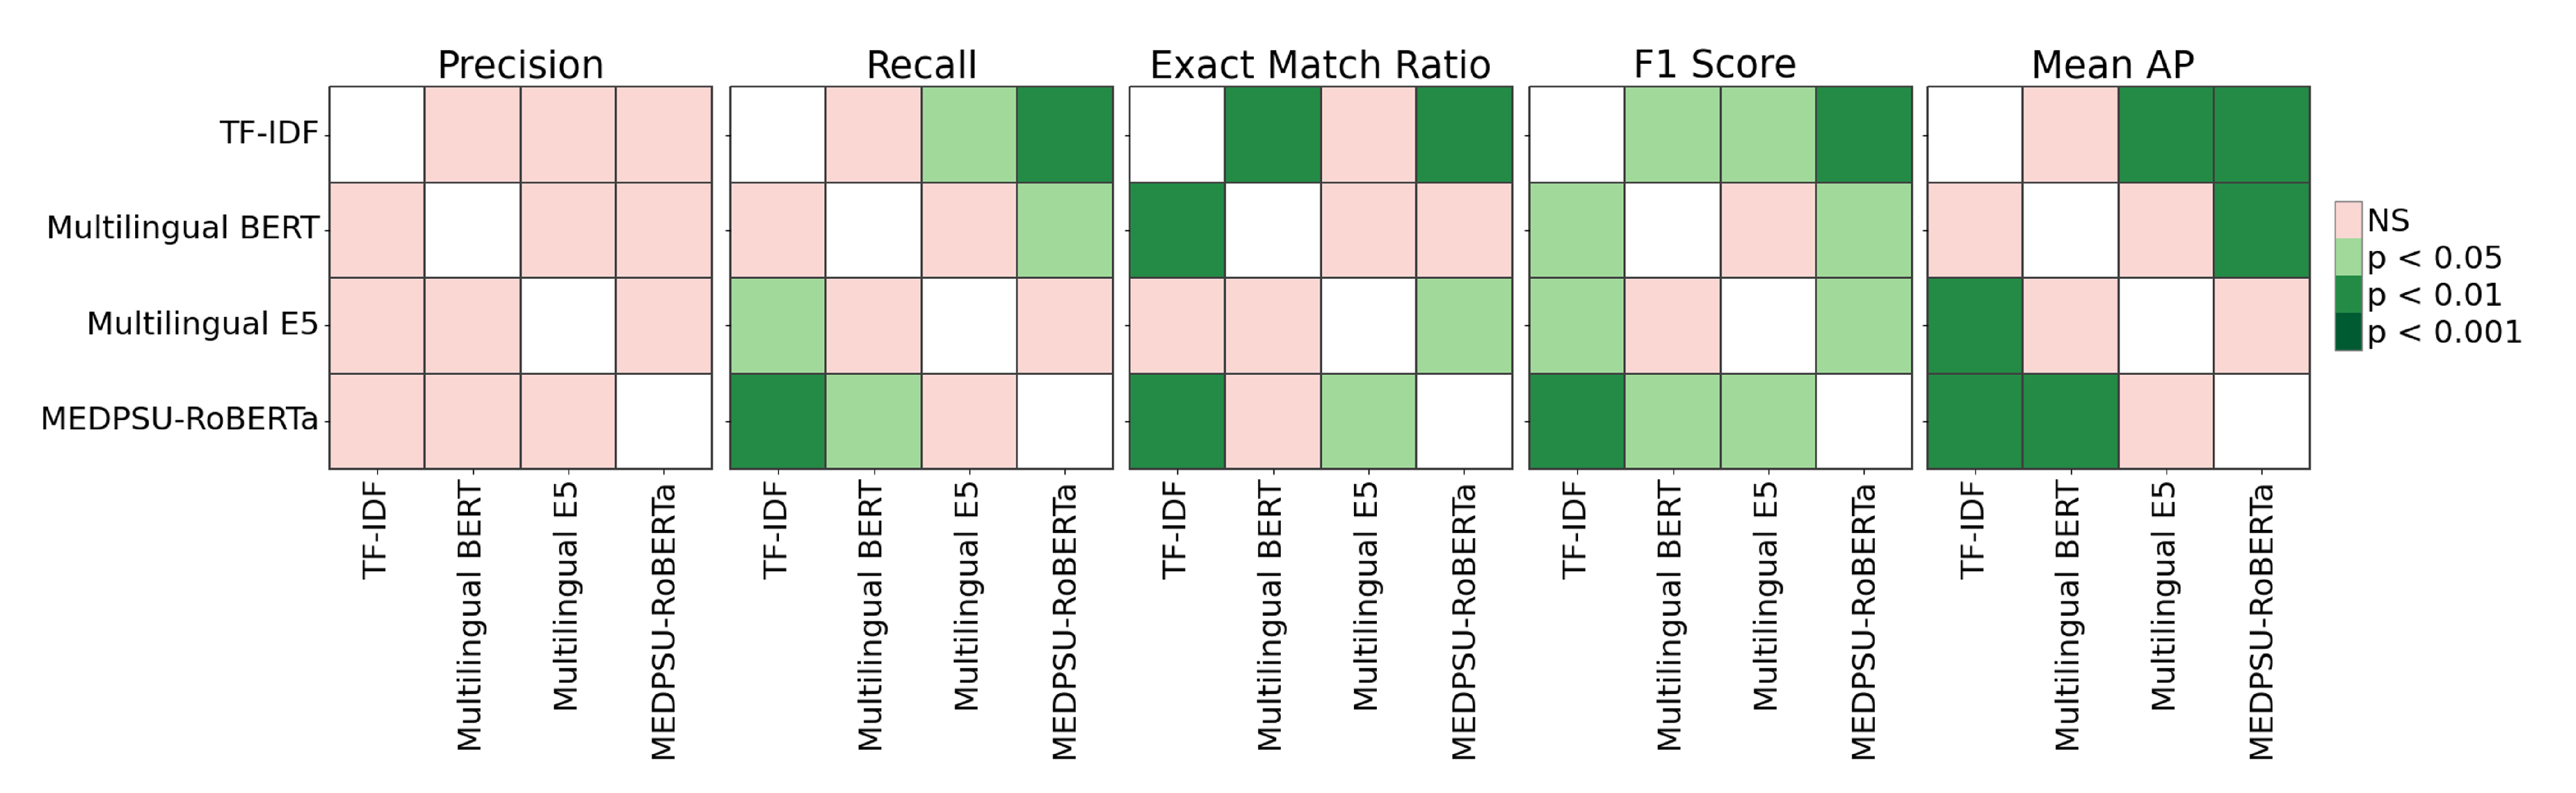
The Friedman test revealed significant differences among the models (p < 0.05) for recall, exact match ratio, F1 score, and mean AP (see Figure 5). Specifically, for recall, TF-IDF differs significantly from Multilingual E5 and MEDPSU-RoBERTa (p < 0.05), while Multilingual BERT differs significantly from MEDPSU-RoBERTa (p < 0.05). For the exact match ratio, TF-IDF differs significantly from Multilingual BERT and MEDPSU-RoBERTa (p < 0.05), and Multilingual E5 differs significantly from MEDPSU-RoBERTa. In terms of the F1 score, all methods differ significantly from each other (p < 0.05), except for Multilingual BERT and Multilingual E5, which do not exhibit a significant difference. Regarding mean AP, TF-IDF differs significantly from Multilingual E5 and MEDPSU-RoBERTa (p < 0.05), while Multilingual BERT differs significantly from MEDPSU-RoBERTa (p < 0.05).

Figure 5.
Significance plots of p values calculated using Nemenyi post hoc test.
Figure 6 shows a precision-recall curve illustrating the trade-off between precision and recall for all models. It shows how the performance of the model performance varies as the classification threshold changes. In our multi-label setting, we calculated the micro-averaged precision-recall curve from all labels for each model. The precision-recall curve for the MEDPSU-RoBERTa model showed a better trade-off between precision and recall at most thresholds compared to the other models.
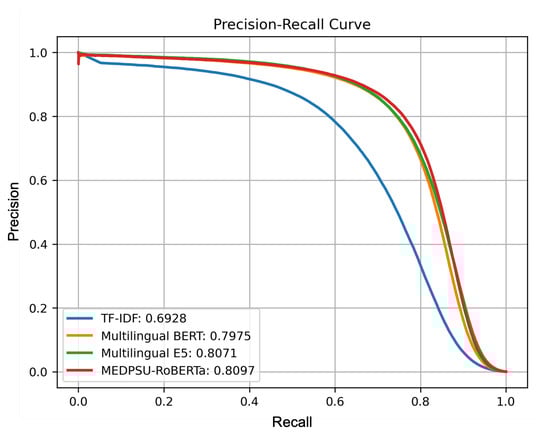
Figure 6.
Precision-recall curves of all models calculated from the test set.
4. Discussion
In our study, we investigated different language models for the task of automated coding of inpatient diagnoses. We used a separate test set from a different time period to evaluate the models’ ability to generalise to new and unseen data, and to assess their performance in real-world scenarios beyond the training period. Our results show that all our models generalised well towards unseen data.
4.1. Comparison of Different Pre-Trained Language Models
As expected, the model fine-tuned from MEDPSU-RoBERTa scored highest among the other language models. It is important to note that MEDPSU-RoBERTa was trained with data from our institution’s HIS since its implementation until 31 December 2021. This time frame was different from the data used for the test set, which was collected in 2022. This presents further evidence of the generalisability of the model.
However, we had originally expected that the results of the model fine-tuned from MEDPSU-RoBERTa would significantly outperform the results of general-purpose language models such as Multilingual BERT or Multilingual E5. Surprisingly, the observed differences were only marginal, ranging between 1% and 2% in terms of performance metrics. The general-purpose models showed competitive performance that was not inferior. These results show that general-purpose language models are capable of handling the complex tasks of coding diagnoses. Although these models were not specifically tailored to our institutional data or fine-tuned with domain-specific knowledge, they demonstrated a remarkable ability to capture relevant information. This suggests that the general language models can still provide reliable results for specific applications or scenarios where fine-tuning to institution-specific data is not possible or necessary.
MEDPSU-RoBERTa consistently outperformed the other models across different thresholds (see Figure 6). Although the differences in performance are only 1% to 2%, even a small reduction in the error rate can have significant practical implications, especially in healthcare where the stakes are high. The reduction in false positives and false negatives can potentially decrease the need for case reviews and the likelihood of misdetections, resulting in a reduced workload.
In practise, clinical coders rely on various sources of information, including doctor notes, nurse progress notes, laboratory results, and medical procedures, in addition to the discharge report, to identify the appropriate diagnosis codes. However, these additional documents were not used in training the algorithm. Therefore, the algorithm may encounter difficulties in accurately assigning diagnosis codes due to the lack of these additional details. The lack of this contextual information could potentially lead to errors in assigning diagnosis codes in our models.
4.2. Model Performance across Different Labels
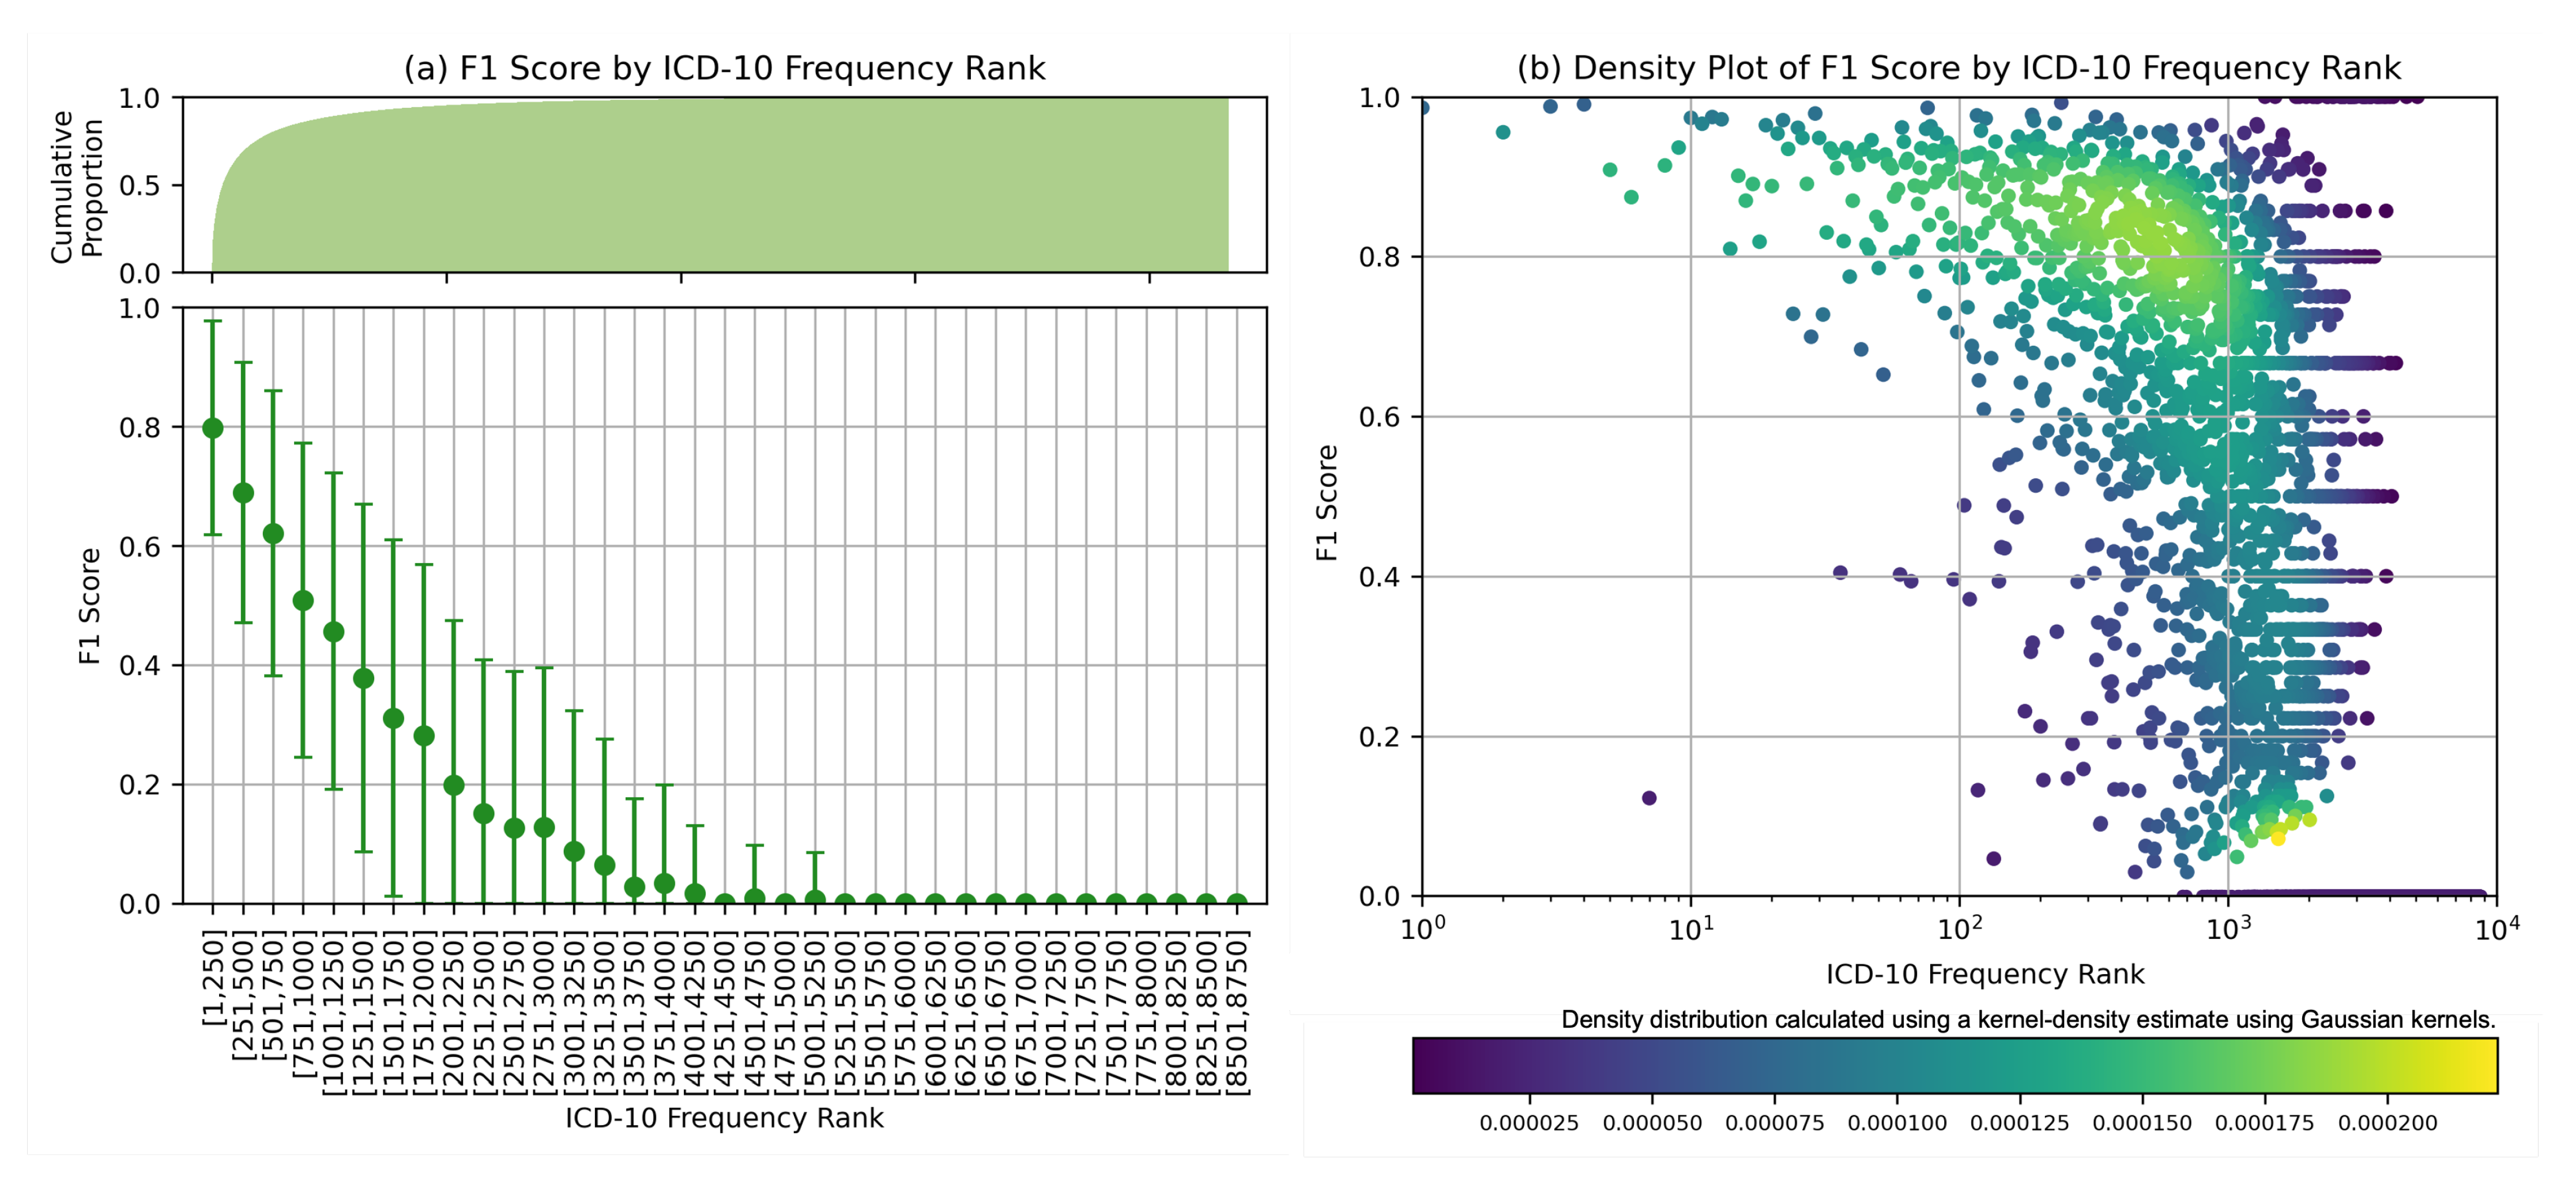
Further analysis was carried out for MEDPSU-RoBERTa, the highest-scoring model. Figure 7 shows the individual F1 score of the model across different diagnosis codes. These results provide valuable insights when considered alongside Figure 3b. The model consistently achieved an F1 score above 0.80 for the top 250 diagnosis codes or labels with more than 1000 samples. The model performs less well on class labels with a small sample size. This suggests that the performance of the model is affected by the availability of training samples for each class label, especially for the frequency rank above 1251 or the class label with less than 100 samples, the F1 score tends to be below 0.5.
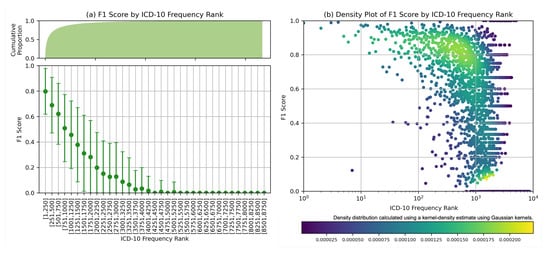
Figure 7.
F1 score by ICD frequency rank: (a) Mean F1 scores based on frequency rank with cumulative count on the top. (b) Density plot displayed on logarithmic scales, highlighting the distribution of F1 scores in class labels with large number of samples.
4.3. Model Performance across Different Document Lengths
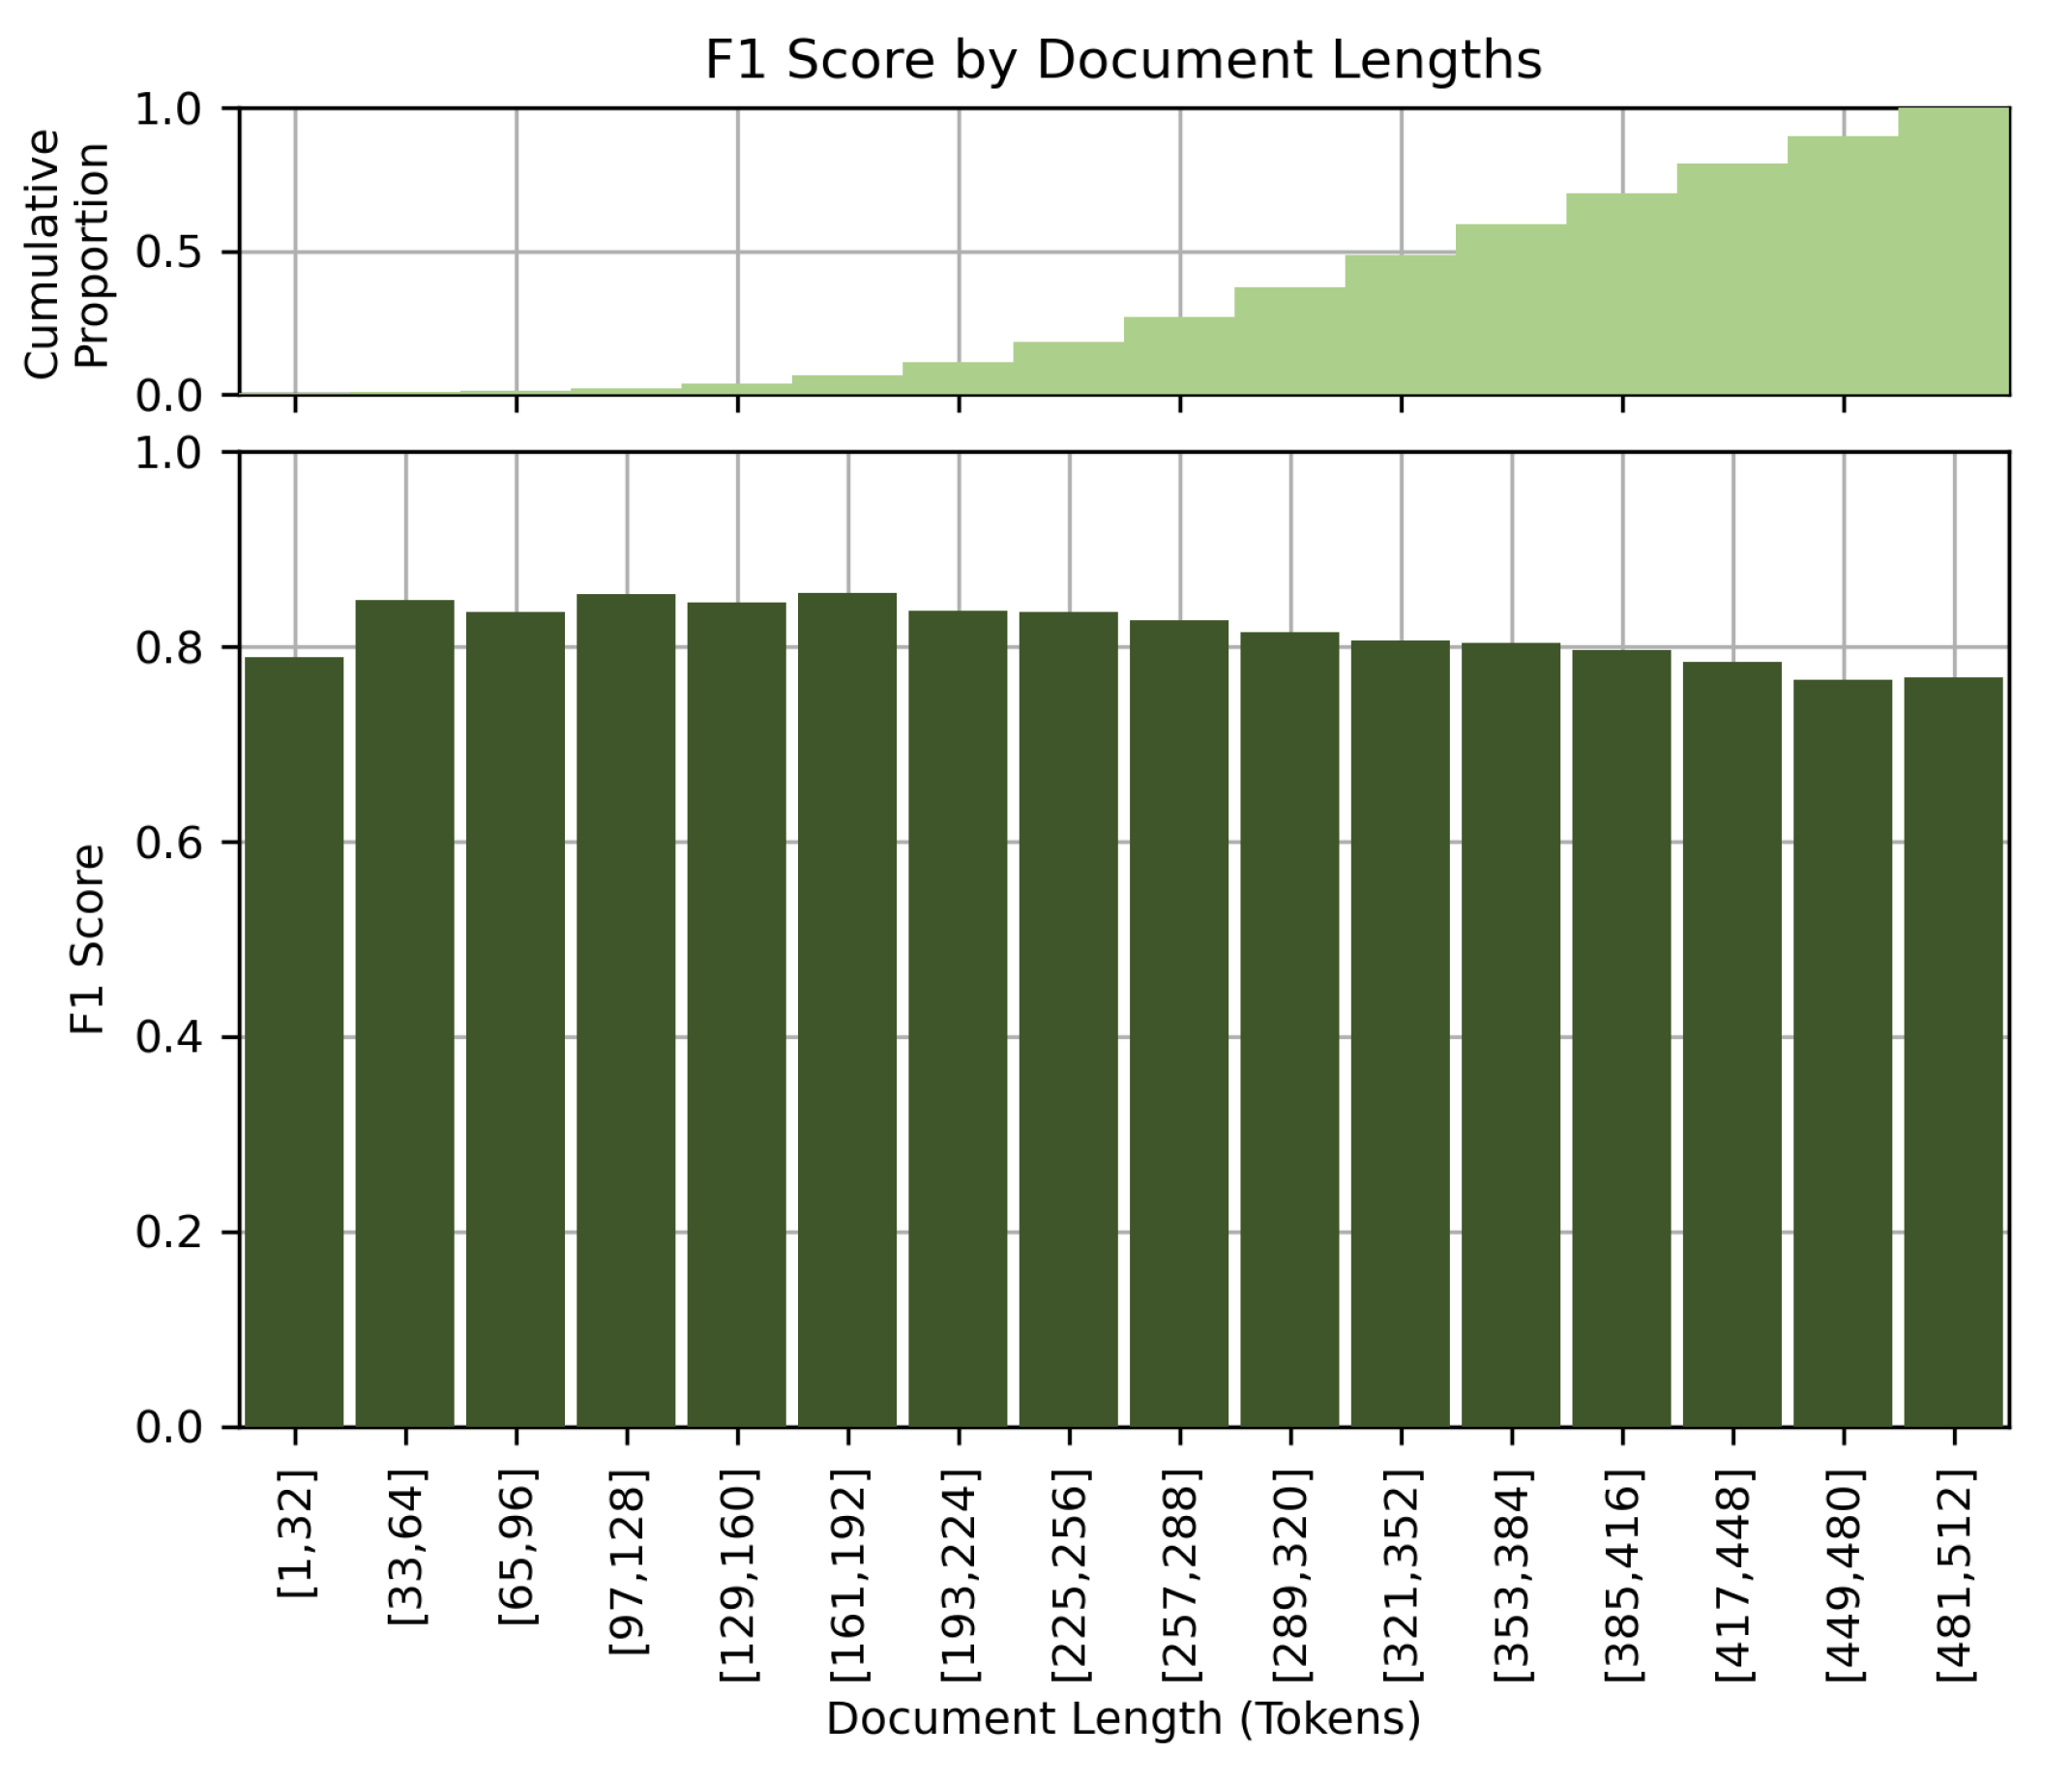
Figure 8 shows the performance of the model at different document lengths. Contrary to our initial assumption that longer clinical details would lead to better performance, our results showed a slight drop in performance for long documents. The F1 score decreases with increasing document length. This observation could be due to the limited comprehension capabilities of the BERT-based models when processing long documents, or to the potential confusion caused by very detailed or elaborate clinical descriptions. We suspect that the model better excels at processing short and concise clinical notes.
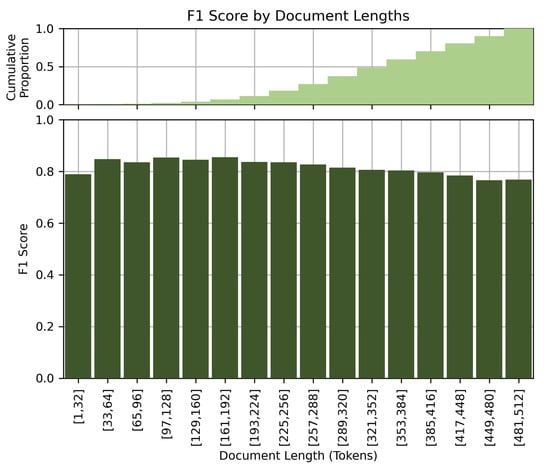
Figure 8.
F1 score by document lengths.
4.4. Co-Occurrence Analysis
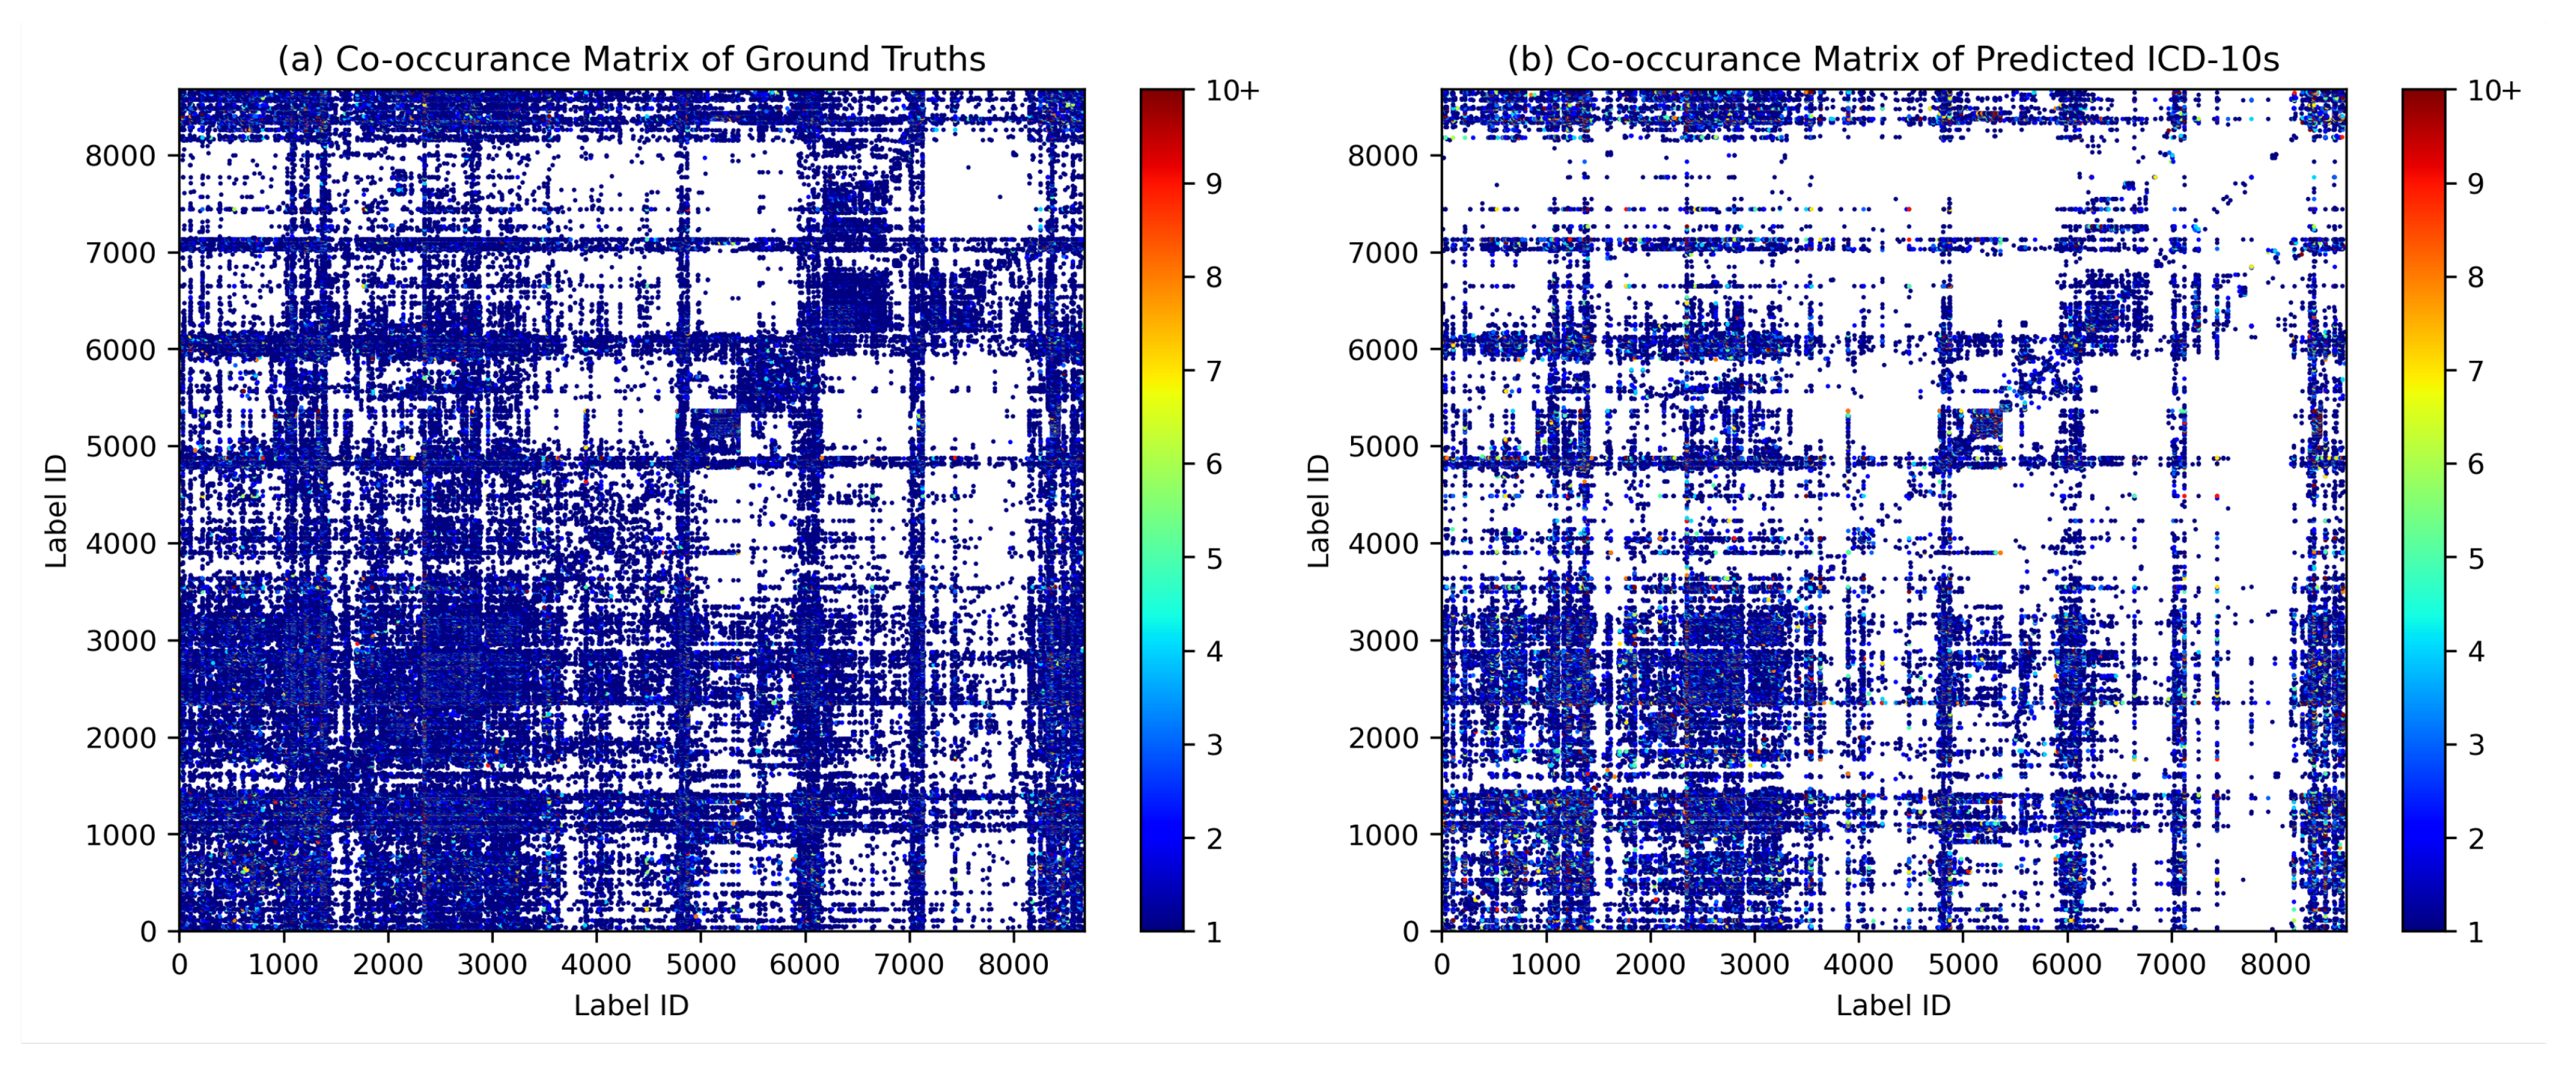
Co-occurrence analysis examines the relationships and patterns of co-occurrence between different diagnostic codes. In the context of automated inpatient coding, co-occurrence analysis could help identify which diagnosis codes frequently occur together in patient records. This can provide insights into the relationships between medical conditions and help improve the accuracy of automated coding systems. For example, suppose that in a dataset of patient records, the diagnosis codes for “diabetes” and “hypertension” frequently occur together. This co-occurrence indicates that these two diseases are often diagnosed in the same patients. By identifying such co-occurring diagnostic codes, an automated coding system could be designed to recognise the likelihood of co-occurrence of these conditions and apply or suggest both relevant codes simultaneously, thereby improving the coding process. We assume that the model can capture the co-occurrence and associations between certain diagnoses in the same patterns as they occur in ground truth. Figure 9 shows the diagrams of the co-occurrence matrix of both ground truth and prediction. In the predictions, we found that the classifier performed poorly on class labels with small sample sizes, so that some associations became unclear. However, we were able to identify similar patterns of association in both diagrams, confirming the model’s ability to capture relevant co-occurrence relationships.
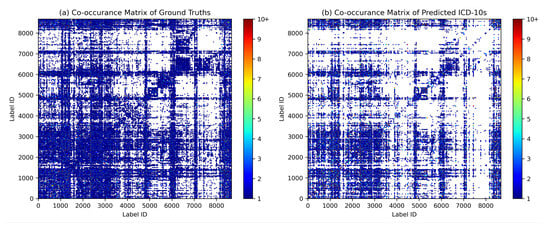
Figure 9.
Diagrams of the co-occurrence matrix for (a) ground truth and (b) predictions reveal similar patterns of associations between diagnosis codes.
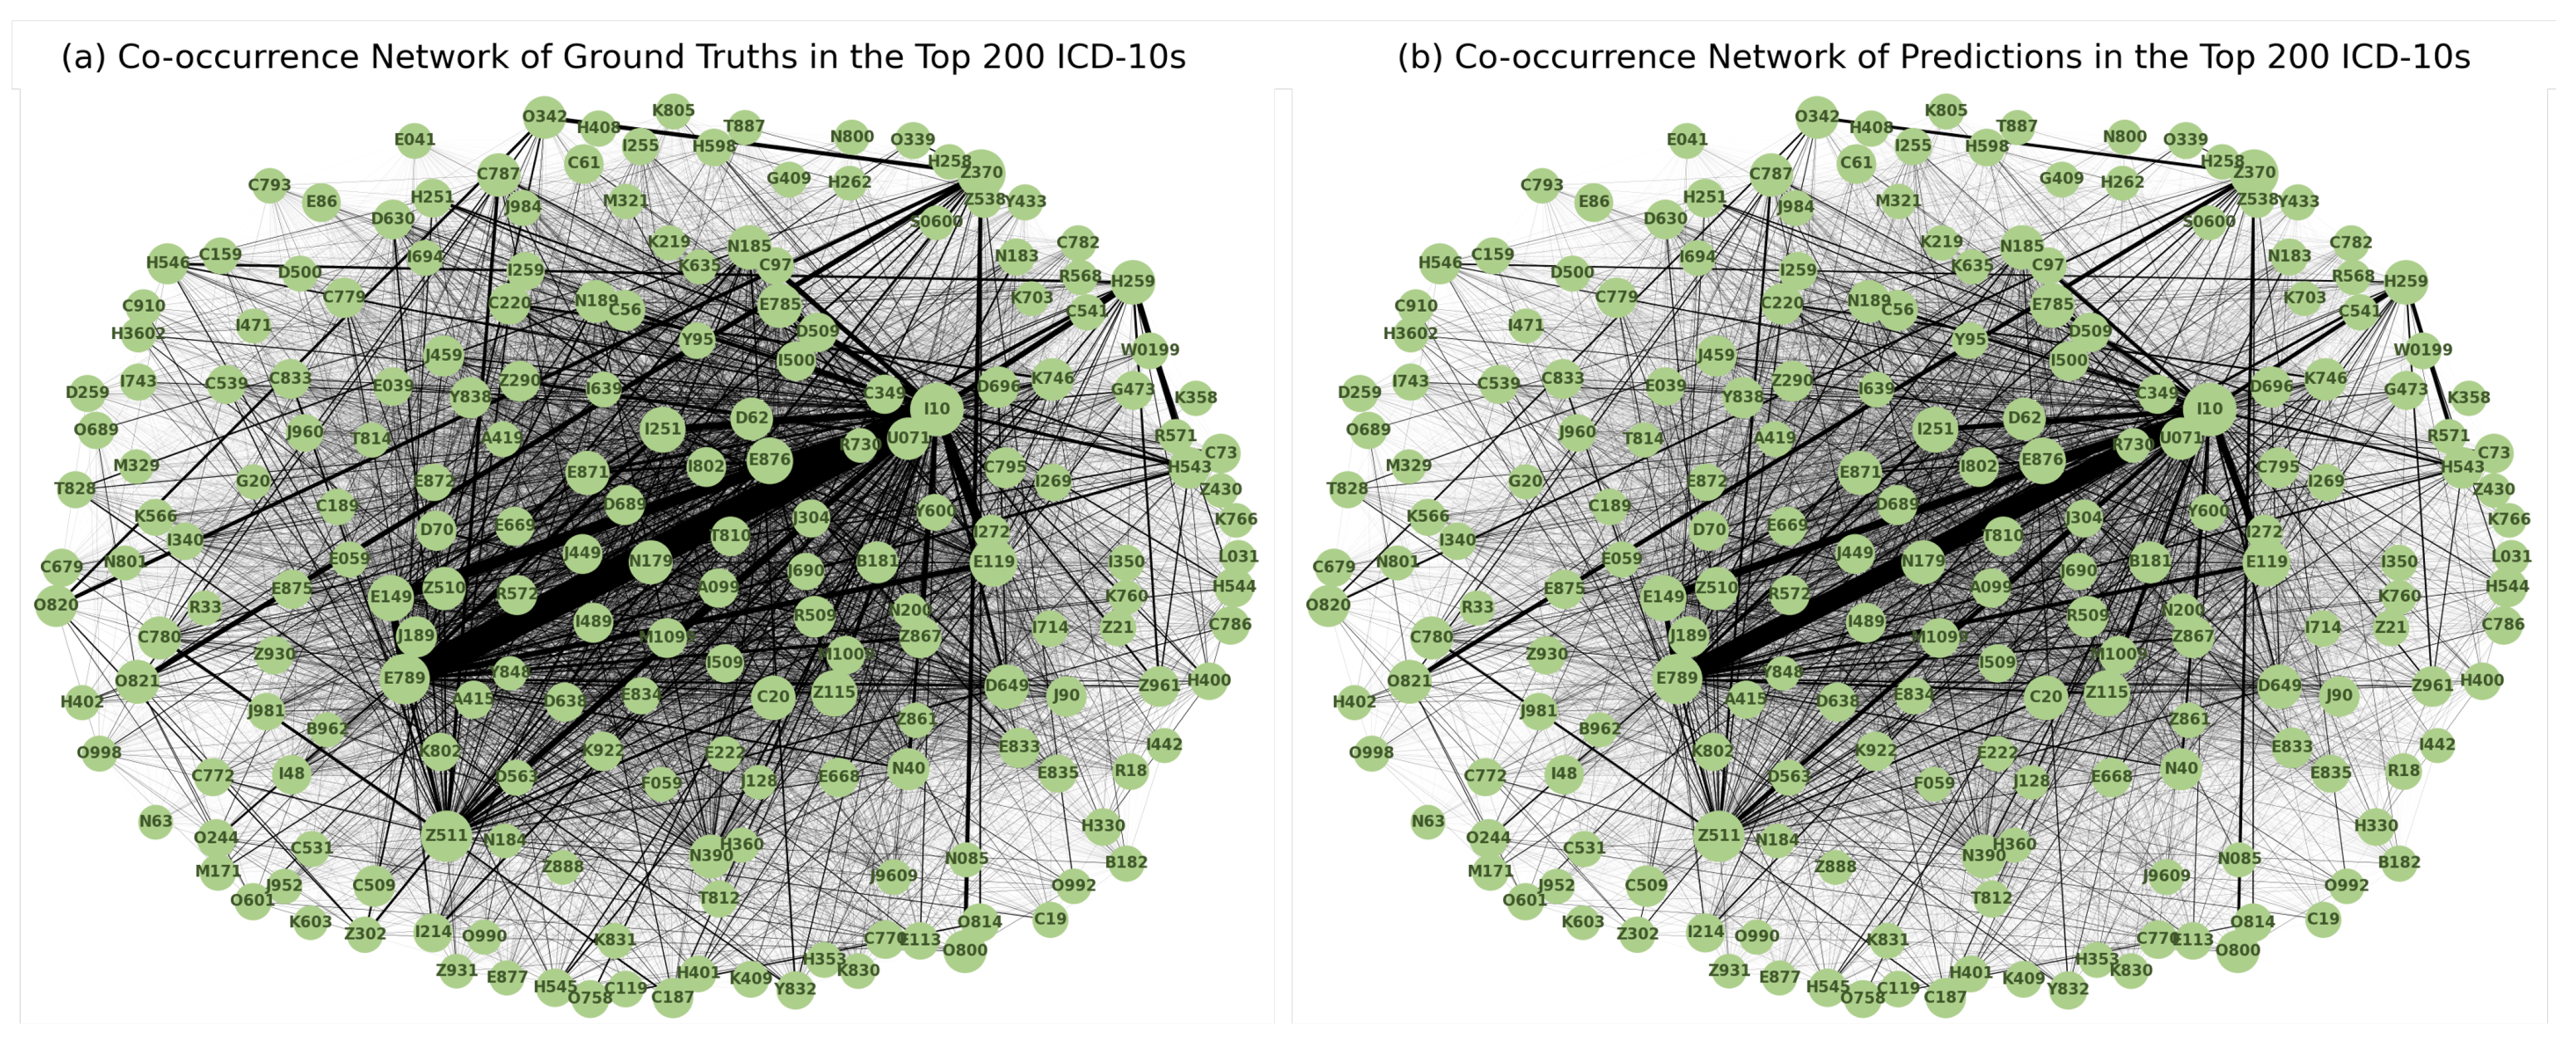
Figure 10 shows the diagrams of the co-occurrence network in the top 200 diagnosis codes in both ground truth and prediction. A highly similar pattern of associations between the two was observed, reinforcing the model’s ability to capture meaningful associations between diagnoses.
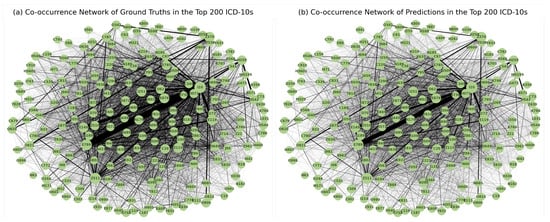
Figure 10.
Diagrams of the co-occurrence network for the 200 most frequently coded diagnosis codes in the (a) ground truth and (b) predictions show patterns of co-occurrence that are consistent with actual coding practise.
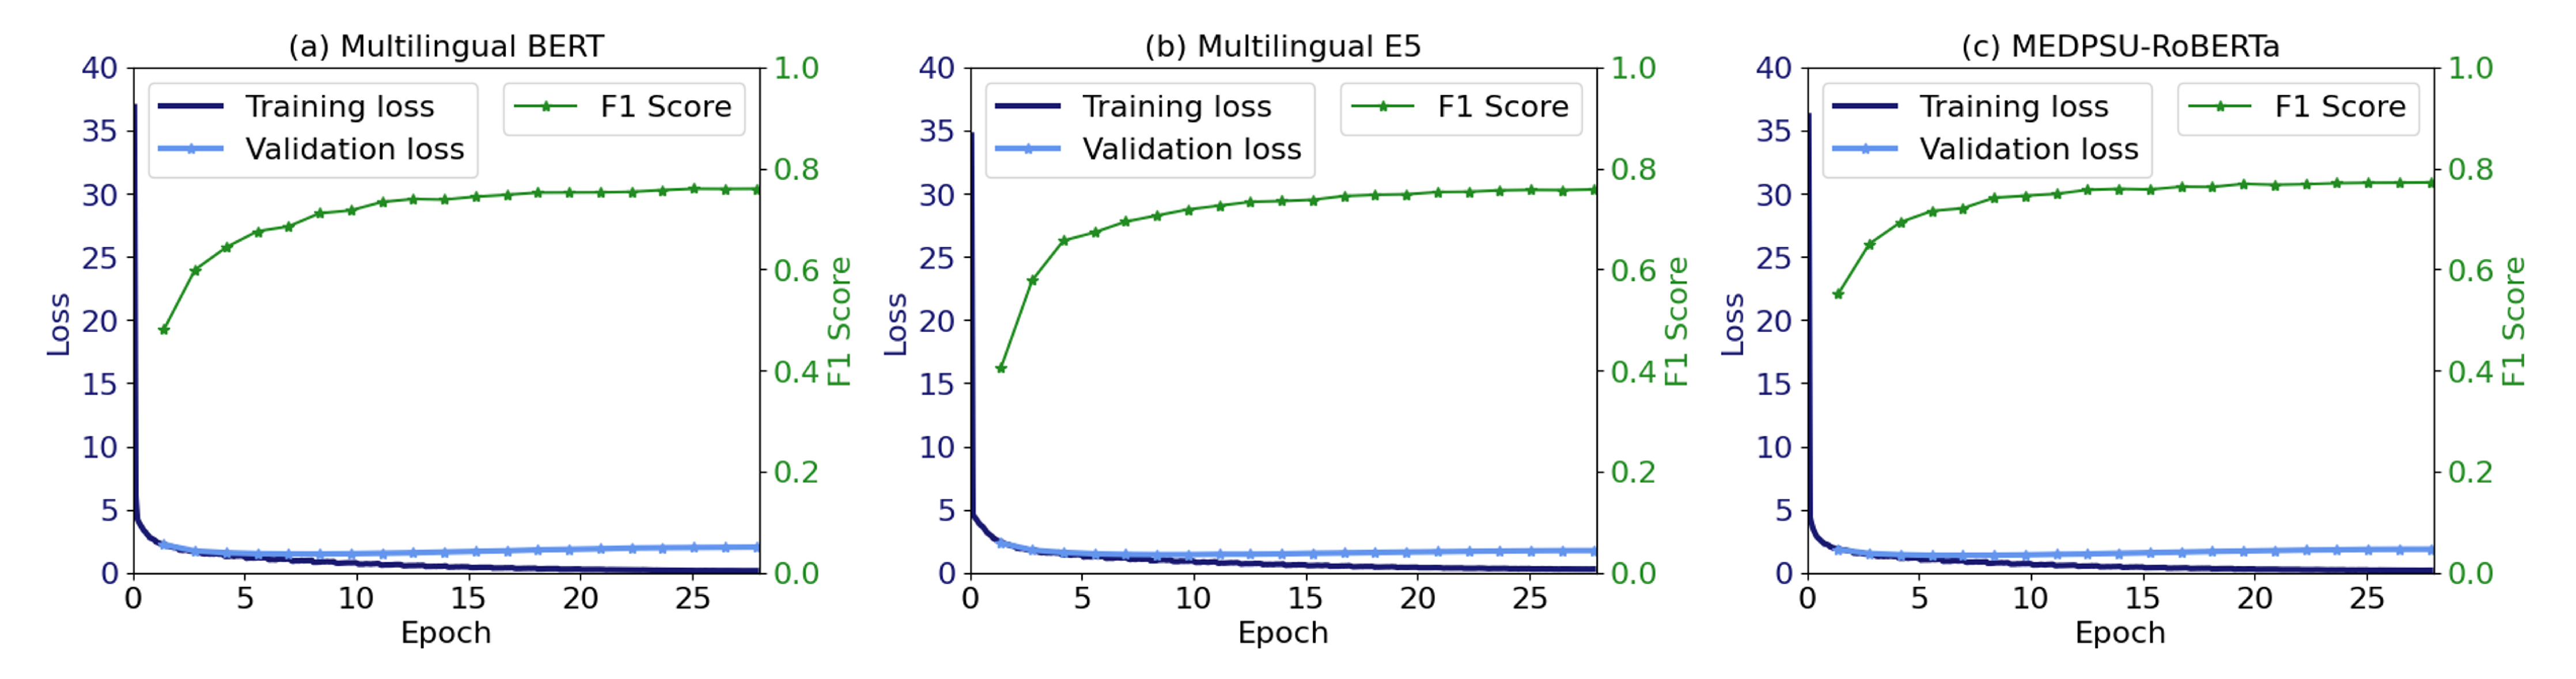
4.5. Training and Validation Loss
Figure 11 shows the training and validation loss as well as the validation F1 score during model training for all models. No overfitting was observed. Training was stable and the validation F1 score was increased until convergence.
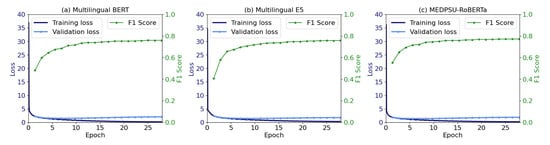
Figure 11.
The training and validation loss, along with the F1 score, indicate the convergence of the model.
4.6. Comparison to Other Studies
Compared to previous studies [15,21,23,25,32] that employed BERT-based models, our study addresses the problem using a significantly larger dataset of clinical documents and diagnosis codes. Amin et al. [21] employed BioBERT and achieved an F1-score of 0.73. Biseda et al. [32] utilized ClinicalBERT and obtained an F1-score of 0.75. Silvestri et al. [23] applied XLM to Italian clinical documents and reported an exact match ratio of 0.77 using 2172 clinical notes and 24 unique ICD codes. Remmer et al. [25] employed Swedish KB-BERT and achieved an F1-score of 0.58 on a dataset of 6062 records with 10 unique ICD-10 blocks. Yu et al. [15] developed Chinese ICD-10 classification algorithms using RNN to support 488 different ICD blocks and achieved a micro-averaged F1-score of 0.77. The better performance of our results can be attributed to several factors, the inclusion of a more extensive institutional dataset as well as and the comprehensive nature of our discharge reports and clinical coding criteria.
4.7. Study Limitations
The results of our study are subject to several limitations. First, although the dataset used for training and evaluation was relatively large, there are few examples of some class labels. This may have limited the model’s ability to generalise and capture the full complexity of the coding task for inpatient diagnoses. Second, although we used dynamic class weights, dealing with class imbalance is still poses a challenge as certain diagnosis codes have limited representation in the dataset, which affects the performance of the model for these specific diagnosis codes. Thirdly, the lack of use of historical data prevents the model from incorporating temporal trends and longitudinal information from patients that could provide valuable context for accurate diagnosis coding. Next, our models have shown strong performance with ICD-10-TM in Thai context and mixed English–Thai clinical notes, however its applicability in different settings remains uncertain due to language differences. Our models can certainly useful in different hospitals and regions of Thailand, but their effectiveness in other countries needs to be further evaluated through extensive testing. Finally, the lack of qualitative assessments to evaluate the performance of the model when used by clinicians or professional coders. This may hinder understanding of usability and user experience in real-world scenarios.
4.8. Practical Implications
The practical implications of our study are twofold. First, the rarity of diseases may pose a challenge in implementing the system [33,34]. To overcome this problem, one possible solution is to pool data from the HIS of multiple hospitals to create a more comprehensive training dataset. By pooling data from different sources, an algorithm can learn from a wider range of cases, including rare diseases, increasing the number of training samples and improving its ability to accurately code and diagnose such conditions. Secondly, the system could be transformed into a recommendation system offering suggestions and guidance to medical professionals [7]. However, it is important to ensure that the system effectively communicates the presence and importance of rare diseases to users. Clear and concise messages can ensure that rare diseases also receive appropriate attention and consideration, ultimately leading to increased diagnostic accuracy and better workflows [8].
4.9. Future Directions
Future research directions offer several possibilities. First, addressing the problem of rare diseases, which may lead to underdiagnosis, requires innovative approaches. Exploring methods to improve rare disease detection and classification could help increase the accuracy and completeness of the automated coding system. Second, more effective integration of historical data into the modelling process could provide valuable context and improve the predictive capabilities of the model. The use of longitudinal data on patients, treatment histories and outcomes can provide the model with a more comprehensive understanding of diagnoses. In addition, integrating the automated coding system with other sources of health data such as laboratory results, radiology reports and genetic information can provide a more holistic approach to diagnosis coding. Finally, future work should also focus on how the automated coding system can be implemented into the infrastructure of HIS, taking into account factors such as data privacy, interoperability and user acceptance.
Apart from inpatient diagnosis coding, NLP offers promising perspectives in various other domains. For example, the development of recommendation systems based on relevant clinical documentation could support healthcare workflows by suggesting relevant terms or concepts related to patients, such as recommendation systems for drugs and treatments. In this way, clinical decision-making processes could be streamlined and the workflow of HIS improved.
5. Conclusions
This study investigated the use of language models for inpatient diagnosis coding. Using our institutional dataset of over 230,645 admissions, our study highlighted the competitive performance of general-purpose language models, Multilingual BERT and Multilingual E5, and a domain-specific language model, MEDPSU-RoBERTa. Model performance also varied across diseases, with larger sample sizes leading to better results. The rarity of certain diseases poses a challenge for accurate coding, with more than 100 samples per diagnosis label suggested. We also analysed the impact of document length on performance and found that longer documents could pose a challenge to the model. Co-occurrence analysis demonstrated the model’s ability to capture relevant associations. The results highlight the need for larger datasets, strategies to deal with class imbalance, and integration of historical data to improve performance. Future research directions include improving the handling of rare diseases, improving the integration of historical data, integrating additional healthcare data sources and focusing on the implementation of coding systems in hospital information systems. These results contribute to the further development of diagnosis coding systems, highlighting their potential to facilitate accurate and efficient workflows.
Author Contributions
Conceptualization, K.S. and D.T.; methodology, K.S. and D.T.; software, K.S. and D.T.; validation, K.S., D.T., S.C. (Sawrawit Chairat) and S.C. (Sitthichok Chaichulee); formal analysis, K.S. and D.T.; investigation, K.S. and D.T.; resources, S.C. (Sitthichok Chaichulee); data curation, S.C. (Sitthichok Chaichulee) and D.T.; writing—original draft preparation, K.S., S.C. (Sawrawit Chairat) and S.C. (Sitthichok Chaichulee); writing—review and editing, K.S., S.C. (Sawrawit Chairat) and S.C. (Sitthichok Chaichulee); visualization, K.S. and S.C. (Sitthichok Chaichulee); supervision, S.C. (Sitthichok Chaichulee); project administration, S.C. (Sitthichok Chaichulee); funding acquisition, S.C. (Sitthichok Chaichulee). All authors have read and agreed to the published version of the manuscript.
Funding
This work was supported by the National Science, Research and Innovation Fund (NSRF) and Prince of Songkla University (Grant No. MED6601201S). Kerdkiat Suvirat and Sawrawit Chairat received graduate scholarships from the Faculty of Medicine of Prince of Songkla University.
Institutional Review Board Statement
The study was approved by the Human Research Ethics Committee, Faculty of Medicine, Prince of Songkla University (REC.65-120-38-2) and was conducted in accordance with the principles of the Declaration of Helsinki and the International Conference on Harmonization in Good Clinical Practice.
Informed Consent Statement
Informed consent was waived due to the retrospective nature of the study.
Data Availability Statement
Due to privacy concerns and the inclusion of sensitive patient information, the dataset used in this study was not published. MEDPSU-RoBERTa is a private clinical language model pre-trained on clinical documents from Songklanagarind Hospital. Due to the risk of data leakage during language generation, this model is not publicly available.
Conflicts of Interest
The authors declare no conflict of interest.
Abbreviations
The following abbreviations are used in this manuscript:
| AI | Artificial Intelligence |
| BERT | Bidirectional Encoder Representations from Transformers |
| CNN | Convolutional Neural Network |
| HIS | Hospital Information System |
| ICD | International Classification of Diseases |
| ICD-10-AM | International Classification of Diseases, Tenth Revision, Australian Modification |
| ICD-10-TM | International Classification of Diseases, Tenth Revision, Thai Modification |
| NLP | Natural Language Processing |
| RNN | Recurrent Neural Network |
| SVM | Support Vector Machine |
| TF-IDF | Term Frequency-Inverse Document Frequency |
| WHO | World Health Organization |
| XLM | Cross-lingual Language Model |
References
- Manchikanti, L.; Falco, F.J.E.; Hirsch, J.A. Ready or not! Here comes ICD-10. J. Neurointerv. Surg. 2011, 5, 86–91. [Google Scholar] [CrossRef] [PubMed]
- Khera, R.; Dorsey, K.B.; Krumholz, H.M. Transition to the ICD-10 in the United States. JAMA 2018, 320, 133–134. [Google Scholar] [CrossRef] [PubMed]
- Alonso, V.; Santos, J.V.; Pinto, M.; Ferreira, J.; Lema, I.; Lopes, F.; Freitas, A. Health records as the basis of clinical coding: Is the quality adequate? A qualitative study of medical coders’ perceptions. Health Inf. Manag. J. 2019, 49, 28–37. [Google Scholar] [CrossRef] [PubMed]
- World Health Organization. ICD-9: International Classification of Diseases 9th Revision; World Health Organization: Geneva, Switzerland, 1978. [Google Scholar]
- World Health Organization. ICD-10: International Statistical Classification of Diseases and Related Health Problems 10th Revision, 2nd ed.; World Health Organization: Geneva, Switzerland, 2004. [Google Scholar]
- World Health Organization. ICD-11: International Statistical Classification of Diseases and Related Health Problems 11th Revision; World Health Organization: Geneva, Switzerland, 2022. [Google Scholar]
- Dong, H.; Falis, M.; Whiteley, W.; Alex, B.; Matterson, J.; Ji, S.; Chen, J.; Wu, H. Automated clinical coding: What, why, and where we are? NPJ Digit. Med. 2022, 5, 159. [Google Scholar] [CrossRef]
- Venkatesh, K.P.; Raza, M.M.; Kvedar, J.C. Automating the overburdened clinical coding system: Challenges and next steps. NPJ Digit. Med. 2023, 6, 16. [Google Scholar] [CrossRef]
- Chapman, W.W.; Bridewell, W.; Hanbury, P.; Cooper, G.F.; Buchanan, B.G. A simple algorithm for identifying negated findings and diseases in discharge summaries. J. Biomed. Inf. 2001, 34, 301–310. [Google Scholar] [CrossRef]
- Crammer, K.; Dredze, M.; Ganchev, K.; Talukdar, P.P.; Carroll, S. Automatic Code Assignment to Medical Text. In Proceedings of the Workshop on BioNLP 2007, Prague, Czech Republic, 29 June 2007; Association for Computational Linguistics: Stroudsburg, PA, USA, 2007; pp. 129–136. [Google Scholar]
- Hasan, M.; Kotov, A.; Carcone, A.; Dong, M.; Naar, S.; Hartlieb, K.B. A study of the effectiveness of machine learning methods for classification of clinical interview fragments into a large number of categories. J. Biomed. Inf. 2016, 62, 21–31. [Google Scholar] [CrossRef]
- Moons, E.; Khanna, A.; Akkasi, A.; Moens, M.F. A Comparison of Deep Learning Methods for ICD Coding of Clinical Records. Appl. Sci. 2020, 10, 5262. [Google Scholar] [CrossRef]
- Xu, K.; Lam, M.; Pang, J.; Gao, X.; Band, C.; Mathur, P.; Papay, F.; Khanna, A.K.; Cywinski, J.B.; Maheshwari, K.; et al. Multimodal Machine Learning for Automated ICD Coding. In Proceedings of the 4th Machine Learning for Healthcare Conference, Ann Arbor, MI, USA, 9–10 August 2019; pp. 197–215. [Google Scholar]
- Boytcheva, S. Automatic Matching of ICD-10 codes to Diagnoses in Discharge Letters. In Proceedings of the Second Workshop on Biomedical Natural Language Processing, Hissar, Bulgaria, September 2011; Association for Computational Linguistics: Stroudsburg, PA, USA, 2011; pp. 11–18. [Google Scholar]
- Yu, Y.; Li, M.; Liu, L.; Fei, Z.; Wu, F.X.; Wang, J. Automatic ICD code assignment of Chinese clinical notes based on multilayer attention BiRNN. J. Biomed. Inf. 2019, 91, 103114. [Google Scholar] [CrossRef]
- Almagro, M.; Unanue, R.M.; Fresno, V.; Montalvo, S. ICD-10 Coding of Spanish Electronic Discharge Summaries: An Extreme Classification Problem. IEEE Access 2020, 8, 100073–100083. [Google Scholar] [CrossRef]
- Devlin, J.; Chang, M.W.; Lee, K.; Toutanova, K. BERT: Pre-training of Deep Bidirectional Transformers for Language Understanding. arXiv 2019, arXiv:1810.04805. [Google Scholar]
- Lample, G.; Conneau, A. Cross-lingual Language Model Pretraining. arXiv 2019, arXiv:1901.07291. [Google Scholar]
- Lee, J.; Yoon, W.; Kim, S.; Kim, D.; Kim, S.; So, C.H.; Kang, J. BioBERT: A pre-trained biomedical language representation model for biomedical text mining. Bioinformatics 2019, 36, 1234–1240. [Google Scholar] [CrossRef] [PubMed]
- Huang, K.; Altosaar, J.; Ranganath, R. ClinicalBERT: Modeling Clinical Notes and Predicting Hospital Readmission. arXiv 2020, arXiv:1904.05342. [Google Scholar]
- Amin, S.; Neumann, G.; Dunfield, K.; Vechkaeva, A.; Chapman, K.; Wixted, M. MLT-DFKI at CLEF eHealth 2019: Multi-label Classification of ICD-10 Codes with BERT. In Proceedings of the 10th Conference and Labs of the Evaluation Forum, Lugano, Switzerland, 9–12 September 2019. [Google Scholar]
- Johnson, A.E.; Pollard, T.J.; Shen, L.; Lehman, L.W.H.; Feng, M.; Ghassemi, M.; Moody, B.; Szolovits, P.; Anthony Celi, L.; Mark, R.G. MIMIC-III, a freely accessible critical care database. Sci. Data 2016, 3, 160035. [Google Scholar] [CrossRef]
- Silvestri, S.; Gargiulo, F.; Ciampi, M.; De Pietro, G. Exploit Multilingual Language Model at Scale for ICD-10 Clinical Text Classification. In Proceedings of the IEEE Symposium on Computers and Communications (ISCC), Rennes, France, 7–10 July 2020; pp. 1–7. [Google Scholar] [CrossRef]
- López-García, G.; Jerez, J.M.; Ribelles, N.; Alba, E.; Veredas, F.J. Transformers for Clinical Coding in Spanish. IEEE Access 2021, 9, 72387–72397. [Google Scholar] [CrossRef]
- Remmer, S.; Lamproudis, A.; Dalianis, H. Multi-label Diagnosis Classification of Swedish Discharge Summaries—ICD-10 Code Assignment Using KB-BERT. In Proceedings of the Conference Recent Advances in Natural Language Processing, Varna, Bulgaria, 1–3 September 2021; pp. 1158–1166. [Google Scholar]
- Phatthiyaphaibun, W.; Chaovavanich, K.; Polpanumas, C.; Suriyawongkul, A.; Lowphansirikul, L.; Chormai, P. PyThaiNLP: Thai Natural Language Processing in Python. 2023. Available online: https://github.com/PyThaiNLP/pythainlp (accessed on 15 August 2023).
- Wang, L.; Yang, N.; Huang, X.; Jiao, B.; Yang, L.; Jiang, D.; Majumder, R.; Wei, F. Text Embeddings by Weakly-Supervised Contrastive Pre-training. arXiv 2022, arXiv:2212.03533. [Google Scholar]
- Liu, Y.; Ott, M.; Goyal, N.; Du, J.; Joshi, M.; Chen, D.; Levy, O.; Lewis, M.; Zettlemoyer, L.; Stoyanov, V. RoBERTa: A Robustly Optimized BERT Pretraining Approach. arXiv 2019, arXiv:1907.11692. [Google Scholar] [CrossRef]
- Wolf, T.; Debut, L.; Sanh, V.; Chaumond, J.; Delangue, C.; Moi, A.; Cistac, P.; Rault, T.; Louf, R.; Funtowicz, M.; et al. Transformers: State-of-the-Art Natural Language Processing. In Proceedings of the 2020 Conference on Empirical Methods in Natural Language Processing: System Demonstrations, Online, 16–20 November 2020; Association for Computational Linguistics: Stroudsburg, PA, USA, 2020; pp. 38–45. [Google Scholar]
- Friedman, M. A comparison of alternative tests of significance for the problem of m rankings. Ann. Math. Stat. 1940, 11, 86–92. [Google Scholar] [CrossRef]
- Nemenyi, P.B. Distribution-Free Multiple Comparisons. Ph.D. Thesis, Princeton University, Princeton, NJ, USA, 1963. [Google Scholar]
- Biseda, B.; Desai, G.; Lin, H.; Philip, A. Prediction of ICD Codes with Clinical BERT Embeddings and Text Augmentation with Label Balancing using MIMIC-III. arXiv 2020, arXiv:2008.10492. [Google Scholar]
- Wu, H.; Toti, G.; Morley, K.I.; Ibrahim, Z.M.; Folarin, A.; Jackson, R.; Kartoglu, I.; Agrawal, A.; Stringer, C.; Gale, D.; et al. SemEHR: A general-purpose semantic search system to surface semantic data from clinical notes for tailored care, trial recruitment, and clinical research. J. Am. Med. Inf. Assoc. 2018, 25, 530–537. [Google Scholar] [CrossRef] [PubMed]
- Dong, H.; Suárez-Paniagua, V.; Zhang, H.; Wang, M.; Casey, A.; Davidson, E.; Chen, J.; Alex, B.; Whiteley, W.; Wu, H. Ontology-driven and weakly supervised rare disease identification from clinical notes. BMC Med. Inf. Decis. Mak. 2023, 23, 86. [Google Scholar] [CrossRef] [PubMed]

Disclaimer/Publisher’s Note: The statements, opinions and data contained in all publications are solely those of the individual author(s) and contributor(s) and not of MDPI and/or the editor(s). MDPI and/or the editor(s) disclaim responsibility for any injury to people or property resulting from any ideas, methods, instructions or products referred to in the content. |
© 2023 by the authors. Licensee MDPI, Basel, Switzerland. This article is an open access article distributed under the terms and conditions of the Creative Commons Attribution (CC BY) license (https://creativecommons.org/licenses/by/4.0/).