Featured Application
This work provides multiple screenshots about the evolution of an industrial fermentation process inside a table olives facility. Data collected and interpreted will help the table olives industry to better understand the process and its criticalities, so to prevent loss of product due to spoilage and to provide an increased quality of the final product.
Abstract
The process of debittering table olives, known as “natural”, represents the most studied method for its peculiarities. Searching among other studies, very little evidence was found about “outside the lab” tests; this encouraged our research, given the numerous external factors that could influence the whole process. In this study, we followed batch fermentation processes inside an industrial facility, testing both spontaneous and guided processes. The starter selected was a 1:1 ratio of Lactiplantibacillus plantarum B1 strain and Saccharomyces cerevisiae SC24 strain. (108 CFU/mL). Chemical-physical, microbiological, and phenolic parameters of five different barrels were analysed, with a periodic sampling (seven samplings). Results obtained confirmed logical correlations (p < 0.05 Pearson) between chemical-physical parameters (ashes vs. pulp/seed ratio, ashes vs. humidity, salt content vs. pulp/seed ratio, oil content vs. humidity) and showed a good discrimination between samples, especially regarding the phenolic profile of the different barrels (PCA and AHC). Microbiological analysis showed the evolution of microorganisms in the barrels, but the results have an unclear interpretation. No Enterobacter were found, so the safety of both process and product can be confirmed. These results highlight some criticalities of the industrial processes and represent useful data for technicians and production structures in order to improve the quality of the product and minimize losses.
1. Introduction
Olives, the fruits of Olea europaea L. tree, have a high content of phenolic substances. These substances make them inedible due to the strong bitter taste. However, they become ready for consumption after an adequate transformation process. Once processed, table olives are widely used as appetizers or as an ingredient for culinary recipes. Table olives are the most well-known fermented food in the Mediterranean region, and their consumption is increasing year by year worldwide. However, despite their diffusion, production in certain cases is still craft-based [1,2,3].
The debittering processes applied to table olives are many and different, and each has its own peculiarities aimed at obtaining a highly palatable and appreciated product, consumption of which is spreading throughout the world thanks to the popularity of the “Mediterranean Diet”. The most common methods of debittering are the “Castelvetrano” and the “Sevillan” styles, which use NaOH for total or partial hydrolysis of phenolic substances, and the “Greek/natural” style, which uses epicarp resident microflora for phenol hydrolysis. [1,4]. Among the different debittering methods, the one that most attracts research is the “natural” method, as it enriches the sensory characteristics of the original fruit. This method involves immersion in NaCl brine after harvesting, during which time the olives begin a fermentation as a result of the spontaneous resident microflora of the epicarp. The fermentation usually lasts for several months (about 7 to 8, or even more) [1,5,6]. These microorganisms debitter the olives by hydrolysing the complex phenols glucosides responsible for the bitter taste (mainly Oleuropein and Ligstroside) into simple phenols (mainly Hydroxytyrosol and Tyrosol). In doing so, they enrich the product with aromatic substances [7,8]. This fermentation process is also affected by the concentration of NaCl in brine, and by pH, acid concentration, temperature, and other factors that can affect positively or negatively affect the process [9]. Moreover, the diversity of microbial and fungal species on the epicarp means that “natural” fermentations are never identical and, therefore, this method of preparation still represents a source of uncertainty regarding the characteristics of the finished product [3]. Over the years, several “lab-scale” experimental tests have been successfully carried out with starter cultures of selected microorganisms [10,11,12,13,14,15,16]. However,, after review of the literature, there is little evidence of data obtained at an industrial level. We decided to perform tests on large quantities and under the same operating conditions as commercial/industrial processes in order to monitor the progress of the spontaneous fermentation from a chemical-physical and microbiological point of view inside an industrial facility and to verify the effectiveness of some starters in a guided fermentation.
The choice to carry out “field” tests was dictated by the need to understand the processes that are commonly carried out by commercial producers and then to monitor the progress of the various components characterizing the evolution of the product. In this way, we aim to help companies obtain a product with constant and reproducible chemical-physical and sensory characteristics and to prevent the onset of anomalous fermentations.
2. Materials and Methods
2.1. Experimental Trial
Olives of cv. Leccino (caliber 17+) were supplied by the company Ficacci Olive Co. (Castel Madama RM, Italy) as part of a batch that fitted several hundred barrels. The company allowed us to use five barrels, each containing about 140 kg of olives and 80 kg of brine. The barrels were randomly selected from the entire batch on 6 November 2021. The initial brine inside the barrels was 13% NaCl in non-sterilized potable water. These barrels were named N1, N2, G1, G2, and FUO, as listed in Table 1. N1, N2, G1, and G2 were placed inside in a company shed, while the barrel named FUO followed all the other barrels of the production batch, and was stored outdoors in a yard exposed to bad weather and sudden changes in temperature (Figure 1).

Table 1.
Barrel codes list.
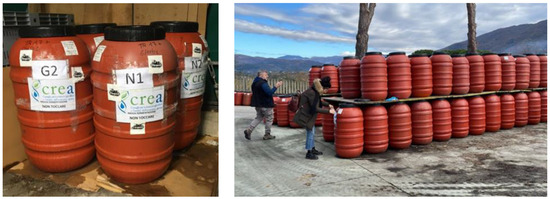
Figure 1.
Test barrels. From the left: N1, N2, G1, and G2 located inside a shed; To the right: the FUO barrel located in an external area.
We then left barrels N1 and N2 to spontaneous fermentation due to the natural epiphytic microflora, while barrels G1 and G2 were inoculated with a mix of Lactiplantibacillus plantarum (LAB) B1 strain derived from the CREA-IT Pescara microorganisms collection and Saccharomyces cerevisiae strain CS24 from the CREA-IT Turin collection. The inoculum load was 1 × 10⁸ CFU/mL. The choice of the B1 strain for LAB was settled after a deep screening of the various strains present in the collection [11]. The choice to add a yeast to the inoculum, and especially S. cerevisae SC24, was due to the known potential role of this yeast to protect the fermentation from spoilage thanks to their killer activity [14,17,18]. The FUO barrel was chosen randomly from hundreds of barrels, and it was identical to N1 and N2, except for two differences:
- 1.
- it was kept sealed until the end of the fermentation process;
- 2.
- its position, because it was placed in an open space together with all the other barrels.
Barrels N1, N2, G1, and G2 have been periodically opened to take olives and brine samples to analyse chemical and microbiological parameters, according to the method suggested by Bleve et al. [19]. The FUO barrel was kept sealed until the end of the fermentation process (210 days).
Once the correct filling of the 4 barrels had been verified, a special internal crate made from polymeric material intended for food was put just below the cap to prevent the olives rising from out of the brine, thus avoiding the formation of a yeast film [20]. Finally, the barrels were closed with the appropriate screw cap. After a conditioning period, set at 23 days, the inoculations were carried out on barrels G1 and G2 with a 1:1 ratio of YPD Broth (Yeast-extract Peptone Dextrose).
According to the schedule illustrated in Table 2, periodic visits were made to the facility to obtain samples of brine and olives, always taking care to replace the removed content with fresh brine in order not to leave excessive empty space in the barrel and avoiding the oxidative action of air. Globally, we performed 7 samplings, as shown in Table 2.
Table 2.
Samplings schedule.
The sampling time was selected in order to monitor the whole fermentation process from both a microbiological and chemical-physical point of view. The timeline was chosen based on other studies [11,19], with some shift due to adverse climatic conditions and the facility being located 200 km away from the research lab; in addition, the COVID-19 pandemic occurred, resulting in a period of lockdown. A higher sampling rate could spoil the fermentation process due to excessive manipulation of the barrels’ content, while a lower sampling rate could miss some important variations in one or more parameters.
In regard to the operative procedures used to obtain the aliquots of olives and brine from the barrels under investigation, the researchers followed correct hygiene practices (using disposable gloves, FFP2 masks, clean and disinfected utensils) as required by HACCP standards and guidelines.
We determined the end of fermentation at the 5th sampling, based on the chemical-physical parameters analyzed.
From June 2022, samples were also taken from the olive barrel left sealed and stored outdoors with the rest of the production batch (FUO) in order to evaluate how the transformation processes normally occurred (theoretically as in N1 and N2) but without any interference given by the sampling operations. The same procedure was also applied in two subsequent samplings during the shelf-life, 3 and 6 months after the end of the fermentation process. Analyzing the chemical-physical and microbiological parameters of the olives in brine well beyond the “standard” period of fermentation allowed us to evaluate any changes in the chemical composition, in the development and growth of the various microbial species, and in the characteristics of the final product.
2.2. Analytical Determinations
The complete set of analyses performed is listed in Table 3. All analyses were performed in duplicate following the methodology described in [11,12].
Table 3.
Determinations carried out on the olives and on the fermentation brines.
2.3. Statistical Analysis
Software used for normality tests, ANOVA, and correlation analysis (Pearson) was PAST v. 4.12 (PAST: Paleontological Statistics software package for education and data analysis. Palaeontologia Electronica 4(1): 9pp. https://www.nhm.uio.no/english/research/resources/past/, (accessed on 20 December 2022).
Software used for PCA (Principal Component Analysis) and AHC (Ascending Hierarchical Classification) was XLStat Premium ver. 25.2.1411.0 from Addinsoft (Lumivero (2023)). XLSTAT statistical and data analysis solution (Paris, France. https://www.xlstat.com, accessed on 18 November 2022).
3. Results
3.1. Chemical-Physical Parameters
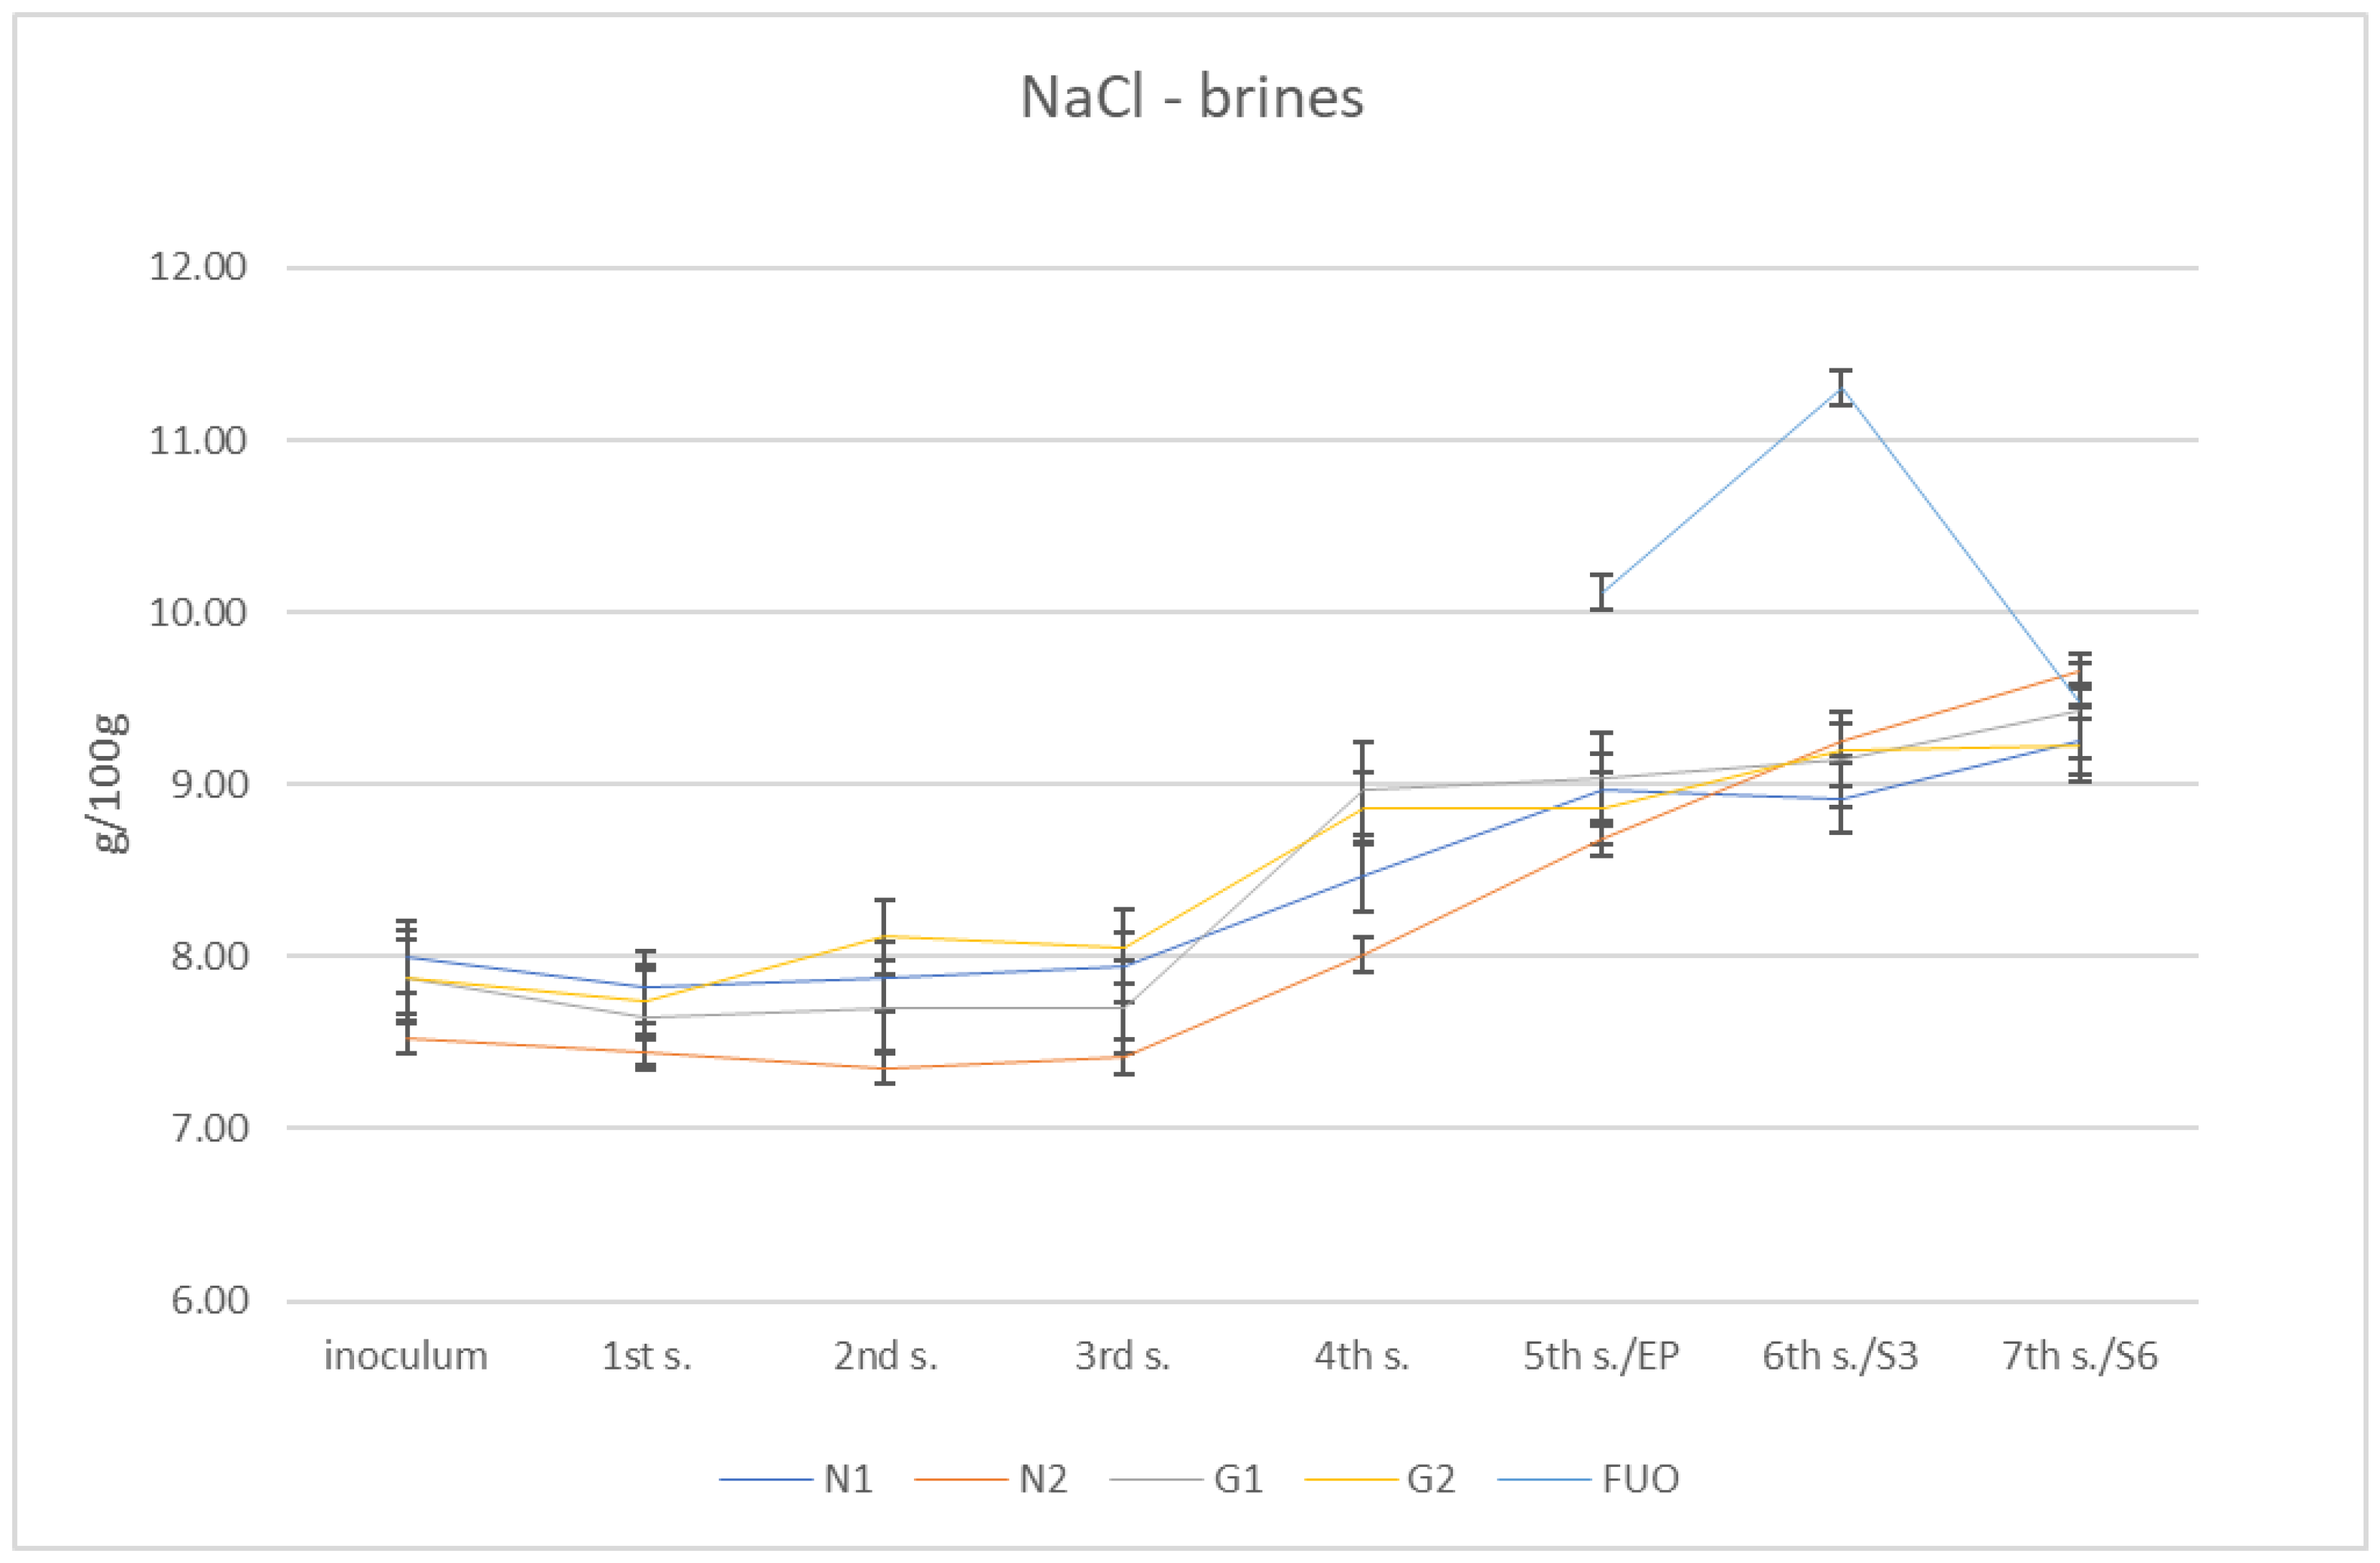
From these determinations, numerous data related to the individual parameters subject to investigation were collected. Regarding the salt content of the various brines, the initial measurements of the four barrels (N1, N2, G1 and G2) gave globally increasing values from approximately 8% salinity up to almost 10% (g/100 g). The control barrel (FUO) had fluctuating values in the three measurements undertaken (10.11%, 11.30%, and9.49%, respectively). At the fourth sampling (December), a value of 9.49% was obtained, in line with the other barrels tested. The global results are shown in Figure 2.
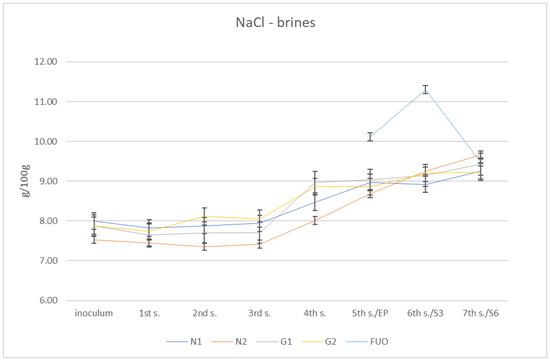
Figure 2.
Trend of NaCl content in brines.
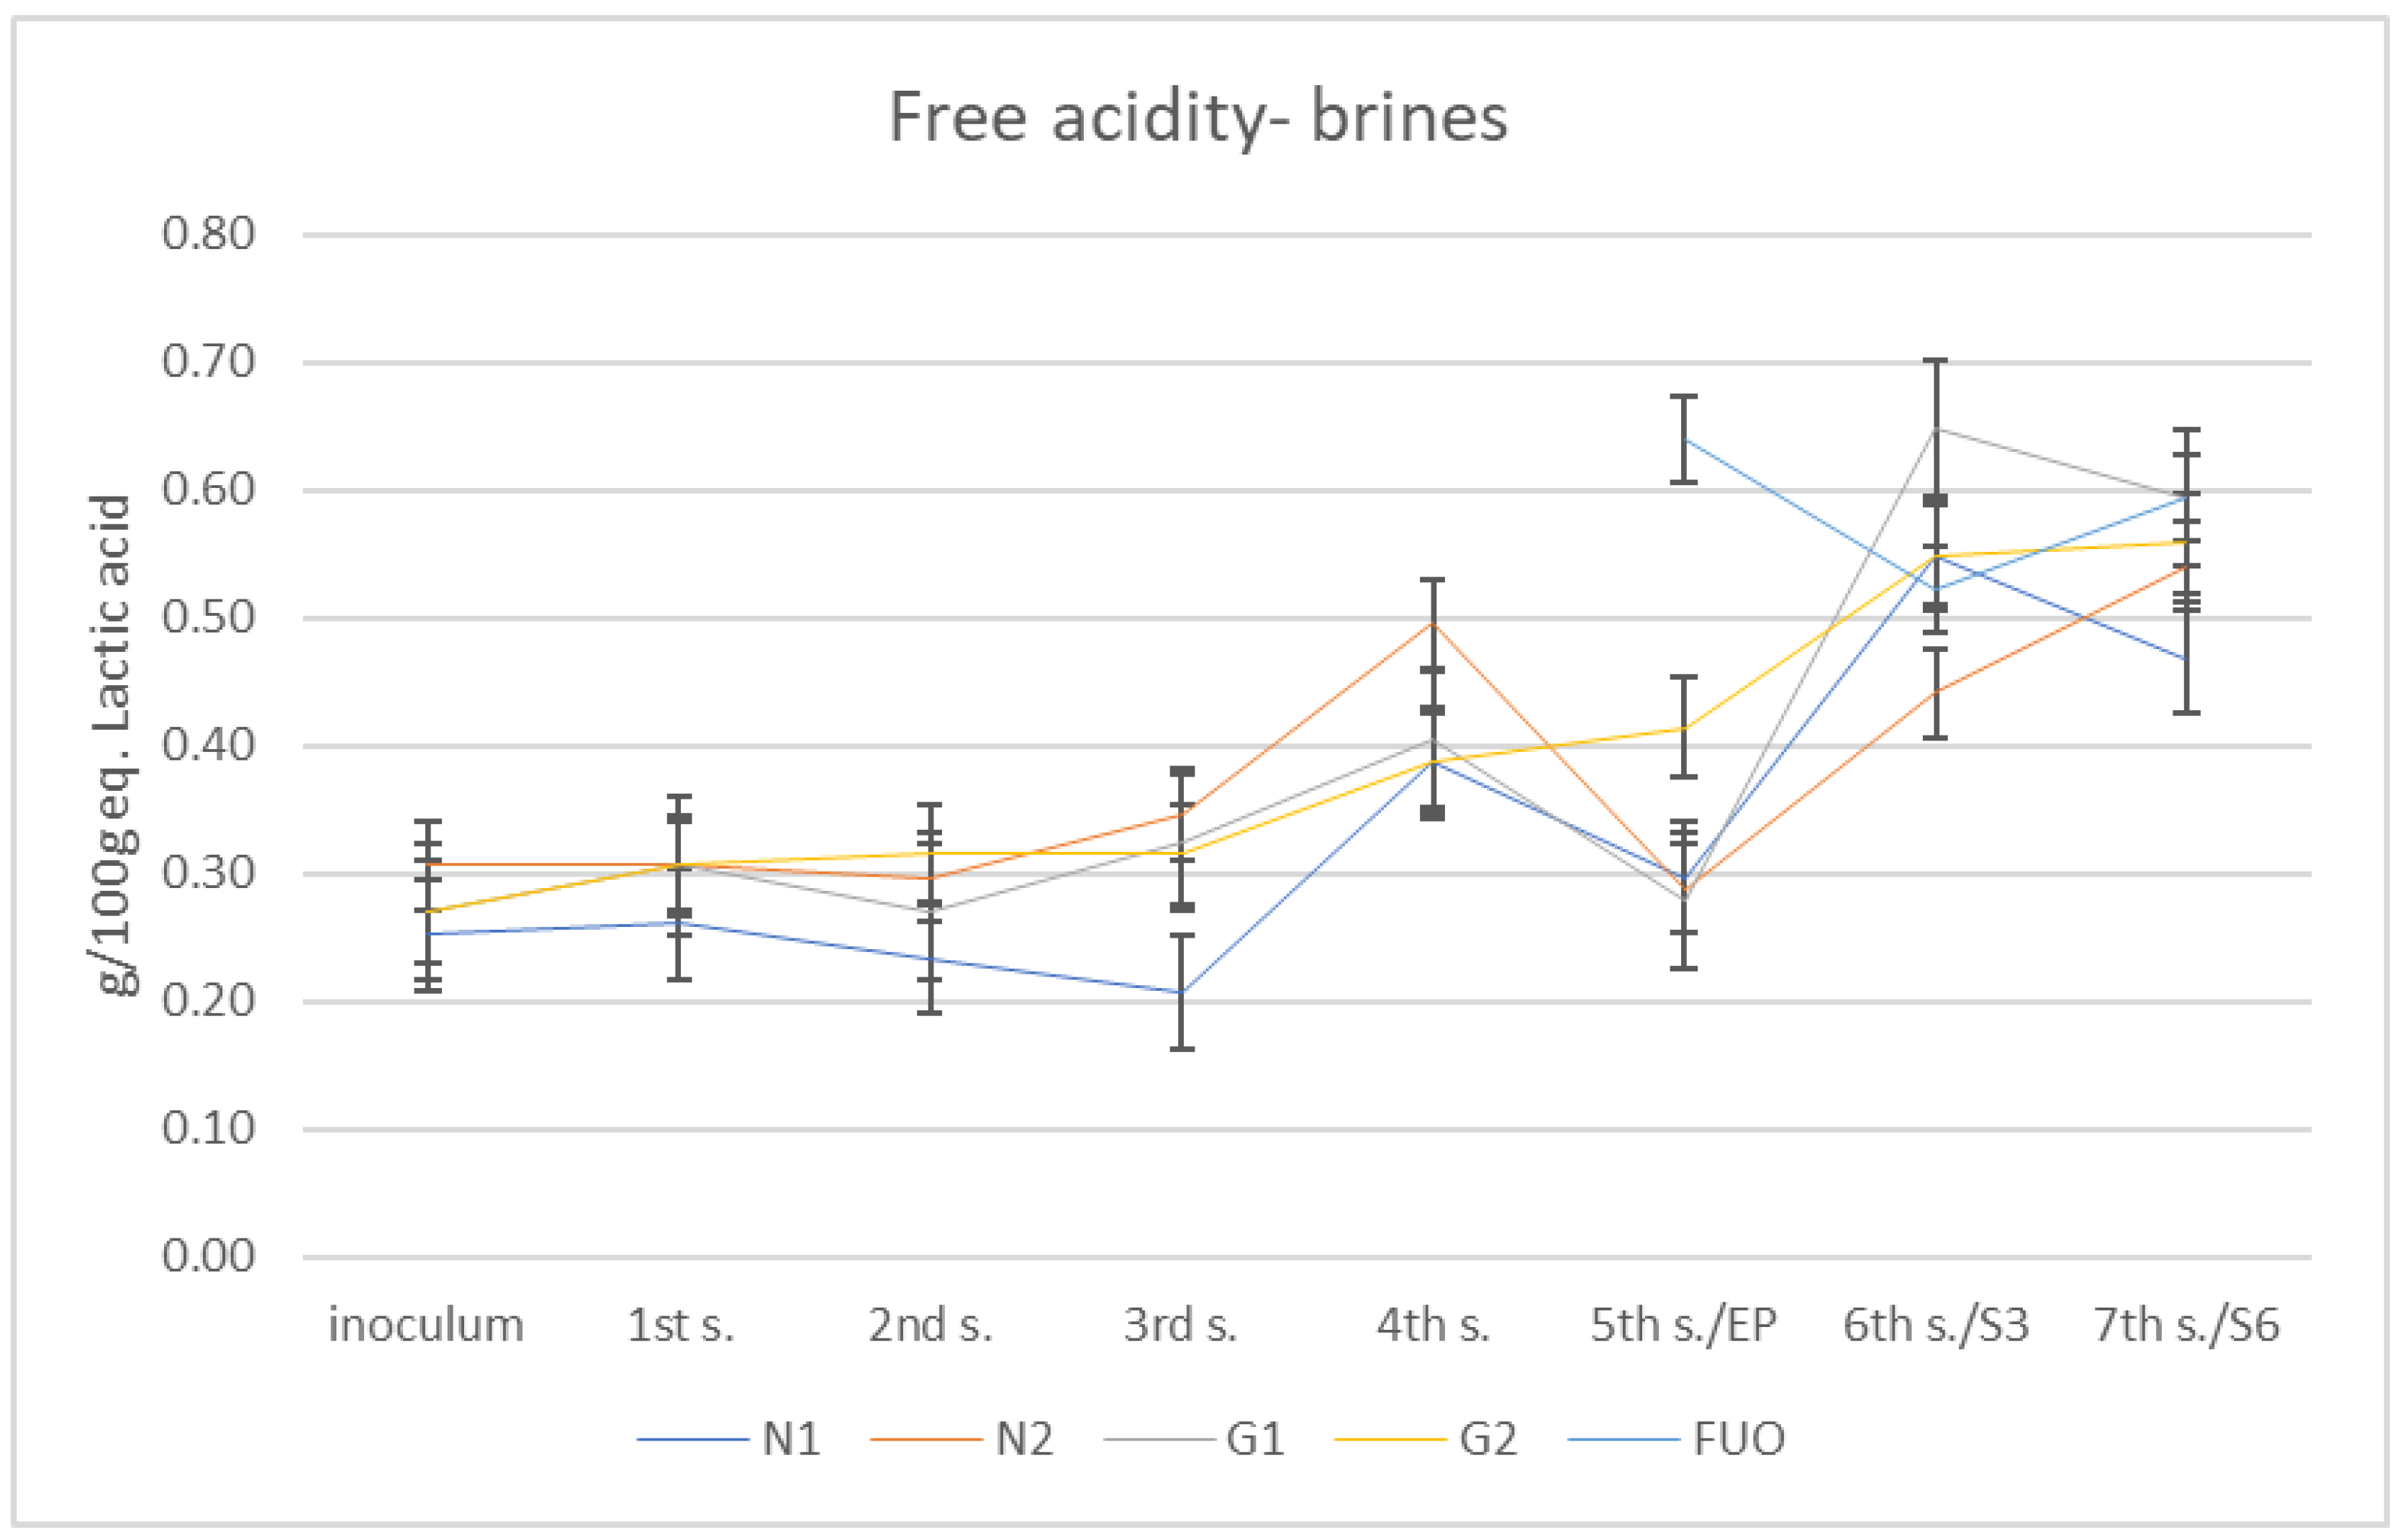
The total free acidity results are shown in Figure 3. Total free acidity is given by a set of short-chain organic acids that are released into the brine during the various fermentation processes by the different species of the fermenting microflora; some of these, such as acetic acid, affect the pH parameter more than others. The method used neutralizes all acids with a strong base (Sodium hydroxide (NaOH)), and the final results are expressed as g/100 g of equivalent lactic acid, preventing the characterization of the individual acidic components. For this reason, it is not possible to attempt a correlation between pH and total free acidity. At the end of fermentation period, all barrels under investigation showed total free acidity values lower than the FUO control barrel. Despite this, during the shelf-life (three months and six months after end of fermentation), the total free acidity increased in all barrels until it reached the values obtained from the FUO barrel.
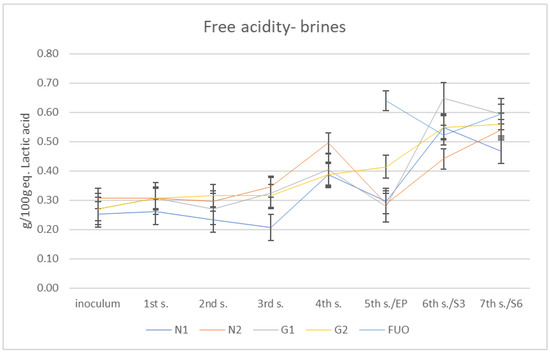
Figure 3.
Total free acidity trend of the different brines.
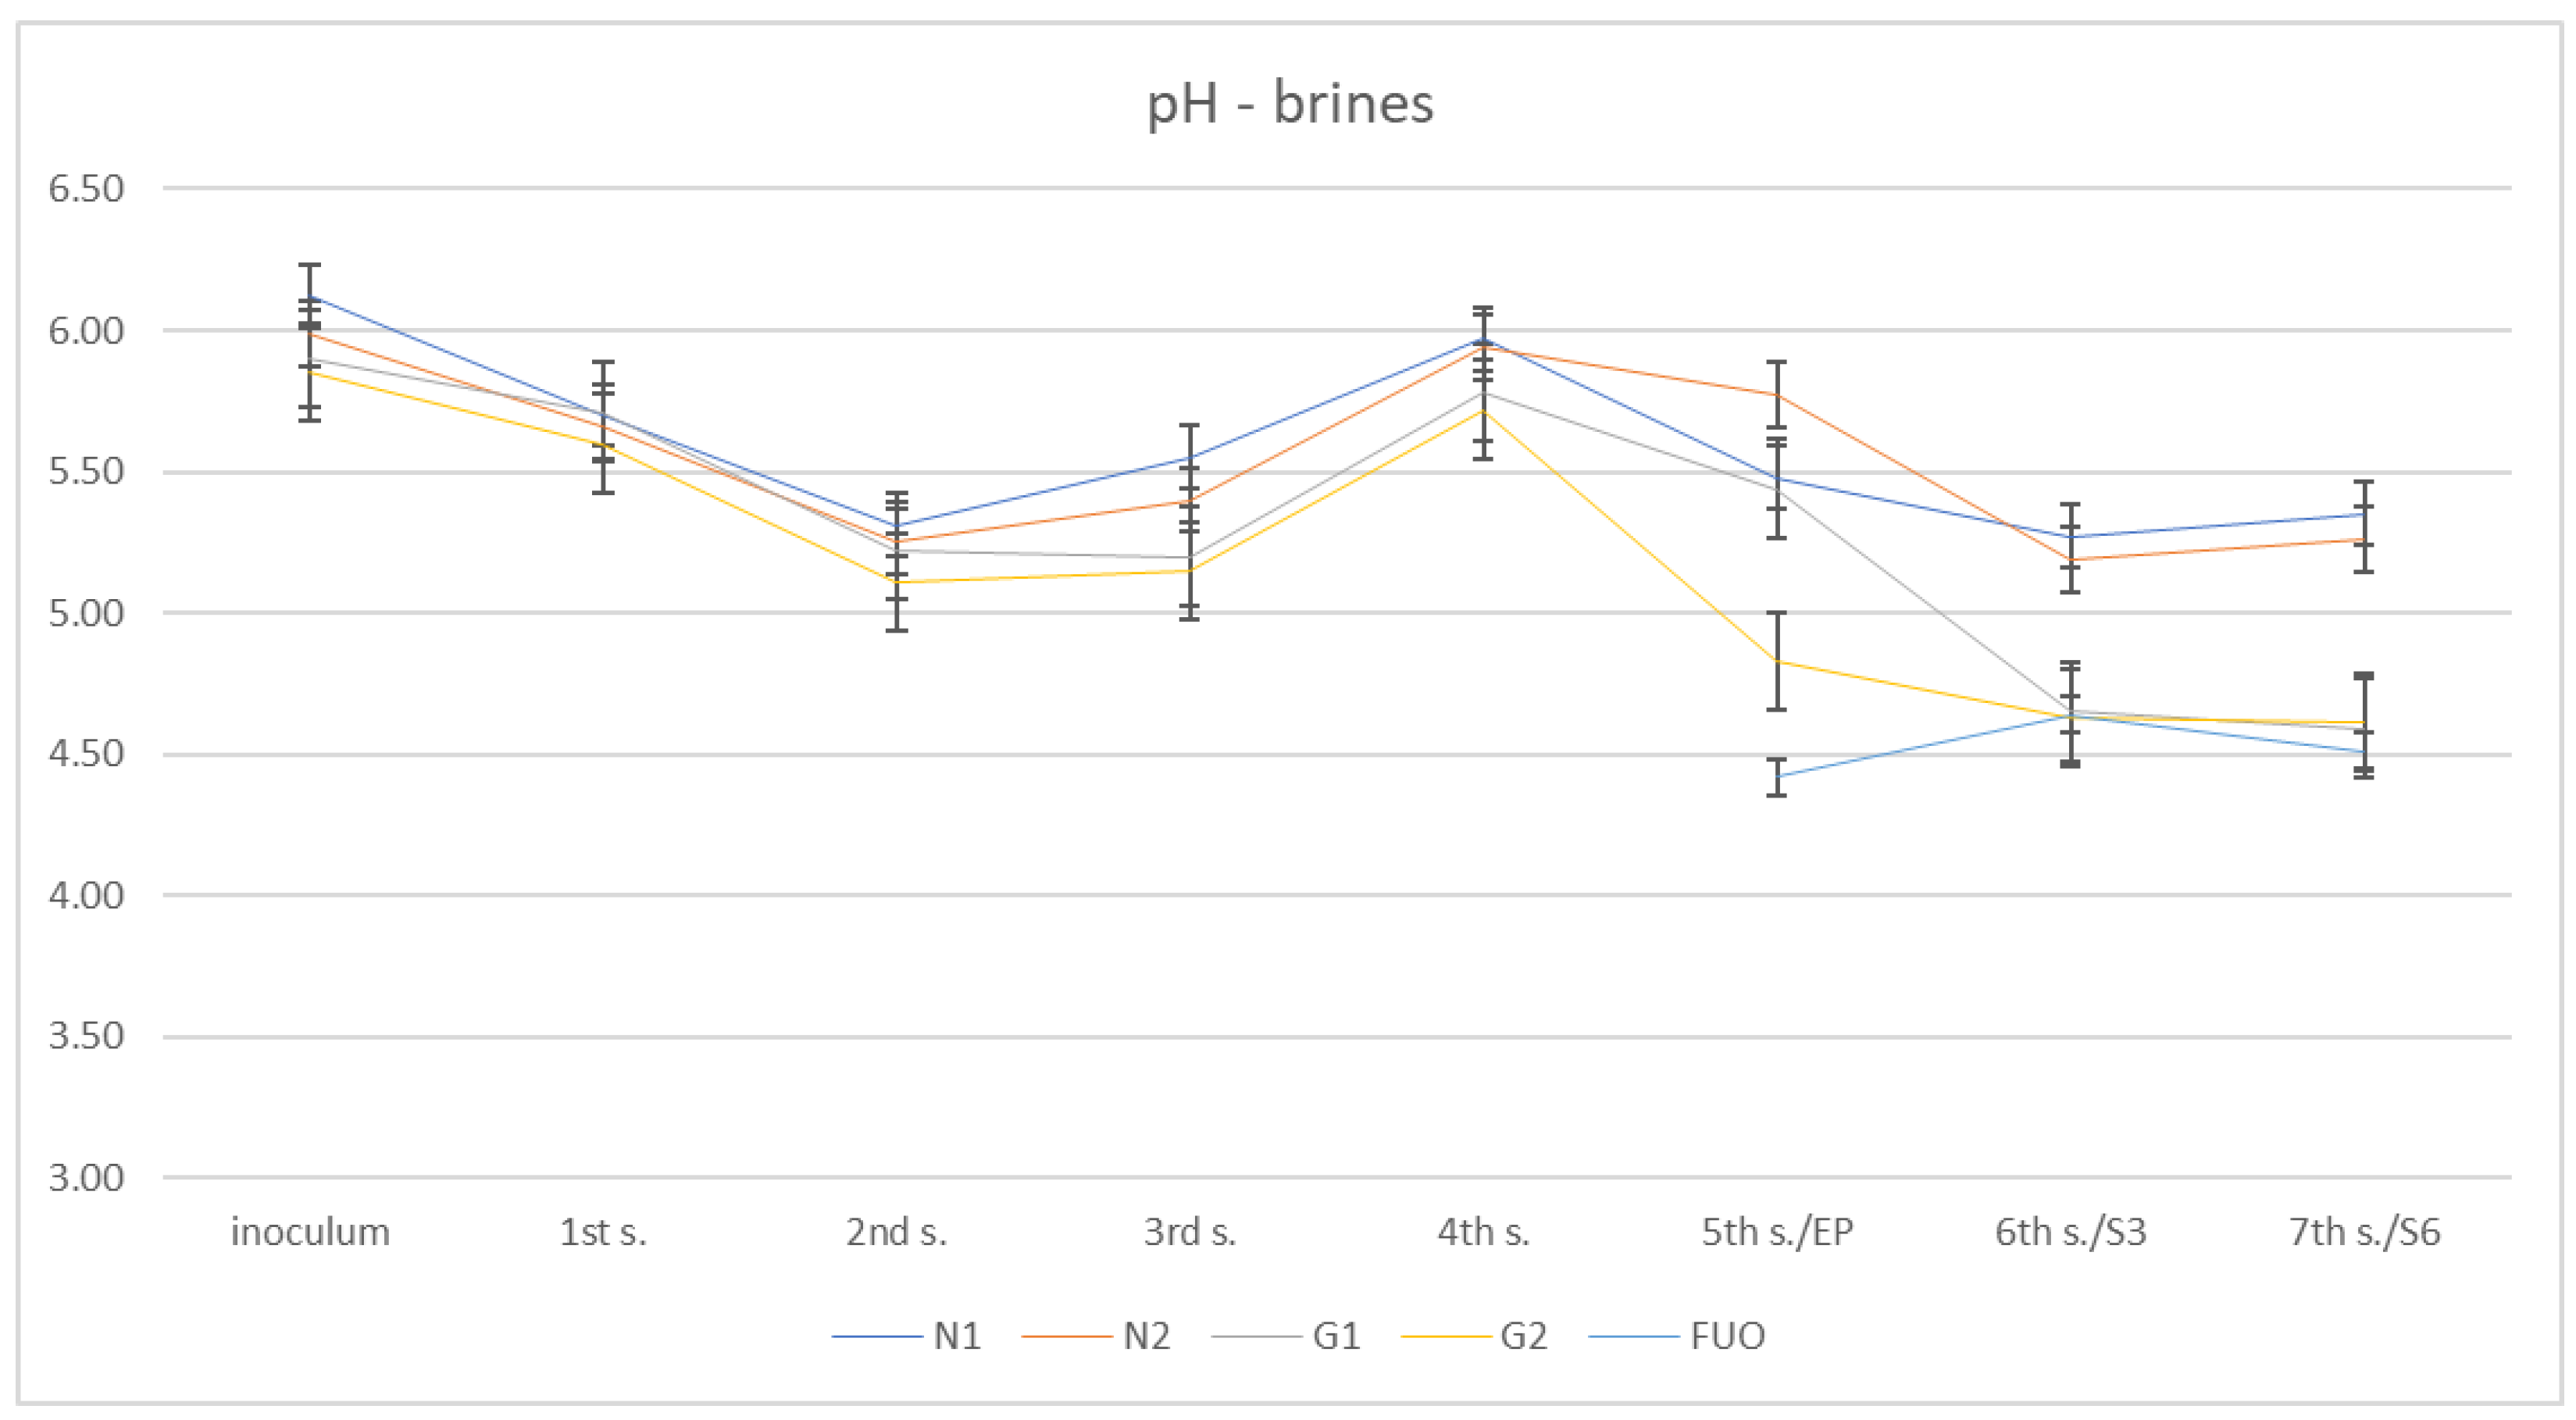
In Figure 4, we can observe the pH trend in the barrels during the various phases of the fermentation process.
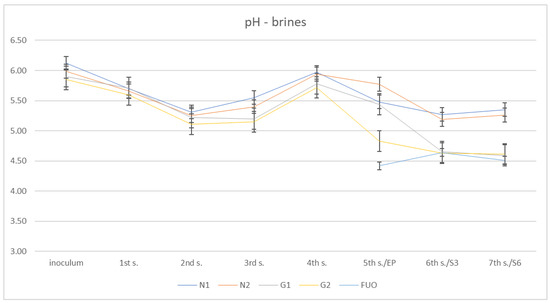
Figure 4.
pH trend of the different brines.
In this case, it can be observed that after starting from pH values close to neutral (5.85–6.12) in the inoculation phase, an initial lowering of the pH took place in the first stages of fermentation until reaching a minimum at the second sampling (5.15–5.55). Subsequently, a modest increase was observed, which reached its peak at the 4th sampling (5.72–5.97). Finally, there was a significant decrease between the fifth sampling (end of fermentation) and seventh sampling (shelf-life six months), with minimum values for the inoculated barrels (G1 and G2) at the seventh sampling (4.63–5.27).Of the three samplings taken into consideration, the external control barrel (FUO), assumed globally lower pH values than the test barrels, with values at the fifth, sixth, and seventh samplings of 4.42, 4.64, and 4.51, respectively.
The other chemical-physical values relating to fresh fruit and to fruit at the end of processing are shown in Table 4 and Table 5.
Table 4.
Olives’ chemico-physical parameters at the beginning of the experiment (barrels preparation). Results are expressed as mean ± standard deviation.
Table 5.
Olives’ chemical-physical parameters at the end of fermentation process (5th sampling). Results are expressed as mean ± standard deviation.
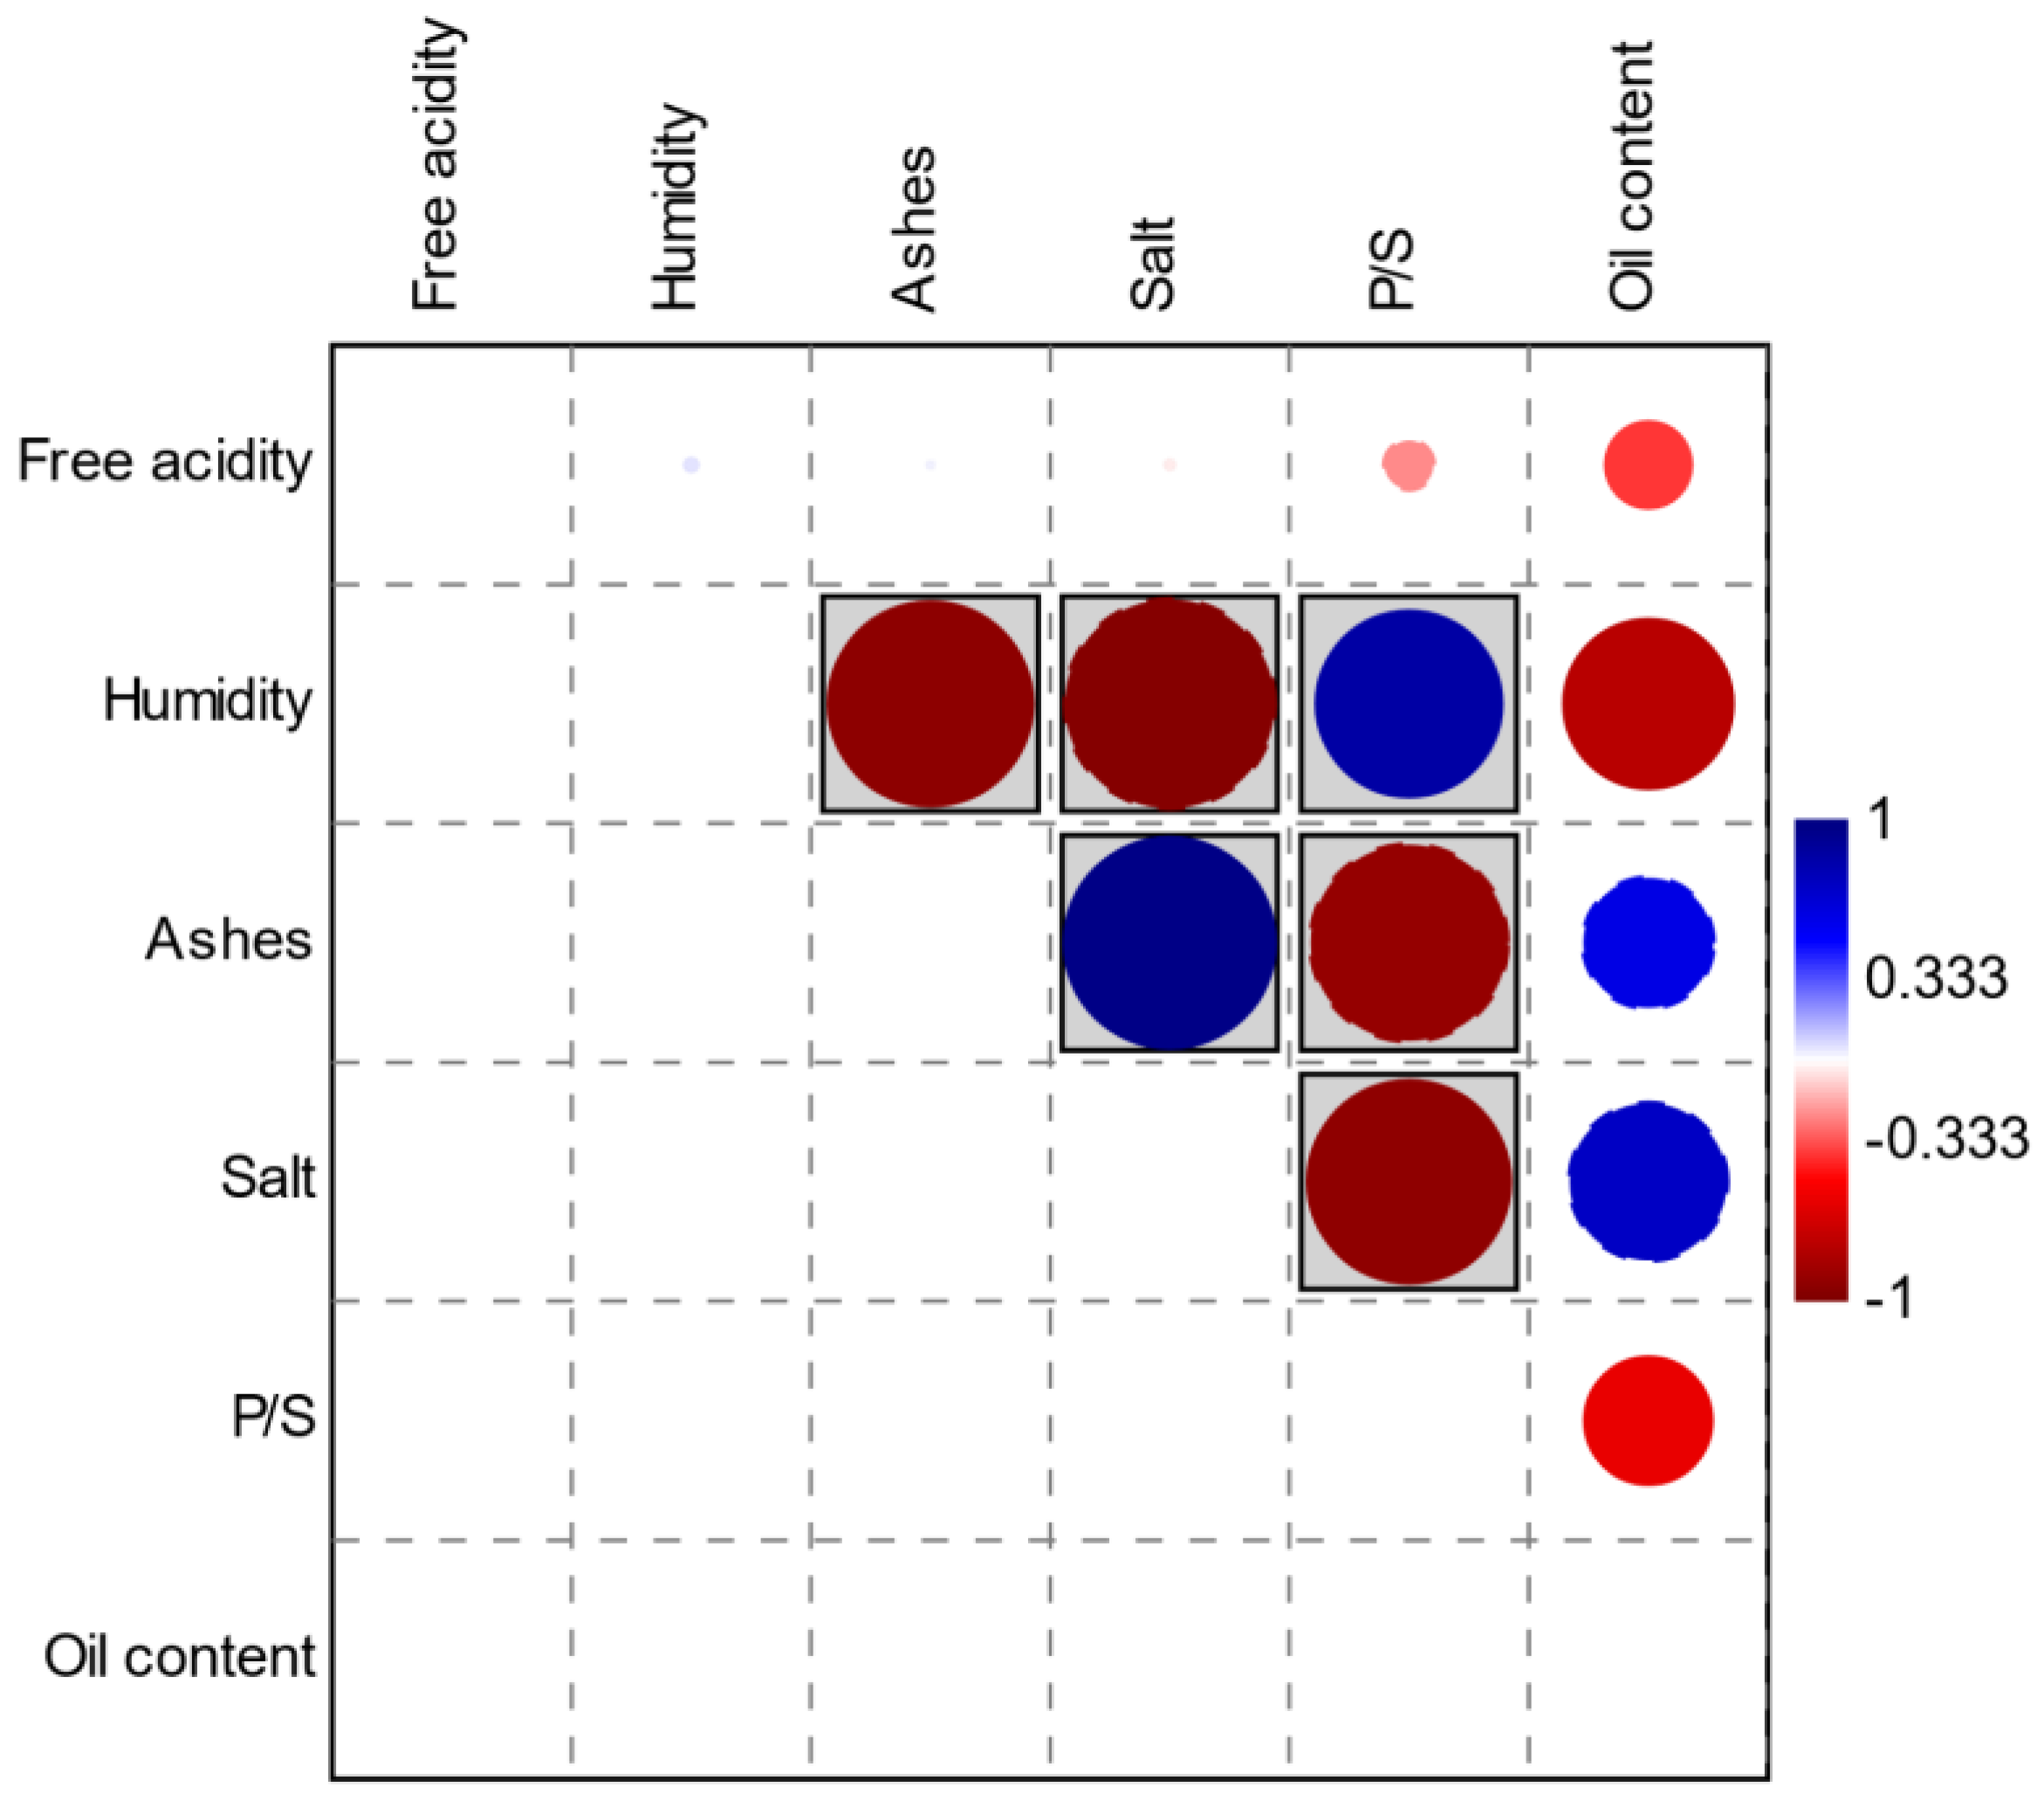
As can be seen in Figure 5, there are significant correlations (Pearson) between some of these parameters. Red circles indicate negative correlations and blue circles indicate positive correlations. The parameters in the gray boxes express values of p < 0.05.
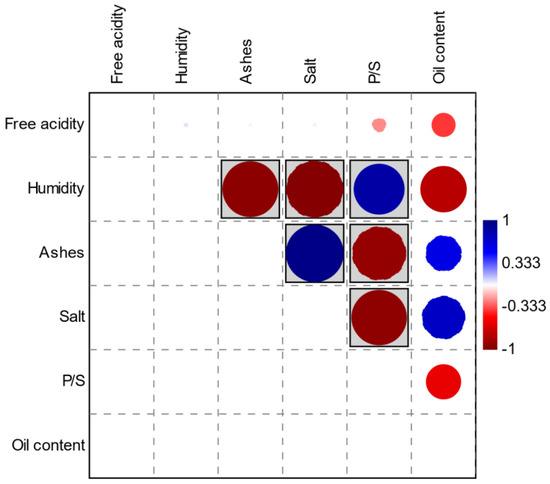
Figure 5.
Correlation graph (Pearson) between chemical-physical parameters.
It was not possible to include microbiological data in the Pearson’s correlation matrix as they failed the normality tests.
Data obtained were subsequently treated by PCA (Analysis of Principal Components) and AHC (Ascending Hierarchical Classification), considering the values obtained on the pulp of the fresh product and on the pulp of the products of the five barrels at the end of fermentation (fifth sampling).
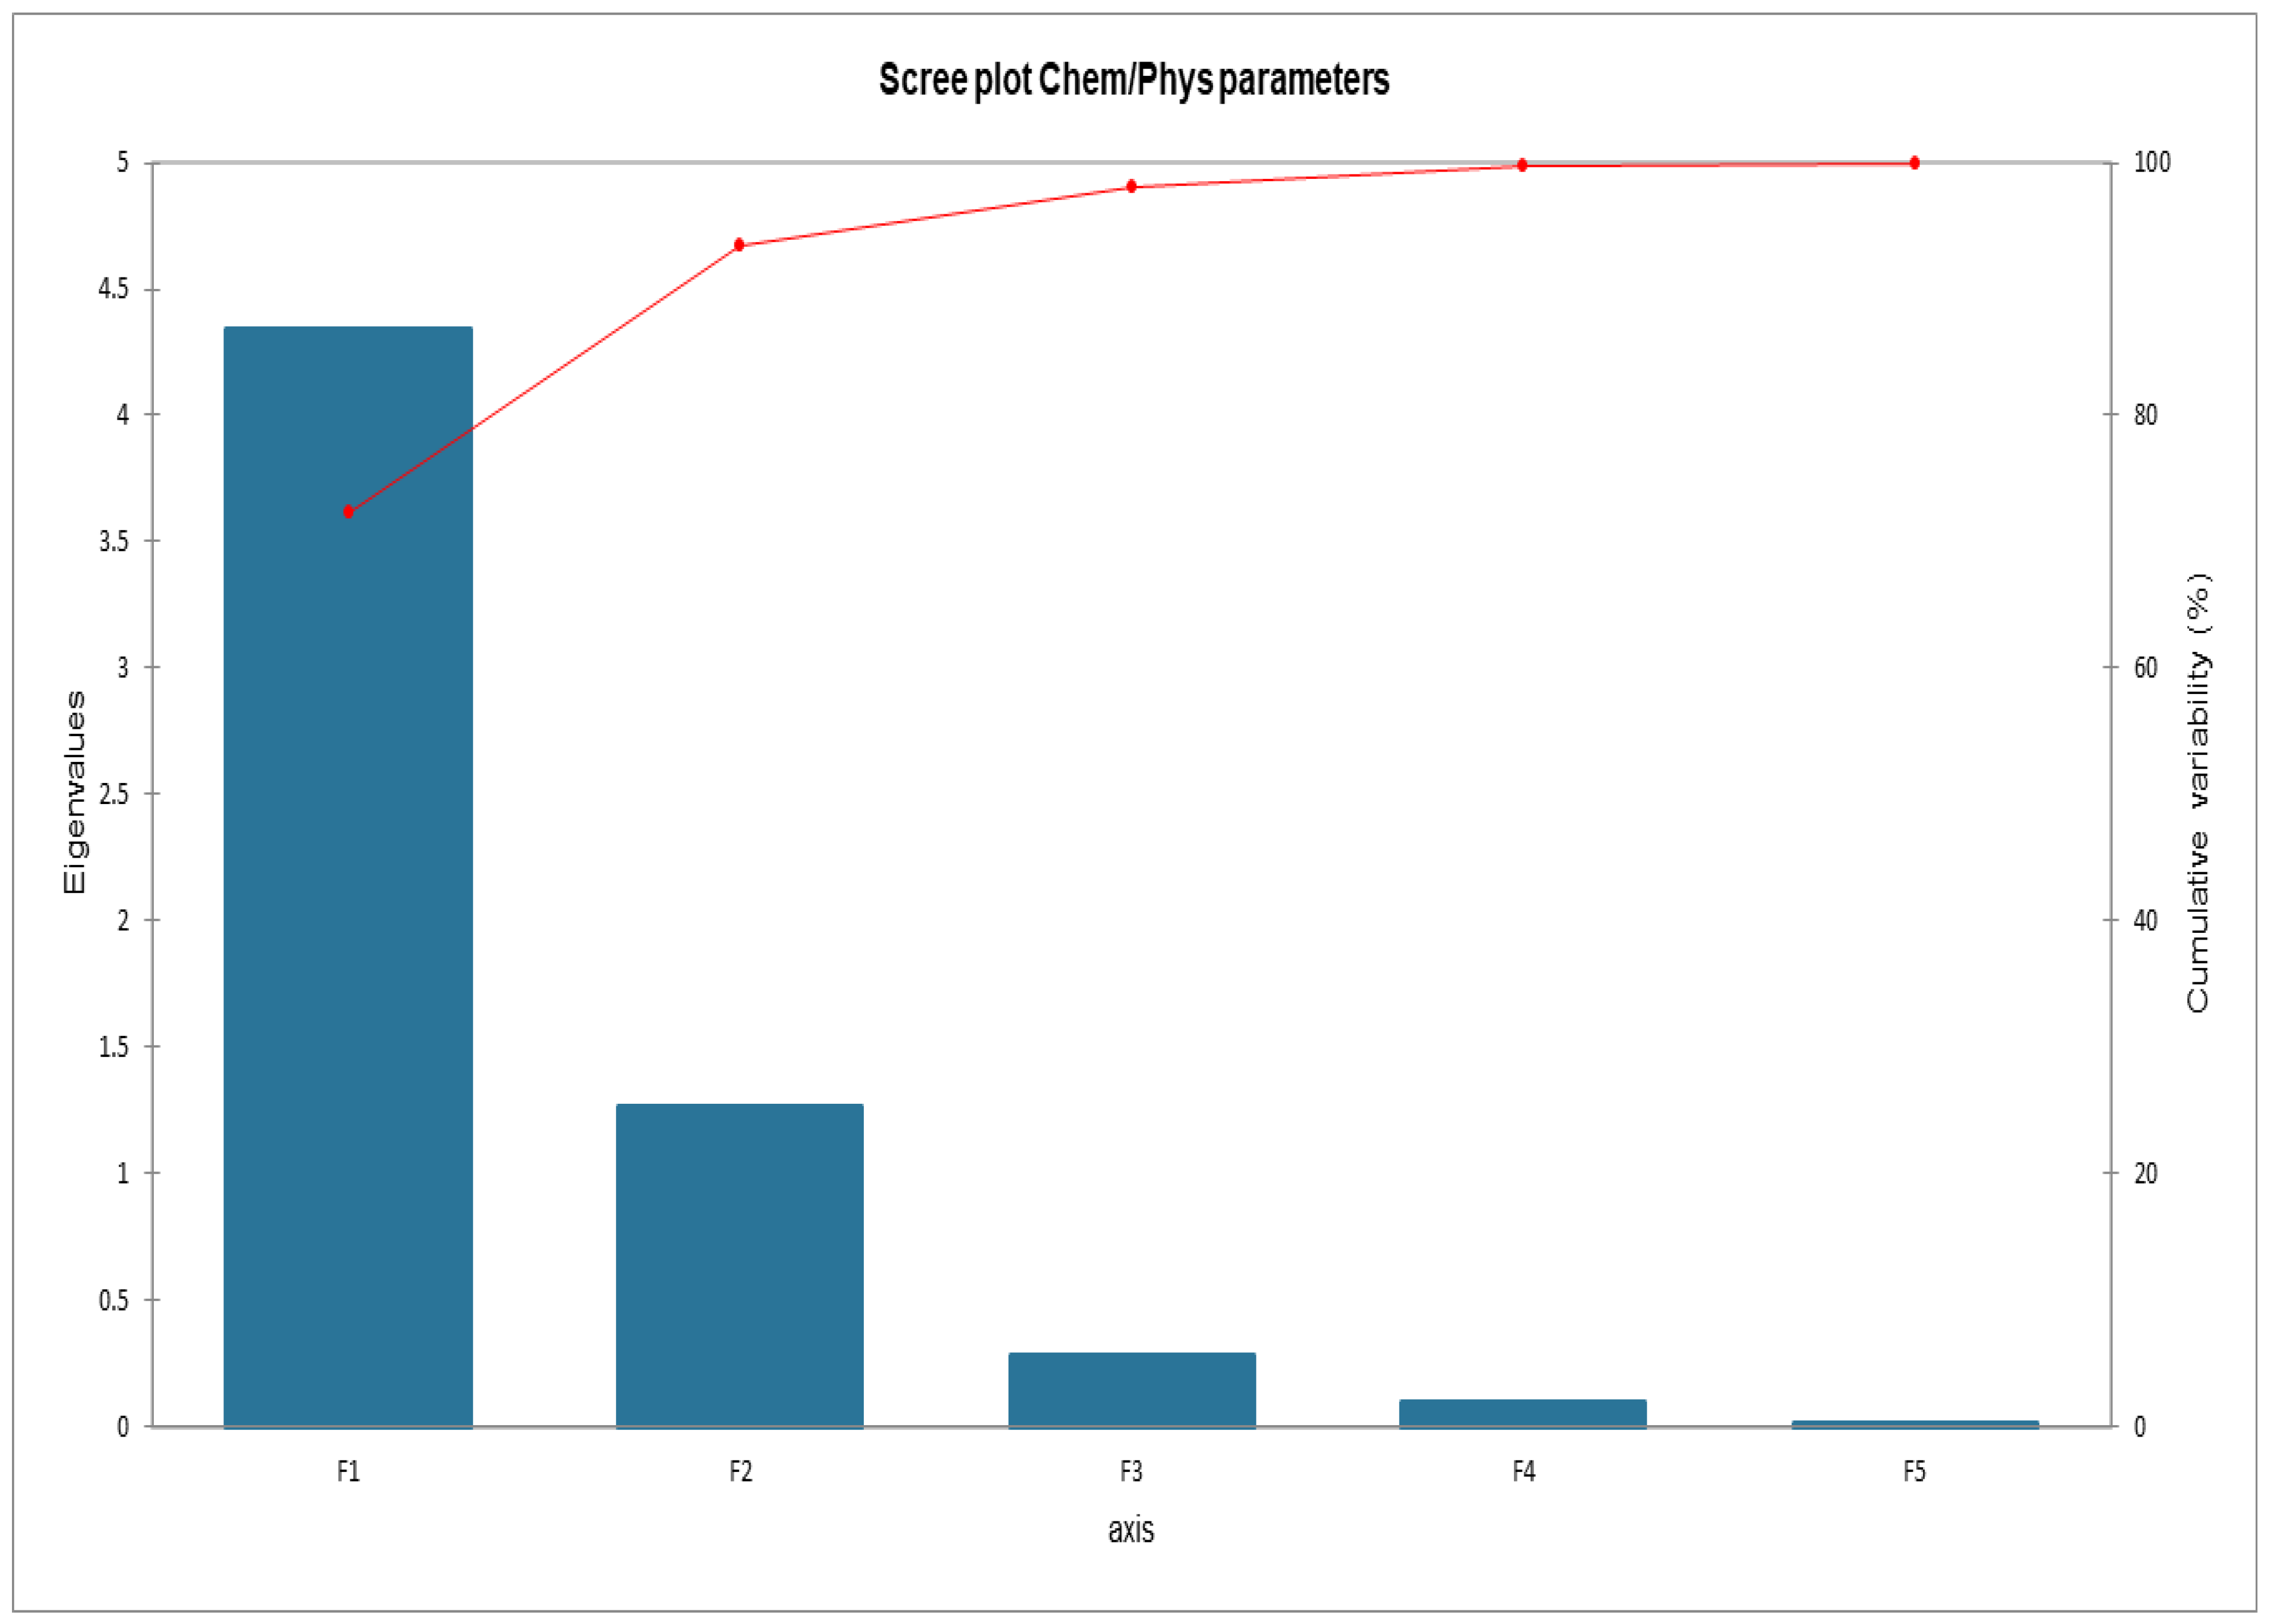
Figure 6 shows the cumulative variability between the parameters of the matrix. It was decided to proceed by analyzing F1 and F2 since the sum of the two factors expresses 93.40% of the total variability. Global data about loadings and scores are listed in Appendix A.

Figure 6.
Scree plot Cumulative variability.
As can be seen in Figure 7, from the data processed in PCA, a clear separation emerges between fresh product (LCF) in the upper left quadrant, the external barrel (FUO) in the upper right quadrant, and all the other products (N1, N2, G1, G2) at the end of fermentation (FL) in the lower right quadrant. We can also see an almost perfect overlap of samples N1 and N2.
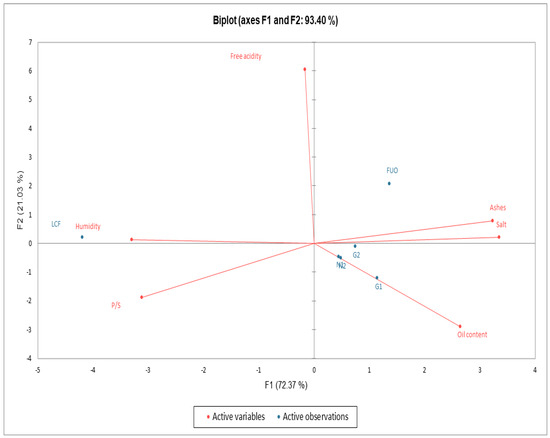
Figure 7.
Biplot PCA Chemical-Physical parameters.
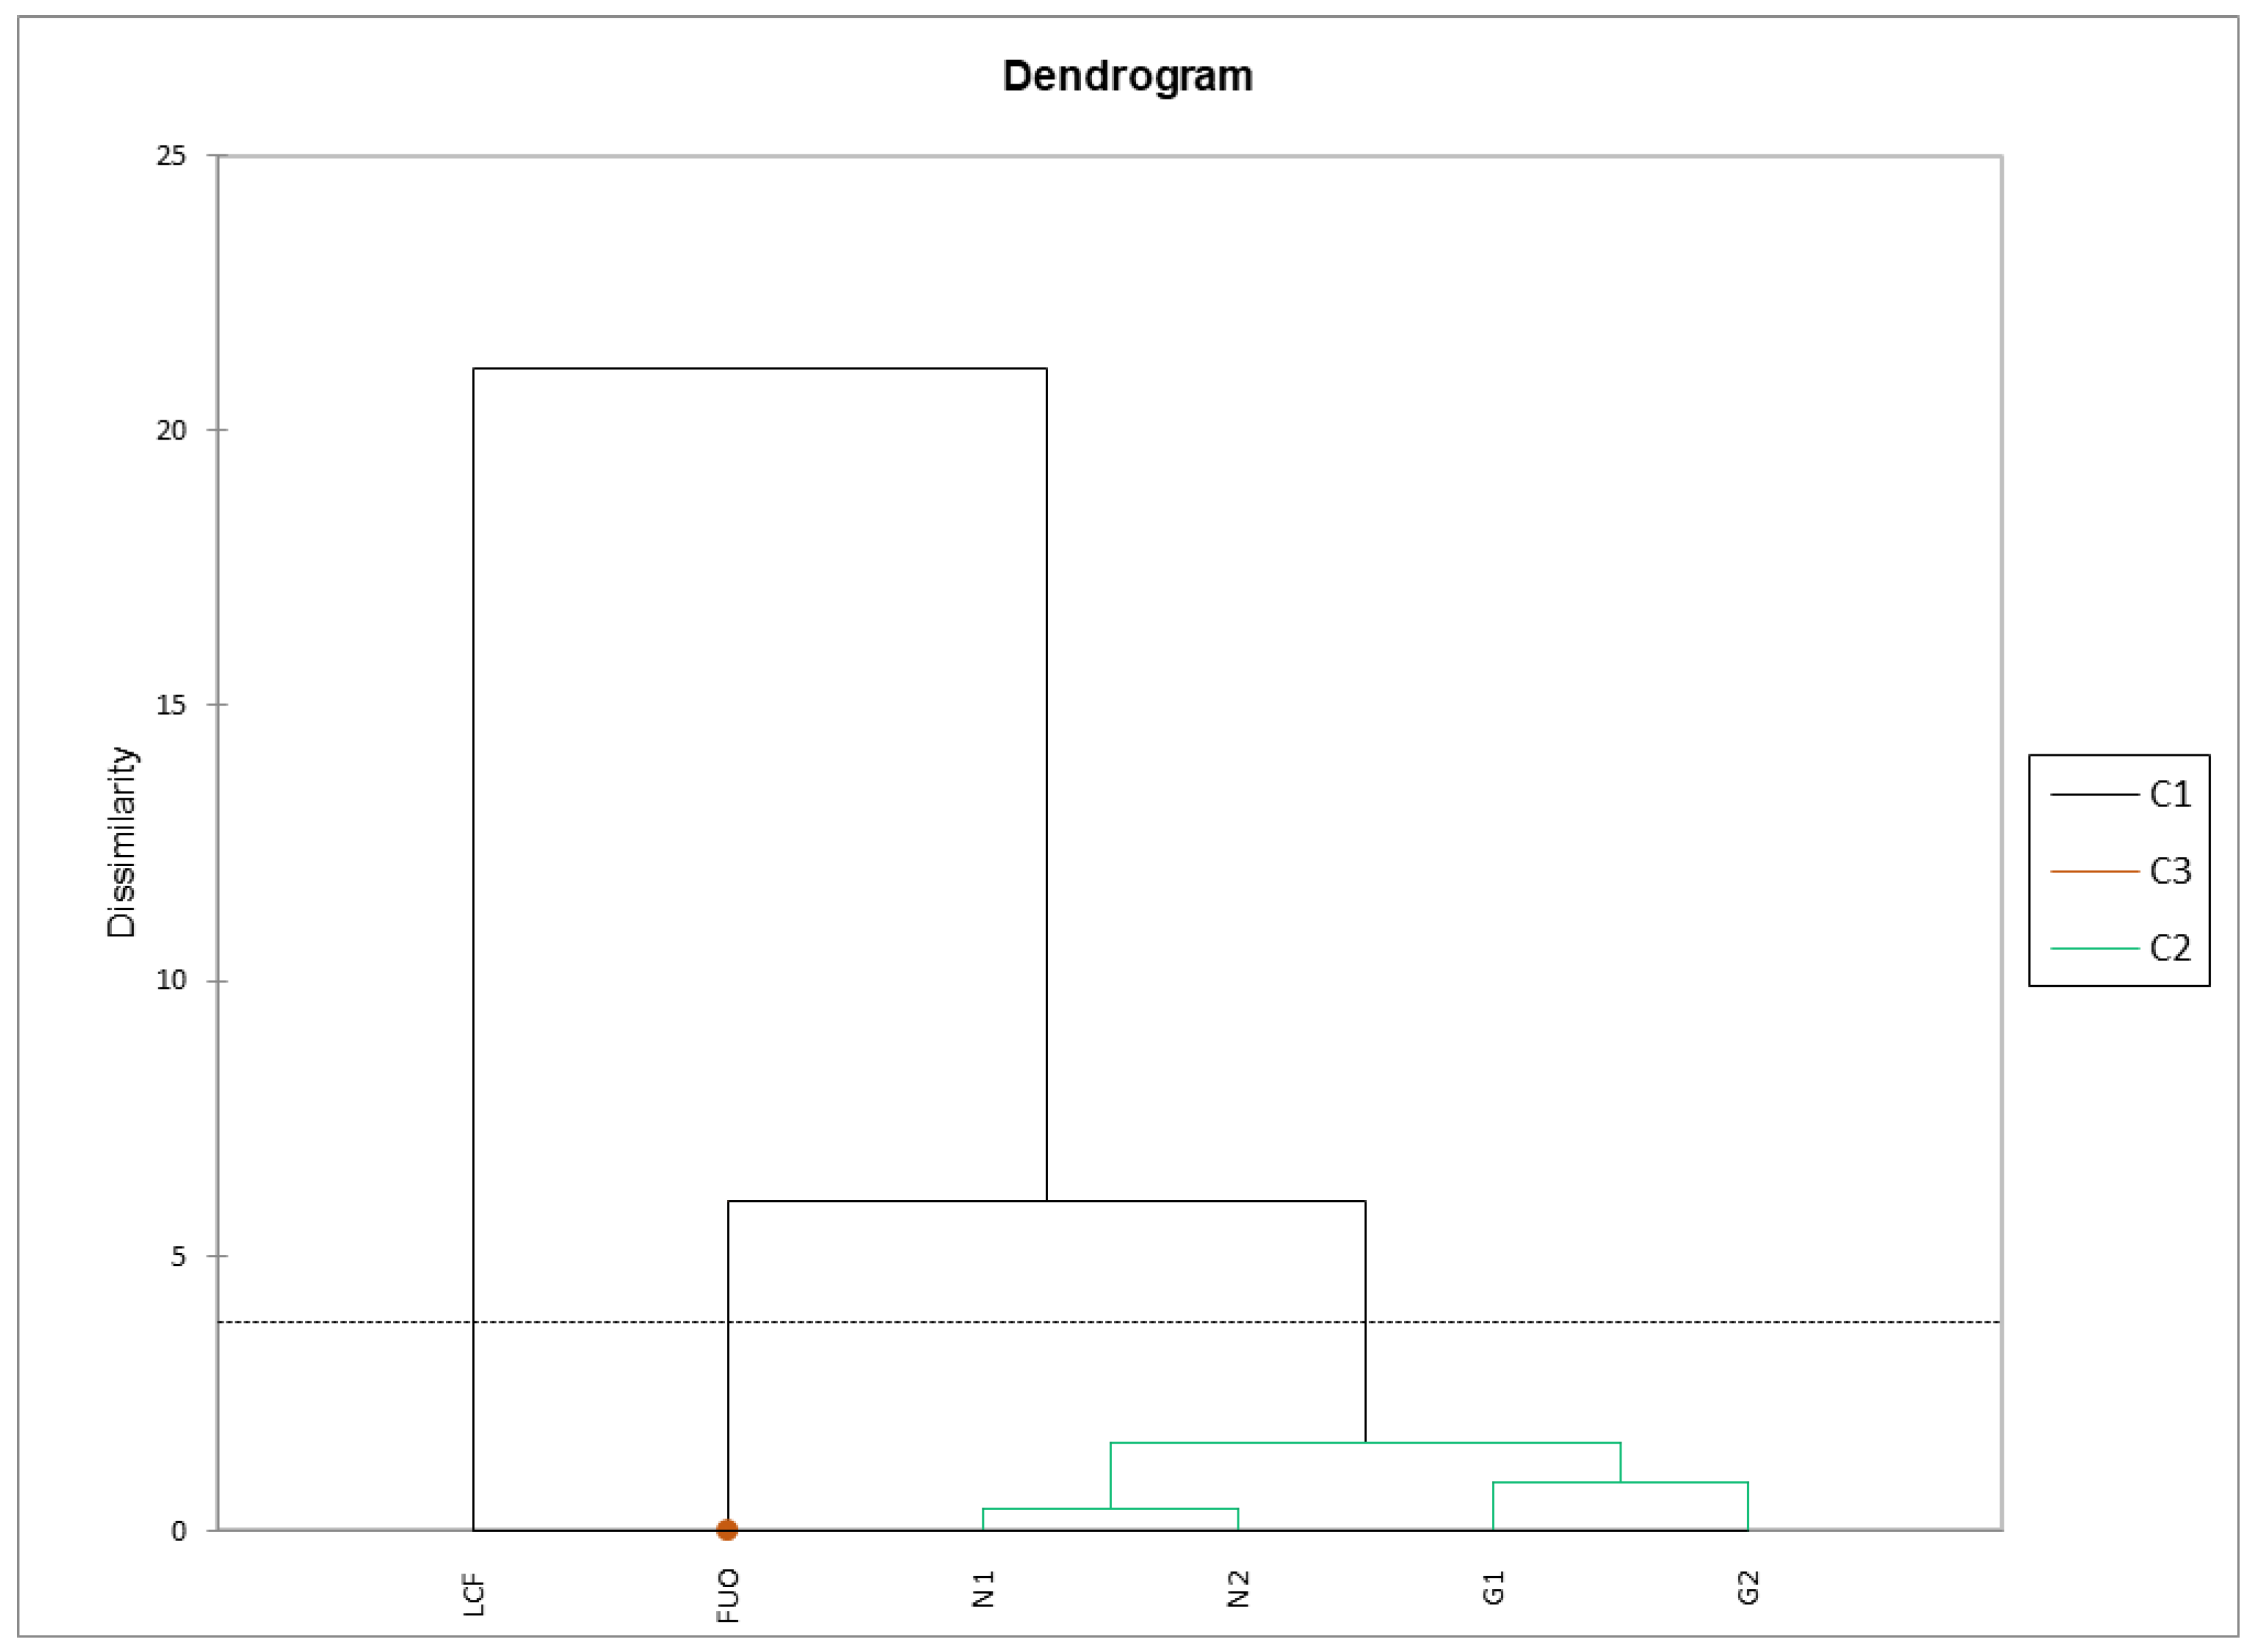
The same matrix was subjected to AHC using the criterion of dissimilarity with Euclidean distance. The Ward’s agglomeration method was chosen because it tends to create groups of equal size, with a cut according to the Hartigan Index (software default values: from 2 to 5). The results returned by the analysis are very interesting (Figure 8). We can observe three clusters: one for the fresh product (C1), one for the external barrel (C3, as a single spot inside the C1 cluster), and one for the barrels being tested (C2). Samples N1-N2 and G1-G2 are subclustered in pairs with a very low dissimilarity coefficient, flanked by the sample stored outside (FUO), and, with a higher dissimilarity coefficient, with the fresh LCF sample on the left.
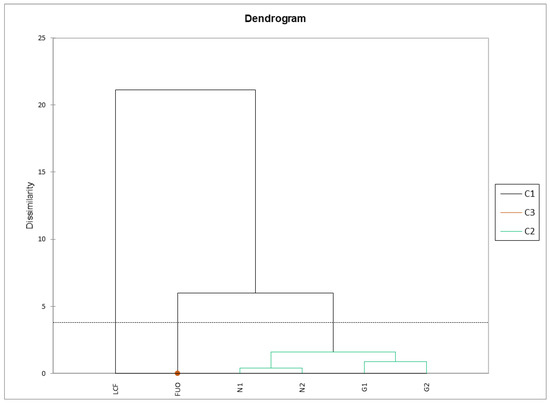
Figure 8.
AHC physicochemical parameters. Cluster 3 is represented by a single spot of LCF sample.
3.2. Microbiological Analysis
From a microbiological point of view, the analyses of total LAB, yeasts, enterobacteria, and molds were taken into consideration.
The presence of enterobacteria was never detected in all the samples taken. In regard to the mold content, these were detected in negligible quantities (0–1 CFU) and only in a few samples; therefore, they are not reported.
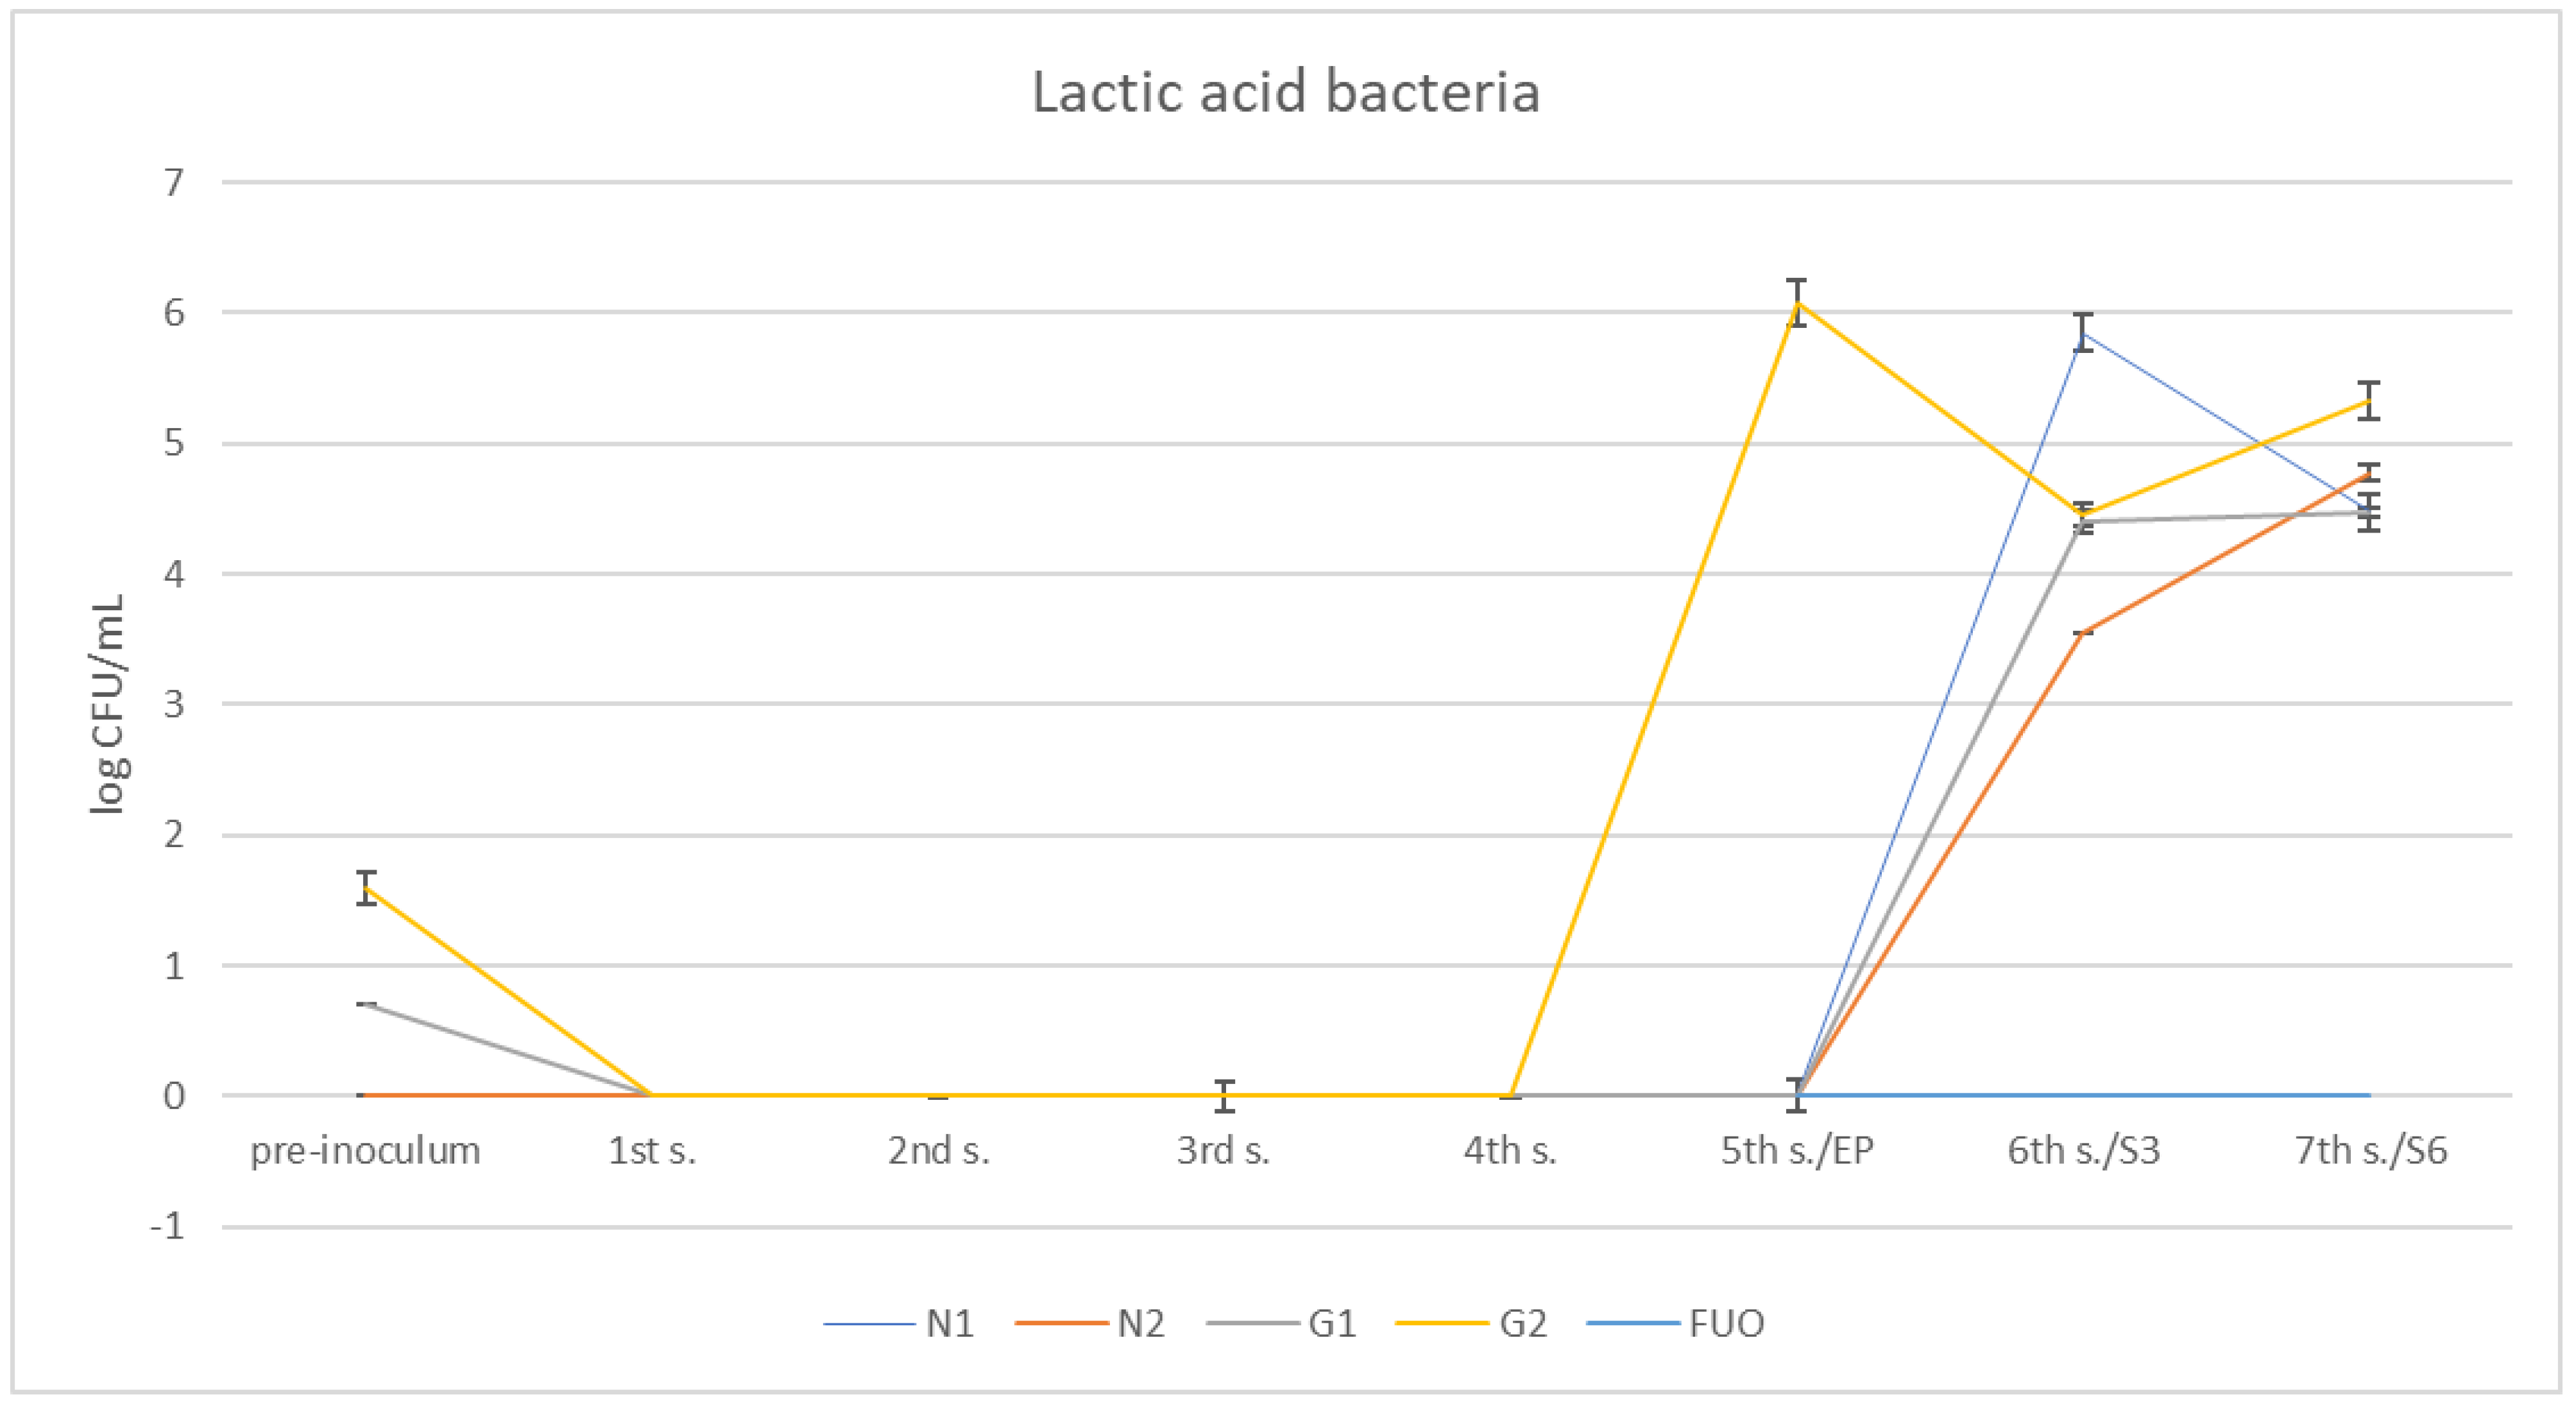
Examining the trend of lactic acid bacteria (Figure 9), we can see that they are absent at the first sampling, despite having also been purposely inoculated with our starter in G1 and G2 barrels. Subsequently, they grew only in the G2 barrel, beginning at the fifth sampling and, subsequently, in the other barrels (including N1 and N2) during the shelf-life period. In the FUO barrel, they were always absent.
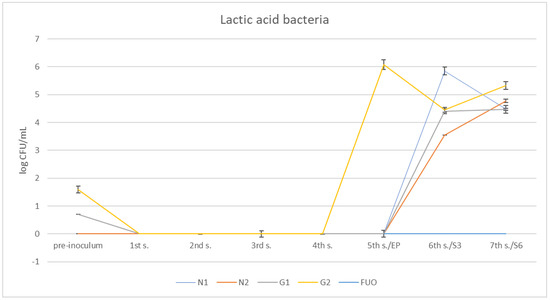
Figure 9.
Trend of the presence of lactic acid bacteria in the stems under investigation.
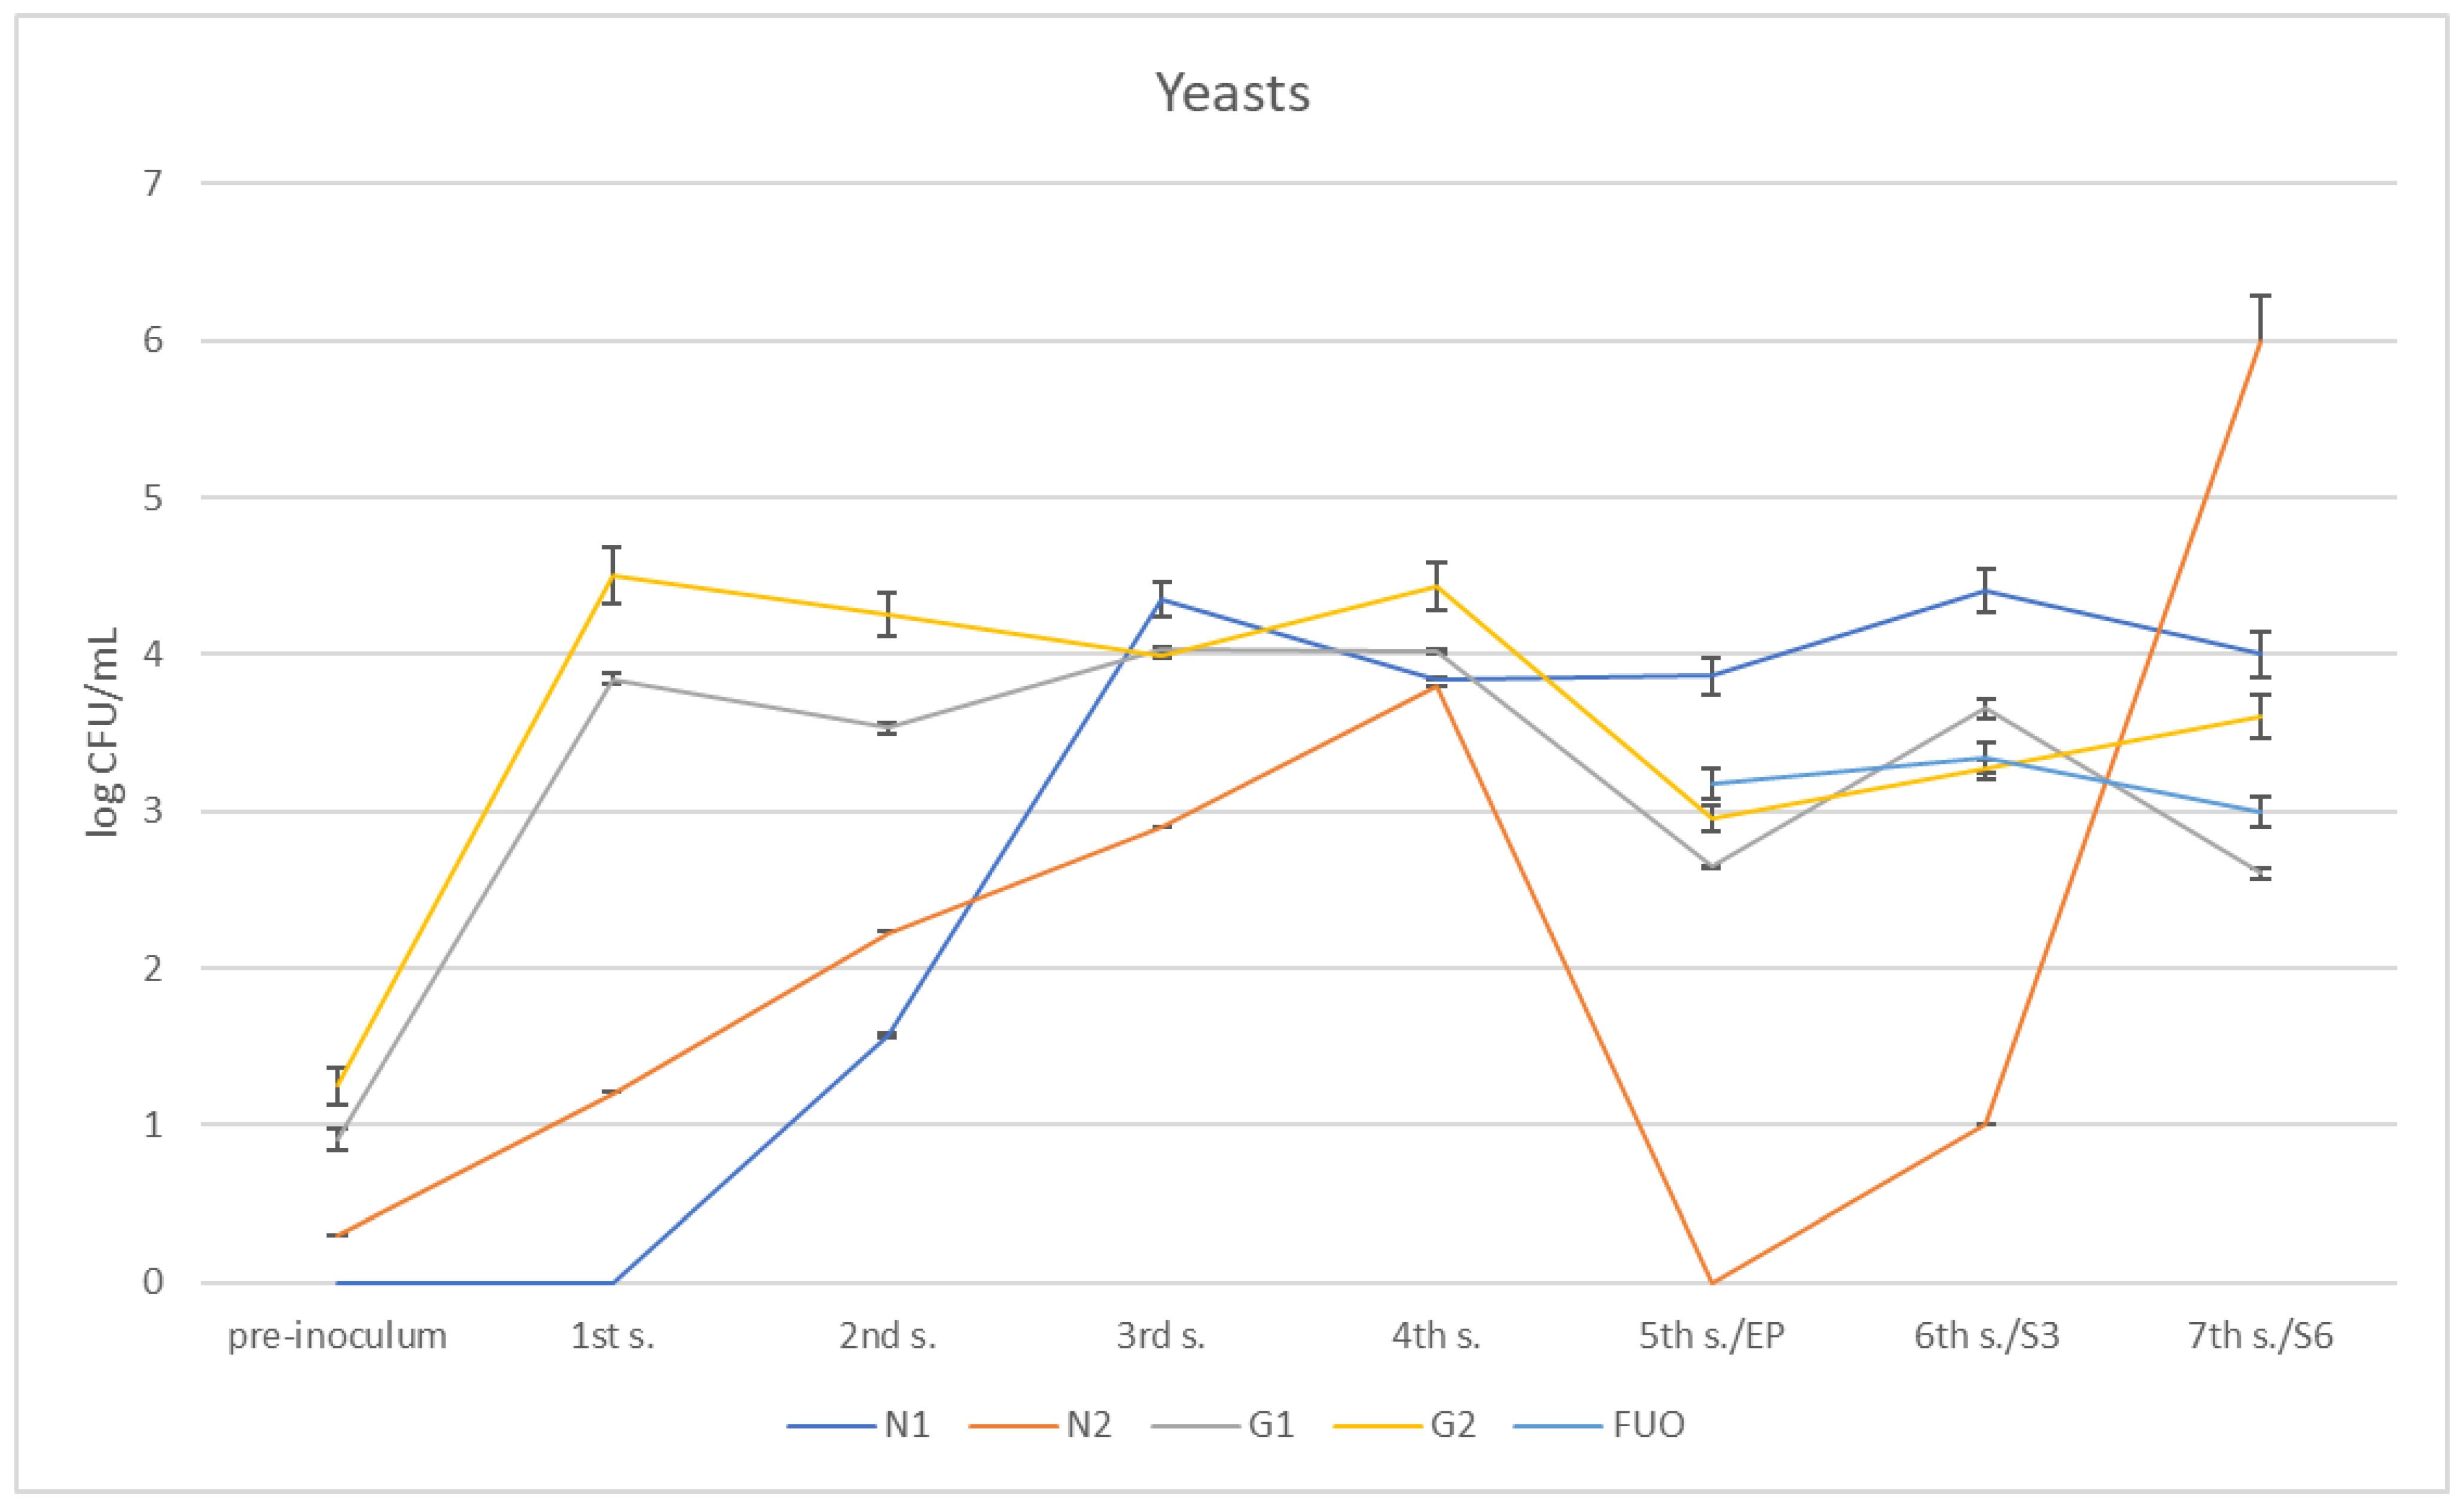
Regarding the presence of yeasts (Figure 10 and Figure 11), the different barrels followed different trends. At the first sampling, N1 did not yet show traces of yeasts having developed, while these appear at the second sampling and increase until they reach a climax at the third sampling; they subsequently remained stable at further samplings. In N2, which already had some yeasts introduced in the pre-inoculation phase, there is a constant increase in content until it reaches a peak on the fourth sampling. They subsequently disappeared on the fifth sampling, only to reappear in modest quantities on the sixth sampling (three months shelf life). Regarding the G1 and G2 barrels, there was a modest presence of yeasts pre-inoculum, and then, after inoculation, the growth increased as expected and showed a certain steadiness up to the fourth sampling,; both then dropped to 2.65 ± 0.014 log CFU/mL for G1 and 2.95 ± 0.15 log CFU/mL for G2. Subsequently, they grew once again at the remaining samplings, reaching values similar to those found for the FUO barrel.
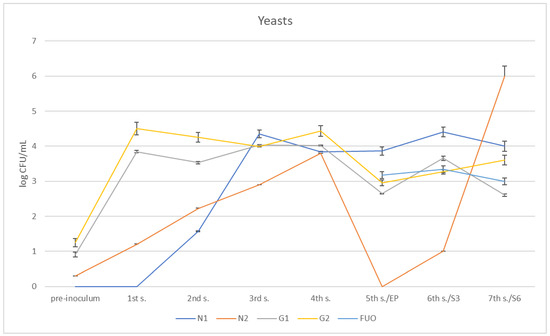
Figure 10.
Trend of the presence of yeasts in the barrels under investigation.
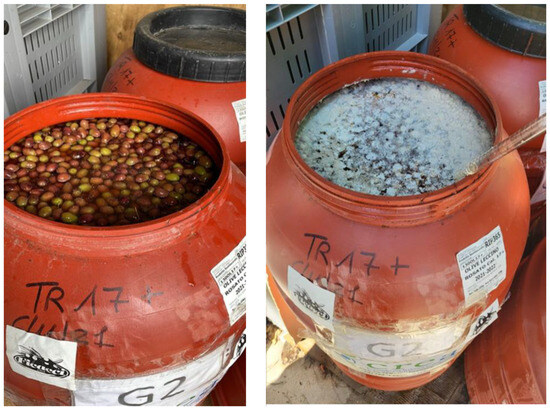
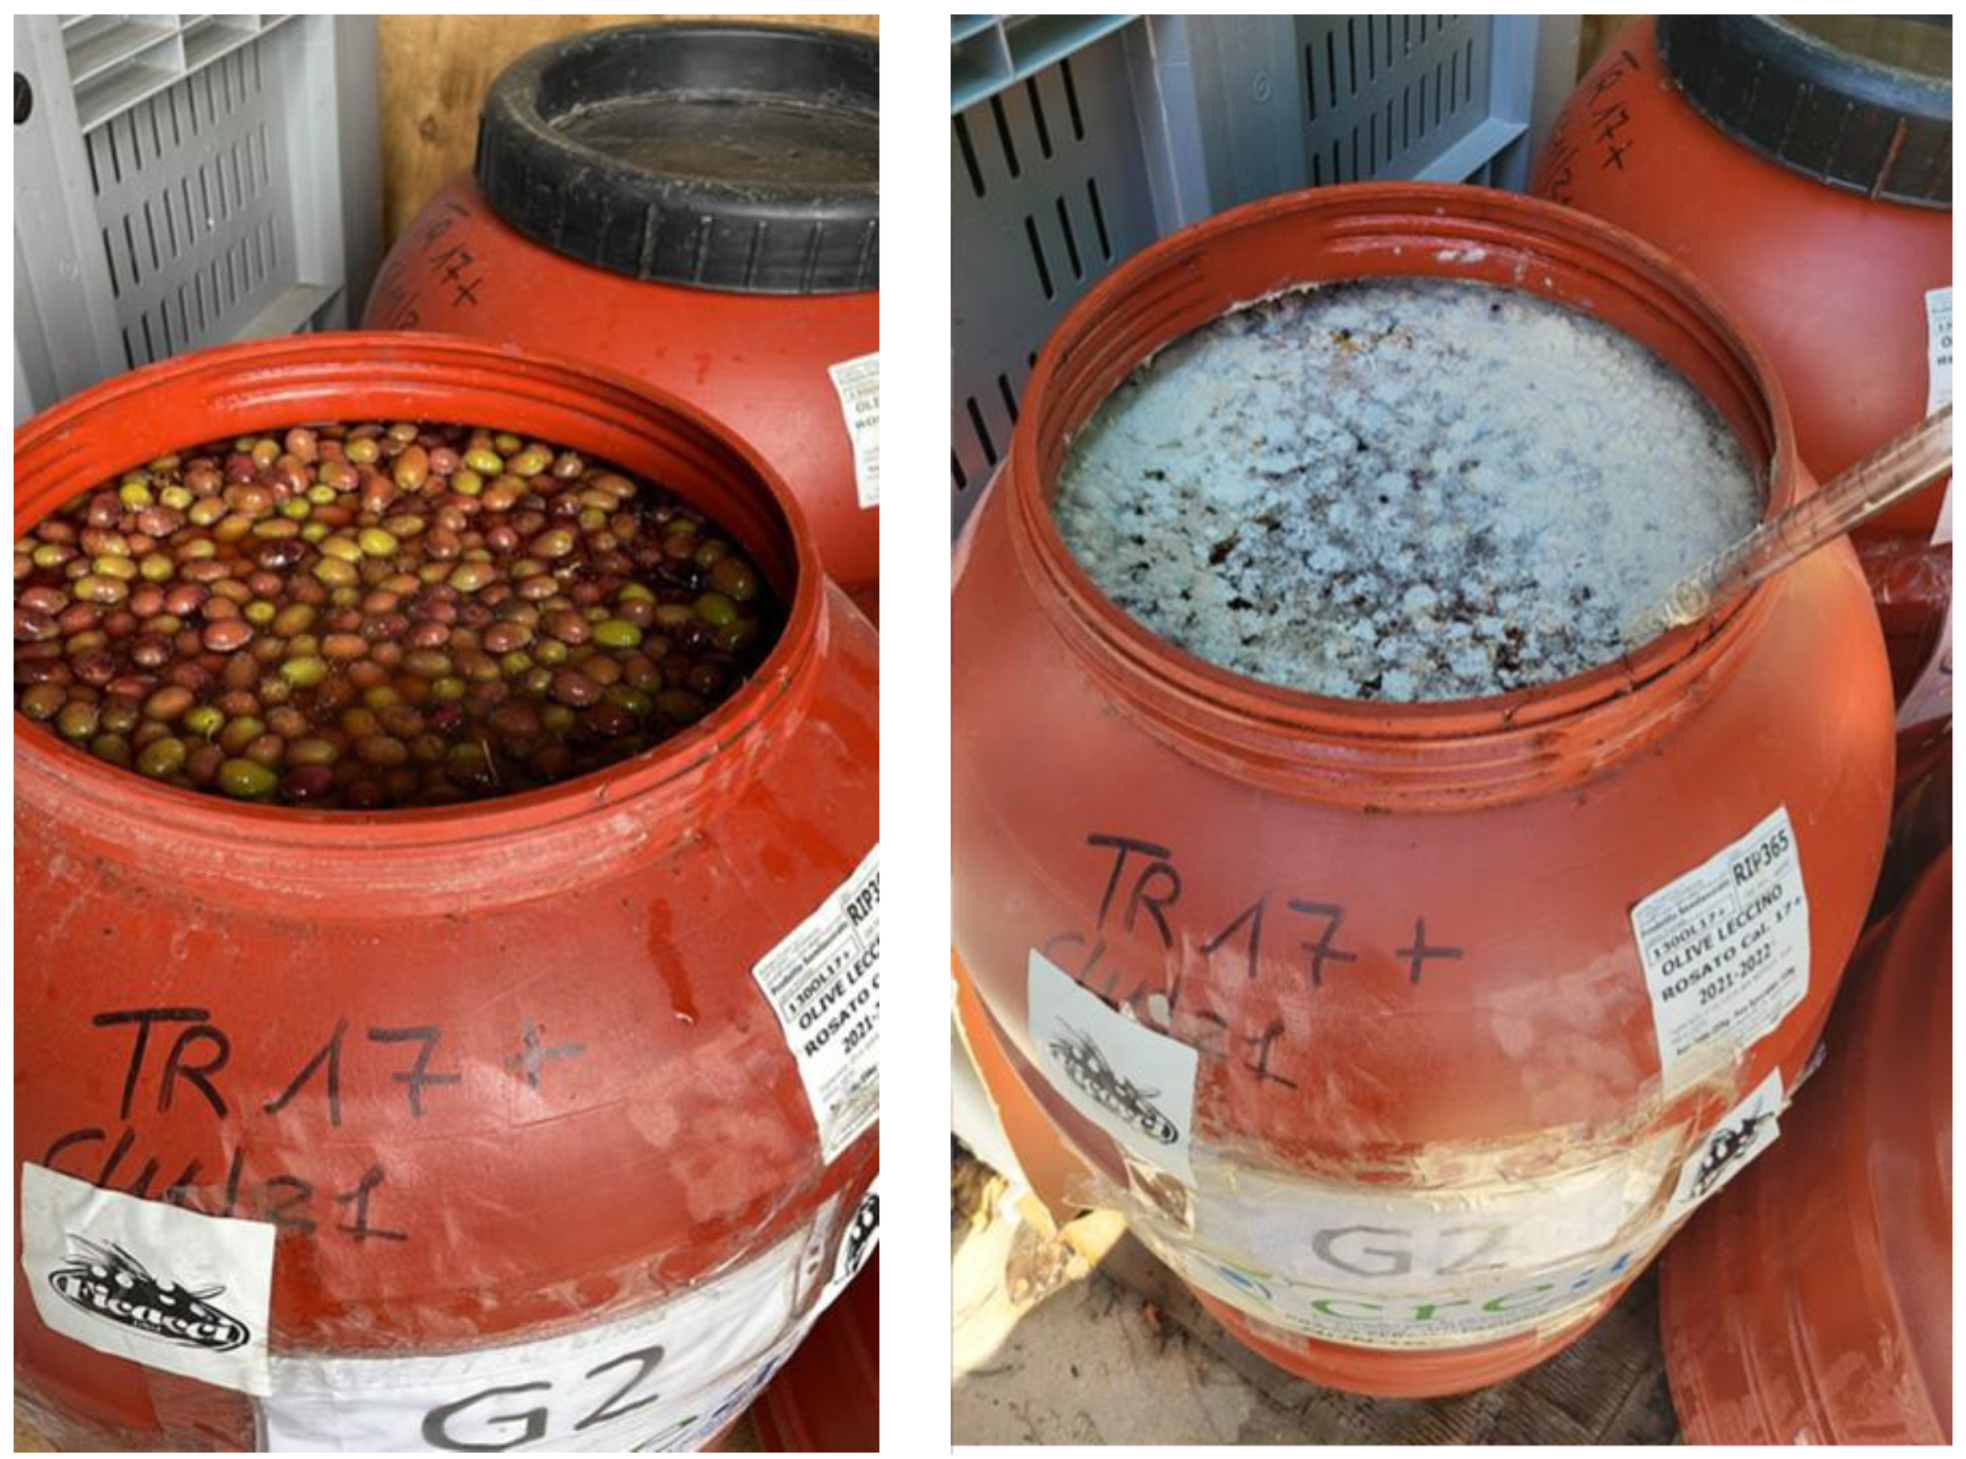
Figure 11.
Barrel G2. On the left: the pre-inoculum stage; on the right: condition at the 1st sampling.
3.3. Phenolic Content
At each sampling, aliquots of olives and brines were reserved for analysis of the relative phenolic content. The data were subsequently processed by PCA and AHC, considering the values obtained on the pulp of the fresh product, on the pulp of the products of the five barrels at the end of fermentation (fifth sampling), and on the pulps of the products after three months (sixth sampling) and six months (seventh sampling) shelf-life.
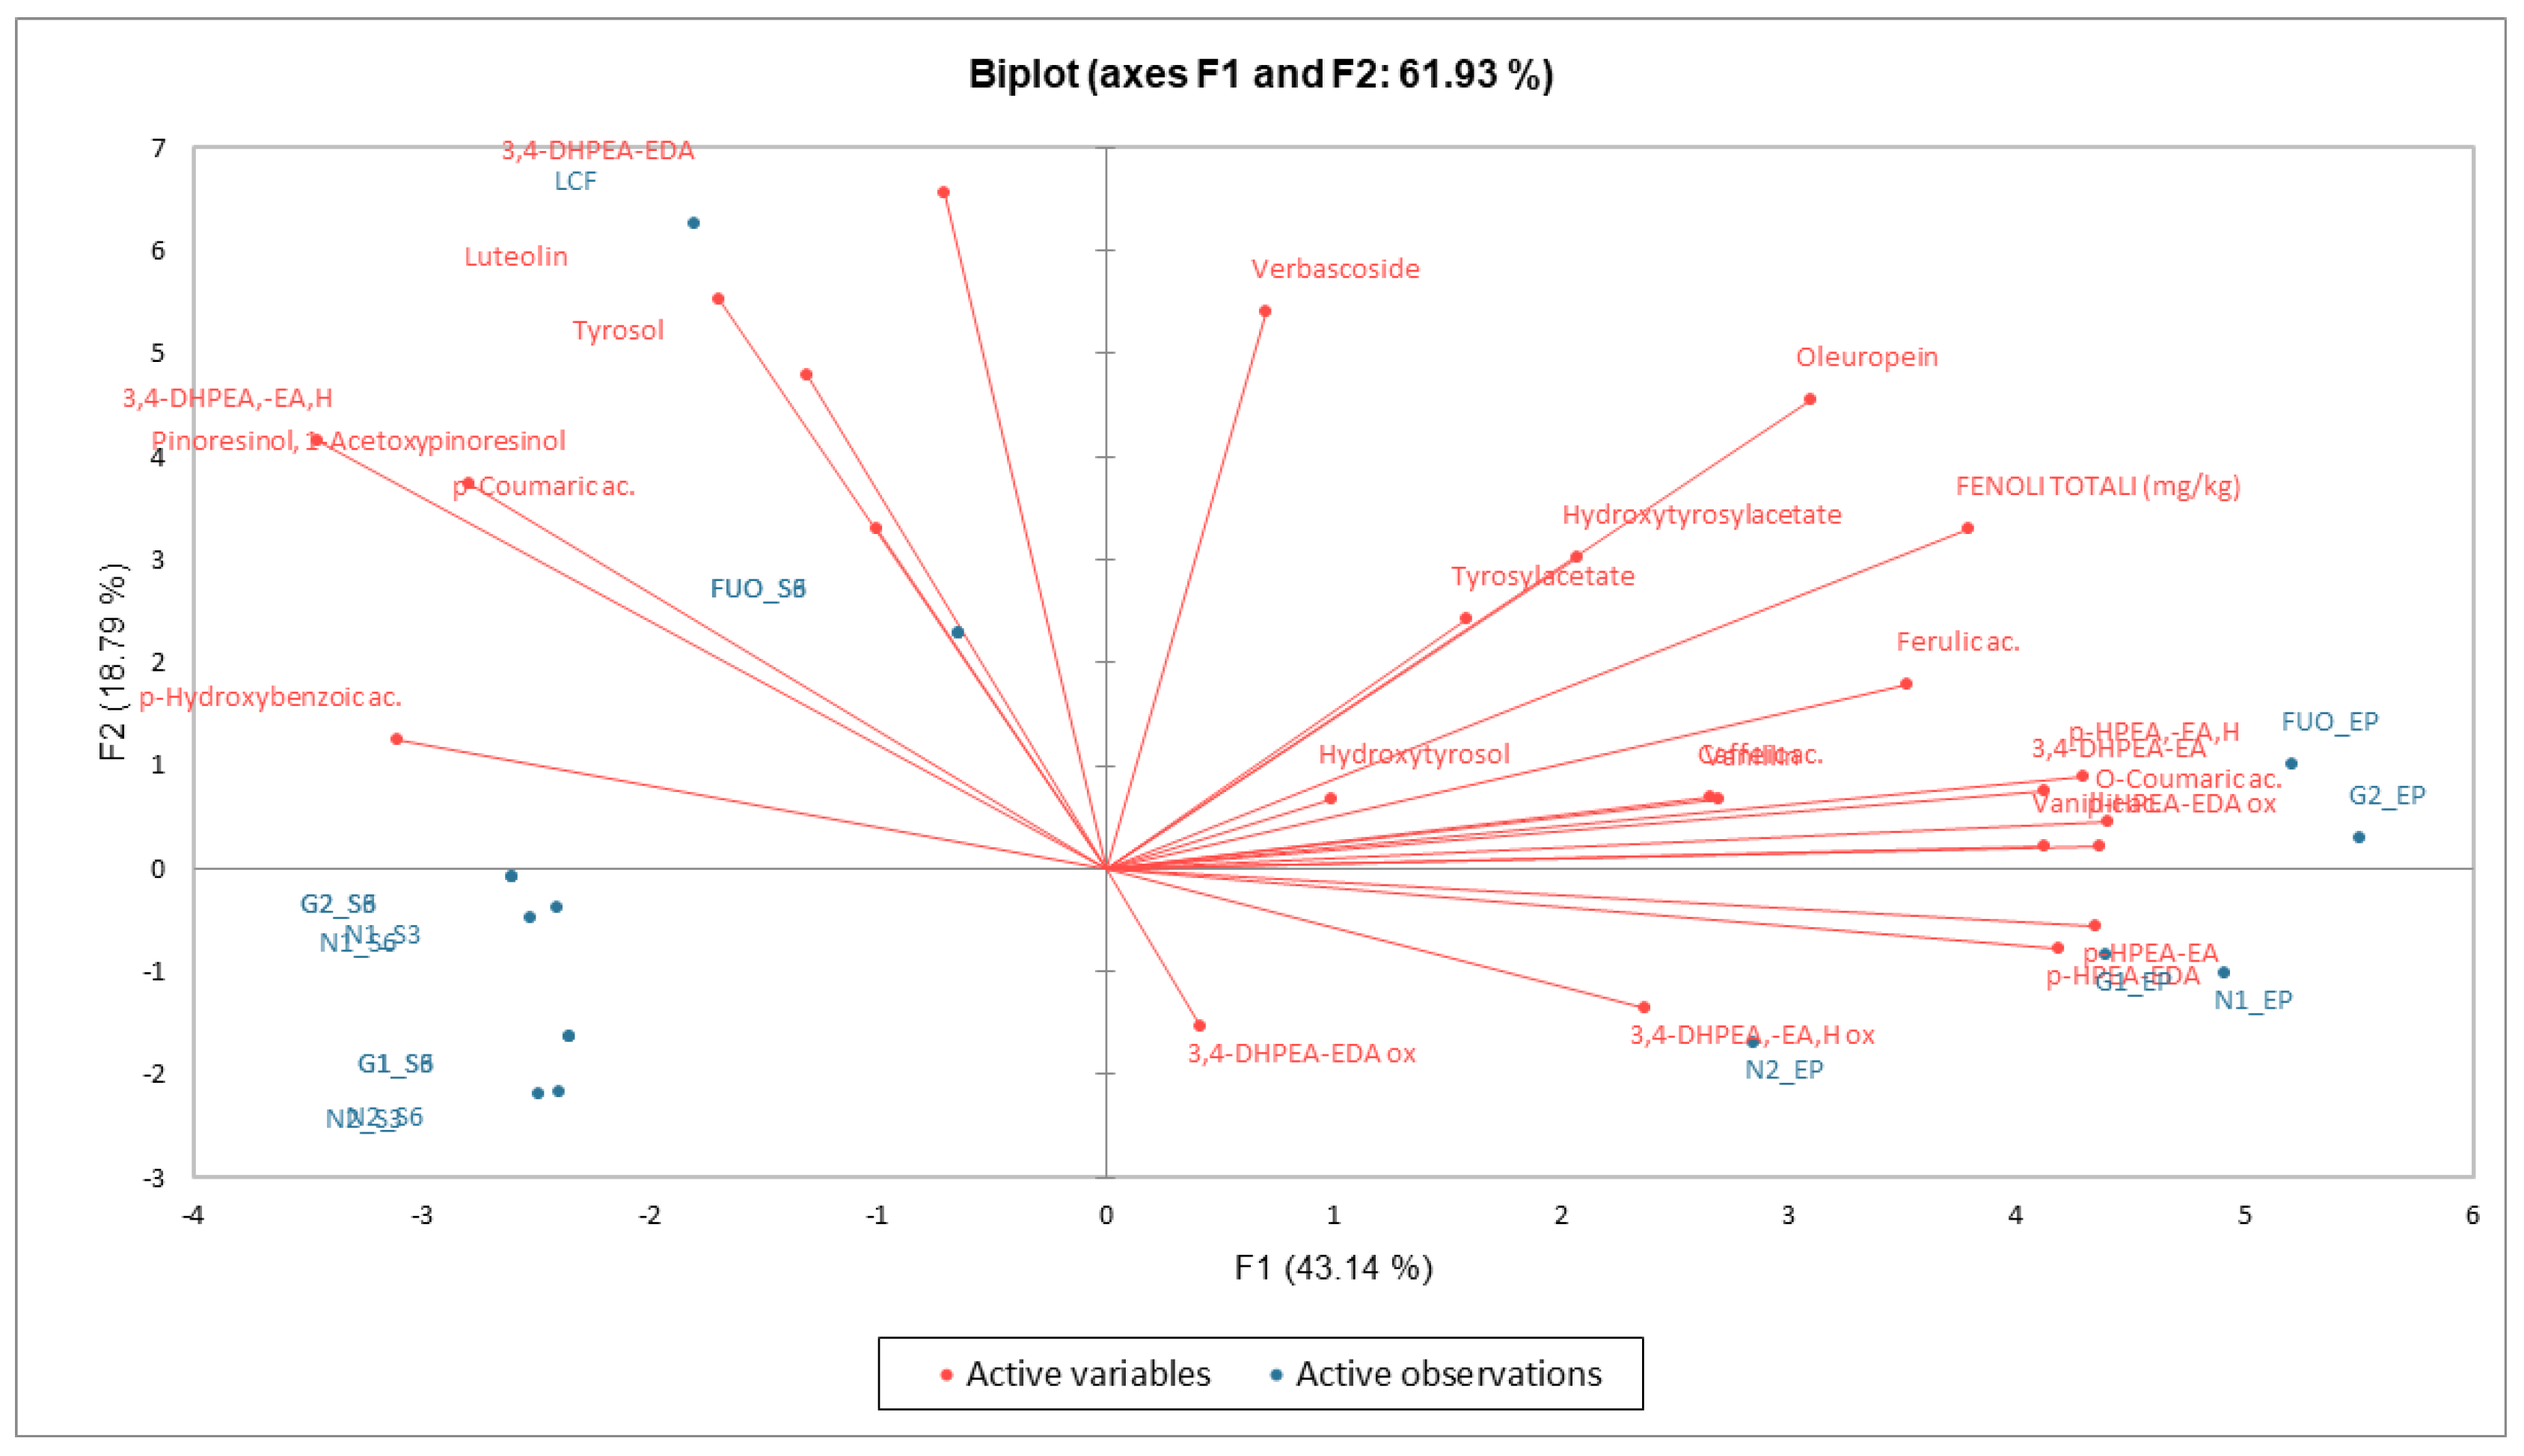
The Scree plot in Figure 12 shows the trend of cumulative variability. The F1 and F2 variables were selected; they express 61.93% of the variability on the two axes (43.14% F1, 18.79% F2).
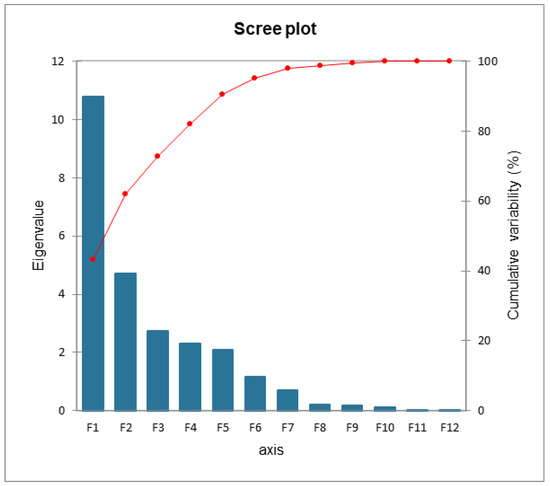
Figure 12.
Cumulative variability scree plot.
From the data examined, a clear separation emerges in PCA (Figure 13) between the fresh product (LCF) and all the other processed products. The products at the end of fermentation (FL) are instead concentrated in the two right-hand quadrants, while the products analyzed at the end of the two shelf-life periods are concentrated in the lower left-hand quadrant. Exceptions are the results obtained in the two shelf-life periods of the FUO barrel, which are positioned superimposed in the upper left quadrant but are still distinct from the fresh LCF sample.
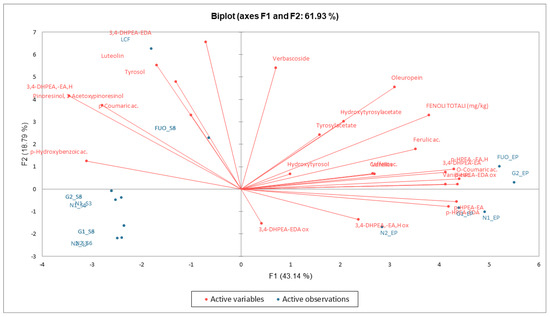
Figure 13.
PCA phenolic substances. Biplot with observations and variables.
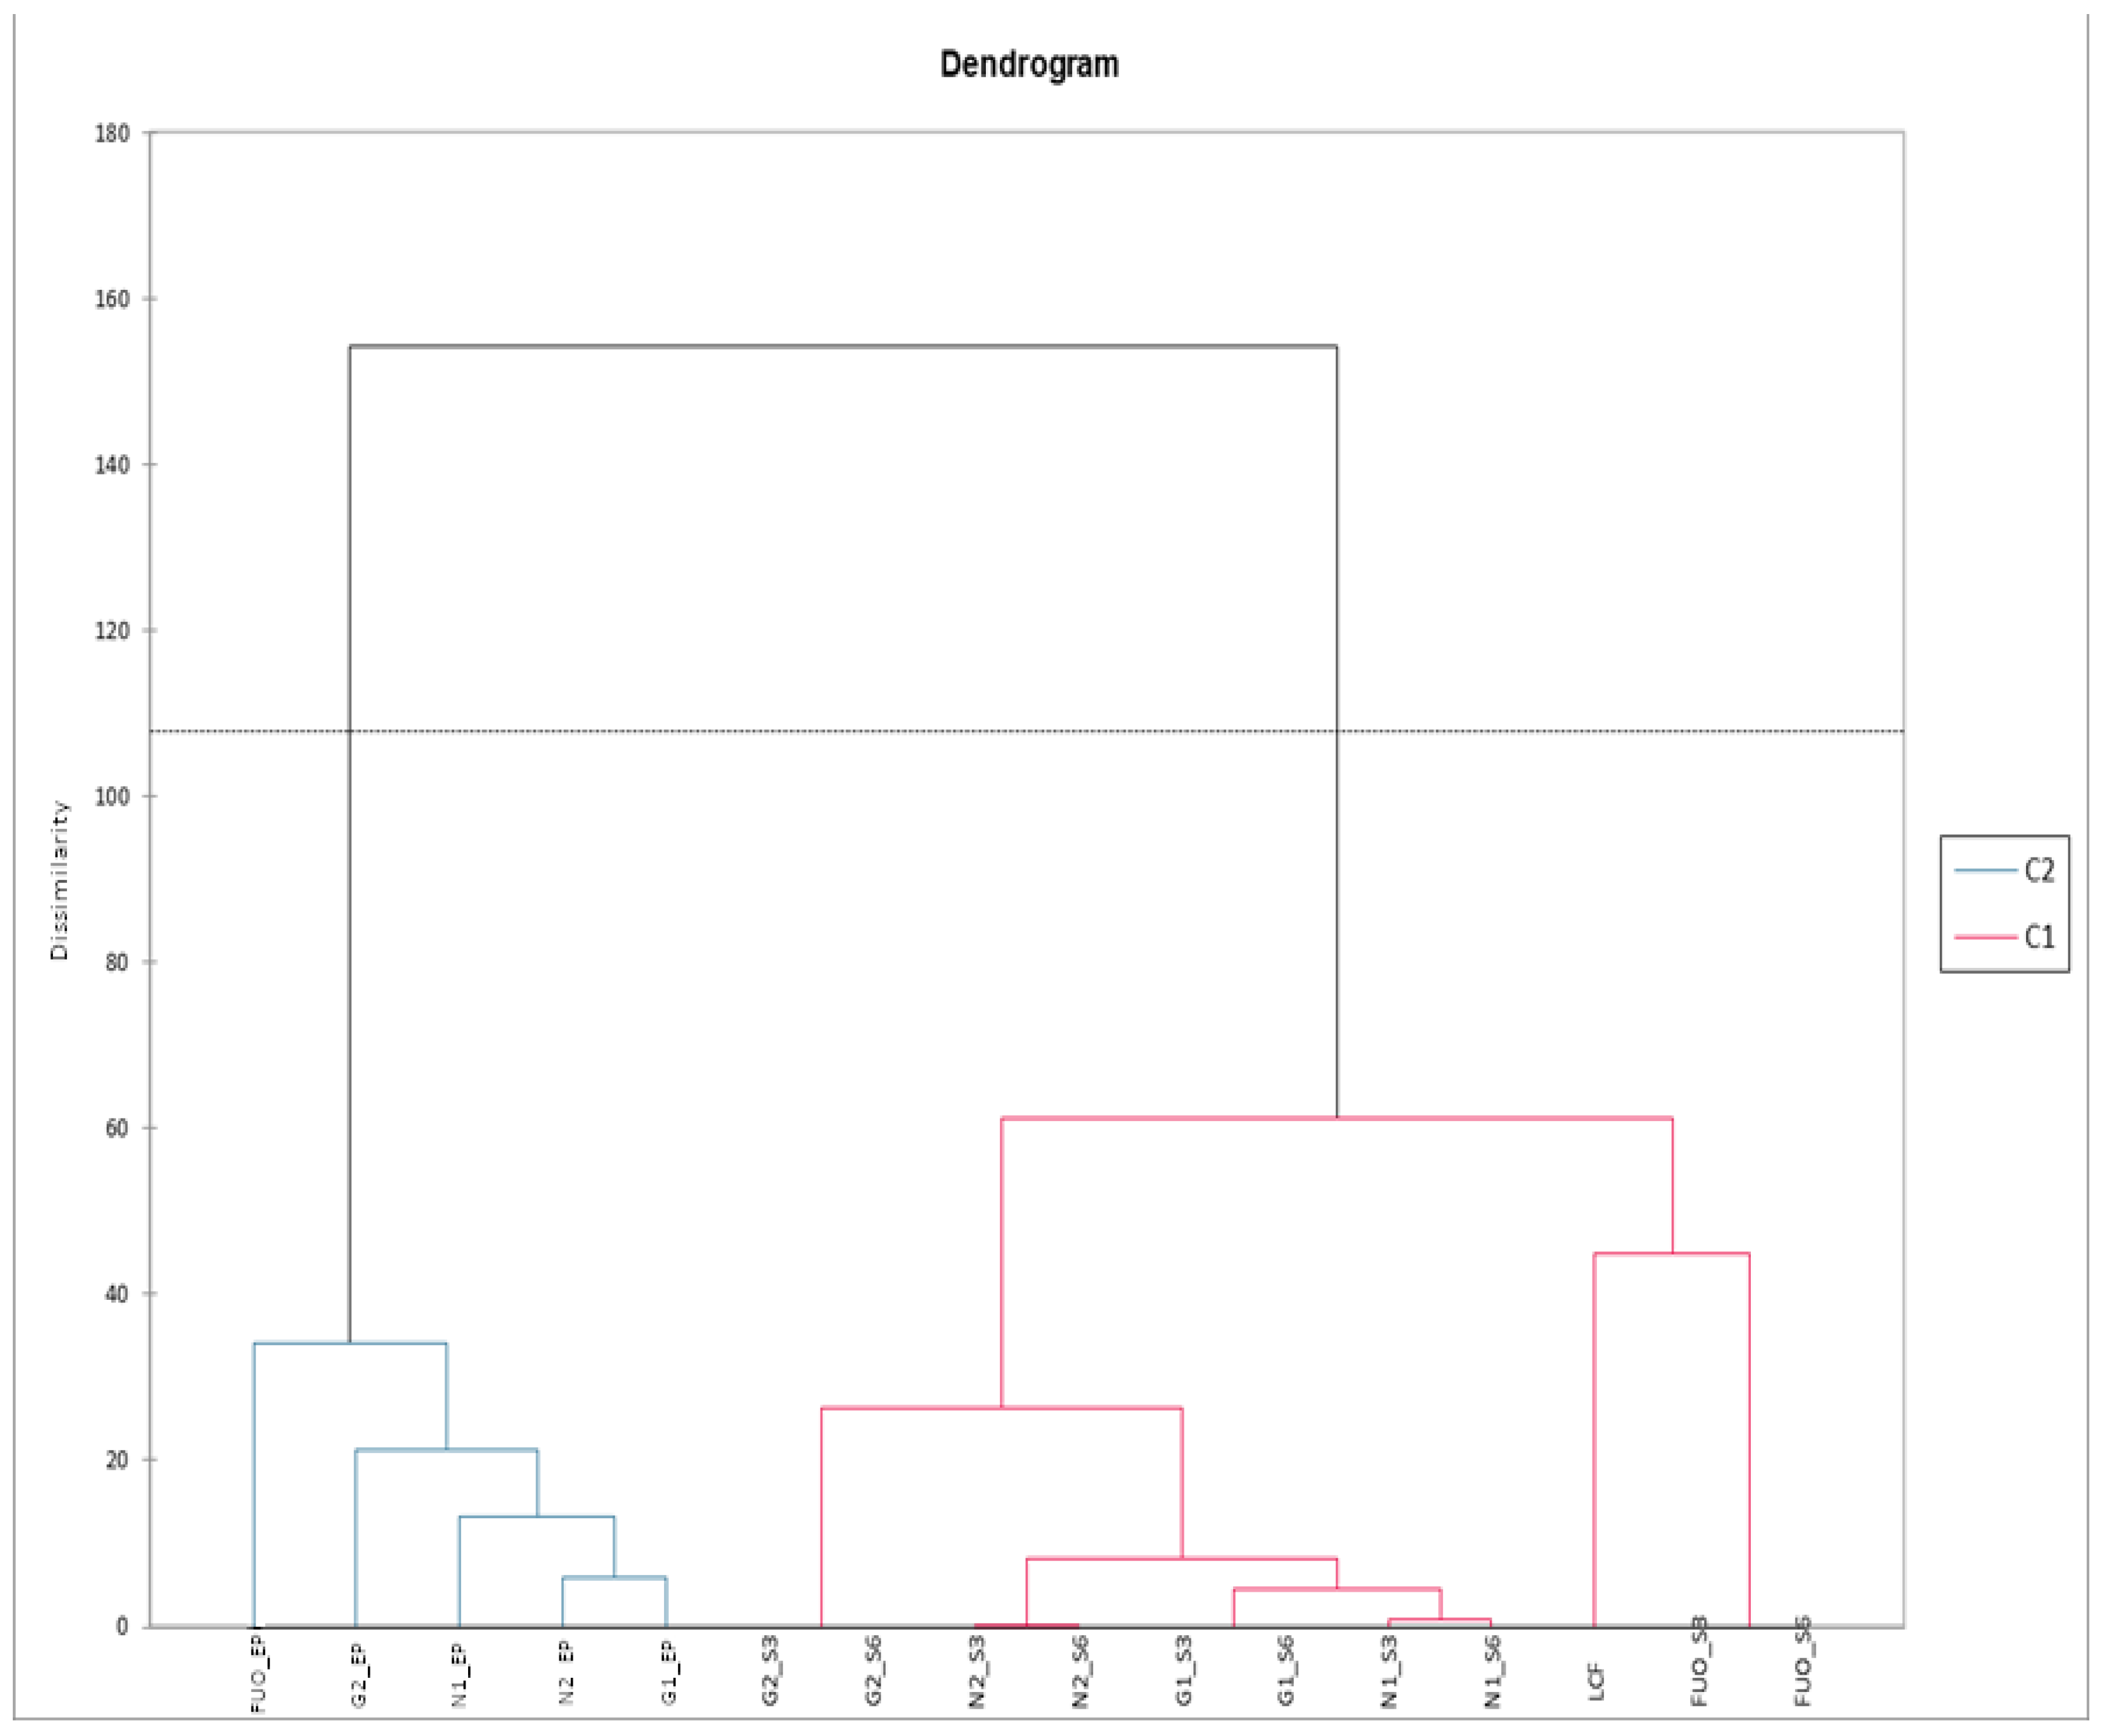
The same data matrix, subjected to AHC, allowed us to efficiently cluster the different groups, as shown in Figure 14. We can therefore observe how all the analyzed products, at the end of fermentation (FL), are correctly clustered in C2, with the FUO sample individually subclustered on the left and with a certain dissimilarity value with respect to the other samples. The products analyzed after the two shelf-life periods (indicated with the suffix S3 and S6) are all clustered in C1. Within this group, we find that the dissimilarity between FUO_S3 and FUO_S6 is non-existent, but these two samples are subclustered together with the fresh LCF product. Samples N1, N2, G1, and G2 also show no dissimilarity between them in the two different samplings, but sample G2 subclusterizes with a certain dissimilarity from the other samples of the group.
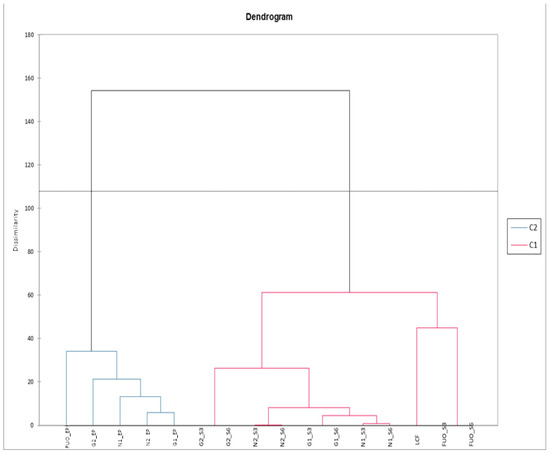
Figure 14.
AHC phenolic substances pulp.
Textural, sensory, and color analyses regarding the product, both at the end of processing and after a shelf-life period of three to six months, have not been discussed here and will be published in a subsequent paper.
4. Discussion and Conclusions
Data obtained from salt content determination in barrels N1, N2, G1, and G2 can be explained because aliquots of fresh brine were added to the samples; these had values close to 12%, while the different salt content in FUO barrel can be explained by the fact that the barrel was kept sealed during the whole process until the fifth sampling (June). The increase in salinity at the next sampling (September) was almost certainly due to excessive evaporation of the brine. This is reasonably explained because the barrel was in the middle of the storage yard and so it was fully exposed to the summer sun and its thermal effects. In fact, after the first sampling and subsequent topping up with fresh brine, the brine level detected on reopening had dramatically decreased.
Free total acidity is to be considered acceptable, even if we could not discriminate between the different acidic species, as Panagou et al. suggested in their work [21]. The pH values revealed data that are, according to Lombardi et al., about right for natural fermented olives [22], especially regarding the FUO barrel.
Regarding Pearsons’ correlations, we can observe, as it is logical to expect, the inverse correlation between ash and humidity, given that the increase of the second on the fresh weight will result in a decrease of the ash after calcination. Another logical and confirmed inverse correlation is the one between salt and humidity, since as the salt in the brine increases, there will be an increasing osmotic pressure that will lead to the dehydration of the olives. The correlation between ash and the pulp/seed ratio (P/S), although evident and significant, is not clearly interpreted since, for the determination of the ash, we start from equal weighted quantities of pitted pulp. The same happens for the correlation between salt and P/S ratio; presumably, it can be considered that, in olives with a higher P/S ratio, the salt permeates the tissues more slowly and therefore olives that have a lower P/S ratio have a lower pulp thickness, so they offer less resistance to the passage of salt into the tissues. Likewise, the strong positive correlation between the salt and ash content is also clear, since this is found together with the ash, and the same is for the correlation between the P/S ratio and humidity. On the contrary, the oil content of the various samples, while showing some interesting correlations, does not report values of p < 0.05. In our opinion, the strongly positive correlation between this parameter and the salt content (which could be an index of cell lysis) is of interest; it is logical to observe a negative correlation between the oil content and humidity, given the analytical method used.
This investigation, conducted in industrial operating conditions, has revealed some aspects of the production of naturally fermented table olives that did not emerge from the consulted bibliography.
First, the set of analytical determinations clearly displayed that although the starting situation was the same, the finished products showed slight differences. This may be due to several factors, including population of resident microflora (qualitative and quantitative), competition between starter microorganisms, presence of any bacteriophages [23], climatic conditions, barrel location, and operating conditions.
Second, the evolution of the phenolic profile clearly differentiates the fresh product from the finished product, but further characterizes the different finished products, demonstrating that there are different types of debittering depending on the type of microflora that prevails in the brine. Furthermore, we noticed that the permanence of the product in the barrels for a period of three to six months after the end of the fermentation (withdrawals S3 and S6) clearly influences the phenolic profile, as can be seen from the AHC analysis in Figure 14.
We also noticed how the external barrel, labeled FUO, being left exposed to climatic variations, showed a different behavior from the other tested barrels, regarding both the chemical-physical parameters and the phenolic content. The same findings applied to the microbiological profile, with lactic bacteria completely absent from the FUO barrel in all three samplings (EP, S3, and S6).
The results obtained from stems inoculated with selected starter cultures have instead highlighted some important critical issues in the industrial production of table olives: the choice of inoculum is fundamental. In our experiment, the Saccharomyces cerevisiae yeast proved to be more effective and immediately prevailed over the Lactiplantibacillus plantarum bacterium. This is determined, partially, according to the results obtained by Chityri et al. [24] in Kalamata controlled fermentation, where LAB disappeared at the sixth day of fermentation despite the addition of a yeast. We added L. plantarum strain instead of L. pentosus, as suggested by Paba et al. [25], because of the positive results obtained in previous lab-scale experiments [11]
It is difficult to say exactly what this prevalence is due to, but we can make some hypotheses: (a) the use of brines with a high concentration of NaCl (10–12%) that, if on the one hand guarantees a certain degree of protection to the olives regarding the onset of pathogenic microorganisms, on the other hand could likely inhibit the growth of microorganisms useful for fermentation; (b) the presence of bacteriophages that use the bacterial cell to replicate, causing the death of the host by cell lysis; (c) sudden changes in temperature; (d) microbial competition for micro and macronutrients.
The experimentation therefore demonstrated that each barrel is an ecosystem of its own, and that it is possible to “guide” table olives’ fermentation, but it requires a lot of experience and a constant monitoring of many parameters. This involves the immediate application of any corrective measures in the event of altered parameters. We believe that our work can represent an interesting starting point for future research involving table olives’ natural fermentation outside the laboratories, and is a valid aid for companies and production/quality control technicians.
Author Contributions
Conceptualization, B.L., N.S. and M.B.; methodology, B.L., G.D.L., N.S. and M.B.; validation, N.S., B.L., M.B., G.D.L., G.V., S.D.M. and M.C.; formal analysis, N.S., M.B., G.D.L., G.V., S.D.M. and M.C.; resources, B.L.; data curation, B.L., N.S., G.D.L. and M.B.; writing—original draft preparation, B.L., N.S., G.D.L. and M.B; writing—review and editing, B.L., N.S., G.D.L. and M.B.; funding acquisition, B.L. All authors have read and agreed to the published version of the manuscript.
Funding
This research was supported by project DEAOLIVA (D.M. 93882/2017 and D.M. 35902/2019), funded by the Italian Ministry of Agriculture, Food Sovereignty and Forests (MASAF).
Conflicts of Interest
The authors declare no conflict of interest.
Appendix A
Table A1.
PCA DATA: chemical/physical parameters.
Table A1.
PCA DATA: chemical/physical parameters.
| Eigenvectors: | |||||
| F1 | F2 | F3 | F4 | F5 | |
| Free acidity | −0.023 | 0.863 | 0.440 | 0.191 | 0.087 |
| Humidity | −0.470 | 0.018 | −0.017 | −0.615 | 0.403 |
| Ashes | 0.460 | 0.112 | −0.431 | 0.180 | 0.746 |
| Salt | 0.477 | 0.029 | −0.159 | −0.034 | −0.417 |
| P/S | −0.444 | −0.267 | 0.033 | 0.741 | 0.135 |
| Oil content | 0.377 | −0.413 | 0.771 | −0.061 | 0.285 |
| Factor loadings: | |||||
| F1 | F2 | F3 | F4 | F5 | |
| Free acidity | −0.048 | 0.969 | 0.233 | 0.060 | 0.011 |
| Humidity | −0.979 | 0.020 | −0.009 | −0.195 | 0.050 |
| Ashes | 0.959 | 0.125 | −0.228 | 0.057 | 0.092 |
| Salt | 0.995 | 0.033 | −0.084 | −0.011 | −0.052 |
| P/S | −0.924 | −0.300 | 0.017 | 0.234 | 0.017 |
| Oil content | 0.785 | −0.463 | 0.408 | −0.019 | 0.035 |
| Correlations between variables and factors: | |||||
| F1 | F2 | F3 | F4 | F5 | |
| Free acidity | −0.048 | 0.969 | 0.233 | 0.060 | 0.011 |
| Humidity | −0.979 | 0.020 | −0.009 | −0.195 | 0.050 |
| Ashes | 0.959 | 0.125 | −0.228 | 0.057 | 0.092 |
| Salt | 0.995 | 0.033 | −0.084 | −0.011 | −0.052 |
| P/S | −0.924 | −0.300 | 0.017 | 0.234 | 0.017 |
| Oil content | 0.785 | −0.463 | 0.408 | −0.019 | 0.035 |
Table A2.
PCA DATA: Phenols content in pulp.
Table A2.
PCA DATA: Phenols content in pulp.
| Eigenvectors: | ||||||||||||
| F1 | F2 | F3 | F4 | F5 | F6 | F7 | F8 | F9 | F10 | F11 | F12 | |
| Hydroxytyrosol | 0.066 | 0.045 | 0.473 | 0.079 | 0.377 | −0.042 | 0.096 | 0.141 | −0.017 | −0.211 | −0.347 | −0.223 |
| Tyrosol | −0.087 | 0.318 | 0.060 | 0.293 | 0.310 | −0.133 | 0.067 | 0.159 | 0.175 | −0.046 | 0.076 | 0.397 |
| p-Hydroxybenzoic ac. | −0.206 | 0.083 | −0.169 | 0.288 | 0.316 | 0.132 | −0.043 | 0.174 | 0.107 | −0.015 | −0.225 | −0.227 |
| Vanillic ac. | 0.273 | 0.014 | −0.156 | −0.021 | 0.115 | 0.078 | −0.282 | 0.052 | −0.388 | −0.266 | −0.041 | 0.169 |
| Caffeic ac. | 0.176 | 0.046 | −0.140 | −0.164 | 0.046 | 0.649 | −0.196 | 0.205 | 0.244 | −0.038 | −0.216 | −0.107 |
| Vanillin | 0.178 | 0.044 | 0.111 | 0.425 | −0.283 | 0.005 | 0.170 | 0.041 | −0.086 | −0.265 | 0.098 | −0.209 |
| p-Coumaric ac. | −0.067 | 0.219 | 0.367 | −0.236 | 0.067 | 0.356 | −0.244 | −0.375 | 0.026 | 0.103 | 0.123 | 0.146 |
| Hydroxytyrosylacetate | 0.137 | 0.200 | −0.080 | 0.356 | −0.314 | 0.207 | −0.042 | −0.131 | 0.460 | −0.111 | −0.146 | 0.283 |
| Ferulic ac. | 0.234 | 0.118 | 0.239 | −0.188 | −0.027 | −0.233 | 0.134 | −0.304 | 0.175 | 0.131 | −0.331 | 0.047 |
| Verbascoside | 0.047 | 0.359 | −0.319 | 0.164 | −0.098 | −0.037 | −0.023 | −0.150 | −0.101 | 0.152 | −0.090 | −0.315 |
| O-Coumaric ac. | 0.292 | 0.030 | −0.107 | 0.023 | 0.115 | −0.042 | 0.001 | −0.236 | −0.015 | −0.164 | 0.077 | 0.021 |
| 3,4-DHPEA-EDA ox | 0.028 | −0.102 | 0.102 | 0.430 | 0.419 | 0.247 | −0.072 | −0.364 | −0.228 | 0.274 | 0.249 | −0.024 |
| 3,4-DHPEA-EDA | −0.047 | 0.435 | −0.114 | −0.112 | −0.085 | 0.026 | −0.017 | −0.001 | −0.176 | 0.157 | −0.017 | −0.274 |
| Oleuropein | 0.205 | 0.301 | −0.172 | −0.101 | 0.012 | 0.015 | 0.066 | 0.002 | −0.227 | −0.056 | 0.187 | 0.171 |
| 3,4-DHPEA-EA | 0.273 | 0.050 | −0.090 | −0.042 | 0.184 | −0.006 | 0.131 | 0.455 | −0.092 | 0.495 | −0.137 | 0.235 |
| Tyrosylacetate | 0.105 | 0.161 | 0.361 | 0.172 | −0.363 | 0.141 | 0.087 | 0.182 | −0.349 | 0.209 | −0.064 | 0.221 |
| p-HPEA-EDA ox | 0.289 | 0.014 | 0.090 | −0.151 | 0.033 | −0.063 | −0.053 | −0.027 | 0.137 | 0.266 | 0.020 | −0.293 |
| p-HPEA-EDA | 0.278 | −0.052 | −0.072 | −0.156 | 0.164 | −0.085 | −0.114 | −0.020 | −0.028 | −0.319 | −0.078 | 0.227 |
| Pinoresinol, 1-Acetoxypinoresinol | −0.185 | 0.248 | −0.295 | −0.060 | 0.141 | −0.168 | 0.052 | −0.264 | −0.094 | 0.002 | −0.249 | 0.127 |
| p-HPEA-EA | 0.288 | −0.037 | −0.033 | 0.101 | 0.040 | −0.167 | −0.223 | 0.030 | −0.036 | −0.093 | 0.056 | −0.132 |
| 3,4-DHPEA,-EA,H ox | 0.157 | −0.091 | −0.156 | −0.128 | 0.131 | 0.314 | 0.789 | −0.122 | 0.029 | −0.085 | 0.152 | −0.016 |
| Luteolin | −0.112 | 0.367 | 0.190 | −0.202 | 0.034 | 0.087 | 0.026 | 0.239 | −0.067 | −0.321 | 0.313 | −0.179 |
| 3,4-DHPEA,-EA,H | −0.229 | 0.276 | 0.047 | −0.102 | 0.108 | −0.097 | 0.067 | 0.065 | 0.179 | −0.040 | 0.160 | 0.111 |
| p-HPEA,-EA,H | 0.285 | 0.060 | −0.017 | 0.032 | 0.083 | −0.185 | −0.128 | 0.123 | 0.391 | 0.169 | 0.492 | −0.097 |
| FENOLI TOTALI (mg/kg) | 0.251 | 0.218 | 0.144 | 0.049 | 0.065 | −0.103 | 0.101 | −0.118 | 0.034 | −0.083 | −0.154 | −0.142 |
| Factor loadings: | ||||||||||||
| F1 | F2 | F3 | F4 | F5 | F6 | F7 | F8 | F9 | F10 | F11 | F12 | |
| Hydroxytyrosol | 0.216 | 0.098 | 0.782 | 0.121 | 0.545 | −0.045 | 0.080 | 0.065 | −0.007 | −0.071 | −0.064 | −0.010 |
| Tyrosol | −0.285 | 0.690 | 0.099 | 0.445 | 0.448 | −0.143 | 0.056 | 0.073 | 0.072 | −0.016 | 0.014 | 0.018 |
| p-Hydroxybenzoic ac. | −0.677 | 0.179 | −0.279 | 0.438 | 0.456 | 0.143 | −0.036 | 0.080 | 0.044 | −0.005 | −0.042 | −0.010 |
| Vanillic ac. | 0.898 | 0.031 | −0.258 | −0.032 | 0.167 | 0.084 | −0.236 | 0.024 | −0.160 | −0.090 | −0.008 | 0.008 |
| Caffeic ac. | 0.577 | 0.100 | −0.231 | −0.249 | 0.066 | 0.700 | −0.164 | 0.094 | 0.100 | −0.013 | −0.040 | −0.005 |
| Vanillin | 0.585 | 0.096 | 0.184 | 0.646 | −0.408 | 0.006 | 0.142 | 0.019 | −0.035 | −0.089 | 0.018 | −0.009 |
| p-Coumaric ac. | −0.219 | 0.474 | 0.607 | −0.359 | 0.097 | 0.384 | −0.204 | −0.172 | 0.011 | 0.035 | 0.023 | 0.007 |
| Hydroxytyrosylacetate | 0.451 | 0.434 | −0.132 | 0.540 | −0.454 | 0.223 | −0.035 | −0.060 | 0.189 | −0.037 | −0.027 | 0.013 |
| Ferulic ac. | 0.767 | 0.257 | 0.396 | −0.286 | −0.038 | −0.251 | 0.112 | −0.139 | 0.072 | 0.044 | −0.061 | 0.002 |
| Verbascoside | 0.153 | 0.777 | −0.528 | 0.249 | −0.142 | −0.040 | −0.019 | −0.069 | −0.041 | 0.051 | −0.017 | −0.014 |
| O-Coumaric ac. | 0.958 | 0.064 | −0.177 | 0.035 | 0.166 | −0.045 | 0.001 | −0.108 | −0.006 | −0.055 | 0.014 | 0.001 |
| 3,4-DHPEA-EDA ox | 0.091 | −0.220 | 0.168 | 0.653 | 0.605 | 0.266 | −0.060 | −0.167 | −0.094 | 0.092 | 0.046 | −0.001 |
| 3,4-DHPEA-EDA | −0.155 | 0.942 | −0.188 | −0.170 | −0.123 | 0.028 | −0.014 | 0.000 | −0.072 | 0.053 | −0.003 | −0.012 |
| Oleuropein | 0.675 | 0.653 | −0.284 | −0.154 | 0.018 | 0.017 | 0.055 | 0.001 | −0.093 | −0.019 | 0.035 | 0.008 |
| 3,4-DHPEA-EA | 0.898 | 0.109 | −0.148 | −0.064 | 0.266 | −0.007 | 0.109 | 0.209 | −0.038 | 0.167 | −0.025 | 0.010 |
| Tyrosylacetate | 0.345 | 0.348 | 0.597 | 0.261 | −0.524 | 0.152 | 0.073 | 0.083 | −0.143 | 0.070 | −0.012 | 0.010 |
| p-HPEA-EDA ox | 0.951 | 0.031 | 0.149 | −0.229 | 0.048 | −0.068 | −0.044 | −0.013 | 0.056 | 0.090 | 0.004 | −0.013 |
| p-HPEA-EDA | 0.912 | −0.113 | −0.118 | −0.237 | 0.237 | −0.092 | −0.095 | −0.009 | −0.011 | −0.107 | −0.014 | 0.010 |
| Pinoresinol, 1-Acetoxypinoresinol | −0.608 | 0.537 | −0.488 | −0.092 | 0.203 | −0.181 | 0.044 | −0.121 | −0.038 | 0.001 | −0.046 | 0.006 |
| p-HPEA-EA | 0.946 | −0.080 | −0.054 | 0.153 | 0.057 | −0.180 | −0.187 | 0.014 | −0.015 | −0.031 | 0.010 | −0.006 |
| 3,4-DHPEA,-EA,H ox | 0.515 | −0.196 | −0.258 | −0.195 | 0.189 | 0.339 | 0.660 | −0.056 | 0.012 | −0.029 | 0.028 | −0.001 |
| Luteolin | −0.369 | 0.795 | 0.314 | −0.307 | 0.049 | 0.094 | 0.022 | 0.110 | −0.028 | −0.108 | 0.058 | −0.008 |
| 3,4-DHPEA,-EA,H | −0.753 | 0.598 | 0.078 | −0.155 | 0.156 | −0.104 | 0.056 | 0.030 | 0.074 | −0.013 | 0.030 | 0.005 |
| p-HPEA,-EA,H | 0.935 | 0.129 | −0.028 | 0.049 | 0.119 | −0.200 | −0.107 | 0.056 | 0.161 | 0.057 | 0.091 | −0.004 |
| FENOLI TOTALI (mg/kg) | 0.825 | 0.473 | 0.239 | 0.074 | 0.094 | −0.111 | 0.084 | −0.054 | 0.014 | −0.028 | −0.029 | −0.006 |
| Correlations between variables and factors: | ||||||||||||
| F1 | F2 | F3 | F4 | F5 | F6 | F7 | F8 | F9 | F10 | F11 | F12 | |
| Hydroxytyrosol | 0.216 | 0.098 | 0.782 | 0.121 | 0.545 | −0.045 | 0.080 | 0.065 | −0.007 | −0.071 | −0.064 | −0.010 |
| Tyrosol | −0.285 | 0.690 | 0.099 | 0.445 | 0.448 | −0.143 | 0.056 | 0.073 | 0.072 | −0.016 | 0.014 | 0.018 |
| p-Hydroxybenzoic ac. | −0.677 | 0.179 | −0.279 | 0.438 | 0.456 | 0.143 | −0.036 | 0.080 | 0.044 | −0.005 | −0.042 | −0.010 |
| Vanillic ac. | 0.898 | 0.031 | −0.258 | −0.032 | 0.167 | 0.084 | −0.236 | 0.024 | −0.160 | −0.090 | −0.008 | 0.008 |
| Caffeic ac. | 0.577 | 0.100 | −0.231 | −0.249 | 0.066 | 0.700 | −0.164 | 0.094 | 0.100 | −0.013 | −0.040 | −0.005 |
| Vanillin | 0.585 | 0.096 | 0.184 | 0.646 | −0.408 | 0.006 | 0.142 | 0.019 | −0.035 | −0.089 | 0.018 | −0.009 |
| p-Coumaric ac. | −0.219 | 0.474 | 0.607 | −0.359 | 0.097 | 0.384 | −0.204 | −0.172 | 0.011 | 0.035 | 0.023 | 0.007 |
| Hydroxytyrosylacetate | 0.451 | 0.434 | −0.132 | 0.540 | −0.454 | 0.223 | −0.035 | −0.060 | 0.189 | −0.037 | −0.027 | 0.013 |
| Ferulic ac. | 0.767 | 0.257 | 0.396 | −0.286 | −0.038 | −0.251 | 0.112 | −0.139 | 0.072 | 0.044 | −0.061 | 0.002 |
| Verbascoside | 0.153 | 0.777 | −0.528 | 0.249 | −0.142 | −0.040 | −0.019 | −0.069 | −0.041 | 0.051 | −0.017 | −0.014 |
| O-Coumaric ac. | 0.958 | 0.064 | −0.177 | 0.035 | 0.166 | −0.045 | 0.001 | −0.108 | −0.006 | −0.055 | 0.014 | 0.001 |
| 3,4-DHPEA-EDA ox | 0.091 | −0.220 | 0.168 | 0.653 | 0.605 | 0.266 | −0.060 | −0.167 | −0.094 | 0.092 | 0.046 | −0.001 |
| 3,4-DHPEA-EDA | −0.155 | 0.942 | −0.188 | −0.170 | −0.123 | 0.028 | −0.014 | 0.000 | −0.072 | 0.053 | −0.003 | −0.012 |
| Oleuropein | 0.675 | 0.653 | −0.284 | −0.154 | 0.018 | 0.017 | 0.055 | 0.001 | −0.093 | −0.019 | 0.035 | 0.008 |
| 3,4-DHPEA-EA | 0.898 | 0.109 | −0.148 | −0.064 | 0.266 | −0.007 | 0.109 | 0.209 | −0.038 | 0.167 | −0.025 | 0.010 |
| Tyrosylacetate | 0.345 | 0.348 | 0.597 | 0.261 | −0.524 | 0.152 | 0.073 | 0.083 | −0.143 | 0.070 | −0.012 | 0.010 |
| p-HPEA-EDA ox | 0.951 | 0.031 | 0.149 | −0.229 | 0.048 | −0.068 | −0.044 | −0.013 | 0.056 | 0.090 | 0.004 | −0.013 |
| p-HPEA-EDA | 0.912 | −0.113 | −0.118 | −0.237 | 0.237 | −0.092 | −0.095 | −0.009 | −0.011 | −0.107 | −0.014 | 0.010 |
| Pinoresinol, 1-Acetoxypinoresinol | −0.608 | 0.537 | −0.488 | −0.092 | 0.203 | −0.181 | 0.044 | −0.121 | −0.038 | 0.001 | −0.046 | 0.006 |
| p-HPEA-EA | 0.946 | −0.080 | −0.054 | 0.153 | 0.057 | −0.180 | −0.187 | 0.014 | −0.015 | −0.031 | 0.010 | −0.006 |
| 3,4-DHPEA,-EA,H ox | 0.515 | −0.196 | −0.258 | −0.195 | 0.189 | 0.339 | 0.660 | −0.056 | 0.012 | −0.029 | 0.028 | −0.001 |
| Luteolin | −0.369 | 0.795 | 0.314 | −0.307 | 0.049 | 0.094 | 0.022 | 0.110 | −0.028 | −0.108 | 0.058 | −0.008 |
| 3,4-DHPEA,-EA,H | −0.753 | 0.598 | 0.078 | −0.155 | 0.156 | −0.104 | 0.056 | 0.030 | 0.074 | −0.013 | 0.030 | 0.005 |
| p-HPEA,-EA,H | 0.935 | 0.129 | −0.028 | 0.049 | 0.119 | −0.200 | −0.107 | 0.056 | 0.161 | 0.057 | 0.091 | −0.004 |
| FENOLI TOTALI (mg/kg) | 0.825 | 0.473 | 0.239 | 0.074 | 0.094 | −0.111 | 0.084 | −0.054 | 0.014 | −0.028 | −0.029 | −0.006 |
References
- Conte, P.; Fadda, C.; Del Caro, A.; Urgeghe, P.P.; Piga, A. Table Olives: An Overview on Effects of Processing on Nutritional and Sensory Quality. Foods 2020, 9, 514. [Google Scholar] [CrossRef]
- Perpetuini, G.; Prete, R.; Garcia-Gonzalez, N.; Khairul Alam, M.; Corsetti, A. Table Olives More than a Fermented Food. Foods 2020, 9, 178. [Google Scholar] [CrossRef] [PubMed]
- Anagnostopoulos, D.A.; Kamilari, E.; Tsaltas, D. Evolution of Bacterial Communities, Physicochemical Changes and Sensorial Attributes of Natural Whole and Cracked Picual Table Olives During Spontaneous and Inoculated Fermentation. Front. Microbiol. 2020, 11, 1128. [Google Scholar] [CrossRef] [PubMed]
- Cocolin, L.; Alessandria, V.; Botta, C.; Gorra, R.; De Filippis, F.; Ercolini, D.; Rantsiou, K. NaOH-debittering induces changes in bacterial ecology during table olives fermentation. PLoS ONE 2013, 8, e69074. [Google Scholar] [CrossRef] [PubMed]
- Ramírez, E.; Medina, E.; García, P.; Brenes, M.; Romero, C. Optimization of the Natural Debittering of Table Olives. LWT—Food Sci. Technol. 2017, 77, 308–313. [Google Scholar] [CrossRef]
- Anagnostopoulos, D.A.; Tsaltas, D. Current Status, Recent Advances, and Main Challenges on Table Olive Fermentation: The Present Meets the Future. Front. Microbiol. 2022, 12, 797295. [Google Scholar] [CrossRef] [PubMed]
- Servili, M.; Settanni, L.; Veneziani, G.; Esposto, S.; Massitti, O.; Taticchi, A.; Urbani, S.; Montedoro, G.F.; Corsetti, A. The use of Lactobacillus pentosus 1MO to shorten the debittering process time of black table olives (Cv. Itrana and Leccino): A pilot-scale application. J. Agric. Food Chem. 2006, 54, 3869–3875. [Google Scholar] [CrossRef]
- Gökçen, İ. Phenolic compounds change in Table Olives. Nutr. Food Sci. Int. J. 2017, 3, 555621. [Google Scholar]
- Ramírez, E.; Medina, E.; Brenes, M.; Romero, C. Endogenous Enzymes Involved in the Transformation of Oleuropein in Spanish Table Olive Varieties. J. Agric. Food Chem. 2014, 62, 9569–9575. [Google Scholar] [CrossRef]
- Bonatsou, S.; Tassou, C.C.; Panagou, E.Z.; Nychas, G.E. Table Olive Fermentation Using Starter Cultures with Multifunctional Potential. Microorganisms 2017, 5, 30. [Google Scholar] [CrossRef]
- Lanza, B.; Zago, M.; Di Marco, S.; Di Loreto, G.; Cellini, M.; Tidona, F.; Bonvini, B.; Bacceli, M.; Simone, N. Single and Multiple Inoculum of Lactiplantibacillus plantarum Strains in Table Olive Lab-Scale Fermentations. Fermentation 2020, 6, 126. [Google Scholar] [CrossRef]
- Lanza, B.; Di Marco, S.; Bacceli, M.; Di Serio, M.G.; Di Loreto, G.; Cellini, M.; Simone, N. Lactiplantibacillus plantarum Used as Single, Multiple, and Mixed Starter Combined with Candida boidinii for Table Olive Fermentations: Chemical, Textural, and Sensorial Characterization of Final Products. Fermentation 2021, 7, 239. [Google Scholar] [CrossRef]
- Arroyo-López, F.N.; Querol, A.; Bautista-Gallego, J.; Garrido-Fernández, A. Role of yeasts in table olive production. Int. J. Food Microbiol. 2008, 128, 189–196. [Google Scholar] [CrossRef]
- Arroyo-López, F.N.; Romero-Gil, V.; Bautista-Gallego, J.; Rodríguez-Gómez, F.; Jiménez-Díaz, R.; García-García, P.; Querol, A.; Garrido-Fernández, A. Yeasts in Table Olive Processing: Desirable or Spoilage Microorganisms? Int. J. Food Microbiol. 2012, 160, 42–49. [Google Scholar] [CrossRef]
- Campus, M.; Cauli, E.; Scano, E.; Piras, F.; Comunian, R.; Paba, A.; Daga, E.; Di Salvo, R.; Sedda, P.; Angioni, A.; et al. Towards Controlled Fermentation of Table Olives: LAB Starter Driven Process in an Automatic Pilot Processing Plant. Food Bioprocess Technol. 2017, 10, 1063–1073. [Google Scholar] [CrossRef]
- Corsetti, A.; Perpetuini, G.; Schirone, M.; Tofalo, R.; Suzzi, G. Application of starter cultures to table olive fermentation: An overview on the experimental studies. Front. Microbiol. 2012, 3, 248. [Google Scholar] [CrossRef]
- Psani, M.; Kotzekidou, P. Technological Characteristics of Yeast Strains and Their Potential as Starter Adjuncts in Greek-Style Black Olive Fermentation. World J. Microbiol. Biotechnol. 2006, 22, 1329–1336. [Google Scholar] [CrossRef]
- Marquina, D.; Toufani, S.; Llorente, P.; Santos, A.; Peinado, J.M. Killer Activity in Yeast Isolates from Olive Brines. Adv. Food Sci. 1997, 19, 41–46. [Google Scholar]
- Bleve, G.; Tufariello, M.; Durante, M.; Perbellini, E.; Ramires, F.A.; Grieco, F.; Cappello, M.S.; De Domenico, S.; Mita, G.; Tasioula-Margari, M.; et al. Physico-chemical and microbiological characterization of spontaneous fermentation of Cellina di Nardò and Leccino table olives. Front. Microbiol. 2014, 5, 570. [Google Scholar] [CrossRef]
- Ciafardini, G.; Zullo, B.A. Use of Air-Protected Headspace to Prevent Yeast Film Formation on the Brine of Leccino and Taggiasca Black Table Olives Processed in Industrial-Scale Plastic Barrels. Foods 2020, 9, 941. [Google Scholar] [CrossRef]
- Panagou, E.Z.; Tassou, C.C.; Katsaboxakis, C.Z. Induced Lactic Acid Fermentation of Untreated Green Olives of the Conservolea Cultivar by Lactobacillus Pentosus. J. Sci. Food Agric. 2003, 83, 667–674. [Google Scholar] [CrossRef]
- Lombardi, S.J.; Macciola, V.; Iorizzo, M.; De Leonardis, A. Effect of different storage conditions on the shelf-life of natural green table olives. Ital. J. Food Sci. 2018, 30, 414–427. [Google Scholar]
- Lanza, B.; Zago, M.; Carminati, D.; Rossetti, L.; Meucci, A.; Marfisi, P.; Russi, F.; Iannucci, E.; Di Serio, M.G.; Giraffa, G. Isolation and preliminary characterization of Lactobacillus plantarum bacteriophages from table olive fermentation. Ann. Microbiol. 2012, 62, 1467–1472. [Google Scholar] [CrossRef]
- Chytiri, A.; Tasioula-Margari, M.; Bleve, G.; Kontogianni, V.G.; Kallimanis, A.; Kontominas, M.G. Effect of different inoculation strategies of selected yeast and LAB cultures on Conservolea and Kalamàta table olives considering phenol content, texture, and sensory attributes. J. Sci. Food Agric. 2020, 100, 926–935. [Google Scholar] [CrossRef]
- Paba, A.; Chessa, L.; Daga, E.; Campus, M.; Bulla, M.; Angioni, A.; Sedda, P.; Comunian, R. Do Best-Selected Strains Perform Table Olive Fermentation Better than Undefined Biodiverse Starters? A Comparative Study. Foods 2020, 9, 135. [Google Scholar] [CrossRef]


Disclaimer/Publisher’s Note: The statements, opinions and data contained in all publications are solely those of the individual author(s) and contributor(s) and not of MDPI and/or the editor(s). MDPI and/or the editor(s) disclaim responsibility for any injury to people or property resulting from any ideas, methods, instructions or products referred to in the content. |
© 2023 by the authors. Licensee MDPI, Basel, Switzerland. This article is an open access article distributed under the terms and conditions of the Creative Commons Attribution (CC BY) license (https://creativecommons.org/licenses/by/4.0/).