Article

Research on Deformation Monitoring of Invert Uplifts in Soft Rock Tunnels Based on 3D Laser Scanning

1
Henan College of Transportation, Zhengzhou 451460, China
2
College of Earth Science, Chengdu University of Technology, Chengdu 610059, China
3
Henan Polytechnic Institute, Nanyang 473009, China
4
School of Civil Engineering, Henan Polytechnic University, Jiaozuo 454000, China
*
Author to whom correspondence should be addressed.
Appl. Sci. 2023, 13(17), 9492; https://doi.org/10.3390/app13179492
Submission received: 5 July 2023 / Revised: 10 August 2023 / Accepted: 18 August 2023 / Published: 22 August 2023
(This article belongs to the Special Issue Intelligence and Automation in Construction)

Abstract

:
The soft surrounding rock in tunnels has the characteristics of low strength, easy softening after soaking, and poor self-stability, which makes the inverted arch structure in soft rock tunnels prone to uplift deformations. Therefore, a deformation monitoring method for inverted arch uplifts of soft rock tunnels based on 3D laser scanning technology is studied to improve deformation monitoring. A Leica Scan Station2 3D laser scanner is used to collect 3D point cloud data of soft rock tunnel inverts. Using the automatic matching method of public landmarks and the improved Rodrigues parameter method, the collected 3D point cloud data are spliced and through the Mallat algorithm, the 3D point cloud data are reconstructed and processed after splicing. The whole least square method is used to fit the reconstructed 3D point cloud data. Through the principal component analysis method, the normal vector of the fitting plane is estimated and the best datum plane of the soft rock tunnel invert is found. By calculating and extracting the geometric parameters of the slice point cloud, the monitoring of inverted arch uplift deformations in soft rock tunnels is completed. The experiment shows that this method can effectively collect 3D point cloud data of soft rock tunnel inverts, and complete point cloud stitching and reconstruction. This method can effectively monitor the uplift deformation of inverted arches at different grouting depths.

1. Introduction

The support structure of soft rock tunnels can ensure the smooth excavation and safe operation of the tunnel [1], and an inverted arch structure plays an important role in improving the bearing capacity and stability of the whole support system. The inverted arch is connected to the side wall to form a stable annular structure with an upper lining so as to make full use of the high compressive strength of concrete and improve the strength and stability of the whole tunnel support system [2]. An inverted arch can also change the stress state of the rock around the tunnel, changing its stress state from only horizontal and vertical two-way forces to a multi-directional uniform force, thus avoiding or reducing the phenomenon of stress concentration in the surrounding rock. This reduces the plastic deformation of the surrounding rock and improves the strength and stability of the surrounding rock. At the same time, an inverted arch can effectively support the side wall and vault support, thus reducing the vertical deformation of the upper support structure. It can also guide the horizontal stress to the lower surrounding rock, reduce the load and deformation of the surrounding rock in the horizontal direction, and improve the stability of the side wall. The stress of inverted arch structures is complex. They not only bear the stratum pressure brought about by the upper support structure, but also resist the rebound force of the surrounding rock at the tunnel bottom. During operation, it also bears the vibration load of trains. Therefore, the uplift deformation of inverted arches at the tunnel bottom will affect the stability of the whole support system of the tunnel, leading to the deformation and destruction of the entire lining structure. In serious cases, it may damage the train running track. This affects the driving safety of vehicles. The invert uplift deformation of soft rock tunnels is a very complex engineering problem which is not only related to the physical and mechanical properties of the tunnel’s surrounding rock, the initial stress state, and groundwater development, but is also closely related to the regional geological structure, tunnel excavation and support methods, inverted arch support timing, and other factors. Soft rock is prone to large deformation under the condition of high ground stress due to the low strength of the surrounding rock, easy softening by water, poor self-stability, and other characteristics. Tunnel inverted arch structures are also prone to uplift deformations. Therefore, studying the monitoring methods for arch deformation in soft rock tunnels is of great significance for guiding tunnel engineering, analyzing the causes of arch deformation, selecting control measures, and implementing preventive control measures during construction and operation in the future.
An et al. [3] studied the Shuiqing Tunnel of the Bijie to Zhenxiong Expressway in Guizhou Province and adopted the New Austrian Tunnel Method to ensure tunnel construction safety in water rich strata. However, this method does not take into account the possible differences in geological conditions in other regions, and its universality is not high. Li et al. [4] established a hybrid model that combines chaos theory, support vector machine, and an improved Gray Wolf optimization algorithm for deformation prediction in the early stages of dam operation. However, the data quality in this method is poor, which affects the accuracy of the model. Zhao et al. [5] modeled the centroid deformation of arch dams through measurement data and determined the spatiotemporal distribution characteristics of arch dam deformations. However, this method cannot obtain real-time dam deformation information and is inefficient. In work by Garcia et al. [6], firstly, a pressure sensor was used to collect the pressure disturbance data. Then, the flexibility of the sound wave was estimated by the pressure disturbance flexibility estimation of the wind speed movement and the compliance event mark was used to detect the tunnel uplift deformation event caused by the pressure change. This method could effectively monitor tunnel uplift deformations; however, it could not achieve long distance measurements, and measurements in the existing tunnel must avoid the tunnel operation period, which consumes more manpower and has a low measurement efficiency. Secondly, the tunnel environment is narrow, causing problems in the layout of monitoring points. If the distribution of points is too dense, the workload will be too large and the single measurement cycle will be too long. If the distribution of points is too sparse, the data accuracy cannot be guaranteed. This will greatly affect the accuracy of subsequent deformation analyses. Maes et al. [7] discussed the application of novel deformation monitoring methods in a long-term monitoring project of tunnels. Through monitoring the inclination of the tunnel’s inverted arch uplift surface, the spatial geometric relationship is used to convert the inverted arch uplift change at each monitoring point in the tunnel ring, achieving effective monitoring of tunnel inverted arch uplift deformations. This method can obtain horizontal displacement and vertical displacement in different time periods. However, the effectiveness, synchronism, and scientificity of the monitoring results are reduced, the deformation information of the dam cannot be obtained in real time, and there is a shortfall in that there are few measuring points so that the deformation of an unmonitored area cannot be displayed. Bassols et al. [8], with D-InSAR data obtained by Sentinel-1A data combined with detailed hydrogeological and pressure measurement data, analyzed the spatial distribution of tunnel uplift deformations and the ground hydrodynamic parameter model and estimated the size of the uplift deformation, realizing feasible tunnel uplift deformation monitoring. However, this method is based on multi-point monitoring, and less consideration is given to the location of the measuring points and their relationship with other measuring points. It is difficult to accurately and completely reflect the three-dimensional deformation of the tunnel inverted arch uplift, which has certain limitations. Emil et al. [9] used the small baseline subset InSAR time series method combined with the ALOS Palsar-1 and Sentinel-1 synthetic aperture radar data sets to evaluate the tunnel uplift deformation and used spatiotemporal correlation between the observed deformation and the relevant data sets to identify control factors, effectively monitoring tunnel inverted arch uplift deformations. However, this method is easily affected by terrain, weather, and other factors, which leads to certain restrictions of this method and does not have universality. Gulati et al. [10] used ENVISAT radar data to obtain the interference stripe of SAR images and monitor tunnel inverted arch uplift deformations by the two-rail difference interferometry method. This method is faster and more efficient in monitoring tunnel invert deformations; however, it is easily affected by terrain, weather, and other factors, which leads to certain restrictions on this method and does not have universality.
Three-dimensional laser scanning technology can quickly obtain the surface features of objects [11]. Like the total station, it can approximately simulate the overall features of objects through the principle of points instead of surfaces. Three-dimensional laser scanning technology has completely overcome the shortcomings of too few measuring points and incomplete representative information in the common measurement method. Three-dimensional laser scanning technology is another technological revolution in the measurement industry after GPS measurement technology [12]. As a result of its high speed, automaticity, and rapid acquisition of a large amount of point cloud data, it has become an important means to obtain detailed data of object surfaces and 3D models and is widely used in the deformation monitoring field. As a result of the difficulty of accurately and completely reflecting the three-dimensional deformation of tunnel arch uplifts mentioned above, deformation monitoring results have certain limitations and data accuracy cannot be guaranteed, which affects the accuracy of subsequent deformation analyses. A method for monitoring the uplift deformation of soft rock tunnel arches based on 3D laser scanning is studied. A Leica Scan Station2 3D laser scanner and the Mallat algorithm are used to extract the slice point cloud with a fixed distance from the optimal reference plane to the soft rock tunnel arch point cloud, extract the geometric parameters of the slice point cloud, and improve the accuracy of monitoring the uplift deformation of soft rock tunnel arches.

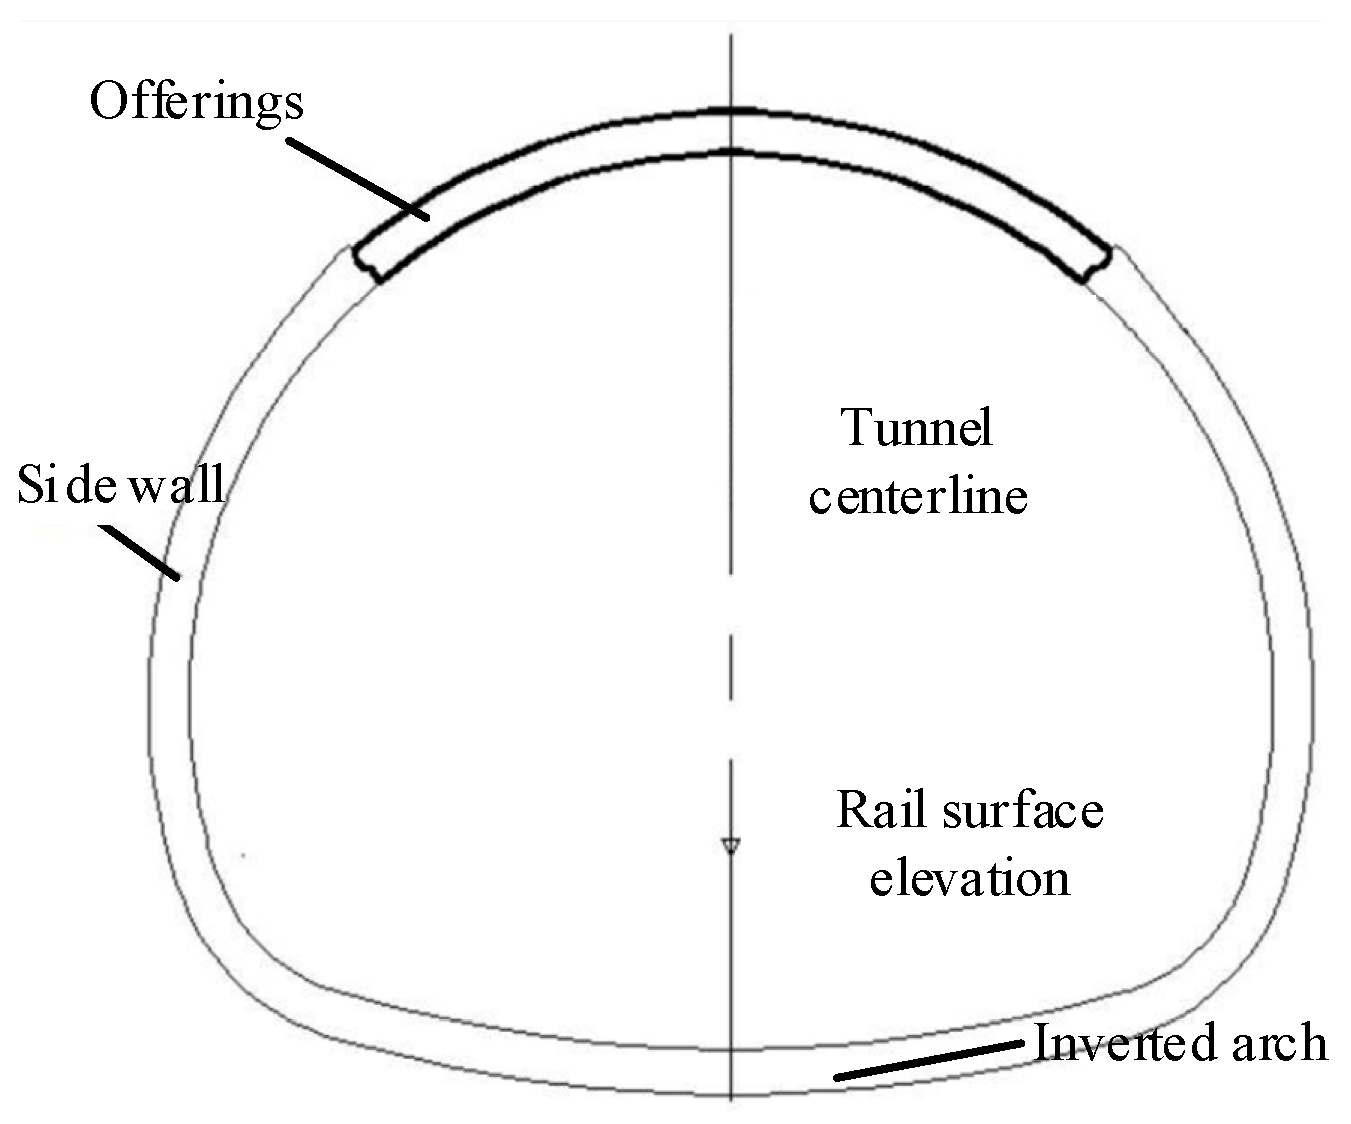
2. Deformation Monitoring of Inverted Arch Uplifts of Soft Rock Tunnels

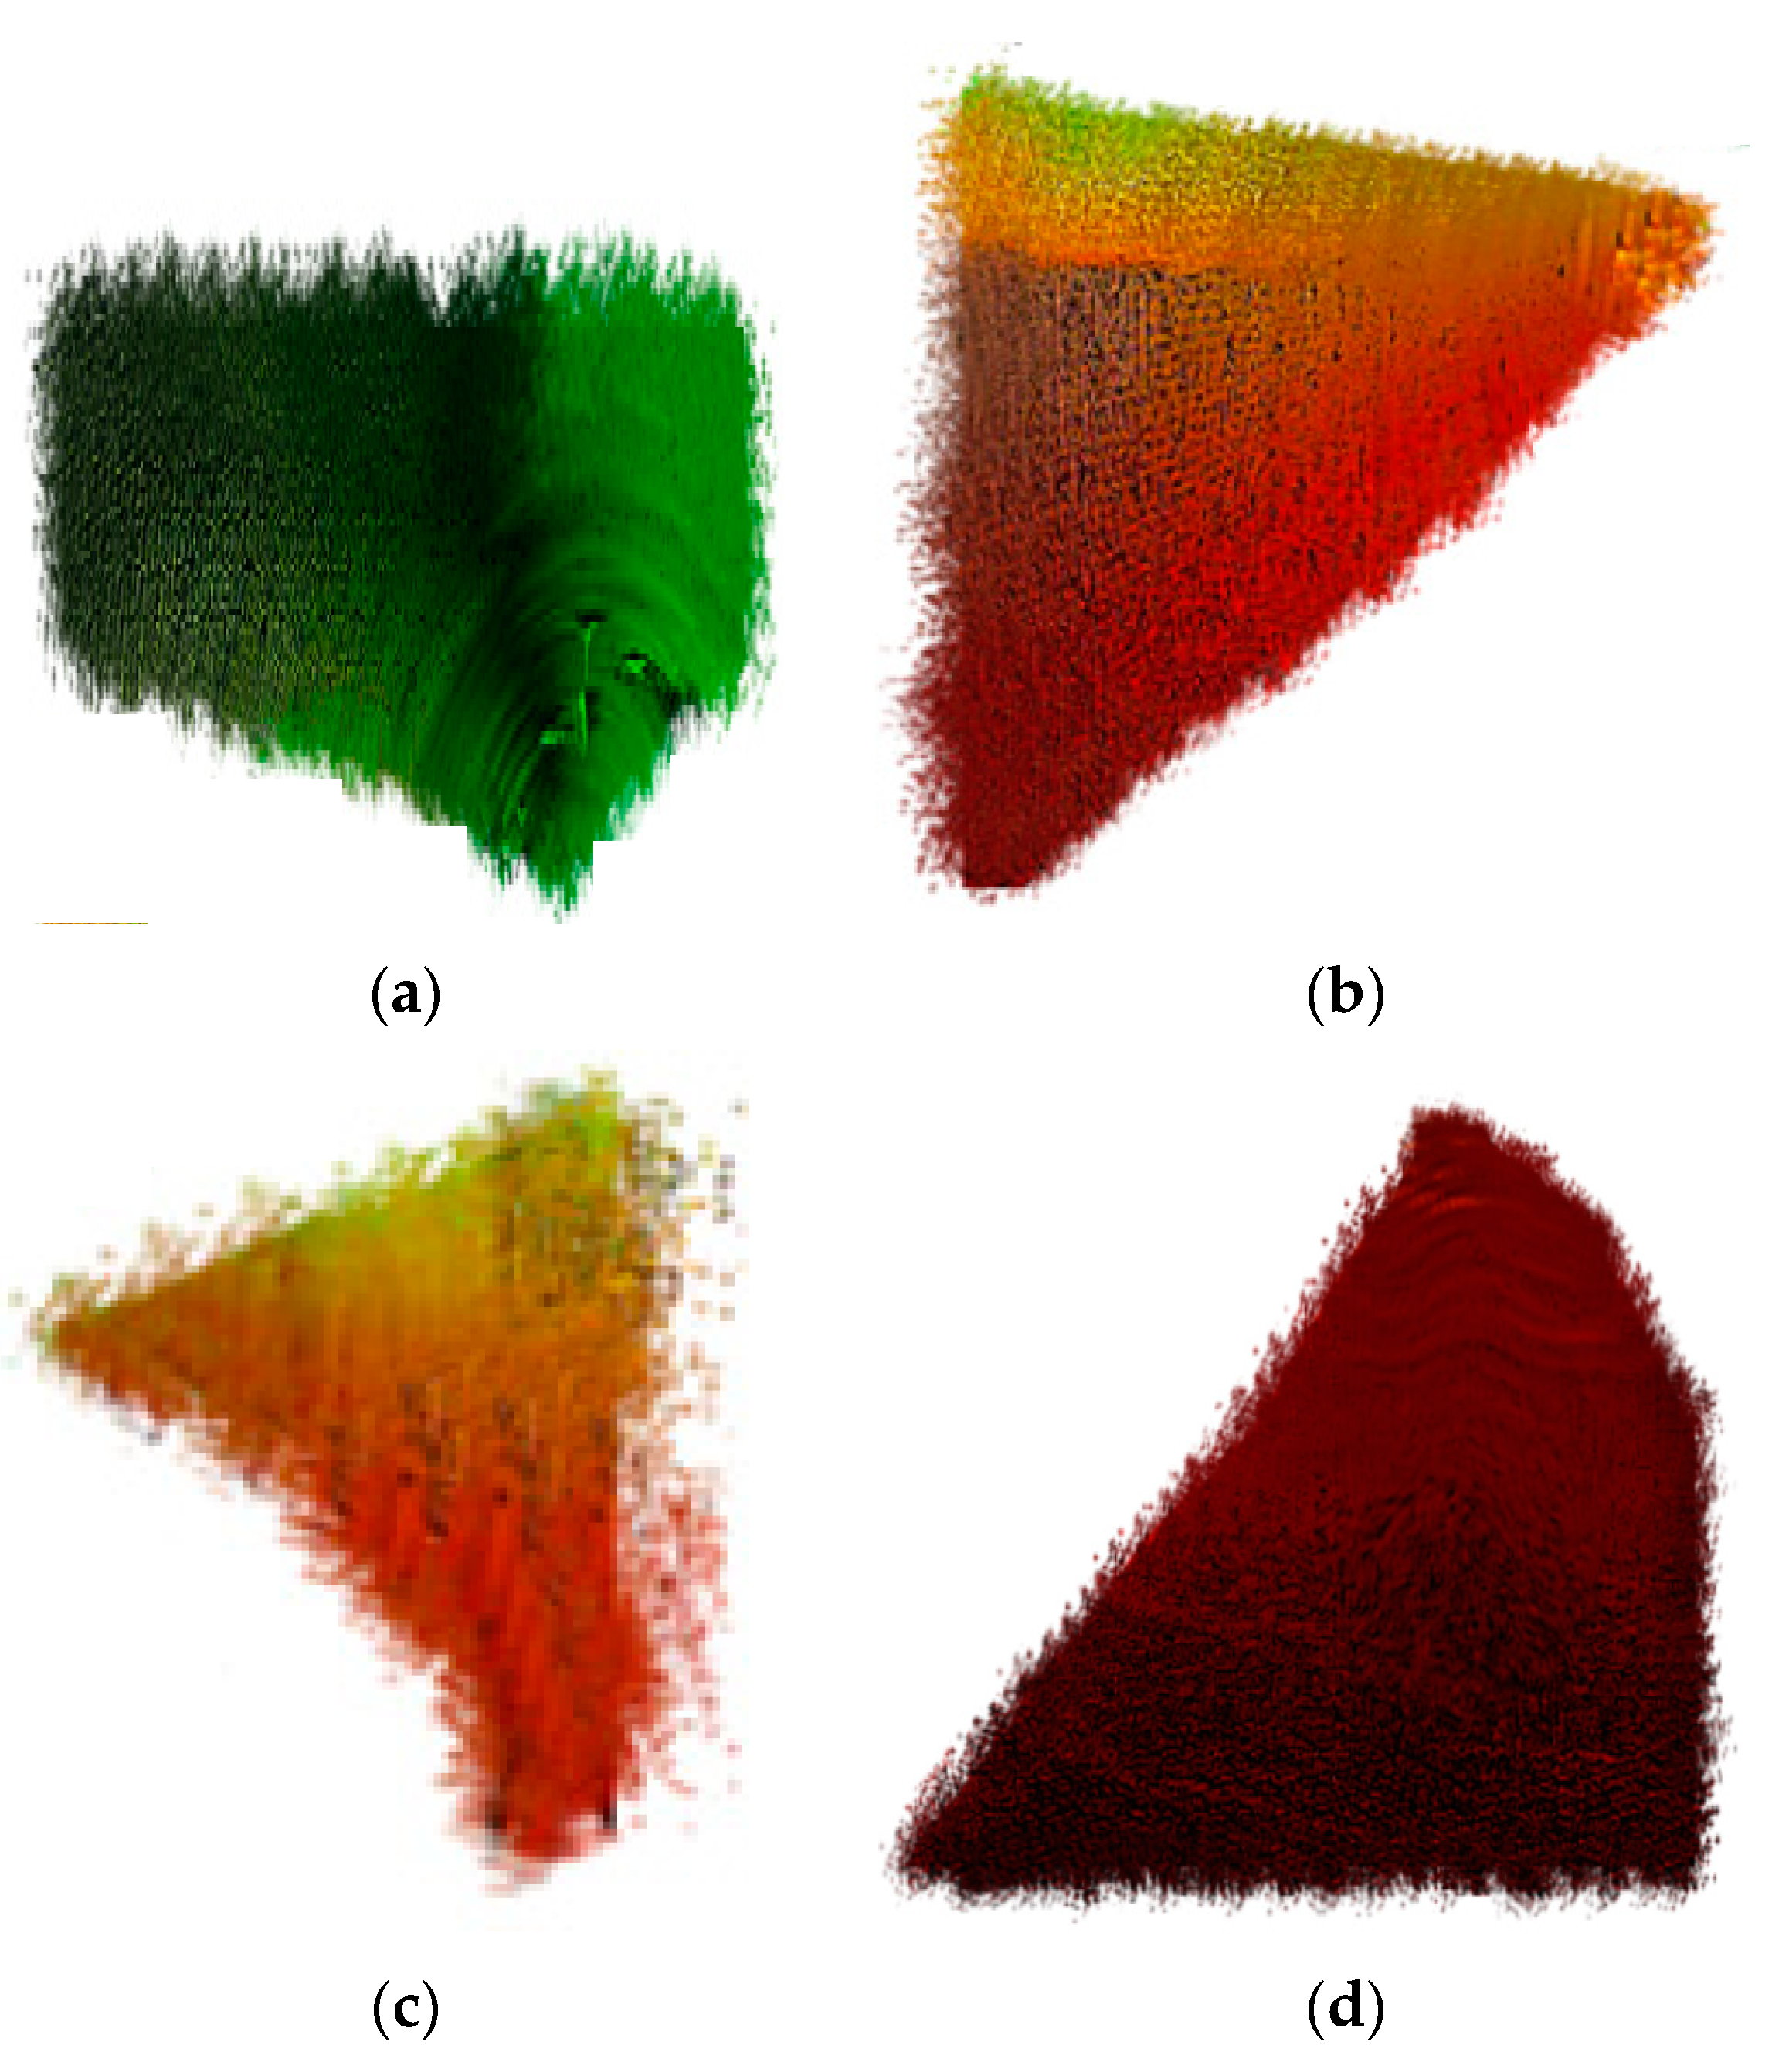
2.1. Three-Dimensional Point Cloud Splicing of Inverted Arches of Soft Rock Tunnels

The single point monitoring method only relies on a small number of monitoring points, and cannot obtain sufficient deformation information about the inverted arches of soft rock tunnels. At the same time, in three-dimensional space, because three points can determine the coordinate transformation relationship, when positioning marker points, the number of public marker points in the overlapping area is required to be at least three. According to the pose invariance of the landmark, the relative position between the landmark and the center of the three-dimensional space composed of the landmark set remains unchanged; a reference point is obtained based on this. Set the set of public landmarks of the soft rock tunnel invert as P . The number of P in public landmarks is N P and the set of reference public landmarks is Q . The number of Q in public landmarks is N Q .
First, obtain the center of the three-dimensional space P formed by the mark points in ψ P , the coordinates of which are ψ P x , ψ P y , ψ P z . The center of the three-dimensional space Q is formed by the mark points of ψ Q , the coordinates of which are ψ Q x , ψ Q y , ψ Q z .
Then, use k-nearest neighbors to obtain the three closest points in ψ P to form a set of landmarks P A = P A i P A i P , i = 1 , 2 , 3 , with the other points being P A j . Similarly, ψ Q obtains the set of three points Q B = Q B j Q B j P , j = 1 , 2 , 3 , and the other points are Q B i . Additionally, match the P A and Q B symbols according to Formula (1), where δ is the given threshold and 2 is the Euclidean distance. The Euclidean distance relationship between the marked point and the reference point is as follows:
P A i P A j 2 Q B i Q B j 2 < δ ,   i j
Finally, set P A as the datum point and calculate the point in P which is at the Euclidean distance from other landmarks. In Q B , the mark point is also used as the reference point Q ; the Euclidean distance from other marker points to the reference point is used to match other marker point pairs by comparing the distances.
If the number of public landmarks is small, it can be matched directly according to Formula (1). Otherwise, automatic registration of public landmarks can be achieved by the above methods [13,14,15,16].
After the automatic matching of landmarks is completed, the geometric transformation matrix needs to be solved for point cloud stitching. The corresponding relationship between the camera and the projector does not change when measuring the three-dimensional point cloud of the soft rock tunnel invert under different viewpoint conditions; thus, only translation transformations and rotation transformations are required when splicing the three-dimensional point cloud of the soft rock tunnel invert, and no scaling transformation is required. To solve the rotation matrix R and flat matrix T , the improved Rodrigues parameter method is adopted. If the Rodrigues parameter is assumed, S , then
S = S x S y S z
According to Formula (2), the vector form of the Rodriguez parameter can be obtained [17]. Then, its antisymmetric matrix H can be expressed as:
H = 0 S z S y S z 0 S x S y S x 0
According to Formula (3), the antisymmetric matrix H is calculated through the vector form of the Rodriguez parameter, and then the rotation matrix R is calculated through the antisymmetric matrix H . The calculation formula of the rotation matrix is as follows [18]:
R = 1 S z S y S z 1 S x S y S x 1 1 S z S y S z 1 S x S y S x 1
Set P ψ P = A , Q ψ q = B , and A = R B . Then:
0 A z B z A y + B y A z + B z 0 A x B x A y B y A x + B x 0 S x S y S z = A x B x A y B y A z B z
where A x , A y , and A z are the three-dimensional positions in the set of public landmarks except the center; B x , B y , and B z refer to the three-dimensional positions other than the center in the set of reference landmarks.
Substitute, according to Equation (5), S and H into Formula (4) for R . T can be calculated by Formula (6). The formula is as follows:
T = ψ P R ψ Q
In the formula, the target point cloud ψ Q is transformed into point cloud ψ P through the coordinate transformation matrix to complete the three-dimensional point cloud splicing of soft rock tunnel inverts.

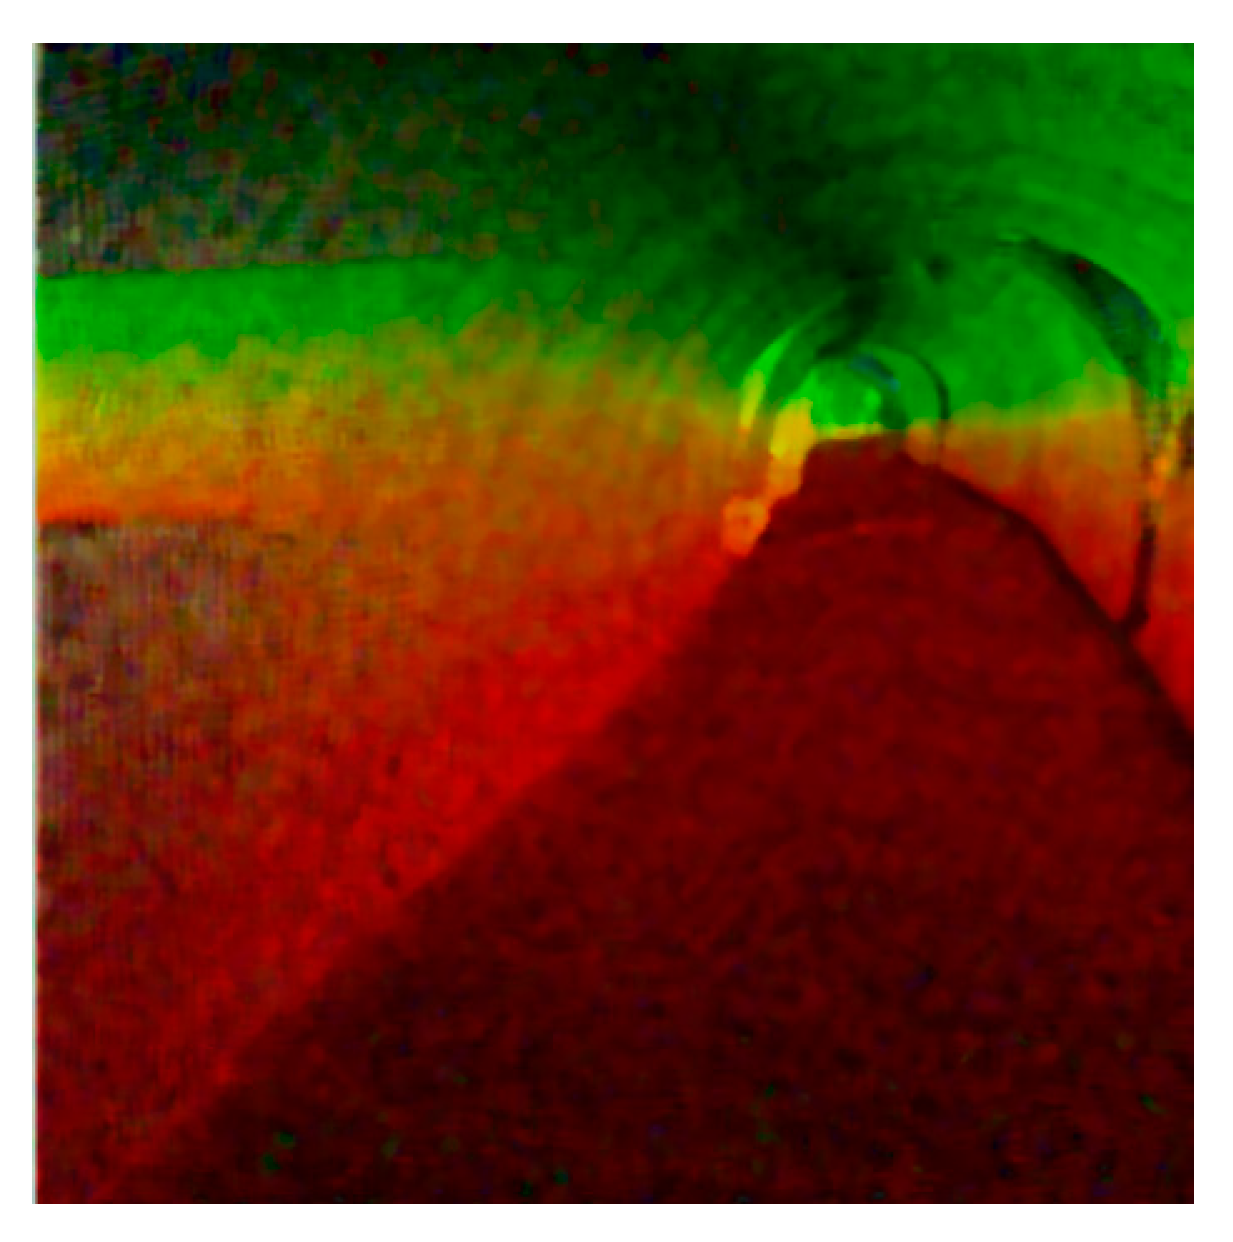
2.2. 3D Point Cloud Reconstruction of Inverted Arches of Soft Rock Tunnels

The 3D point cloud data of soft rock tunnel inverts collected through multi-station field work [19] need reconstruction to reduce the gross error and improve the plane fitting accuracy of soft rock tunnel inverts.
The Mallat algorithm is used to reconstruct the 3D point clouds of inverted arches of soft rock tunnels after splicing [20]. The Mallat algorithm can quickly decompose the 3D point cloud data of soft rock tunnel inverts with wavelets, remove high-frequency information, quickly reconstruct middle- and low-frequency information, and complete 3D point cloud reconstruction of soft rock tunnel inverts.
The Mallat algorithm is a fast wavelet decomposition and reconstruction algorithm. The two-scale equation formed by a scale function ϕ t and wavelet function ϖ t is given by the multi-scale feature of the wavelet transform, which describes two adjacent scale spaces O j 1 and O j , or adjacent scale space O j 1 and wavelet space W j . The basic functions are ϕ j 1 t , ϕ j t , and ϖ j t and the internal connection in j represents the scale. Specifically, the two-scale equation describes the relationship between the low-pass and high-pass filters in the wavelet transform. It represents how the original signal is decomposed and frequency components of different scales are obtained through the low-pass and high-pass filters. This decomposition process can be realized by the multilayer wavelet transform, where each layer of decomposition is performed based on two-scale equations. Additionally, the Mallat algorithm uses the two-scale equations as the basis for signal decomposition. In this algorithm, the signal can be progressively decomposed into frequency components at different scales by repeatedly applying the process of two-scale equations. This allows for a multi-scale analysis and thus a more comprehensive understanding of the time and frequency domain characteristics of the signal.
According to the characteristics of multi-scale analysis, ϕ t is the wavelet space and W 0 is the scale space for the orthogonal basis of O 0 . Additionally, because W 0 O 1 and O 0 O 1 , then ϕ t and ϖ t must belong to O 1 . In other words, ϕ t , the orthogonal basis of ϖ t and the available space ϕ 1 , n t can be linearly expanded:
ϕ t = n = 1 t h n ϕ 1 , n t
ϖ t = n = 1 t g n T ϕ t
where n is the total number of scales and h n and g n are the filter coefficients. Formulas (7) and (8) describe the relationship between adjacent two-scale spatial basis functions [21], and these two equations are called two-scale equations.
The two-scale Formula (7) is used to stretch and shift the time:
ϕ 2 j t k = n = 2 j h n 2 ϕ 2 j + 1 t 2 k n
Here, k is the telescoping and translation time.
Set m = 2 k + n , then:
ϕ 2 j t k = k = 2 j h m 2 k 2 ϕ 2 j + 1 t m
O j 1 = s p a n 2 j + 1 2 ϕ 2 j + 1 t k ¯
On the basis of a multi resolution analysis, the 3D point cloud data of any soft rock tunnel’s ρ t O j 1 inverted arch are obtained. The expansion formula of O j 1 is:
ρ t = k = 2 j c j 1 2 j + 1 2 ϖ t ϕ 2 j + 1 t k
Here, c j 1 is the expansion coefficient.
Taking the explosion of ρ t (i.e., project O j into W j space), there are:
ρ t = k = 2 j c j , k 2 j 2 ϕ 2 j t k + k = 2 j d j , k 2 j 2 ϖ 2 j t k
Here, d j , k is the scale expansion factor of j .
The decomposition of 3D point cloud data of soft rock tunnel inverted arch splicing is achieved by Formula (13), which is used to remove high-frequency information. The reverse method of wavelet decomposition is used to quickly reconstruct the medium- and low-frequency information of the number of 3D point clouds of soft rock tunnel inverted arch splicing. The reconstructed 3D point cloud data are:
ρ t = k = 2 j c j , k h n 2 j + 1 2 ϕ 2 j + 1 t 2 k n + k = 2 j d j , k g n 2 j + 1 2 ϖ 2 j + 1 t 2 k n
By using Formulas (13) and (14), the 3D point cloud data reconstruction of inverted arch splicing in soft rock tunnels can be completed to reduce gross errors and improve the plane fitting accuracy of soft rock tunnel inversions.

2.3. Plane Fitting of Inverted Arch of Soft Rock Tunnel

The plane fitting of soft rock tunnel inversions is carried out based on the reconstructed 3D point cloud data of soft rock tunnel invert splicing using the overall least square method, which provides data support for the subsequent monitoring of soft rock tunnel invert uplift deformations [22]. The plane fitting equation of the inverted arches of soft rock tunnels is:
a ^ x + b ^ y + z c ^ = 0
Here, a ^ , b ^ , and c ^ are the ground parameters.
Assume that the plane of an inverted arch of a soft rock tunnel is scanned in three dimensions with η scan point coordinates, x i , y i , z i , i = 1 , 2 , , η . Considering the 3D point cloud data of soft rock tunnel inversions in x , y , z , if there are errors in all three directions [23], the equation is changed to:
a ^ x i + ξ x i + b ^ y i + ξ y i + c ^ z i + ξ z i = 0
where ξ x i , ξ y i , and ξ z i are x , y , and z of the error correction number in three directions.
The ground parameters a ^ , b ^ , c ^ can be considered as the result of the orthogonal overall least square plane fitting of the tunnel inverted arch uplift surface. Now, assuming that the datum plane passes through the origin of the three-dimensional coordinate system, the datum plane formula can be obtained as follows:
a ^ ˙ x i + ξ x i + b ^ ˙ y i + ξ y i + c ^ ˙ z i + ξ z i = 0
Here, a ^ ˙ , b ^ ˙ , c ^ ˙ are the datum parameters.
It is known that the uplift surface of tunnel inversions is perpendicular to the datum plane, so it can be obtained by combining Formulas (16) and (17) that:
a ^ a ^ ˙ + b ^ b ^ ˙ + c ^ c ^ ˙ = 0
Therefore,
a ^ ˙ = b ^ a ^ b ^ ˙ c ^ a ^ c ^ ˙
Formula (19) is the basic relationship of the datum plane parameters.

2.4. Inverse Calculation of the Deformed Structure Point Cloud Distance

The normal vector of any point in 3D point cloud data after reconstruction of the inverted arch of a soft rock tunnel is x i , y i , z i . Then, from the above optimal condition, i.e., Equation (16), parallel to the normal vector of the point, we can obtain:
a ^ ˙ x i + ξ x i + b ^ ˙ y i + ξ y i + c ^ ˙ z i + ξ z i = 0
Combining Formulas (19) and (20) obtains:
a ^ ˙ = c ^ y i + ξ y i     b ^ z i + ξ z i b ^ x i + ξ x i     a ^ y i + ξ y i c ^ ˙ b ^ ˙ = c ^ x i + ξ x i     a ^ z i + ξ z i a ^ y i + ξ y i     b ^ x i + ξ x i c ^ ˙
Then, according to Formulas (16) and (21), the datum plane formula can be determined as follows:
c ^ y i + ξ y i b ^ z i + ξ z i b ^ x i + ξ x i a ^ y i + ξ y i x + c ^ x i + ξ x i a ^ z i + ξ z i a ^ y i + ξ y i b ^ x i + ξ x i y + z = 0
Here, x , y , z are the best point cloud normal vectors.
To calculate the average value of the sum of the cosine values of the angle between the normal vector of the inverted arch point cloud and the corresponding datum plane of all soft rock tunnels, a v e cos ε i , the formula is as follows:
a v e cos ε i = i = 1 η a ^ ˙ cos ε i η ρ t
where ε i is the included angle between the point cloud normal vector and the corresponding datum plane.
According to Formula (23), the best datum plane can be found by this formula; for all point cloud normal vectors, the lowest value of a v e cos ε i corresponds to the best datum plane. By analogy, after setting a fixed distance from the point cloud to the optimal datum plane, the overall point cloud of the inverted arch of a soft rock tunnel can be cut into multiple slices of point clouds using the optimal datum plane. Similarly, the distance from the optimal datum plane to the point cloud of the deformation structure is inversely deduced and set as a fixed value.

2.5. Real-Time or Regular Deformation Data Solution

According to the three-dimensional coordinates of all points in the inverted arch slice point cloud of soft rock tunnels, a simple mathematical calculation is carried out, and the abscissa, ordinate, and vertical coordinates are averaged to obtain the center of gravity of the point cloud slice. By extending the idea of the point to line distance formula to calculate the distance from the point to the plane, we can obtain:
D i = a ^ ˙ x i + b ^ ˙ y i + c ^ ˙ z i a ^ ˙ + b ^ ˙ + c ^ ˙ 2
The distance can be obtained by using Formula (24), that is, the distance between the point at any end of the point cloud and the datum plane. At this time, the distance between the first slice point cloud to be intercepted and the datum plane is set, and then the 3D coordinate data of the initial slice point cloud can be obtained and are recorded as x i 1 , y i 1 , z i 1 . The barycentric coordinates of the initial slice point cloud can be expressed as:
x ¯ = i = 1 ϖ x i 1 ϖ D i y ¯ = i = 1 ϖ y i 1 ϖ D i z ¯ = i = 1 ϖ z i 1 ϖ D i
where ϖ is the total number of points included in the point cloud of the inverted arch slice of the initial soft rock tunnel.
The 3D coordinate data and barycentric coordinate calculation method of the initial point cloud slice are extended to the μ point cloud of an inverted arch slice of soft rock tunnel μ . The 3D coordinate data of point cloud slices can be marked as x i μ , y i μ , z i μ . The barycentric coordinates are x ¯ μ , y ¯ μ , z ¯ μ . The calculation of the distance between the center of gravity and the uplifted ground of the inverted arch in the soft rock tunnel, that is, the distance between the bottom and the ground, will become a simple mathematical problem. According to the point to plane and the distance calculation formula, the shape, curvature, deformation and other parameters of the inverted arch will be solved one by one.
In the ground fitting formula for reverse arch uplift in soft rock tunnels, the ground plane parameters are calibrated, and can replace the ground shape of the reverse arch in soft rock tunnels. By applying these parameters to the calculation process, real-time or regular deformation data of reverse arches in soft rock tunnels can be obtained, and the internal structure and deformation situation of soft rock tunnels can be more intuitively understood. By using ground plane parameters, the shape of reverse arches in soft rock tunnels can be inferred. Parameters such as the curvature and deformation are used for deformation monitoring.

3. Example Test and Result Analysis

3.1. Test Environment Analysis

The soft rock tunnel of the expressway from Yunxian to Lincang in Yunnan Province was the research object; the total length of the soft rock tunnel is about 10.2 km. The tunnel is designed as a left- and right-separated, two-hole, one-way, two-lane tunnel. The starting and ending distance of the left side of the tunnel is ZK12 + 600~ZK22 + 835, with a total length of 10,235 m. The starting and ending distance of the right side of the tunnel is YK12 + 620~YK22 + 830, with a total length of 10,210 m. The tunnel area elevation is 1197.6~2525.3 m, the design elevation of the tunnel bottom is 1212.38~1394.67 m, and the elevation difference between the entrance and exit of the tunnel is about 1322 m. The tunnel is situated in a high and middle mountain weathering and denudation landform area. The tunnel body in the tunnel area is precipitous and steep, and the surface vegetation is prosperous and dense, dominated by shrubbery, a walnut forest, and a spruce forest. The tunnel lining structure is shown in Figure 1.
According to the results of geological surveys and drilling, the stratum lithology of the tunnel cross-section includes Quaternary diluvium, Quaternary debris flow accumulation, Quaternary alluvium and diluvium, Lower Proterozoic Lancang Group schist, Jurassic stratum Huakaizuo Formation lower glutenite, and Yanshanian volcanic rock biotite granite [24]. In the inverted arch failure K13 + 060~K13 + 100 section, the rock mass is highly weathered; the lithology is mainly strongly weathered granite and partially granitic schist, with well-developed fissures; and the rock mass has a relatively broken blocky structure. The rock mass of the K13 + 100~K13 + 170 section is highly weathered. The lithology is moderately weathered granitic schist. The rock mass is relatively broken and has a massive structure, overlying the Quaternary slope eluvial brown-yellow gravel and underlying the Yanshanian granite. The lithology within the mud and water inrush (mileage K13 + 612) section is mainly intensely weathered granitic schist and local granite. The rock mass is broken in a fragmented block structure. The fissure water is relatively developed with a strong water yield and poor stability of the surrounding rock. It is overlaid with Quaternary slope eluvial brown-yellow gravel and underlaid by Yanshanian granite.
This area has abundant rainfall, developed surface water bodies, and high groundwater levels. The hydraulic connection between the surface water and the groundwater is closely complementary. In the fracture zone development area, the net reserves and regulation reserves of groundwater are relatively rich, and tunnel geological disasters such as collapses, mud inrush, water inrush, and geothermal disasters are prone to occur. The tunnel section is rich in groundwater resources, which can be divided into pore water and fissure water according to the characteristics of water-bearing media. Influenced and controlled by regional faults, the following water diversion structure has developed:
(1)
Pore water
Pore water is mainly distributed in the form of pore phreatic water in the Quaternary loose accumulation layer. The water volume is small, its location is high, and the water level is altered by seasonal precipitation. It is recharged by infiltration of atmospheric precipitation and discharged to low-lying areas or the surface in the form of springs. Due to the large seepage area of bedrock fissure water, the pore water supply is mainly rainfall.
(2)
Fissure water
The bedrock fissure water in this tunnel section is mainly in the joint fissures, structural fissures, weathering fissures and diagenetic fissures of granitic schists and granites, all of which are tensile fissures that cross each other. They have a good uniformity and openness, forming a network of runoff complementary systems, water storage systems and drainage systems and receiving infiltration recharge from atmospheric precipitation. It has abundant static reserves and regulated reserves, from high to low runoff and discharge.
(3)
Water conducting structure
The main recharge sources of groundwater in the tunnel area are atmospheric precipitation, surface springs and gully flows. The terrain in the section is high in the middle and low at both ends. The tunnel is located at the highest peak, which is the first level watershed. The tunnel area is affected by multi-stage structures, secondary fault structures have developed and the irregular frequent intrusion of granite and the contact of multiple strata and lithology constitute different types of water-conducting structures in the tunnel area. The connectivity between surface water, groundwater and groundwater units is good, and groundwater mainly exists near the fault structure zone, the rock erosion zone and the lithologic contact zone. The fracture water in the K13 + 060~K13 + 100 section is relatively developed, with a weak water yield property, and the fracture water in the mud inrush section (K13 + 612) is relatively developed, with a strong water yield property.

3.2. Example Testing Process

The length of the inverted arch of the tunnel is K13 + 060~K13 + 170. During the monitoring period, the inverted arch cracks changed significantly. There were eight cracks in the mileage section. The cracks mainly extended from small distances to large distances along the lining centerline, and the rest of the cracks extended along the lining centerline to the ditches on both sides. The mileage filling layer of this section had obvious uplift, and some of the cracks had obvious dislocation. The sizes of the cracks were different. The maximum crack size was 20 cm, and its length was about 110 m. The method described in this paper was used to monitor the uplift deformation of the tunnel inversion in the K13 + 060~K13 + 170 section.
The example test process was as follows:
Equipment use: Use the Leica Scan Station2 3D laser scanner to collect 3D point cloud data of the soft rock tunnel invert, set the laser safety level to 3R, and use the dual scanning window to generate 360° at most × with a 270° scanning field angle. The scanner is equipped with a CCD digital camera and supporting software Cyclone 2023.0.2 x64 to set the camera exposure at random under the pulse ranging method.
Point cloud slicing: Select eight public marker points in the inverted arch of the soft rock tunnel in the K13 + 060~K13 + 170 section from the top, bottom, left, and right angles, and use the automatic matching method of public marker points and the improved Rodrigues parameter method to splice the collected 3D point cloud data of the soft rock tunnel inverted arch. Through the Mallat algorithm, reconstruct and process the 3D point cloud data after splicing. According to the reconstructed 3D point cloud data, carry out plane fitting using the overall least square method. Through the principal component analysis method, estimate the normal vector of the fitting plane to find the best datum plane of the soft rock tunnel inverted arch. Extract the slice point cloud by taking the distance from the best datum plane to the soft rock tunnel inverted arch point cloud as a fixed value.
Point cloud data collection: Collect the point cloud data from the top, bottom, left, and right angles, extract the geometric parameters of the slicing point cloud, and regularly obtain the displacement, deformation, stress, and other data of the soft rock tunnel invert every 30 min. The acquisition results are shown in Figure 2.
According to Figure 2a–d, this method can effectively collect point cloud data from four angles in the inverted arch of soft rock tunnel (up, down, left and right) to provide data support for subsequent deformation monitoring of the inverted arch of the soft rock tunnel.

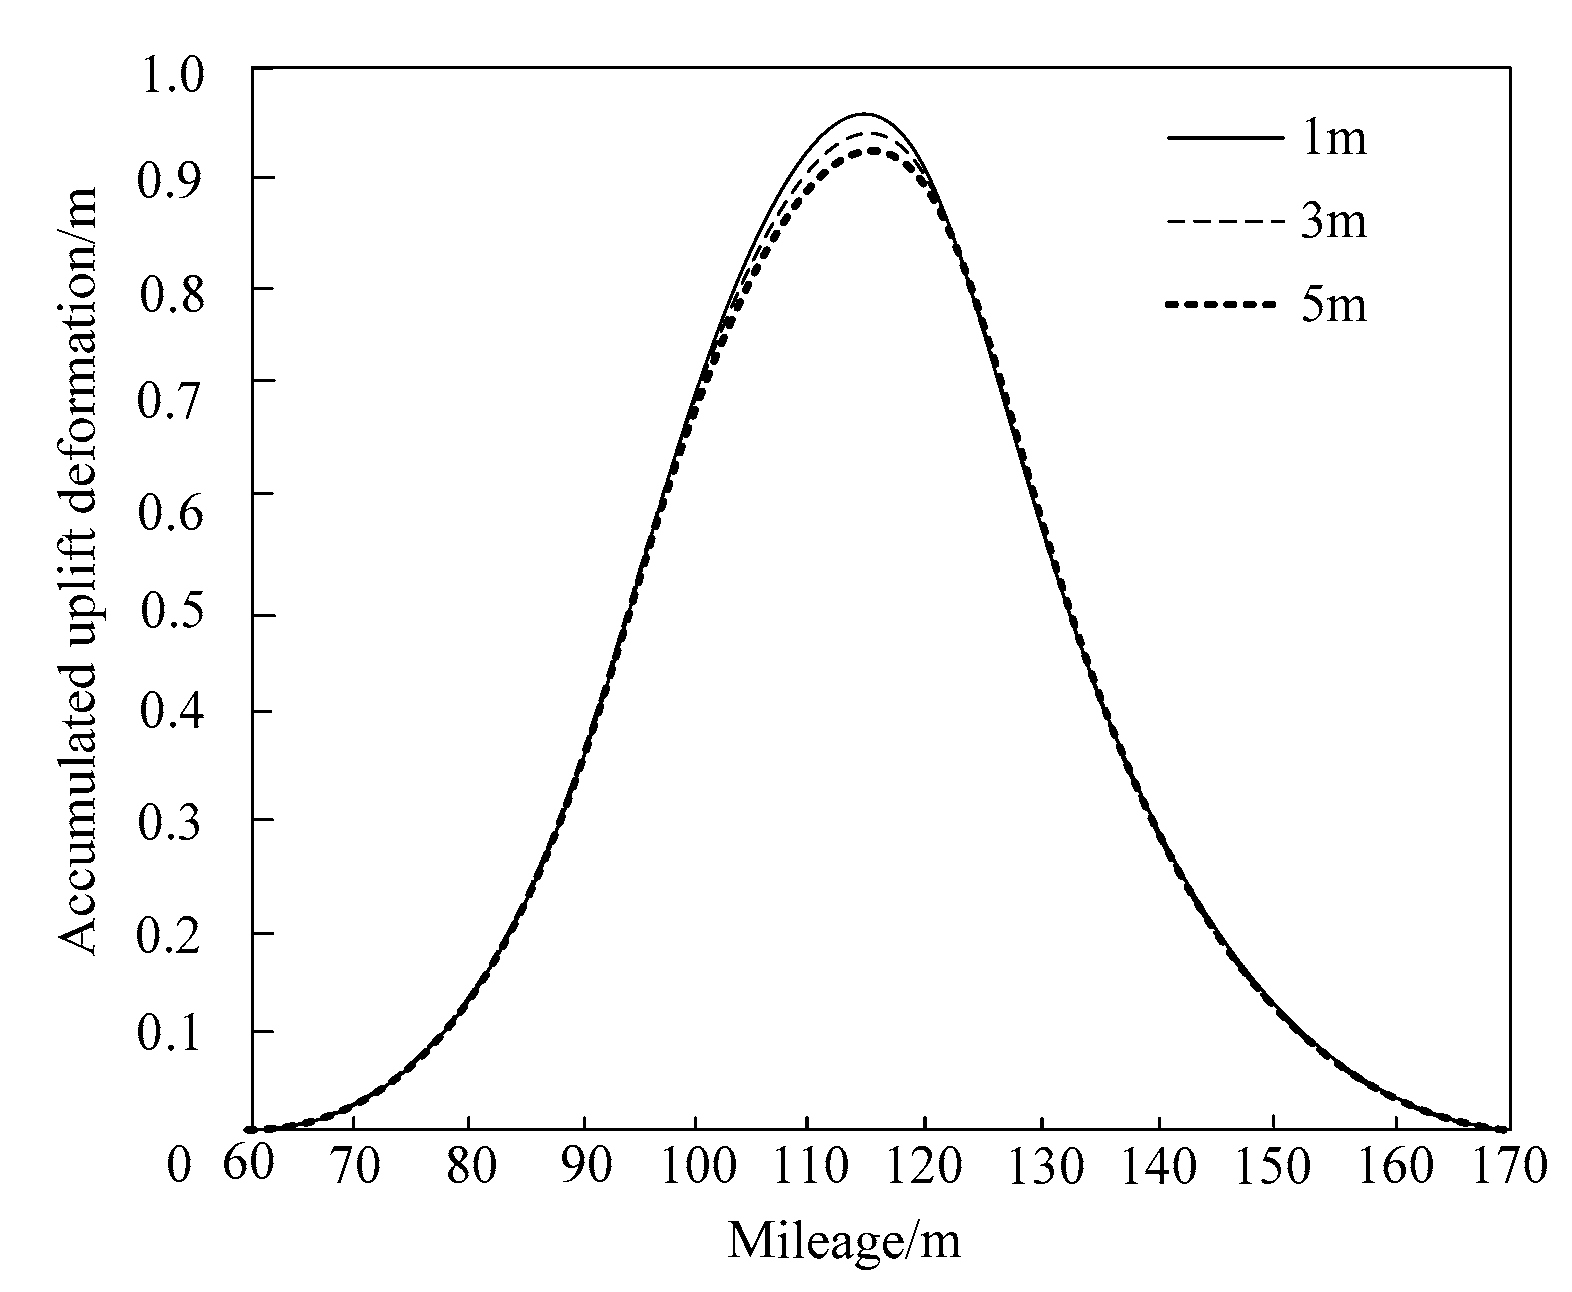
3.3. Test Results and Analysis

The method described in this paper was used to obtain the three-dimensional coordinate values of the public marker points from four perspectives, as shown in Table 1.
According to Table 1, the method used in this paper can effectively obtain the three-dimensional coordinate values of each public landmark point from four perspectives. According to the three-dimensional coordinate values of each public landmark point, the public landmark points are automatically matched to obtain public landmark point pairs, and the point cloud is spliced according to the public landmark point pairs to obtain the point cloud data of the soft rock tunnel’s inverted arch after splicing. The point cloud splicing results are shown in Figure 3.
According to Figure 3, the method used in this paper can effectively splice point clouds based on public marker points to obtain complete soft rock tunnel inverted arch point cloud data. However, the articulated soft rock tunnel inverted arch point cloud data have poor clarity and contain noise. Therefore, we continued to use the method in this paper to reconstruct the splice point cloud data. The result of splice point cloud reconstruction is shown in Figure 4.
According to Figure 4, the method used in this paper can effectively remove noise and better retain terrain feature information, so that the filtered point cloud data can more accurately express terrain information. This experiment proves that the method in this paper is able to reconstruct point cloud data and effectively obtain the inverted arch point cloud data of soft rock tunnels with better clarity, which is conducive to improving the monitoring accuracy of inverted arch uplift deformations of soft rock tunnels in the future.
The method in this paper was used to monitor tunnel invert uplift deformations in the K13 + 060~K13 + 170 section. The monitoring results of the tunnel invert uplift deformation are shown in Figure 5.
According to Figure 5, this method can effectively monitor the uplift deformation of the inverted arch of the soft rock tunnel. According to the deformation monitoring results, the middle uplift deformation of the inverted arch of the soft rock tunnel is the largest and the maximum uplift deformation is about 0.45 m in the K13 + 60~K13 + 170 section. The uplift deformation on the left side of the inverted arch is the smallest and the maximum uplift deformation is about 0.04 m in the K13 + 70~K13 + 160 section. The uplift deformation of the right side of the inverted arch is also small and the maximum uplift deformation is about 0.07 m in the K13 + 80~K13 + 160 section. By comparing the deformation of the left, middle and right inverts of the tunnel, it can be seen that the overall deformation of the invert is large in the middle, followed by the deformation of the right side, and the deformation of the left side is the smallest, which indicates that the invert area on the left side of the tunnel is the least affected. Thus, this deformation may be caused by some asymmetric geological structure. Experiments show that this method can effectively monitor the uplift deformation of inverted arches in soft rock tunnels.
The method in this paper was used to monitor the uplift deformation of the inverted arch of the soft rock tunnel in the K13 + 060~K13 + 170 section at different grouting depths. The uplift deformation monitoring results are shown in Figure 6.
According to Figure 6, the method in this paper can still effectively monitor the uplift deformation of the inverted arch in soft rock tunnels at different grouting depths. The monitoring results show that the uplift deformation of the inverted arch is basically the same at different grouting depths, and there is only a slight change at the section with the largest deformation, indicating that the effect of grouting reinforcement at the arch bottom is not significant. If the grouting depth is not sufficient, the grouting effect is not good. As a result, the strength and bearing capacity of the rock mass after grouting cannot be significantly improved, stress release after excavation cannot be effectively suppressed, the strengthened surrounding rock will still produce plastic deformation, and the suppression of the floor invert uplift will not be greatly improved.
In order to verify the effectiveness and correctness of the application of the method in this article, a comparison was made between the method in reference [6] (Garcia, R.F., et al.) and the method in reference [7] (Maes, K.et al., 2022). Based on the monitoring environment shown in Figure 5, the method and comparison method proposed in this article were used to monitor the uplift deformation of the soft rock tunnel invert at a grouting depth of 5 m in the K13 + 060~K13 + 170 section, and the monitoring results of the uplift deformation were compared. The comparison results are shown in Figure 7.
According to Figure 7, the monitoring results of inverted arch uplift deformation obtained by different comparison methods at a grouting depth of 5 m are significantly different from those obtained by this method; these methods cannot effectively monitor the effect of arch bottom grouting reinforcements. From this, it can be seen that the method proposed in this article has good applicability to the monitoring of inverted arch uplift deformations.

4. Conclusions

An inverted arch structure can improve the bearing capacity and stability of the entire tunnel support system and plays an important role in ensuring the smooth excavation and safe operation of the tunnel. To this end, a deformation monitoring method for reverse arch lifting in soft rock tunnels based on 3D laser scanning was studied. Complete reverse arch point cloud data for soft rock tunnels based on a public marker concatenated point cloud were obtained. At the same time, the reconstruction of the concatenated point cloud data effectively obtained high-definition soft rock roadway reverse arch point cloud data. The central uplift deformation of the soft rock roadway reverse arch was the largest, with a maximum uplift deformation of about 0.45 cm. The lifting deformation cross-section of the inverted arch is K13 + 60~K13 + 170. The method is feasible and effective, has an improved monitoring accuracy, and can accurately monitor the deformation structure and provide a reference and solutions for the lifting deformation problem of soft rock tunnels in practical engineering.
Although 3D laser scanning technology itself has obvious advantages in the monitoring of tunnel inverted arch uplift deformations, its disadvantages cannot be ignored; the huge amount of acquired data leads to difficulties in subsequent analyses and processing and requires complex algorithms for scanning objects with a complex terrain and different surface shapes. Therefore, in the future research, the idea and algorithm of plane fitting will be improved to further improve the degree of popularization.

Author Contributions

Investigation, P.N.; Writing—original draft, E.Z.; Writing—review & editing, J.L. All authors have read and agreed to the published version of the manuscript.

Funding

This work are financially supported by Henan Province 2023 Science and Technology Development Plan Science and Technology Research Project (Project No: 23210232027), Evaluation of Ecological Protection Effectiveness in the Water Source Area of the Middle Route Project of the South to North Water Diversion Based on GEE and Multi source Remote Sensing Big Data; Key Research and Development Project of Henan Province (Program No. 222102320443), Research on Durability-based Environmentally Friendly Asphalt Pavement Technology in the Context of Carbon Neutrality; Key Research Project of Institutions of Higher Education in Henan Province (Program No. 22B580003), Research on Asphalt Pavement Application Technology Based on Road Performance Balance.

Institutional Review Board Statement

Not applicable.

Informed Consent Statement

Not applicable.

Data Availability Statement

Not applicable.

Conflicts of Interest

The authors declare no conflict of interest.

References

  1. Vettorello, D.L.; Marinho, F.A.M.; Orlando, P.D.G. 3D evaluation of pwp development due to tunnel excavation in an over consolidated clay. Geotech. Eng. 2021, 52, 8. [Google Scholar]
  2. Wang, Z.; Su, X.; Lai, H.; Xie, Y.; Liu, T. Conception and evaluation of a novel type of support in loess tunnels. J. Perform. Constr. Facil. 2021, 35, 04020144. [Google Scholar] [CrossRef]
  3. An, Y.; Zhou, J.; Hu, W.; Li, J. Effect of water on tunnel face and surrounding rock deformation. Indian Geotech. J. 2022, 52, 1–12. [Google Scholar] [CrossRef]
  4. Li, M.; Pan, J.; Liu, Y.; Liu, H.; Wang, J.; Zhao, Z. A deformation prediction model of high arch dams in the initial operation period based on psr-svm-igwo. Math. Probl. Eng. 2021, 2021 Pt 46, 8487997.1–8487997.13. [Google Scholar] [CrossRef]
  5. Zhao, E.; Wu, C. Centroid deformation-based nonlinear safety monitoring model for arch dam performance evaluation. Eng. Struct. 2021, 243, 112652.1–112652.13. [Google Scholar] [CrossRef]
  6. Garcia, R.F.; Murdoch, N.; Lorenz, R.; Spiga, A.; Bowman, D.C.; Lognonné, P.; Banfield, D.; Bruce, W. BanerdtSearch for infrasound signals in insight data using coupled pressure/ground deformation methods. Bull. Seismol. Soc. Am. 2021, 111, 3055–3064. [Google Scholar] [CrossRef]
  7. Maes, K.; Salens, W.; Feremans, G.; Segher, K.; Franois, S. Anomaly detection in long-term tunnel deformation monitoring. Eng. Struct. 2022, 250, 113383.1–113383.14. [Google Scholar] [CrossRef]
  8. Bassols, J.B.I.; Vàzquez-Sué, E.; Crosetto, M.; Barra, A.; Gerard, P. D-INSAR monitoring of ground deformation related to the dewatering of construction sites. A case study of glòries square, barcelona. Eng. Geol. 2021, 286, 106041. [Google Scholar] [CrossRef]
  9. Emil, M.K.; Sultan, M.; Alakhras, K.; Sataer, G.; Gebremichael, E. countrywide monitoring of ground deformation using insar time series: A case study from Qatar. Remote Sens. 2021, 13, 702. [Google Scholar] [CrossRef]
  10. Gulati, S.; Nutricato, R.; Nitti, D.O.; Samarelli, S. Spaceborne SAR Interferometry exploitation for longitudinal ground deformation monitoring. In Proceedings of the 2021 IEEE Aerospace Conference, Big Sky, MT, USA, 6–13 March 2021; IEEE: New York, NY, USA, 2021. [Google Scholar]
  11. Ohno, K.; Date, H.; Kanai, S. Study on real-time point cloud superimposition on camera image to assist environmental three-dimensional laser scanning. Int. J. Autom. Technol. 2021, 15, 324–333. [Google Scholar] [CrossRef]
  12. Raptakis, A.; Gounaridis, L.; Weigel, M.; Kleinert, M.; Kouloumentas, C. 2D optical phased arrays for laser beam steering based on 3d polymer photonic integrated circuits. J. Light. Technol. 2021, 39, 6509–6523. [Google Scholar] [CrossRef]
  13. Zuo, N.N.; Qin, X. Simulation of point cloud data extraction from 3D virtual image of object surface. Comput. Simul. 2023, 40, 255–258+271. [Google Scholar]
  14. Bado, M.F.; Casas, J.R.; Gómez, J. Post-processing algorithms for distributed optical fiber sensing in structural health monitoring applications. Struct. Health Monit. 2021, 20, 661–680. [Google Scholar] [CrossRef]
  15. Fall, M.; Gao, Z.; Ndiaye, B.C. Safety evaluation of existing tunnel nearby driving pile using two different standards. Int. J. Geomech. 2021, 21, 04021014.1–04021014.11. [Google Scholar] [CrossRef]
  16. Zhou, R.; Li, X.; Jiang, W. Scanet: A spatial and channel attention based network for partial-to-partial point cloud registration. Pattern Recognit. Lett. 2021, 151, 120–126. [Google Scholar] [CrossRef]
  17. Rice, J.E.; Cao, N.M.; Tala, T.; Chrystal, C.; Greenwald, M.J.; Hughes, J.W.; Marmar, E.S.; Reinke, M.L.; Fernandez, P.R.; Salmi, A. Dimensionless parameter scaling of intrinsic torque in C-Mod enhanced confinement plasmas. Nucl. Fusion 2021, 61, 026013. [Google Scholar] [CrossRef]
  18. Godard, P.; Loechner, V.; Bastoul, C. Efficient out-of-core and out-of-place rectangular matrix transposition and rotation. IEEE Trans. Comput. 2021, 70, 1942–1948. [Google Scholar] [CrossRef]
  19. Ariza-Lopez, F.J.; Reinoso-Gordo, J.F.; Garcia-Balboa, J.L.; Ariza-Lopez, I.A. Quality specification and control of a point cloud from a TLS survey using ISO 19157 standard. Autom. Constr. 2022, 140, 104353.1–104253.15. [Google Scholar] [CrossRef]
  20. Hao, Z.; Ma, S.; Chen, H.; Liu, J. dataset denoising based on manifold assumption. Math. Probl. Eng. 2021, 2021 Pt 2, 6432929.1–6432929.14. [Google Scholar] [CrossRef]
  21. Chen, Y.F.; Hou, T.Y.; Wang, Y.X. Exponential convergence for multiscale linear elliptic PDEs via adaptive edge basis functions. Multiscale Model. Simul. 2021, 19, 980–1010. [Google Scholar] [CrossRef]
  22. Engin, I.C.; Maerz, N.H. Investigation on the processing of lidar point cloud data for particle size measurement of aggregates as an alternative to image analysis. J. Appl. Remote Sens. 2022, 16, 016511.1–016511.19. [Google Scholar] [CrossRef]
  23. Ghate, N.D.; Shrivastava, A. Numerical and experimental investigation of complex surface topography evolution during laser surface modification with raster scan. J. Manuf. Process. 2021, 69, 368–377. [Google Scholar] [CrossRef]
  24. Duan, R.C. Research on the scheme of line position and engineering countermeasures of tunnel in high altitude and complex strata. J. Railw. Eng. Soc. 2022, 39, 30–35+51. [Google Scholar]
Figure 1. Schematic diagram of the tunnel lining structure.
Applsci 13 09492 g001
Figure 2. Data collection results of inverted arch point cloud in the soft rock tunnel. (a) Upper view point cloud data. (b) Left view point cloud data. (c) Right view point cloud data. (d) Lower view point cloud data.
Applsci 13 09492 g002
Figure 3. Point cloud splicing results.
Applsci 13 09492 g003
Figure 4. Splicing point cloud denoising results.
Applsci 13 09492 g004
Figure 5. Deformation monitoring results of tunnel invert uplift.
Applsci 13 09492 g005
Figure 6. Deformation monitoring results of uplift at different grouting depths.
Applsci 13 09492 g006
Figure 7. Monitoring results of uplift deformation using different methods at a grouting depth of 5 m [6,7].
Applsci 13 09492 g007
Table 1. Three-dimensional coordinate values of public sign points.
Angle of ViewFlag Point NumberX Coordinate/mY Coordinate/mZ Coordinate/m
Upper perspectiveA10.59−3.694.56
A21.74−4.464.05
A32.62−5.953.16
A44.37−6.792.18
A56.99−8.124.77
A69.93−9.223.98
A710.58−9.653.57
A812.99−15.554.18
Left perspectiveB1−4.59−5.722.34
B2−1.23−6.992.89
B3−5.99−5.111.29
B4−3.59−1.280.89
B5−3.87−2.381.49
B6−2.94−1.493.36
B7−6.05−4.384.09
B8−4.95−3.543.97
Right perspectiveC14.635.612.45
C21.346.882.76
C35.885.011.38
C43.461.170.75
C53.752.461.53
C62.831.523.47
C76.044.424.15
C84.823.433.82
Lower perspectiveD10.93−3.540.85
D22.08−4.310.12
D32.96−5.840.36
D44.71−6.640.04
D57.33−7.970.13
D610.27−9.070.26
D710.92−9.580.92
D813.33−15.40.47
Disclaimer/Publisher’s Note: The statements, opinions and data contained in all publications are solely those of the individual author(s) and contributor(s) and not of MDPI and/or the editor(s). MDPI and/or the editor(s) disclaim responsibility for any injury to people or property resulting from any ideas, methods, instructions or products referred to in the content.

